
The Use of Population Pharmacokinetics to Extrapolate Food Effects from Human Adults and Beagle Dogs to the Pediatric Population Illustrated with Paracetamol as a Test Case


Abstract
:1. Introduction
2. Results
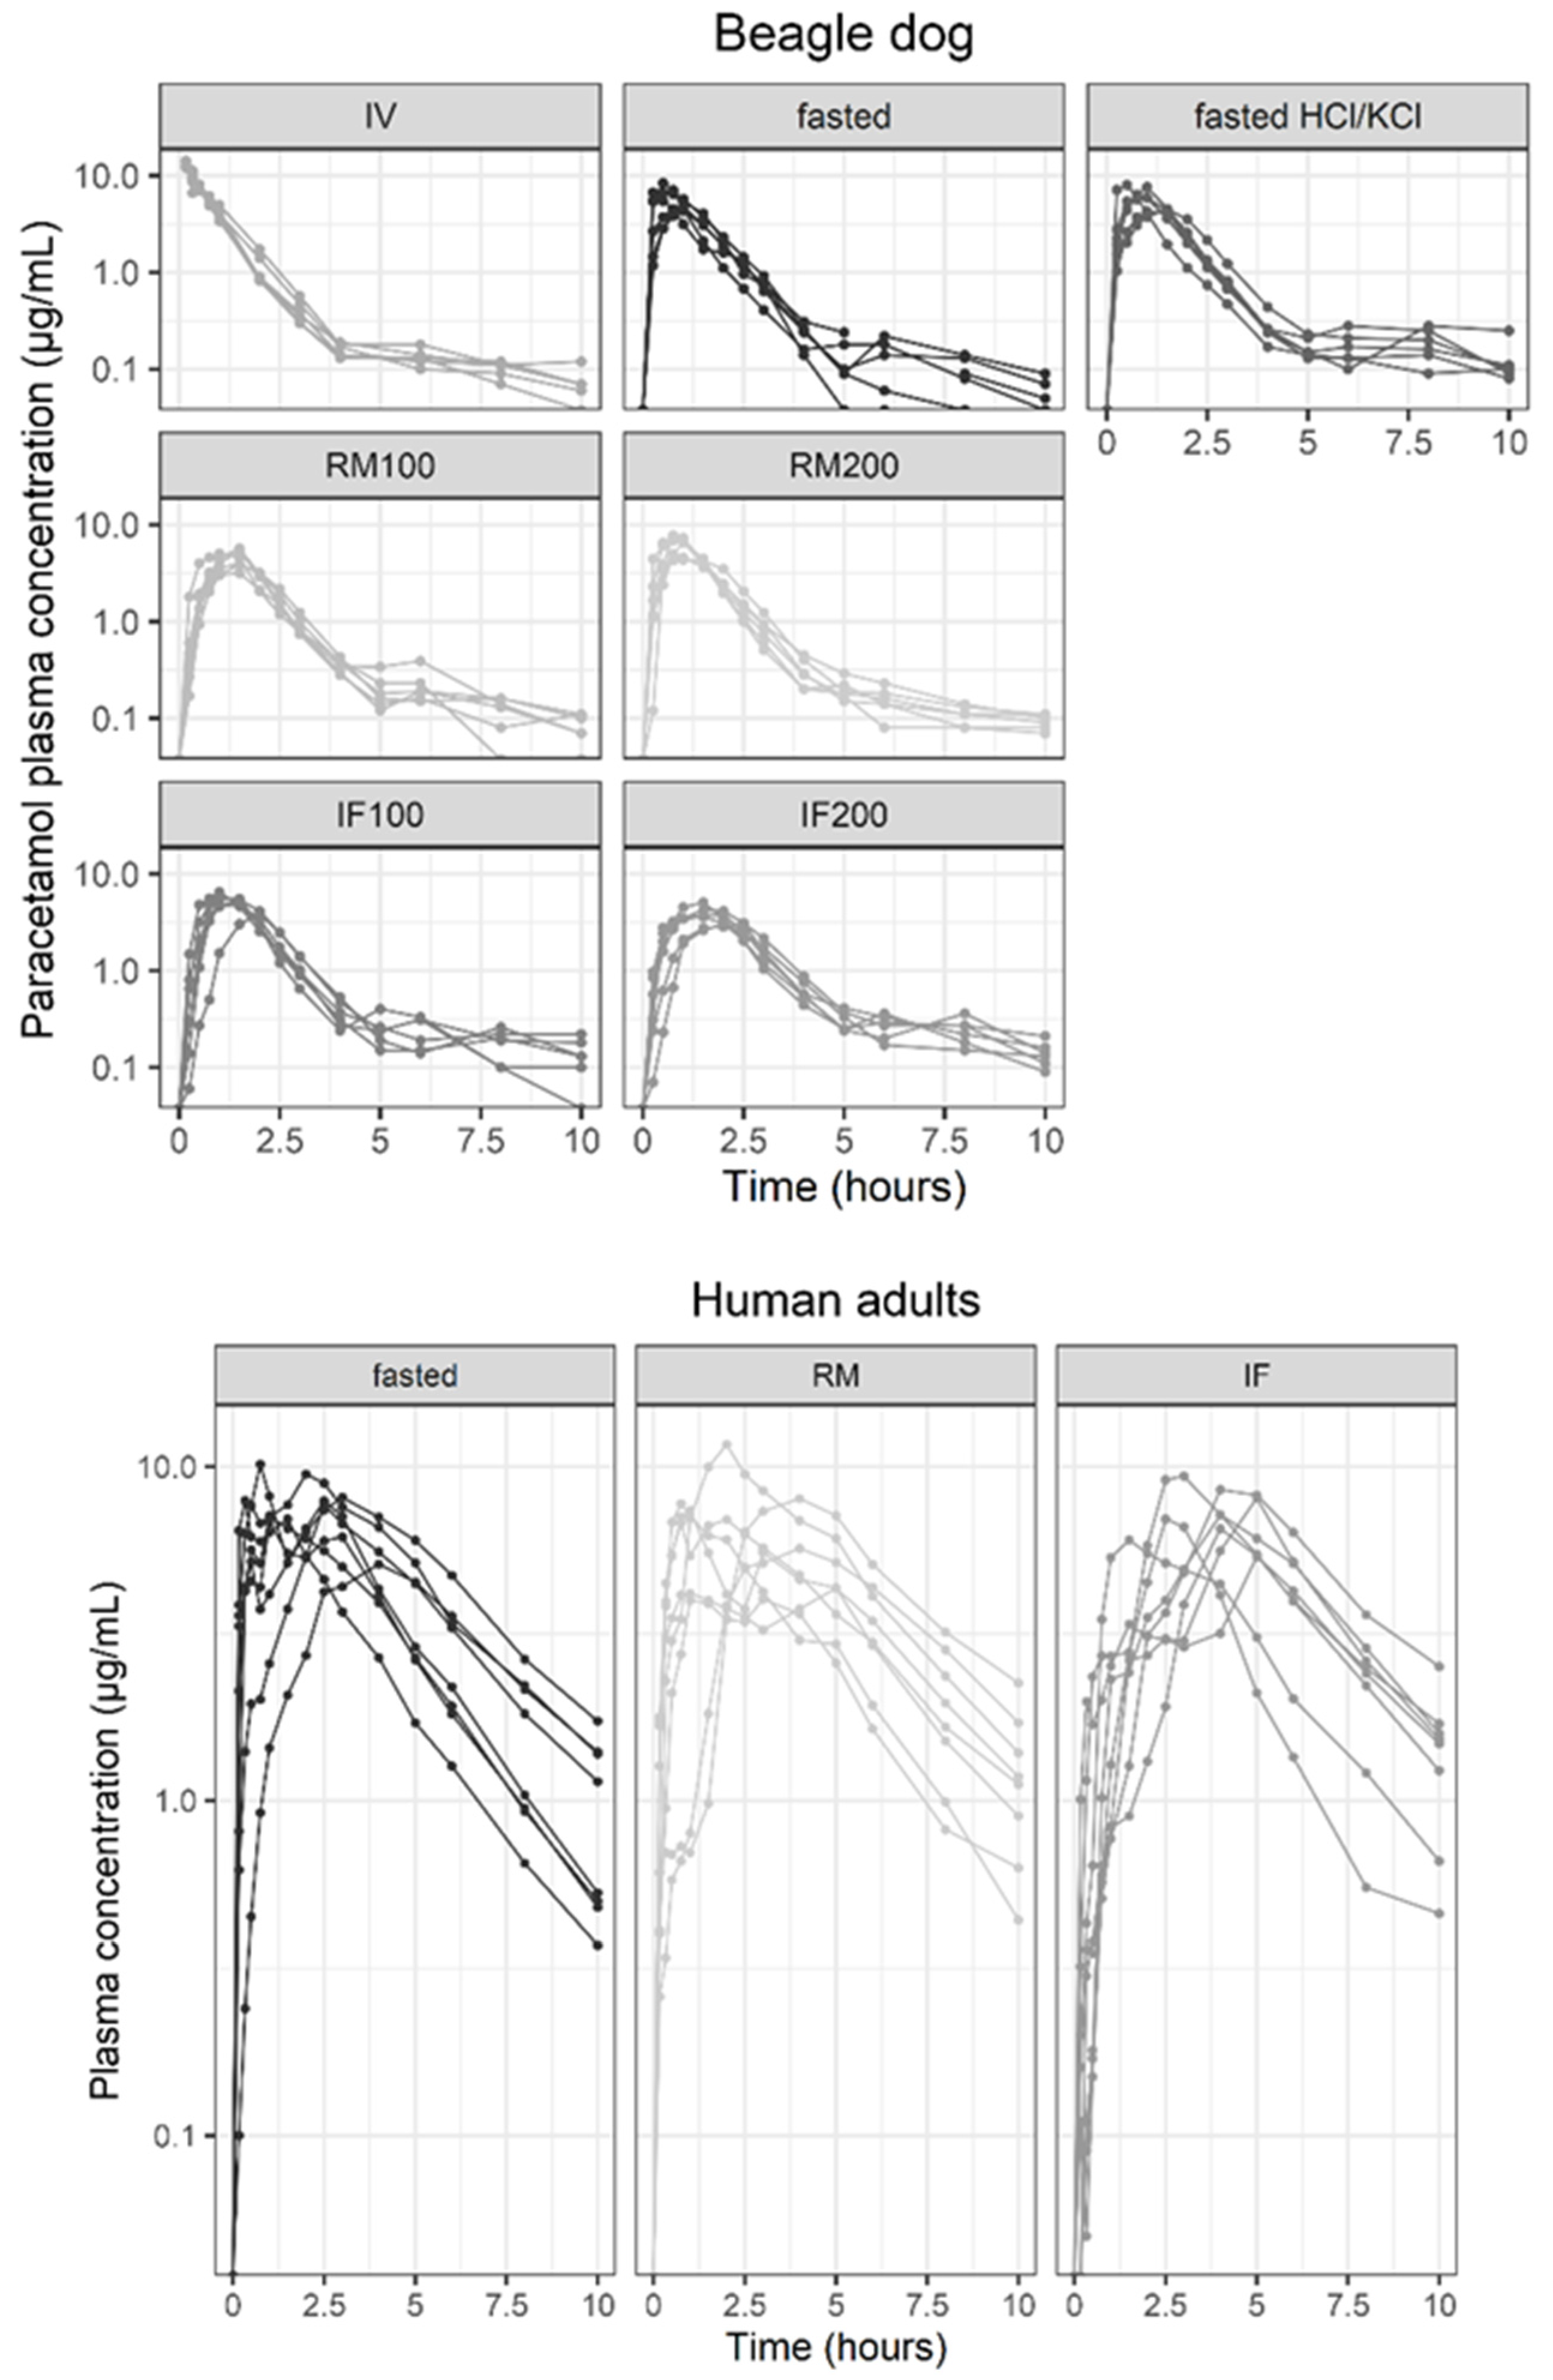
2.1. Study Data, Model Development and Evaluation
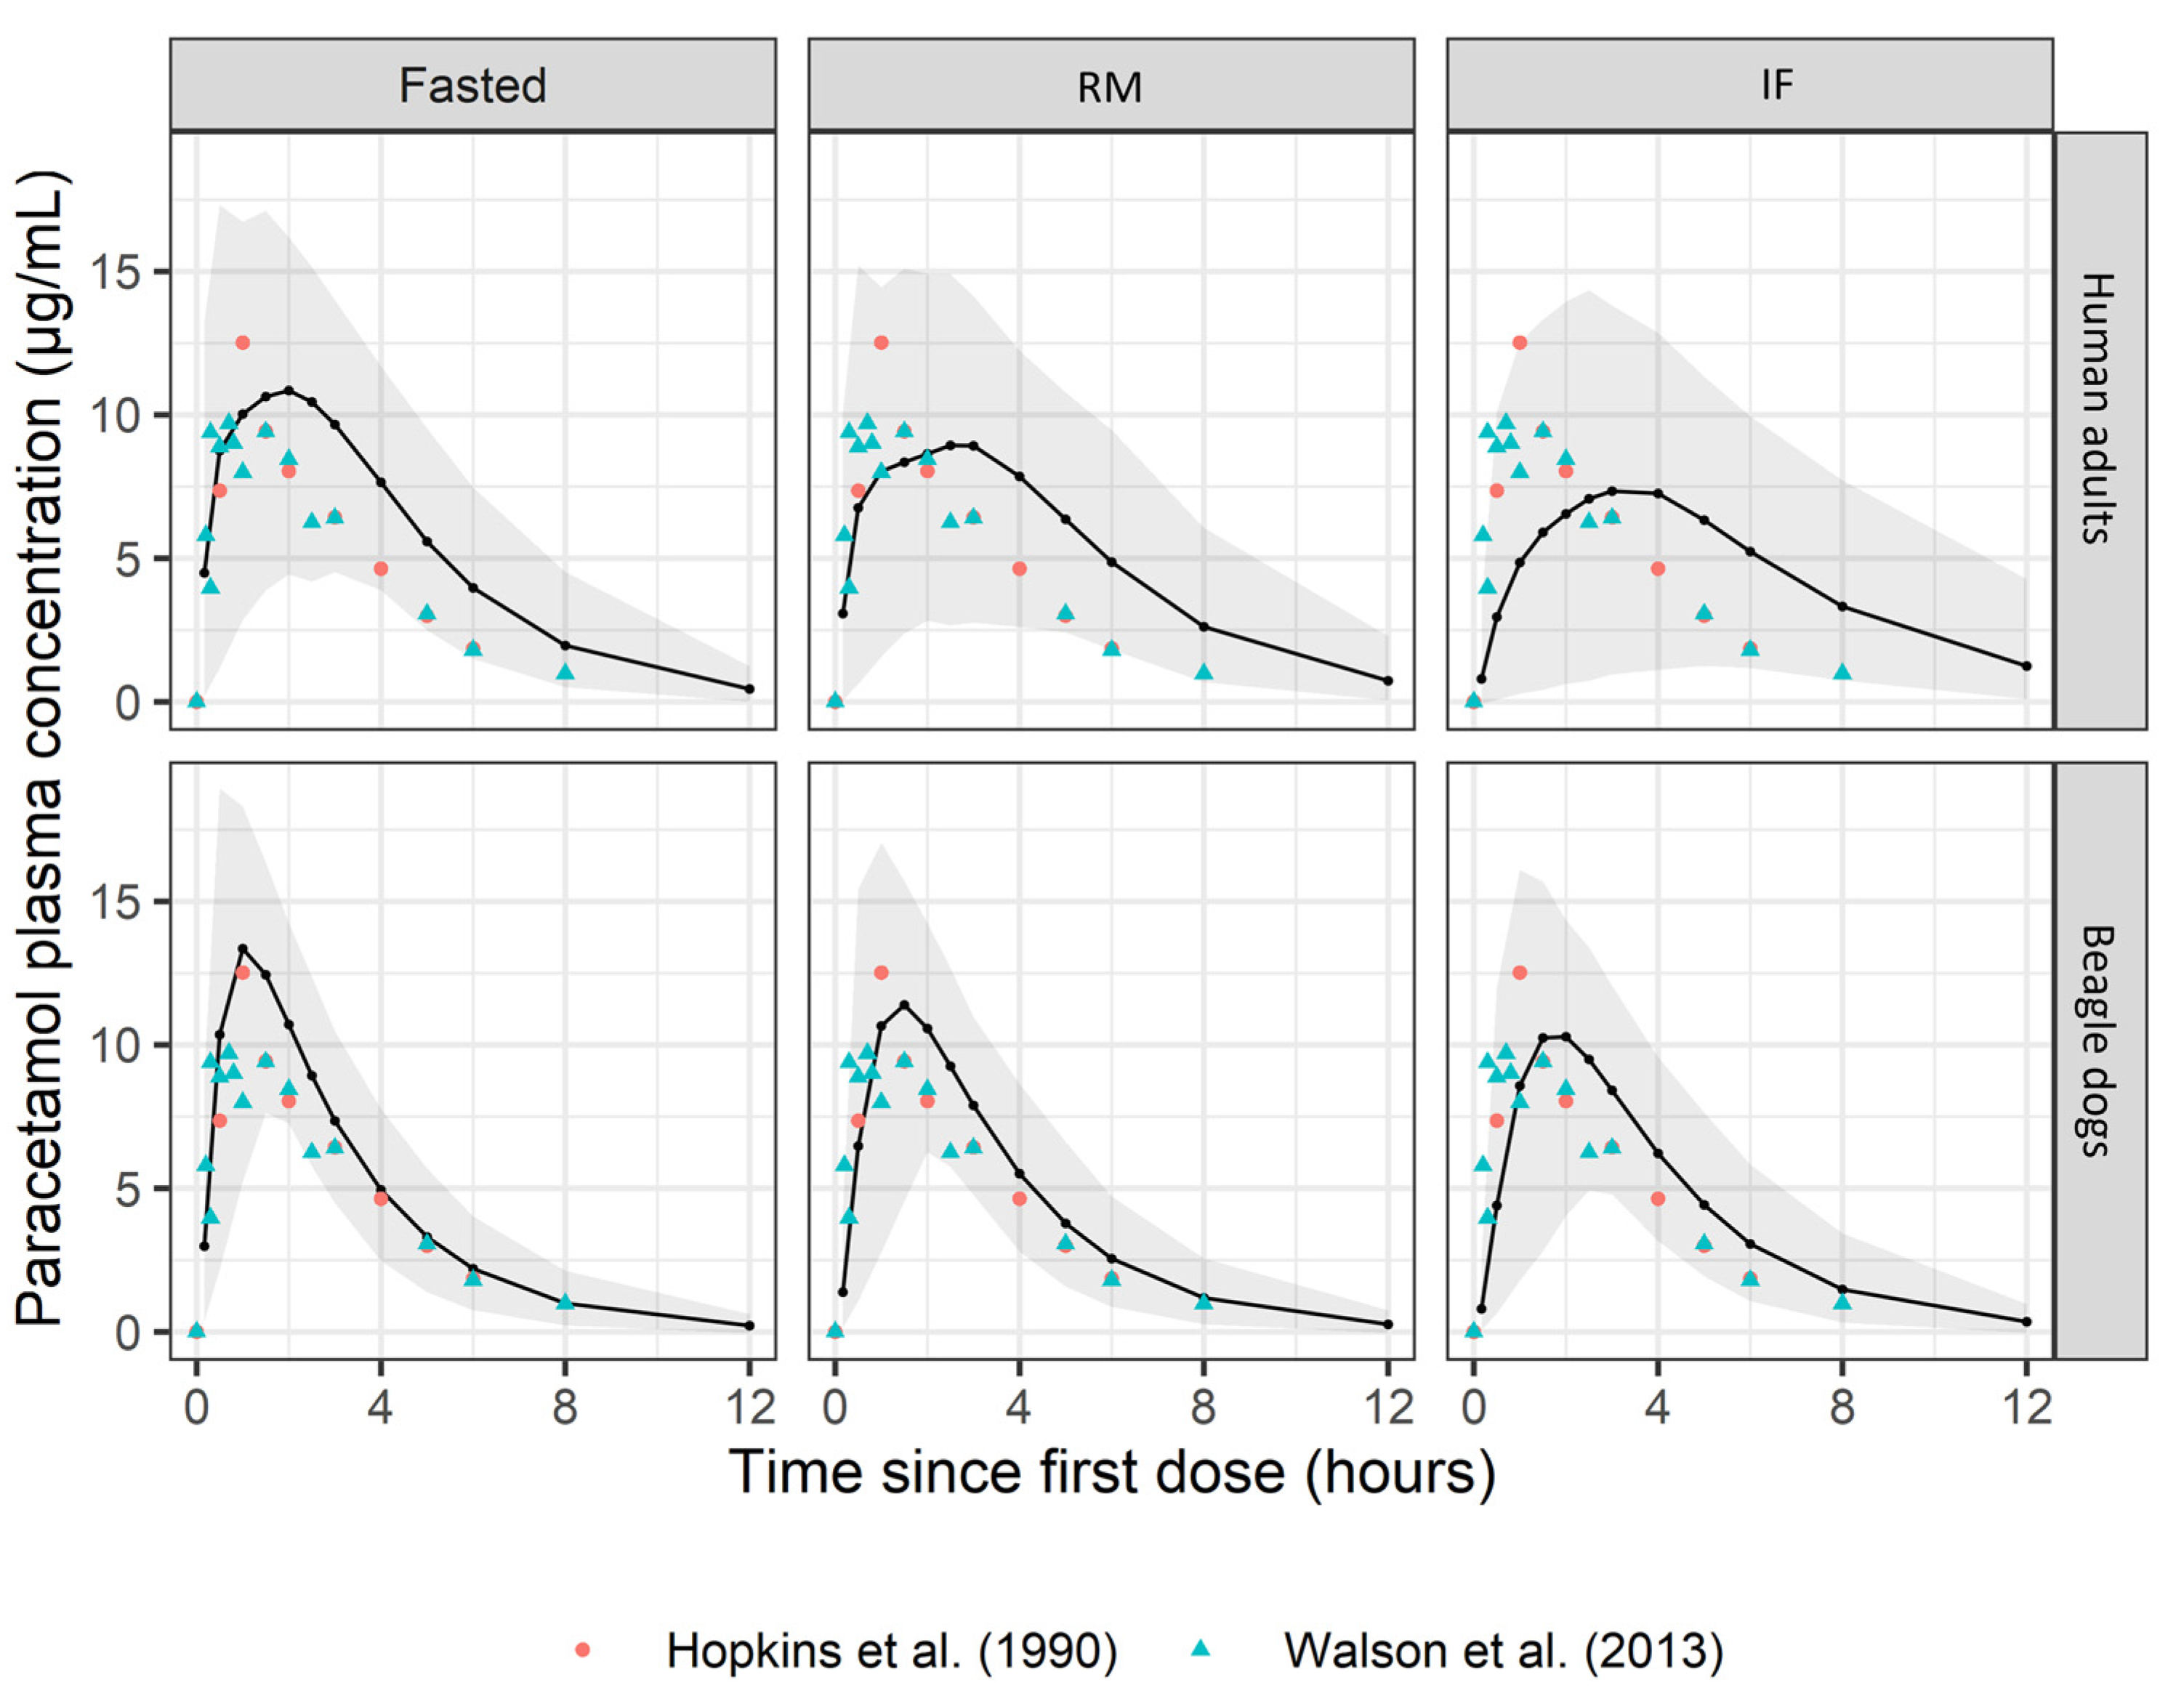
2.2. Simulations
3. Discussion
4. Materials and Methods
4.1. Study Data
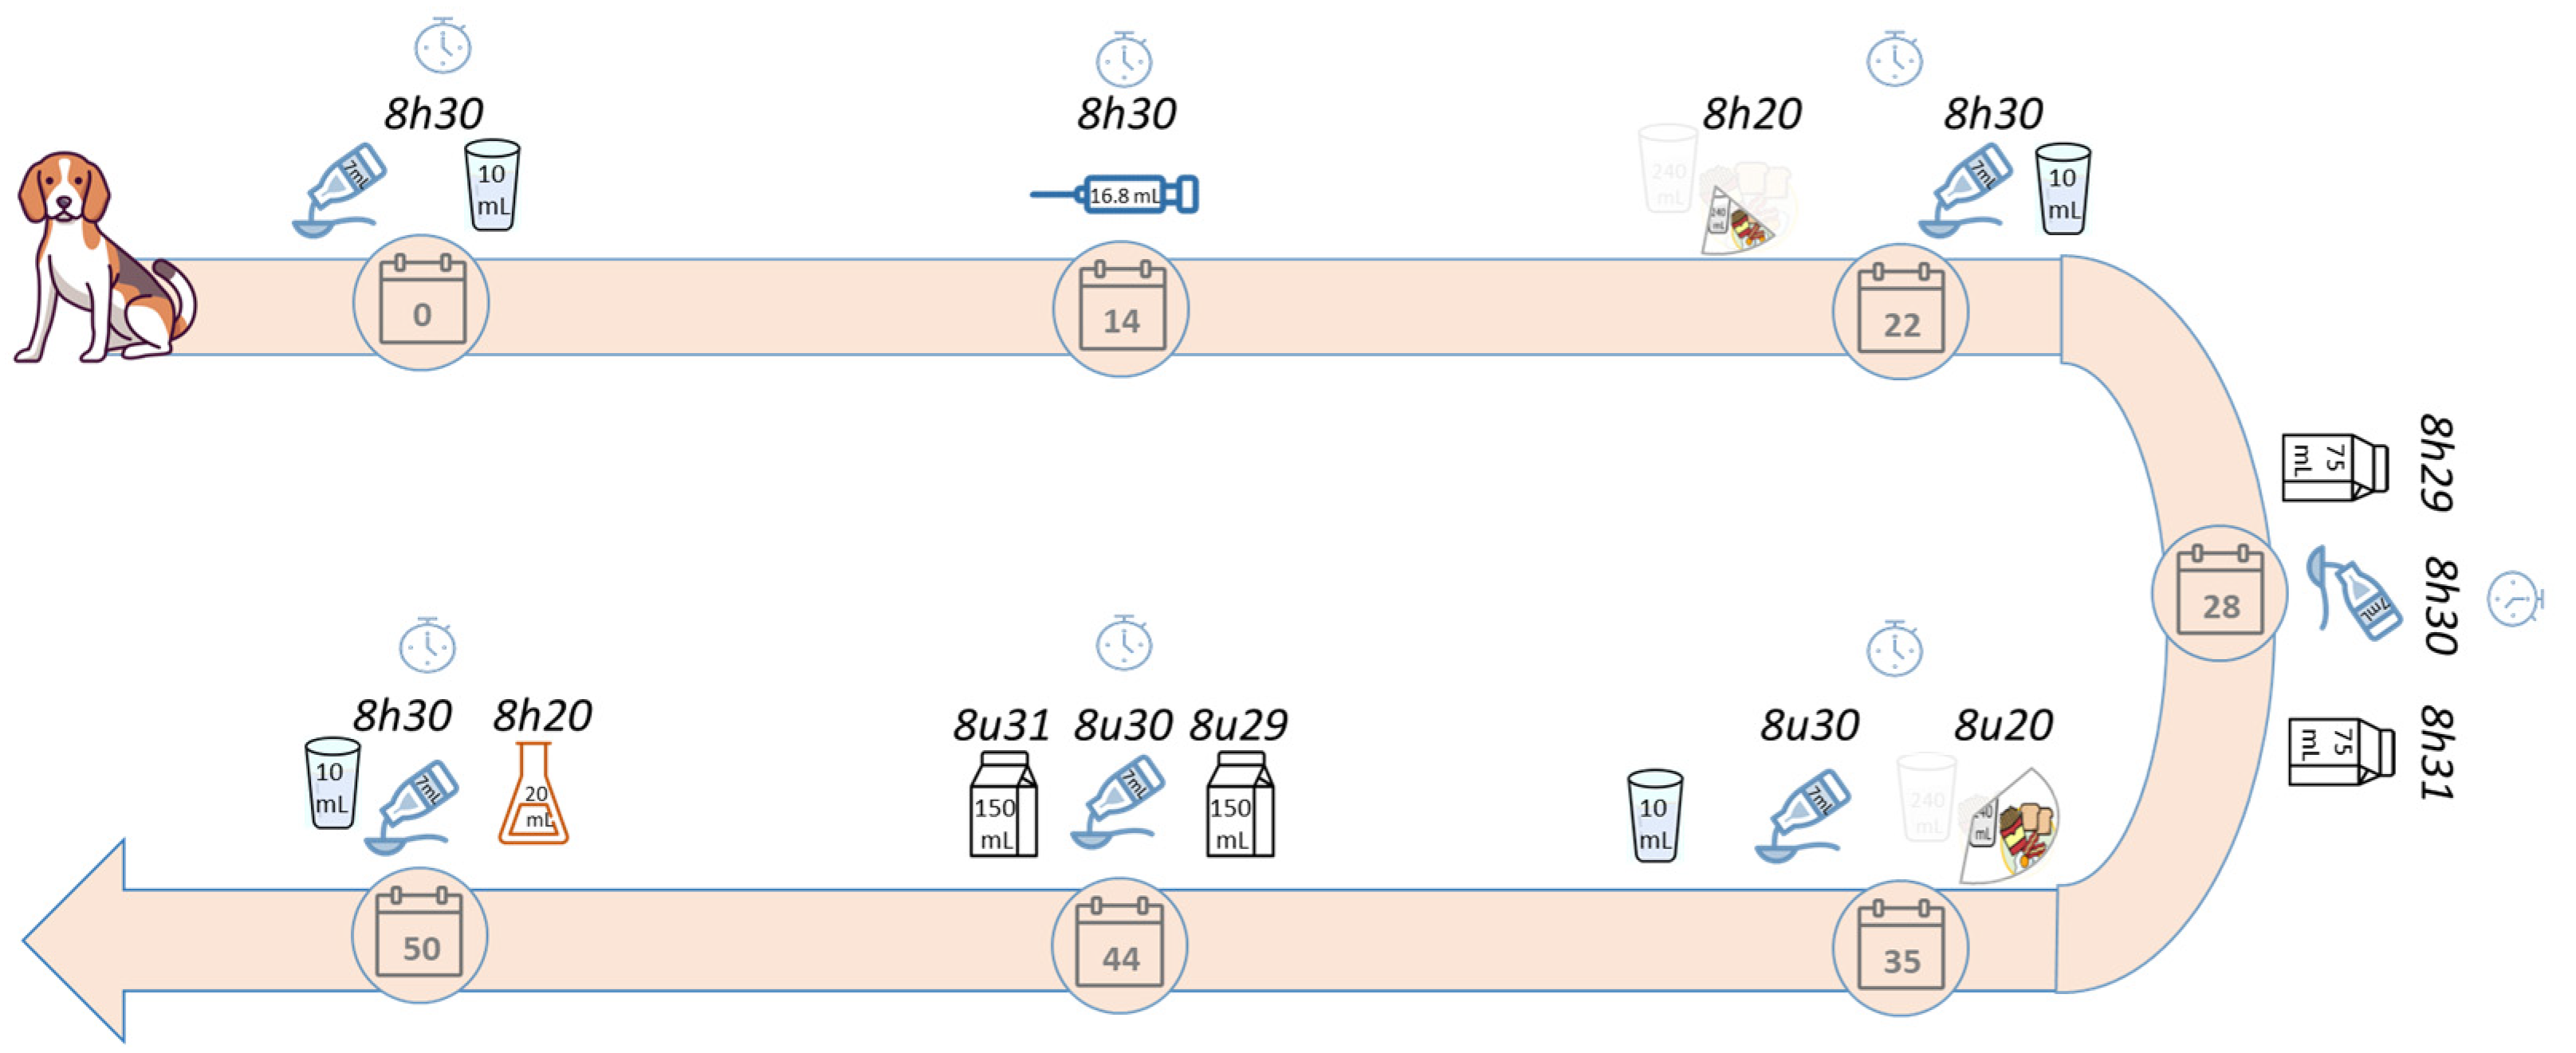
4.1.1. Beagle Dog
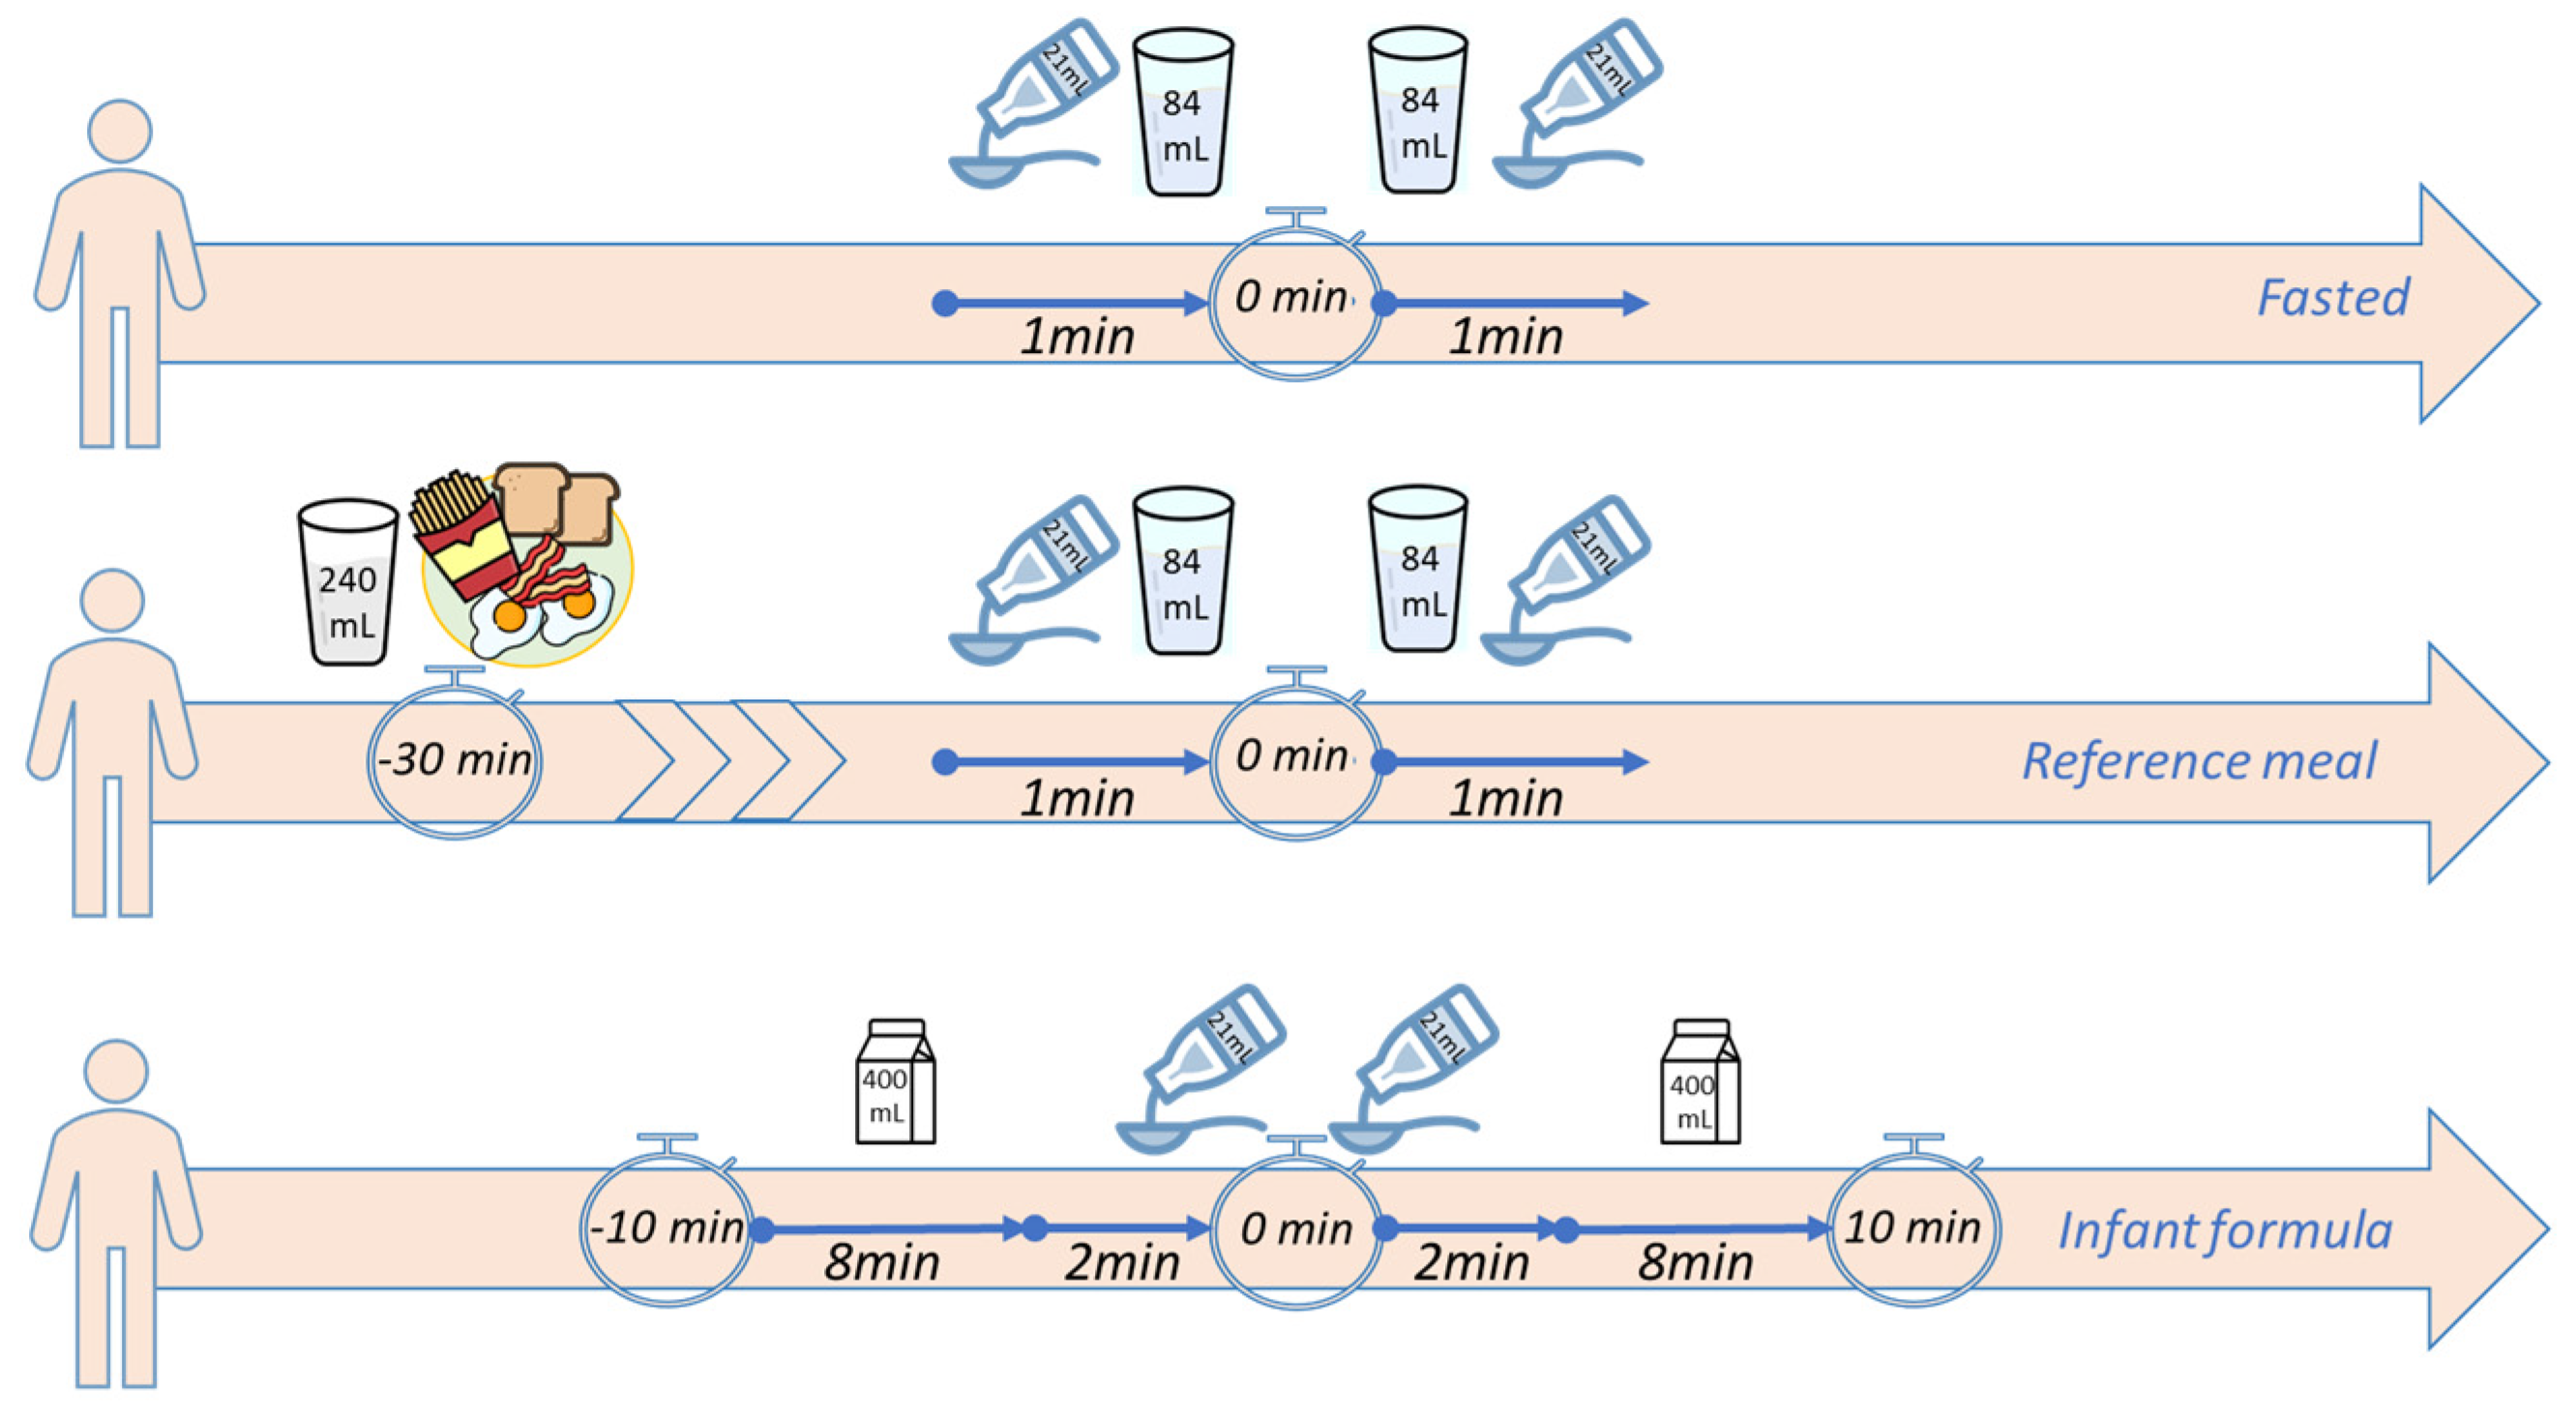
4.1.2. Human Adults Study
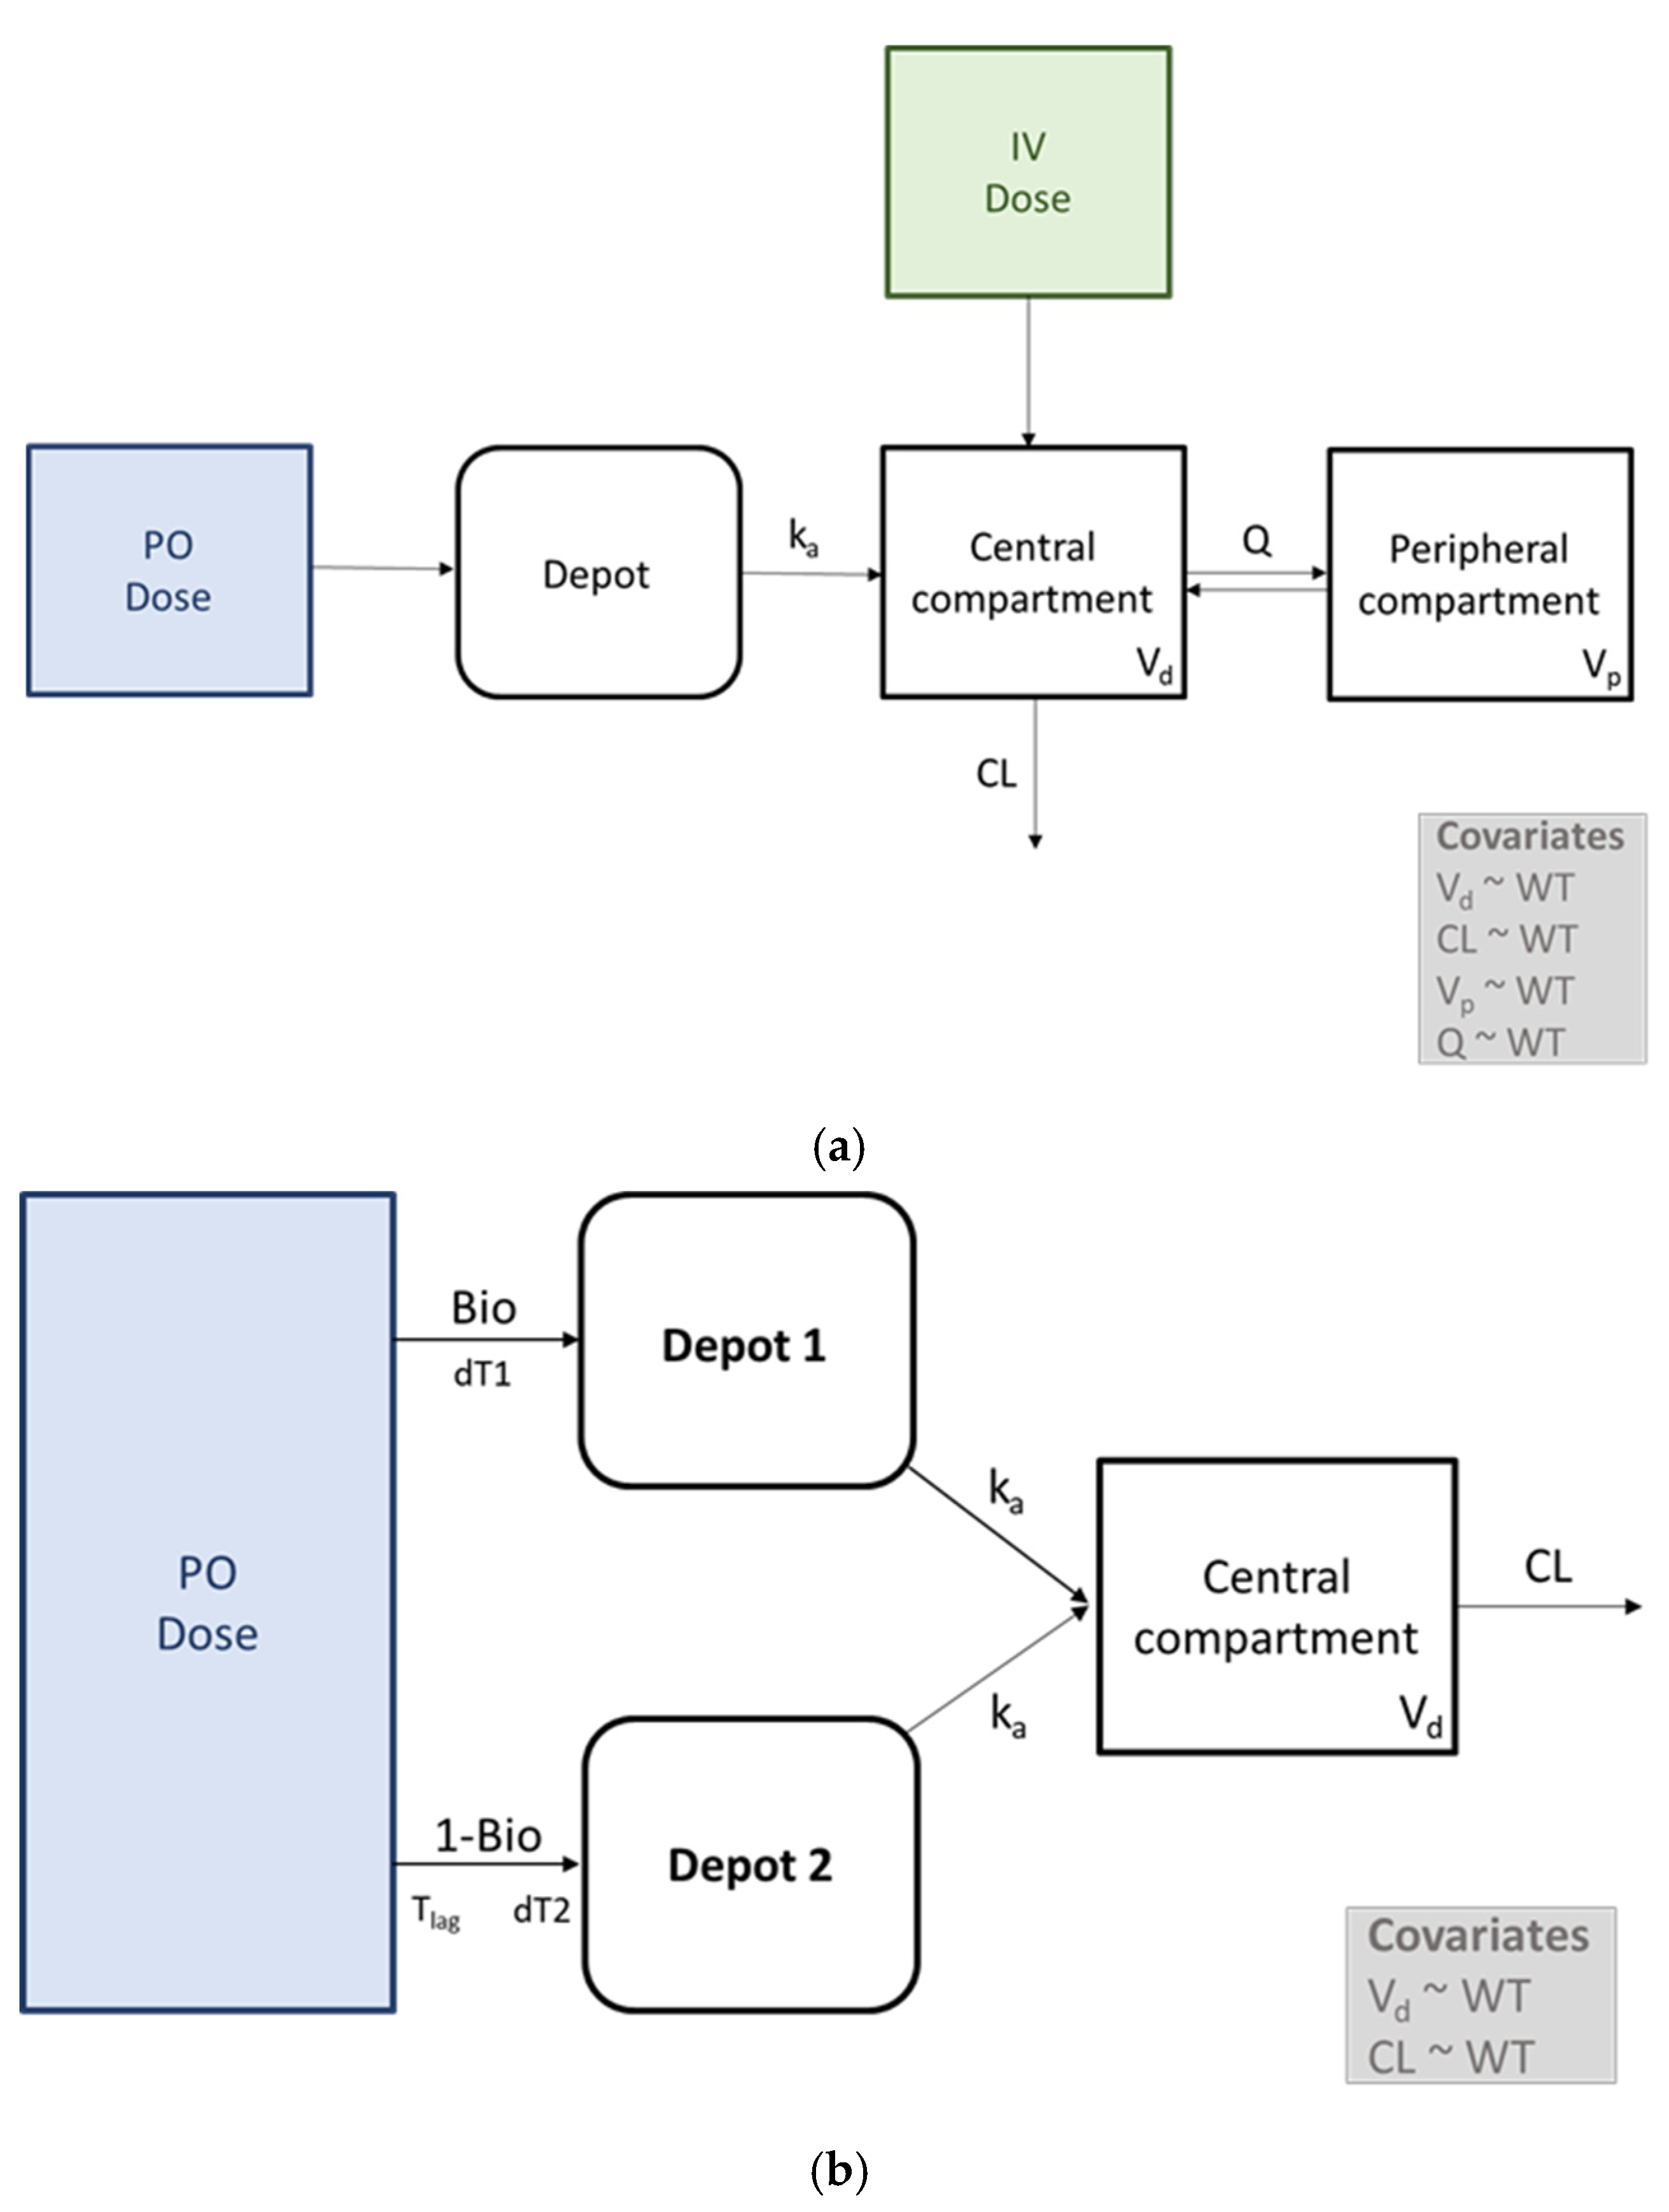
4.2. Model Development
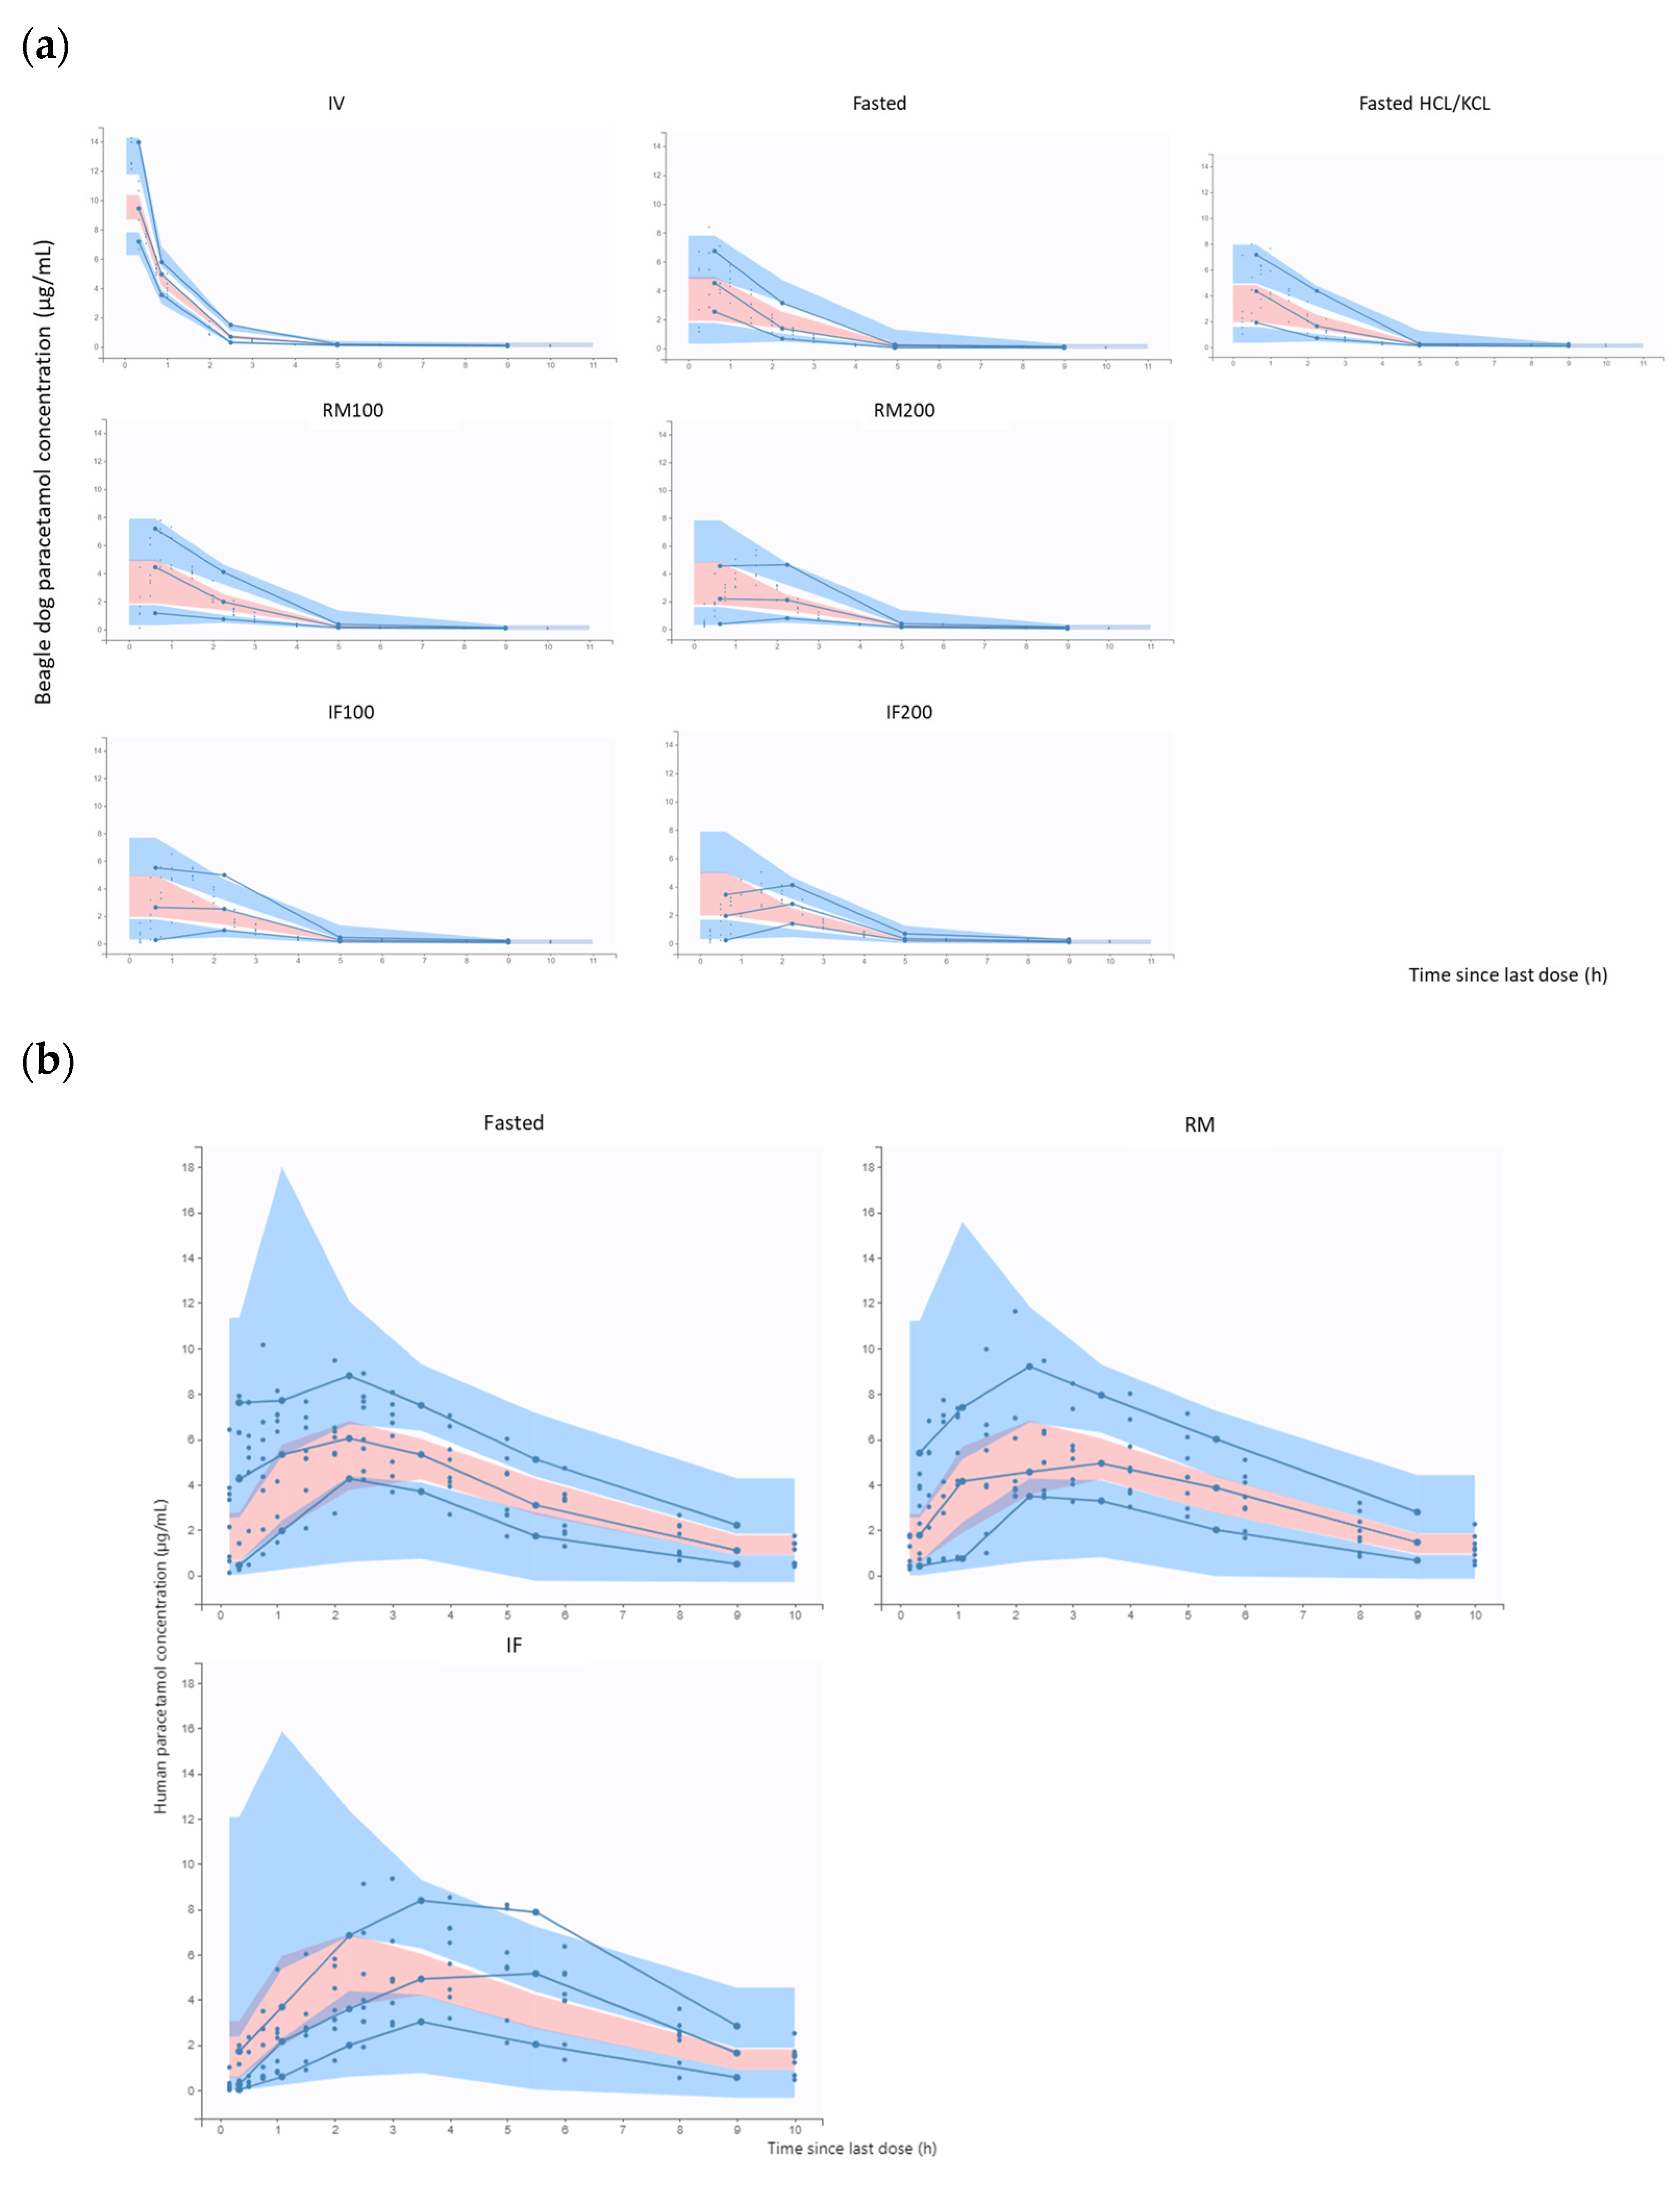
4.3. Model Evaluation
4.4. Simulations
4.5. Software
5. Conclusions
Supplementary Materials
Author Contributions
Funding
Institutional Review Board Statement
Informed Consent Statement
Data Availability Statement
Acknowledgments
Conflicts of Interest
References
- van Riet-Nales, D.A.; Ferreira, J.A.; Schobben, A.F.A.M.; de Neef, B.J.; Egberts, T.C.G.; Rademaker, C.M.A. Methods of Administering Oral Formulations and Child Acceptability. Int. J. Pharm. 2015, 491, 261–267. [Google Scholar] [CrossRef] [PubMed]
- Blume, J.; Ruano, A.L.; Wang, S.; Jackson, D.J.; Tylleskär, T.; Strand, L.I. Oral Medicine Acceptance in Infants and Toddlers: Measurement Properties of the Caregiver-Administered Children’s Acceptance Tool (CareCAT). BMC Pediatr. 2018, 18, 117. [Google Scholar] [CrossRef] [PubMed]
- Batchelor, H.; Kaukonen, A.M.; Klein, S.; Davit, B.; Ju, R.; Ternik, R.; Heimbach, T.; Lin, W.; Wang, J.; Storey, D. Food Effects in Paediatric Medicines Development for Products Co-Administered with Food. Int. J. Pharm. 2018, 536, 530–535. [Google Scholar] [CrossRef] [PubMed]
- FDA. Assessing the Effects of Food on Drugs in INDs and NDAs—Clinical Pharmacology Considerations. Clinical Pharmacology. 2022. Available online: https://www.fda.gov/regulatory-information/search-fda-guidance-documents/assessing-effects-food-drugs-inds-and-ndas-clinical-pharmacology-considerations (accessed on 17 December 2023).
- EMA. Guideline on the Investigation of Drug Interactions. 2012. Available online: https://www.ema.europa.eu/en/documents/scientific-guideline/guideline-investigation-drug-interactions-revision-1_en.pdf (accessed on 17 December 2023).
- Prescott, L.F. Paracetamol: Past, Present, and Future. Am. J. Ther. 2000, 7, 143–147. [Google Scholar] [CrossRef] [PubMed]
- Przybyła, G.W.; Szychowski, K.A.; Gmiński, J. Paracetamol—An Old Drug with New Mechanisms of Action. Clin. Exp. Pharmacol. Physiol. 2021, 48, 3–19. [Google Scholar] [CrossRef] [PubMed]
- Kalantzi, L.; Reppas, C.; Dressman, J.B.; Amidon, G.L.; Junginger, H.E.; Midha, K.K.; Shah, V.P.; Stavchansky, S.A.; Barends, D.M. Biowaiver Monographs for Immediate Release Solid Oral Dosage Forms: Acetaminophen (Paracetamol). J. Pharm. Sci. 2006, 95, 4–14. [Google Scholar] [CrossRef] [PubMed]
- EMA. Paracetamol Oral Use Immediate Release Formulations Product-Specific Bioequivalence Guidance. 2022. Available online: https://www.ema.europa.eu/en/documents/scientific-guideline/paracetamol-oral-use-immediate-release-formulations-product-specific-bioequivalence-guidance-revision-1_en.pdf (accessed on 17 December 2023).
- Moore, R.A.; Derry, S.; Wiffen, P.J.; Straube, S. Effects of Food on Pharmacokinetics of Immediate Release Oral Formulations of Aspirin, Dipyrone, Paracetamol and NSAIDs—A Systematic Review. Br. J. Clin. Pharmacol. 2015, 80, 381–388. [Google Scholar] [CrossRef] [PubMed]
- Atkinson, H.C.; Stanescu, I.; Beasley, C.P.; Salem, I.I.; Frampton, C. A Pharmacokinetic Analysis of a Novel Fixed Dose Oral Combination of Paracetamol and Ibuprofen, with Emphasis on Food Effect. J. Bioequiv. Bioavailab. 2015, 7, 150. [Google Scholar] [CrossRef]
- Stillings, M.; Havlik, I.; Chetty, M.; Clinton, C.; Schall, R.; Moodley, I.; Muir, N.; Little, S. Comparison of the Pharmacokinetic Profiles of Soluble Aspirin and Solid Paracetamol Tablets in Fed and Fasted Volunteers. Curr. Med. Res. Opin. 2000, 16, 115–124. [Google Scholar] [CrossRef]
- Bartholomé, R.; Salden, B.; Vrolijk, M.F.; Troost, F.J.; Masclee, A.; Bast, A.; Haenen, G.R. Paracetamol as a Post Prandial Marker for Gastric Emptying, A Food-Drug Interaction on Absorption. PLoS ONE 2015, 10, e0136618. [Google Scholar] [CrossRef]
- Statelova, M.; Holm, R.; Fotaki, N.; Reppas, C.; Vertzoni, M. Usefulness of the Beagle Model in the Evaluation of Paracetamol and Ibuprofen Exposure after Oral Administration to Pediatric Populations: An Exploratory Study. Mol. Pharm. 2023, 20, 2836–2852. [Google Scholar] [CrossRef]
- Statelova, M.; Holm, R.; Fotaki, N.; Reppas, C.; Vertzoni, M. Successful Extrapolation of Paracetamol Exposure from Adults to Infants After Oral Administration of a Pediatric Aqueous Suspension Is Highly Dependent on the Study Dosing Conditions. AAPS J. 2020, 22, 126. [Google Scholar] [CrossRef] [PubMed]
- Statelova, M.; Goumas, K.; Fotaki, N.; Holm, R.; Symillides, M.; Reppas, C.; Vertzoni, M. On the Design of Food Effect Studies in Adults for Extrapolating Oral Drug Absorption Data to Infants: An Exploratory Study Highlighting the Importance of Infant Food. AAPS J. 2019, 22, 6. [Google Scholar] [CrossRef] [PubMed]
- Lentz, K.A.; Quitko, M.; Morgan, D.G.; Grace, J.E.; Gleason, C.; Marathe, P.H. Development and Validation of a Preclinical Food Effect Model. J. Pharm. Sci. 2007, 96, 459–472. [Google Scholar] [CrossRef] [PubMed]
- Hopkins, C.S.; Underhill, S.; Booker, P.D. Pharmacokinetics of Paracetamol after Cardiac Surgery. Arch. Dis. Child. 1990, 65, 971–976. [Google Scholar] [CrossRef] [PubMed]
- Walson, P.D.; Halvorsen, M.; Edge, J.; Casavant, M.J.; Kelley, M.T. Pharmacokinetic Comparison of Acetaminophen Elixir versus Suppositories in Vaccinated Infants (Aged 3 to 36 Months): A Single-Dose, Open-Label, Randomized, Parallel-Group Design. Clin. Ther. 2013, 35, 135–140. [Google Scholar] [CrossRef] [PubMed]
- Wang, C.; Allegaert, K.; Tibboel, D.; Danhof, M.; van der Marel, C.D.; Mathot, R.A.A.; Knibbe, C.A.J. Population Pharmacokinetics of Paracetamol across the Human Age-Range from (Pre)Term Neonates, Infants, Children to Adults. J. Clin. Pharmacol. 2014, 54, 619–629. [Google Scholar] [CrossRef]
- Cook, S.F.; Roberts, J.K.; Samiee-Zafarghandy, S.; Stockmann, C.; King, A.D.; Deutsch, N.; Williams, E.F.; Allegaert, K.; Wilkins, D.G.; Sherwin, C.M.T.; et al. Population Pharmacokinetics of Intravenous Paracetamol (Acetaminophen) in Preterm and Term Neonates: Model Development and External Evaluation. Clin Pharmacokinet. 2016, 55, 107–119. [Google Scholar] [CrossRef]
- van der Heijden, L.T.; Mian, P.; Hias, J.; de Winter, B.C.M.; Tournoy, J.; Van der Linden, L.; Tibboel, D.; Walgraeve, K.; Flamaing, J.; Koch, B.C.P.; et al. Highly Variable Paracetamol Pharmacokinetics After Multiple Oral Dosing in Frail Older People: A Population Pharmacokinetic Analysis. Drugs Aging 2022, 39, 83–95. [Google Scholar] [CrossRef]
- Allegaert, K.; Peeters, M.Y.; Beleyn, B.; Smits, A.; Kulo, A.; van Calsteren, K.; Deprest, J.; de Hoon, J.; Knibbe, C.A.J. Paracetamol Pharmacokinetics and Metabolism in Young Women. BMC Anesthesiol. 2015, 15, 163. [Google Scholar] [CrossRef]
- Anderson, B.J.; Woollard, G.A.; Holford, N.H.G. A Model for Size and Age Changes in the Pharmacokinetics of Paracetamol in Neonates, Infants and Children. Br. J. Clin. Pharmacol. 2000, 50, 125–134. [Google Scholar] [CrossRef] [PubMed]
- Anderson, B.J.; van Lingen, R.A.; Hansen, T.G.; Lin, Y.-C.; Holford, N.H.G. Acetaminophen Developmental Pharmacokinetics in Premature Neonates and Infants: A Pooled Population Analysis. Anesthesiology 2002, 96, 1336–1345. [Google Scholar] [CrossRef] [PubMed]
- Davies, N.M.; Takemoto, J.K.; Brocks, D.R.; Yáñez, J.A. Multiple Peaking Phenomena in Pharmacokinetic Disposition. Clin. Pharmacokinet. 2010, 49, 351–377. [Google Scholar] [CrossRef] [PubMed]
- Grimm, M.; Scholz, E.; Koziolek, M.; Kühn, J.-P.; Weitschies, W. Gastric Water Emptying under Fed State Clinical Trial Conditions Is as Fast as under Fasted Conditions. Mol. Pharm. 2017, 14, 4262–4271. [Google Scholar] [CrossRef] [PubMed]
- Schick, P.; Sager, M.; Voelker, M.; Weitschies, W.; Koziolek, M. Application of the GastroDuo to Study the Interplay of Drug Release and Gastric Emptying in Case of Immediate Release Aspirin Formulations. Eur. J. Pharm. Biopharm. 2020, 151, 9–17. [Google Scholar] [CrossRef]
- Gasthuys, E.; Vandecasteele, T.; De Bruyne, P.; Walle, J.V.; De Backer, P.; Cornillie, P.; Devreese, M.; Croubels, S. The Potential Use of Piglets as Human Pediatric Surrogate for Preclinical Pharmacokinetic and Pharmacodynamic Drug Testing. Curr. Pharm. Des. 2016, 22, 4069–4085. [Google Scholar] [CrossRef]
- Ayuso, M.; Buyssens, L.; Stroe, M.; Valenzuela, A.; Allegaert, K.; Smits, A.; Annaert, P.; Mulder, A.; Carpentier, S.; Van Ginneken, C.; et al. The Neonatal and Juvenile Pig in Pediatric Drug Discovery and Development. Pharmaceutics 2020, 13, 44. [Google Scholar] [CrossRef]
- Kornegay, J.N. The Golden Retriever Model of Duchenne Muscular Dystrophy. Skelet. Muscle 2017, 7, 9. [Google Scholar] [CrossRef]
- Leconte, I.; Bailey, G.; Davis-Bruno, K.; Hew, K.W.; Kim, J.; Silva Lima, B.; Liminga, U.; Moffit, J.; De Schaepdrijver, L.; Schmitt, G.; et al. Value of Juvenile Animal Studies. Birth Defects Res B Dev. Reprod. Toxicol. 2011, 92, 292–303. [Google Scholar] [CrossRef]
- Wu, Y.; Loper, A.; Landis, E.; Hettrick, L.; Novak, L.; Lynn, K.; Chen, C.; Thompson, K.; Higgins, R.; Batra, U.; et al. The Role of Biopharmaceutics in the Development of a Clinical Nanoparticle Formulation of MK-0869: A Beagle Dog Model Predicts Improved Bioavailability and Diminished Food Effect on Absorption in Human. Int. J. Pharm. 2004, 285, 135–146. [Google Scholar] [CrossRef]
- Sjödin, L.; Visser, S.; Al-Saffar, A. Using Pharmacokinetic Modeling to Determine the Effect of Drug and Food on Gastrointestinal Transit in Dogs. J. Pharmacol. Toxicol. Methods 2011, 64, 42–52. [Google Scholar] [CrossRef] [PubMed]
- European Parliament and of the Council of European Union Directive 2010/63/EU of the European Parliament and of the Council of 22 September 2010 on the Protection of Animals Used for Scientific Purposes (Text with EEA Relevance). Available online: https://www.legislation.gov.uk/eudr/2010/63/contents (accessed on 30 November 2023).
- Belgium Koninklijk Besluit Betreffende de Bescherming van Proefdieren. Available online: https://codex.vlaanderen.be/PrintDocument.ashx?id=1028066&datum=&geannoteerd=false&print=false (accessed on 30 November 2023).


| AUC0-inf (µg·h/mL) | Cmax (µg/mL) | Tmax (h) a | |
|---|---|---|---|
| Fasted | 9.86 ± 1.19 1 | 6.07 ± 1.46 5,6 | 0.63 [0.25–1.00] 13,14,15 |
| Fasted HCl/KCl | 11.4 ± 1.06 2 | 6.11 ± 1.55 7,8 | 1.00 [0.50–1.50] 16,17,18 |
| RM100 | 11.6 ± 1.23 1,3 | 6.21 ± 1.42 9,11 | 0.88 [0.75–1.00] 19,21,22 |
| RM200 | 9.86 ± 1.16 2,3,4 | 4.50 ± 0.99 5,7,9,10 | 1.50 [1.00–1.50] 13,16,19,20 |
| IF100 | 16.2 ± 7.15 | 5.18 ± 0.86 12 | 1.50 [1.00–2.00] 14,17,21 |
| IF200 | 11.3 ± 1.49 4 | 3.79 ± 0.76 6,8,10,11,12 | 1.75 [1.50–2.50] 15,18,20,22 |
| AUC0-inf (µg·h/mL) | Cmax (µg/mL) | Tmax (h) a | |
|---|---|---|---|
| Fasted | 39.3 ± 9.53 | 7.85 ± 1.54 | 1.50 [0.33–4.00] 1 |
| Reference meal | 40.2 ± 10.7 | 6.96 ± 2.42 | 2.50 [0.75–5.00] |
| Infant formula | 39.2 ± 10.1 | 7.24 ± 1.32 | 4.00 [1.50–5.00] 1 |
| Parameter | Estimate Beagle Dogs [RSE%] | Estimate Human Adults [RSE%] |
|---|---|---|
| Structural model | ||
| F | 0.80 [2.56] | - |
| Bio | - | 0.45 [27.5] |
| ka (h−1) | 2.86 [14.2] | 1.79 [38.1] |
| Vd (L) | 9.53 [1.55] | 27.6 [2.42] * |
| CL (L/h) | 9.29 [1.92] | 8.79 [1.99] * |
| Vp (L) | 34.9 [4.56] | - |
| Q (L/h) | 2.82 [0.835] | - |
| dT1 (h) | 0.64 [16.1] | 0.22 [39.2] |
| dT2 (h) | - | 2.73 [34.2] |
| T2 (h) | - | 0.97 [31.8] |
| Covariate model | ||
| βWTonCL | 0.75 [FIX] | 0.75 [FIX] * |
| βWTonVd | 1 [FIX] | 1 [FIX] * |
| βWTonVp | 1 [FIX] | - |
| βWTonQ | 1 [FIX] | - |
| Between-subjects variability | ||
| BSV Vd | - | 0.098 [39.9] * |
| BSV CL | - | 0.13 [26.0] * |
| Inter occasion variability | ||
| IOV F | 0.11 [14.3] | - |
| IOV Bio | - | 0.69 [20.7] |
| IOV ka | 0.63 [18.0] | 0.53 [56.4] |
| IOV dT1 | 0.86 [15.2] | 1.58 [25.9] |
| IOV dT2 | - | 0.87 [22.0] |
| IOV T2 | - | 0.59 [38.3] |
| Error model parameters *1 | ||
| a | 0.055 [9.30] | 0.094 [23.9] |
| b | 0.13 [7.13] | 0.094 [11.2] |
| Log-likelihood estimation | ||
| −2LL | 135.01 | 659.71 |
| AIC | 159.01 | 691.71 |
| BIC | 179.86 | 710.56 |
| Variable | Value |
|---|---|
| No. of healthy volunteers | 8 * |
| Age, years (median [min–max]) | 25 [21–48] |
| BMI, kg/m2 (median [min–max]) | 23.8 [20.3–27.7] |
| Height, m (median [min–max]) | 1.85 [1.69–1.92] |
| Body weight, kg (median [min–max]) | 81.5 [60–104] |
| Sex | Male |
| Race | Caucasian |
| Dose, mg | 1000 (42 mL Panadol® suspension, 24 mg/mL paracetamol) |
| PK samples | 15 |
| PK sampling times | 0–10 h |
Disclaimer/Publisher’s Note: The statements, opinions and data contained in all publications are solely those of the individual author(s) and contributor(s) and not of MDPI and/or the editor(s). MDPI and/or the editor(s) disclaim responsibility for any injury to people or property resulting from any ideas, methods, instructions or products referred to in the content. |
© 2023 by the authors. Licensee MDPI, Basel, Switzerland. This article is an open access article distributed under the terms and conditions of the Creative Commons Attribution (CC BY) license (https://creativecommons.org/licenses/by/4.0/).
Share and Cite
Gasthuys, E.; Sandra, L.; Statelova, M.; Vertzoni, M.; Vermeulen, A. The Use of Population Pharmacokinetics to Extrapolate Food Effects from Human Adults and Beagle Dogs to the Pediatric Population Illustrated with Paracetamol as a Test Case. Pharmaceuticals 2024, 17, 53. https://doi.org/10.3390/ph17010053
Gasthuys E, Sandra L, Statelova M, Vertzoni M, Vermeulen A. The Use of Population Pharmacokinetics to Extrapolate Food Effects from Human Adults and Beagle Dogs to the Pediatric Population Illustrated with Paracetamol as a Test Case. Pharmaceuticals. 2024; 17(1):53. https://doi.org/10.3390/ph17010053
Chicago/Turabian StyleGasthuys, Elke, Louis Sandra, Marina Statelova, Maria Vertzoni, and An Vermeulen. 2024. "The Use of Population Pharmacokinetics to Extrapolate Food Effects from Human Adults and Beagle Dogs to the Pediatric Population Illustrated with Paracetamol as a Test Case" Pharmaceuticals 17, no. 1: 53. https://doi.org/10.3390/ph17010053