
MKX-AS1 Gene Expression Associated with Variation in Drug Response to Oxaliplatin and Clinical Outcomes in Colorectal Cancer Patients
 , , , ,
  , and
, and 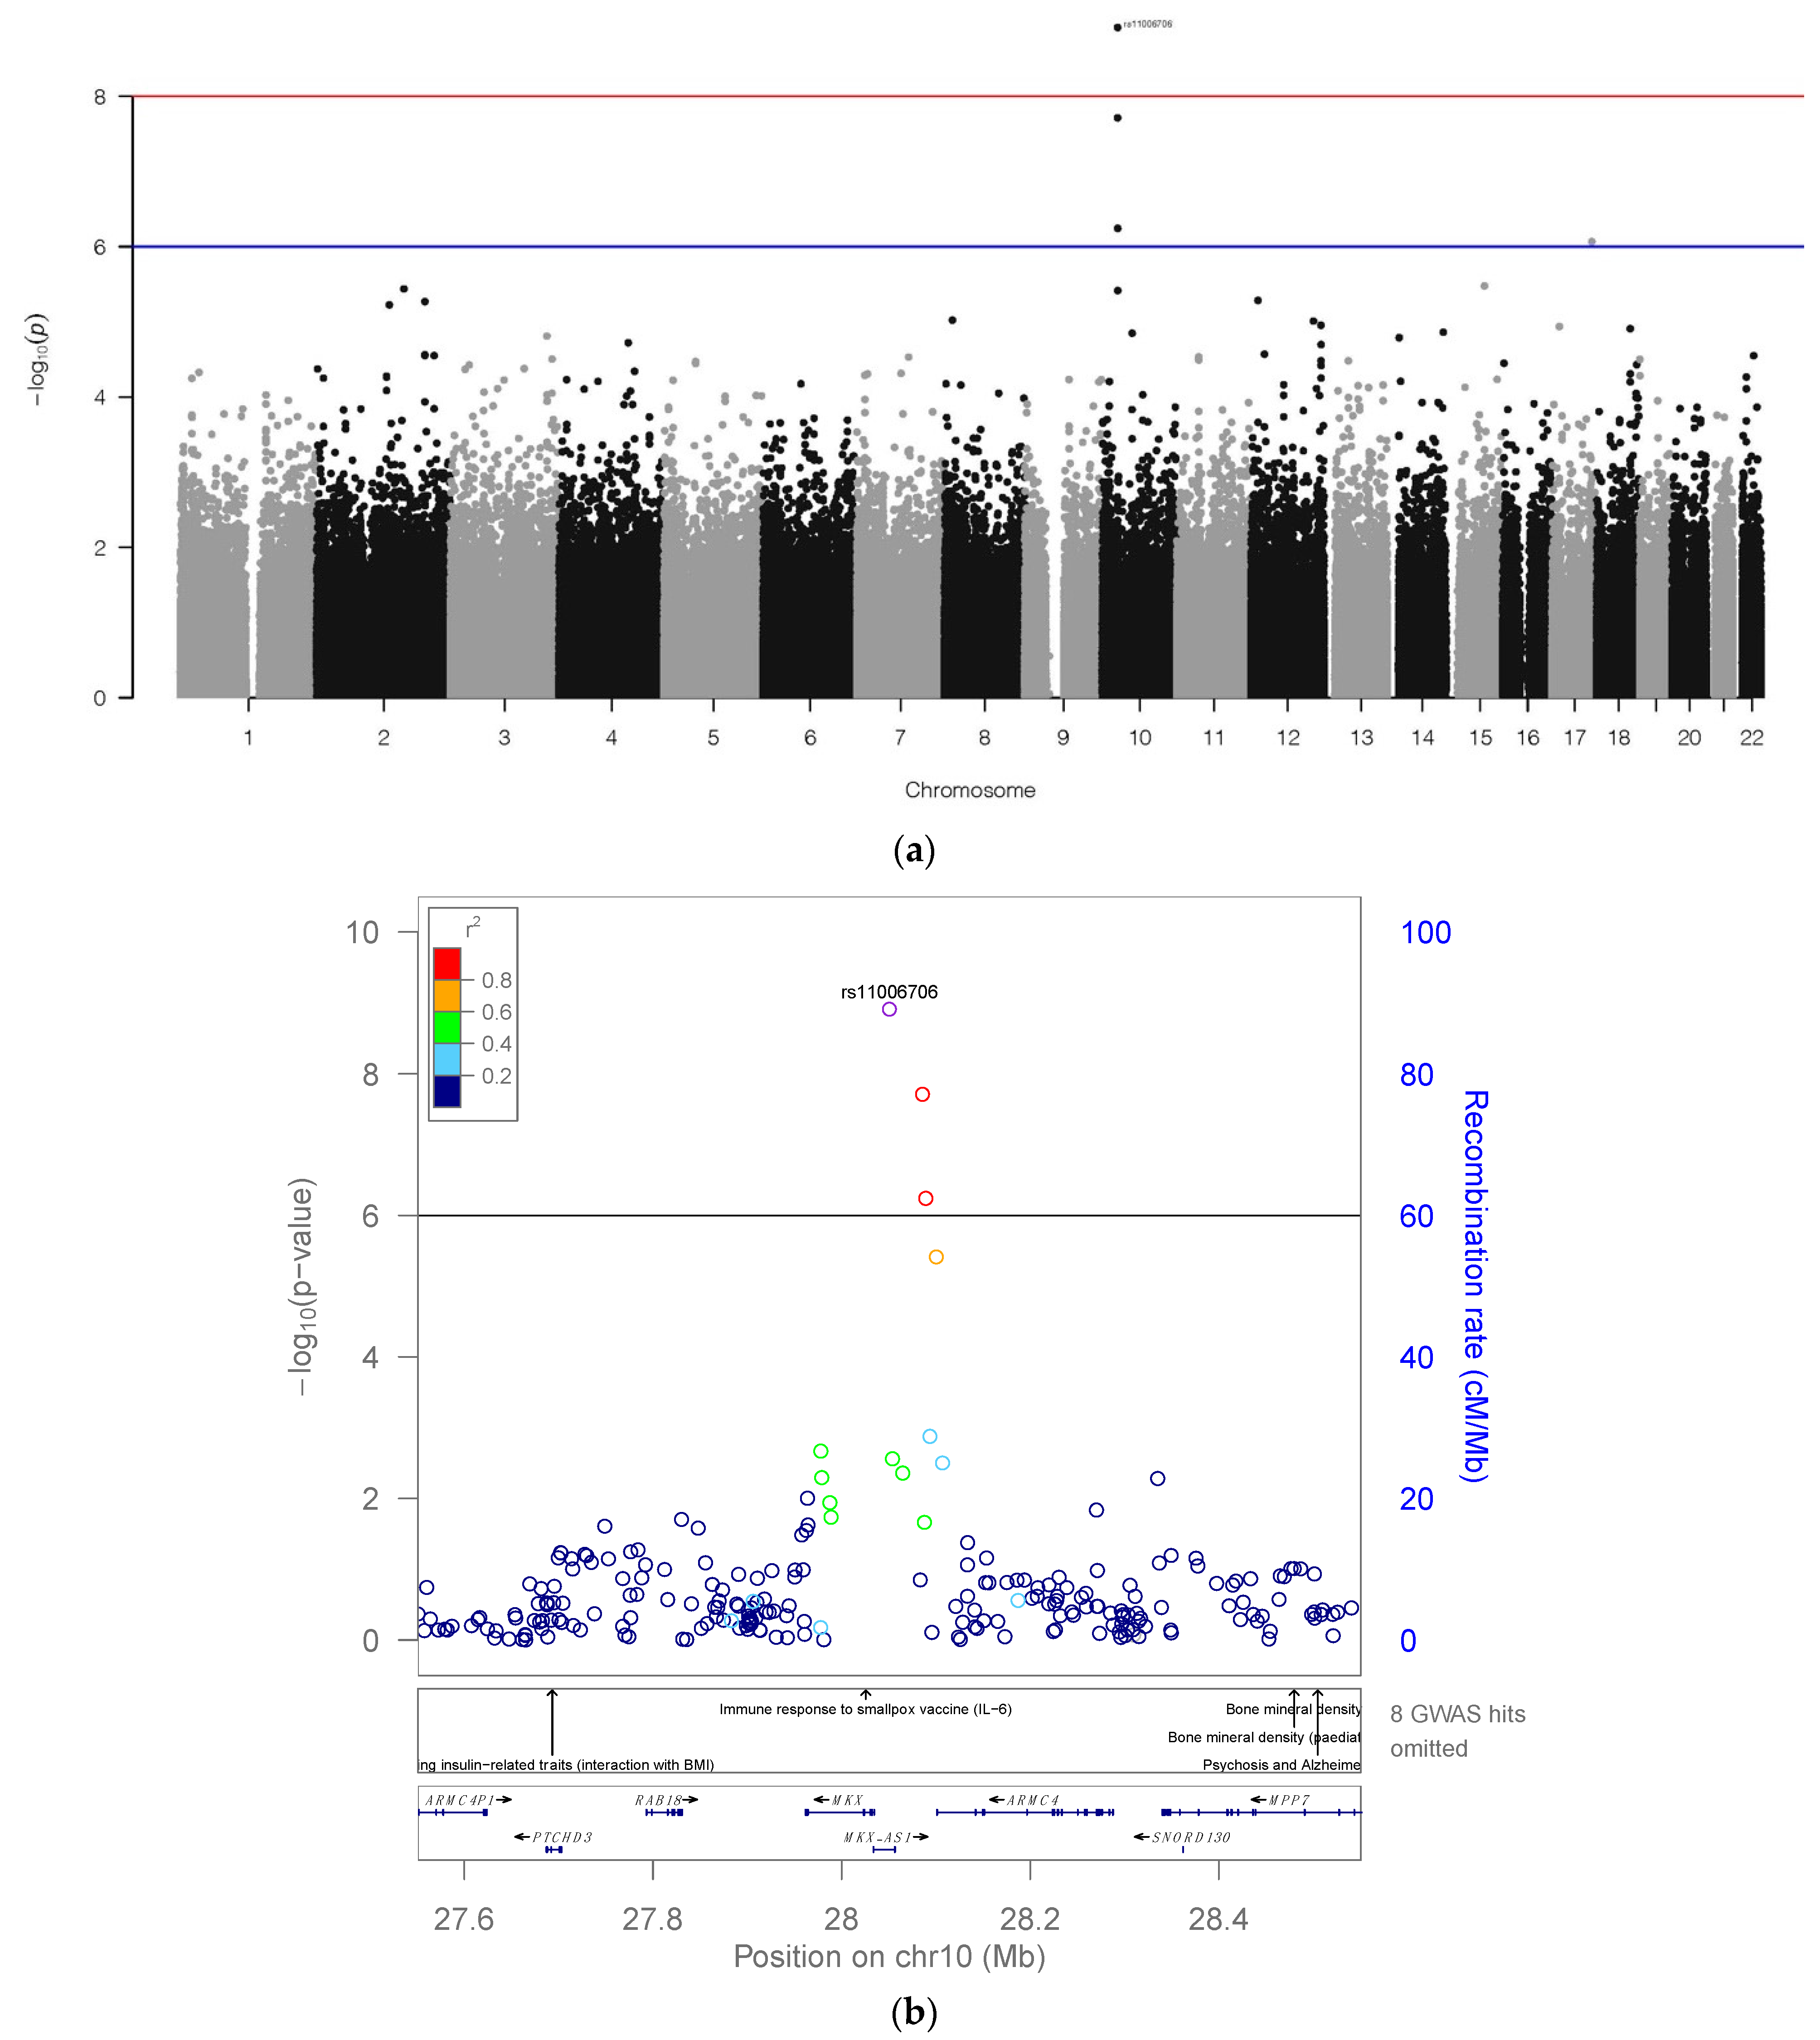
Abstract
:1. Introduction
2. Results
2.1. GWAS Analysis
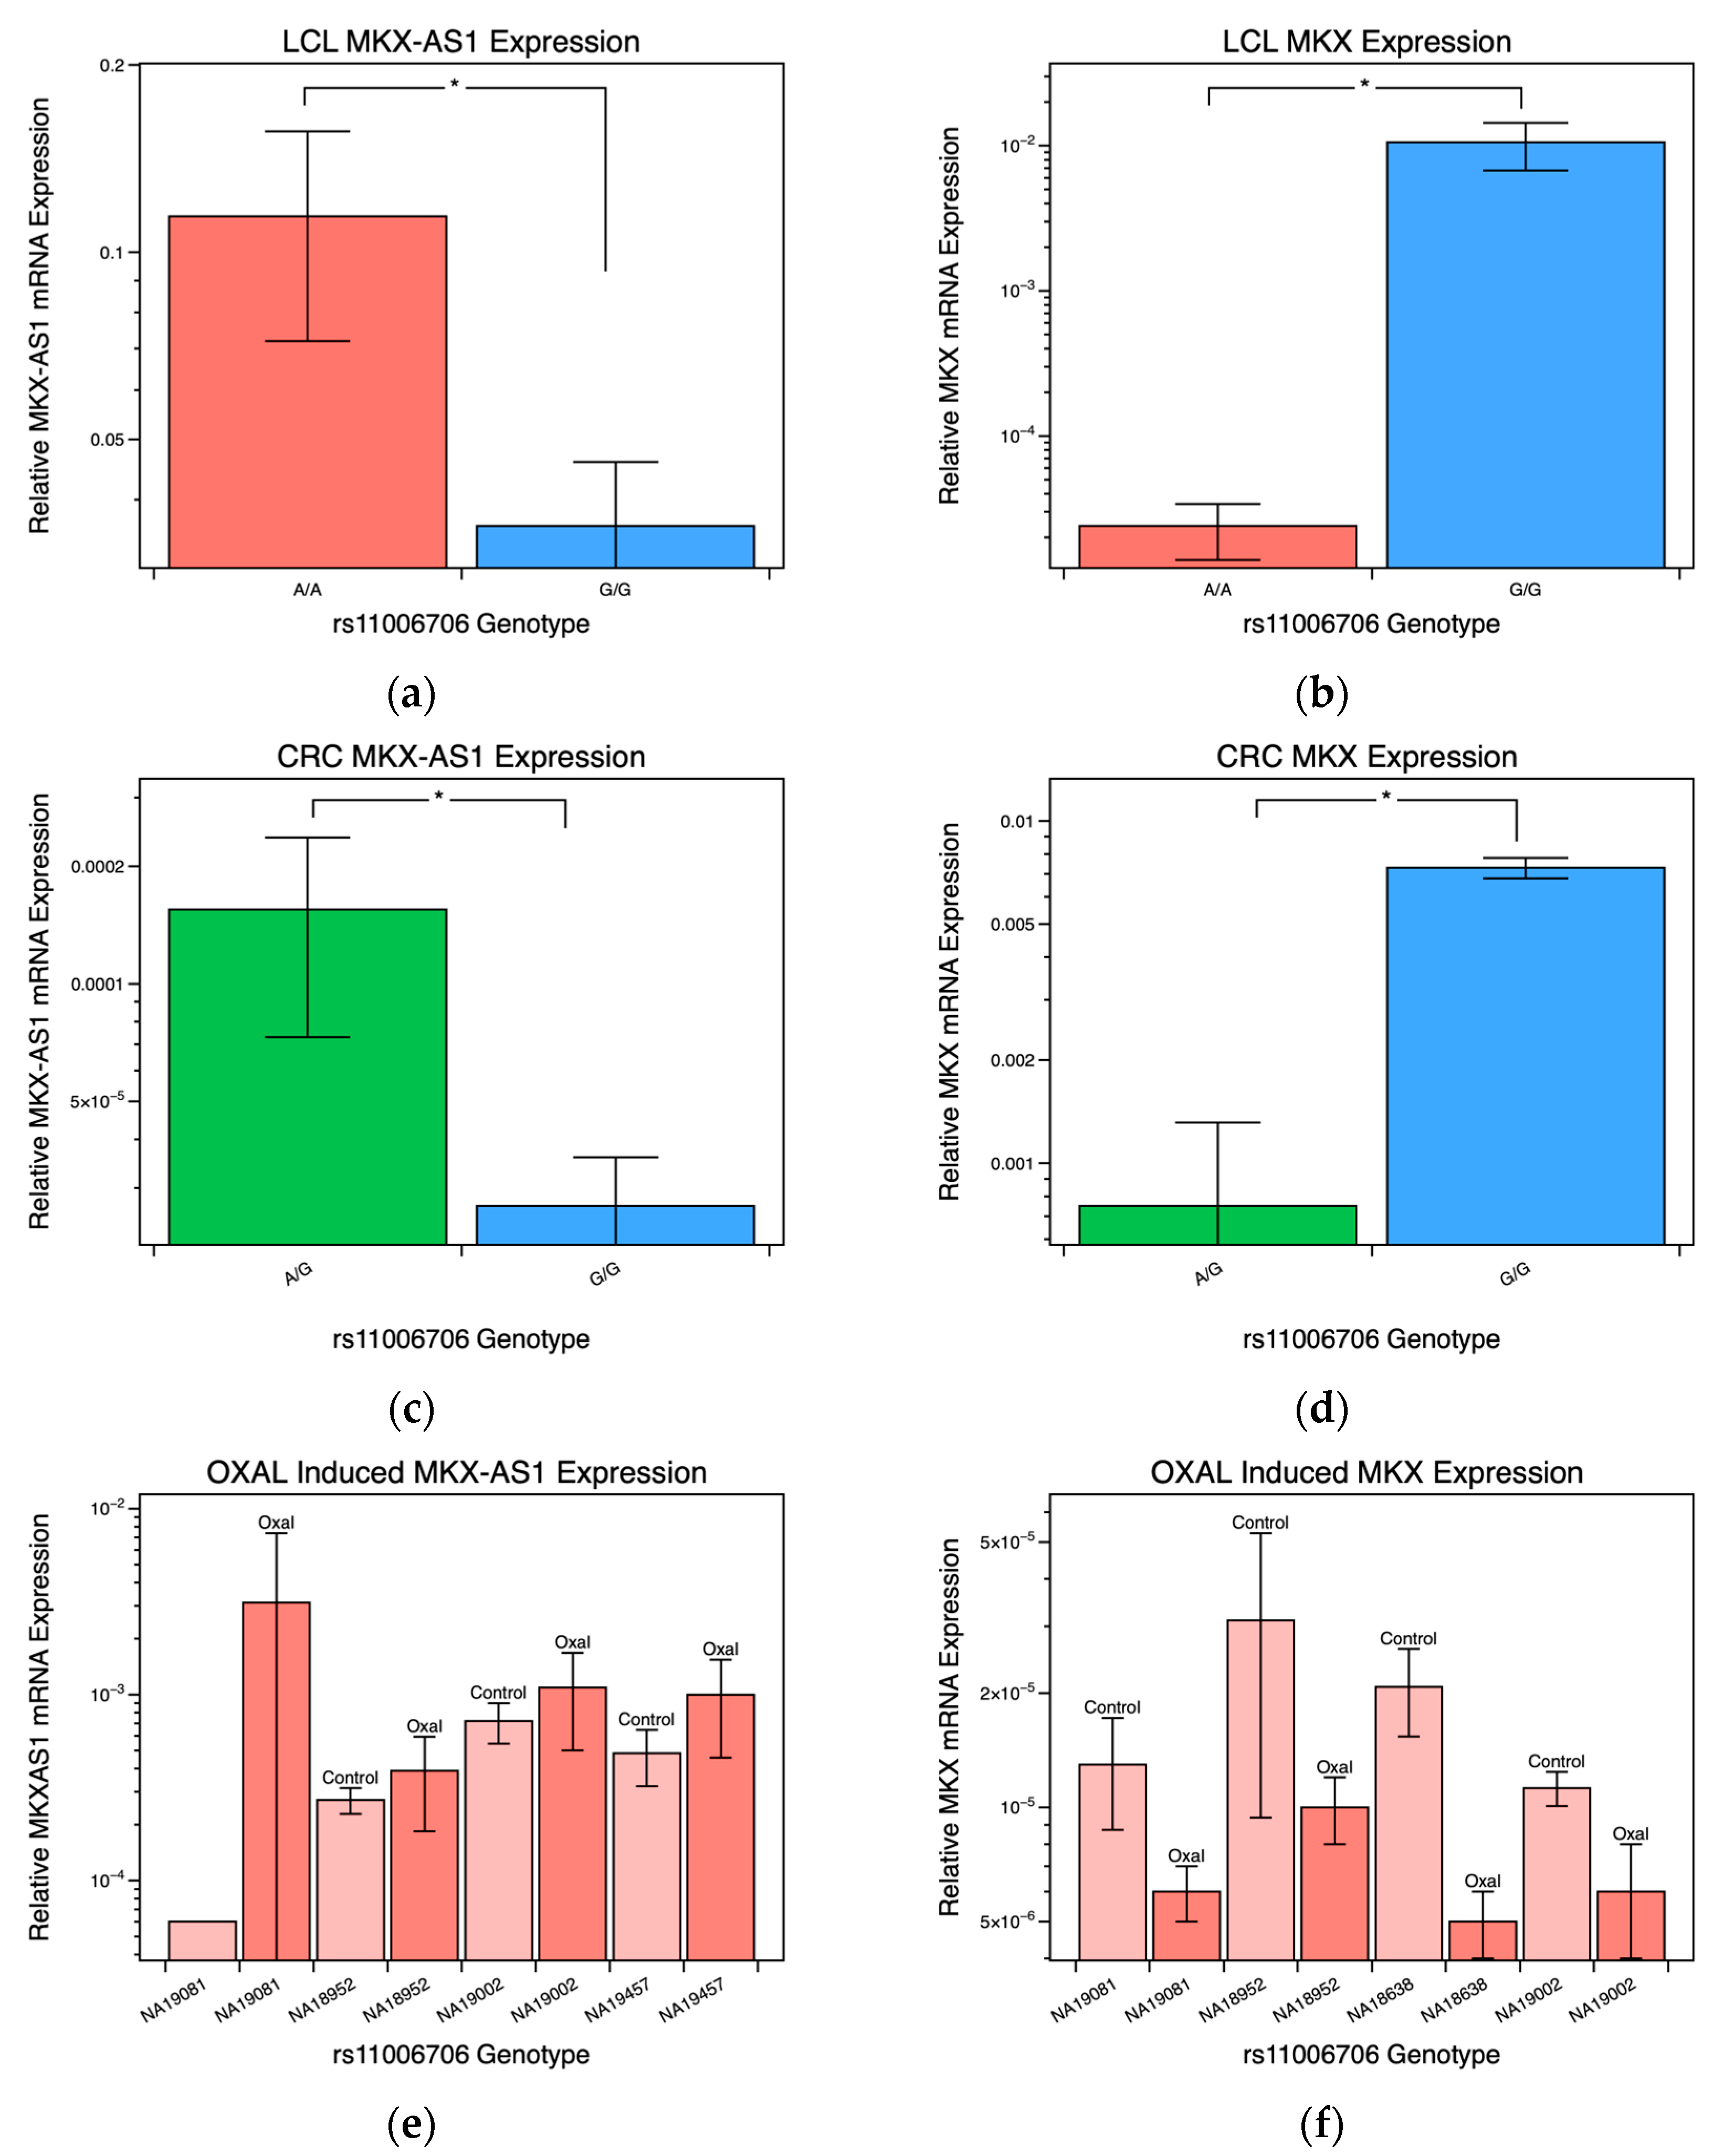
2.2. MKX-AS1 and MKX Gene-Expression
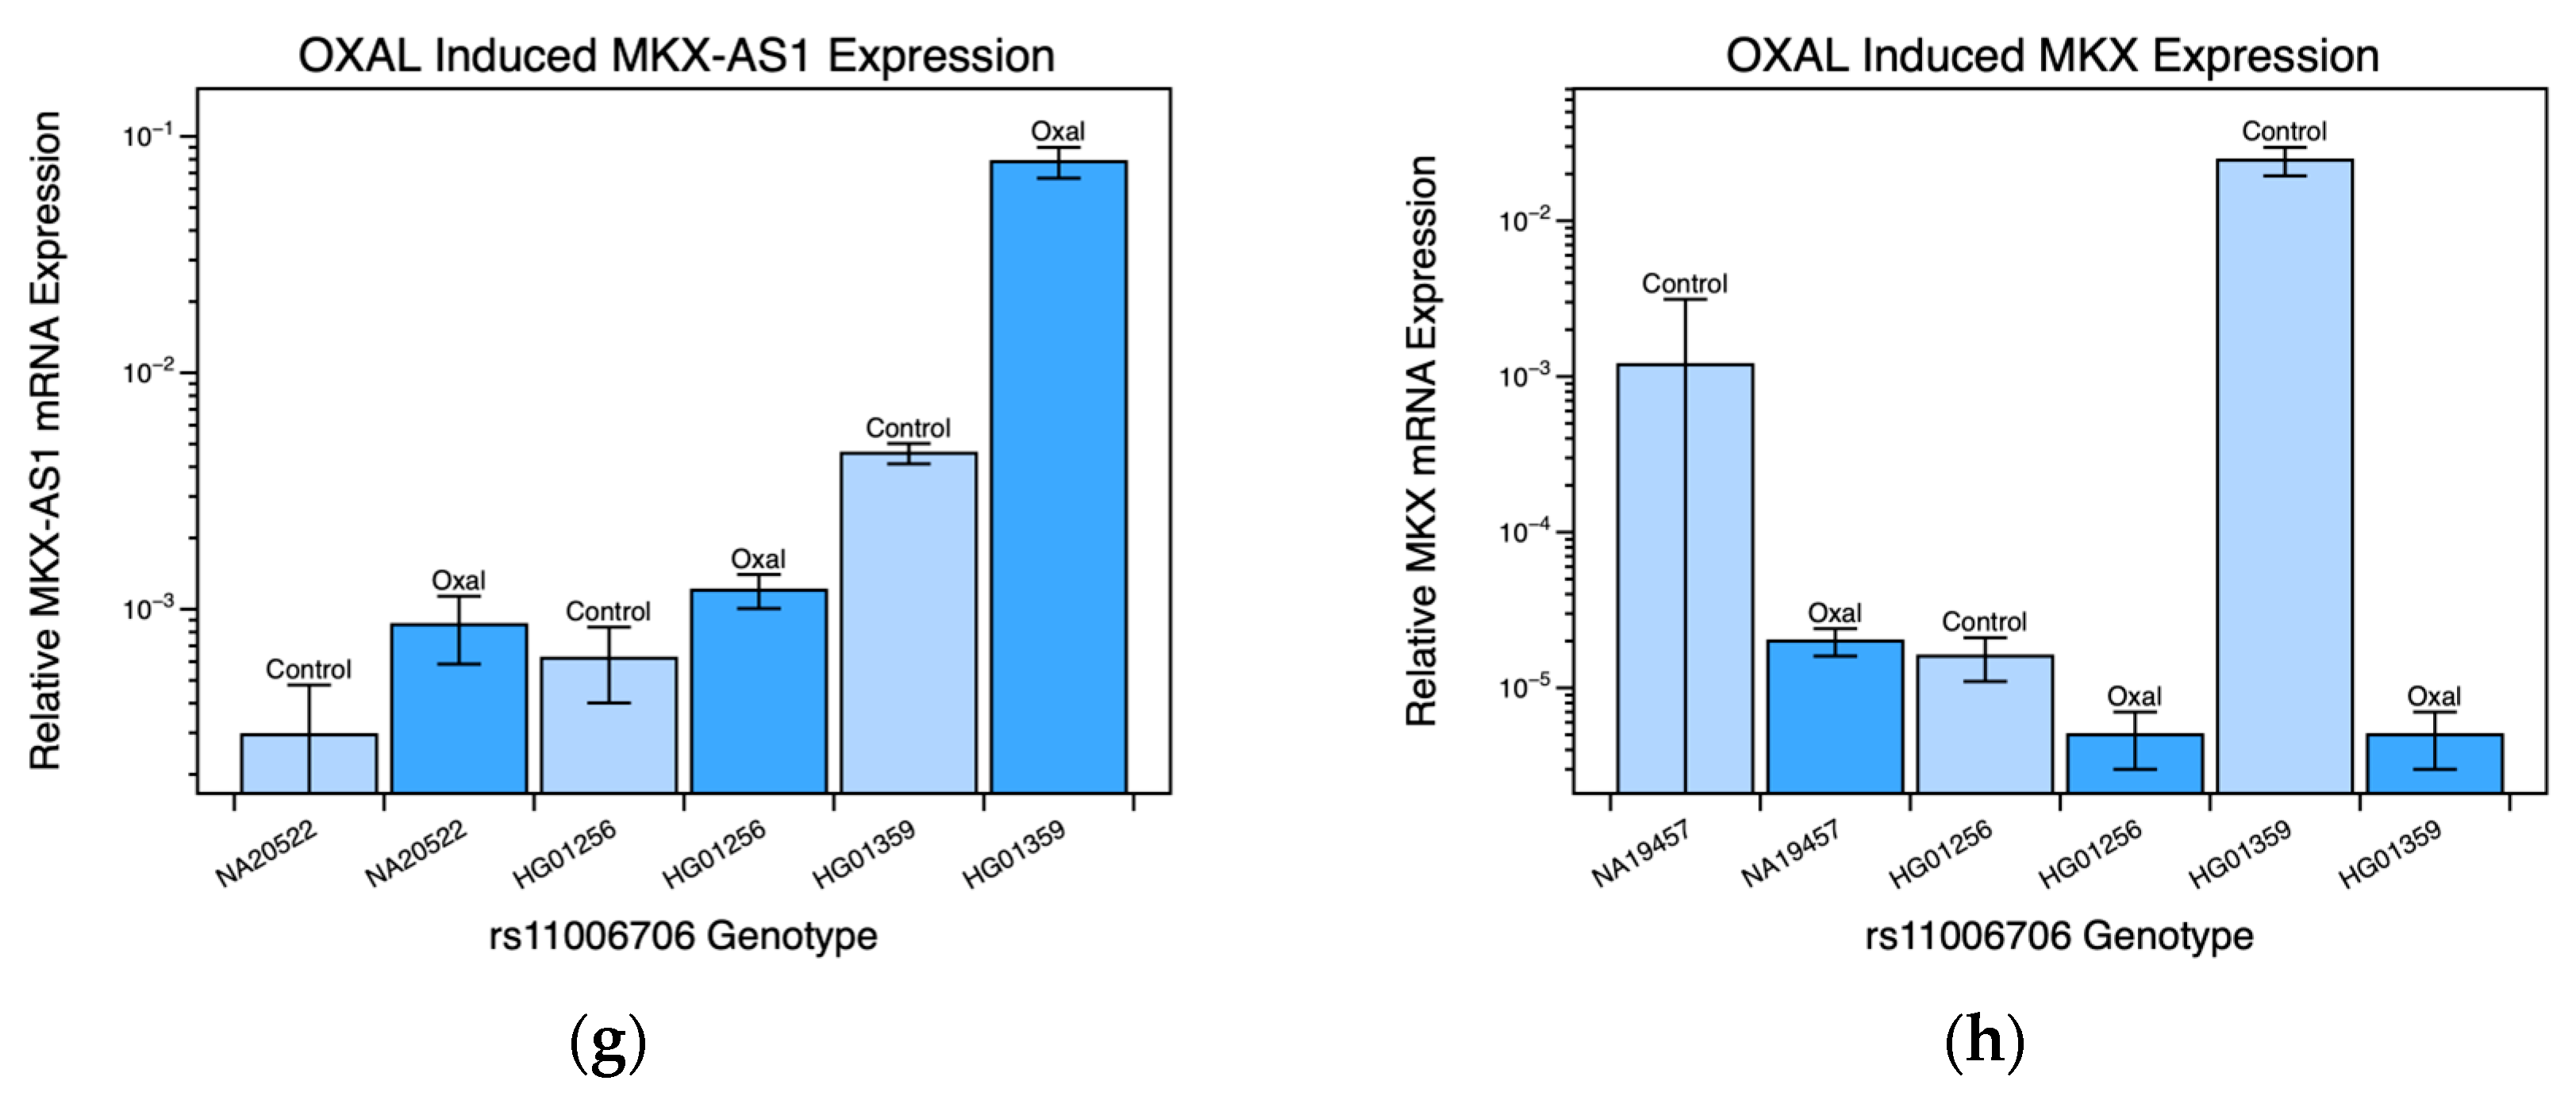
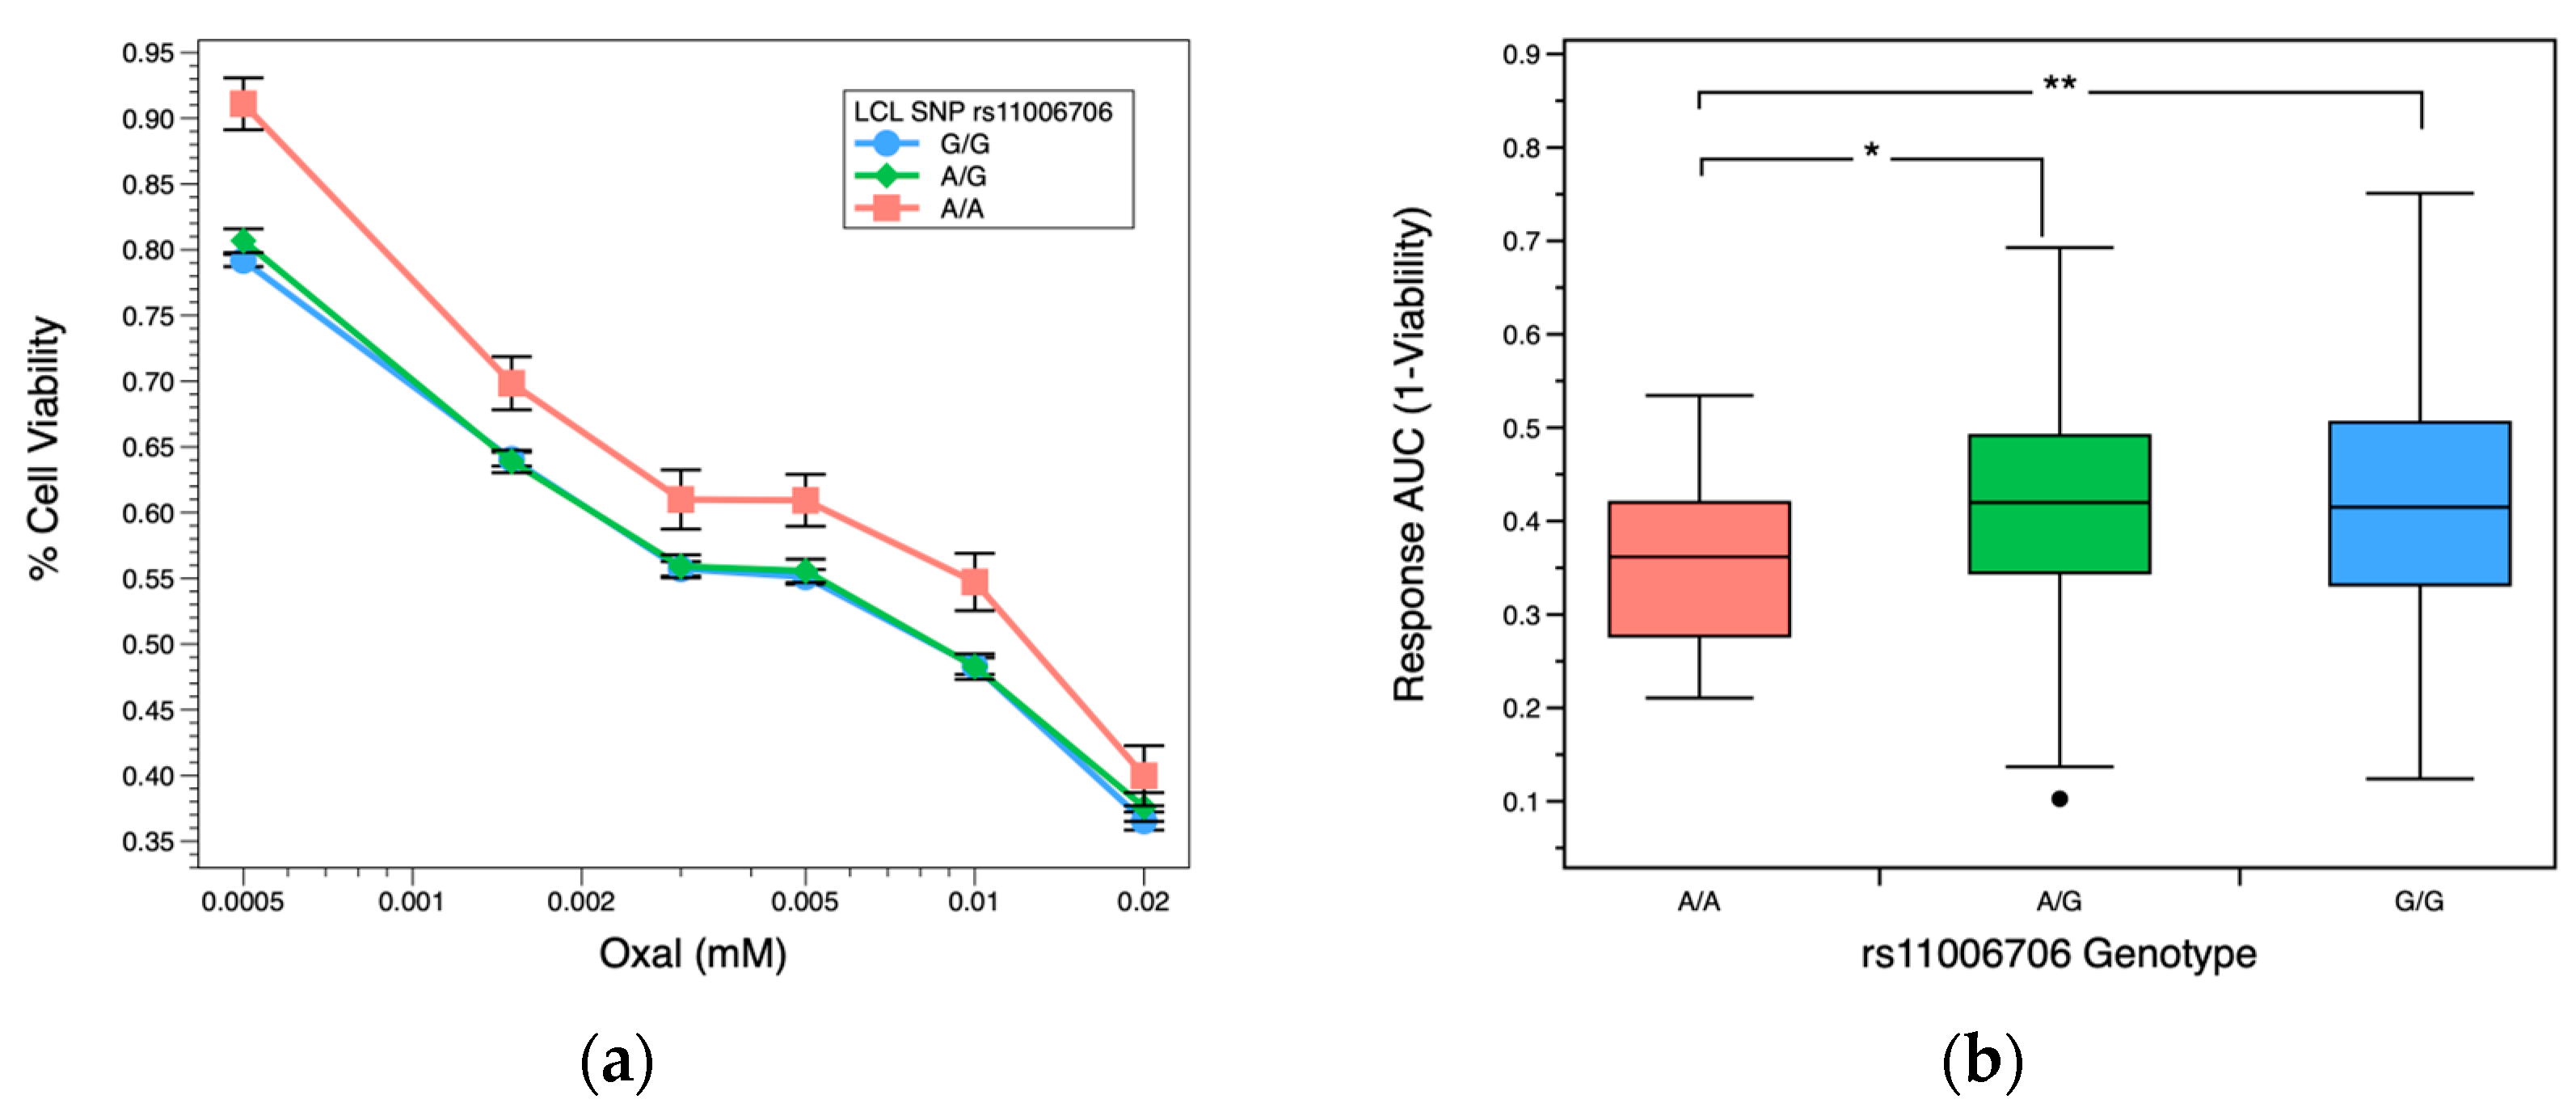
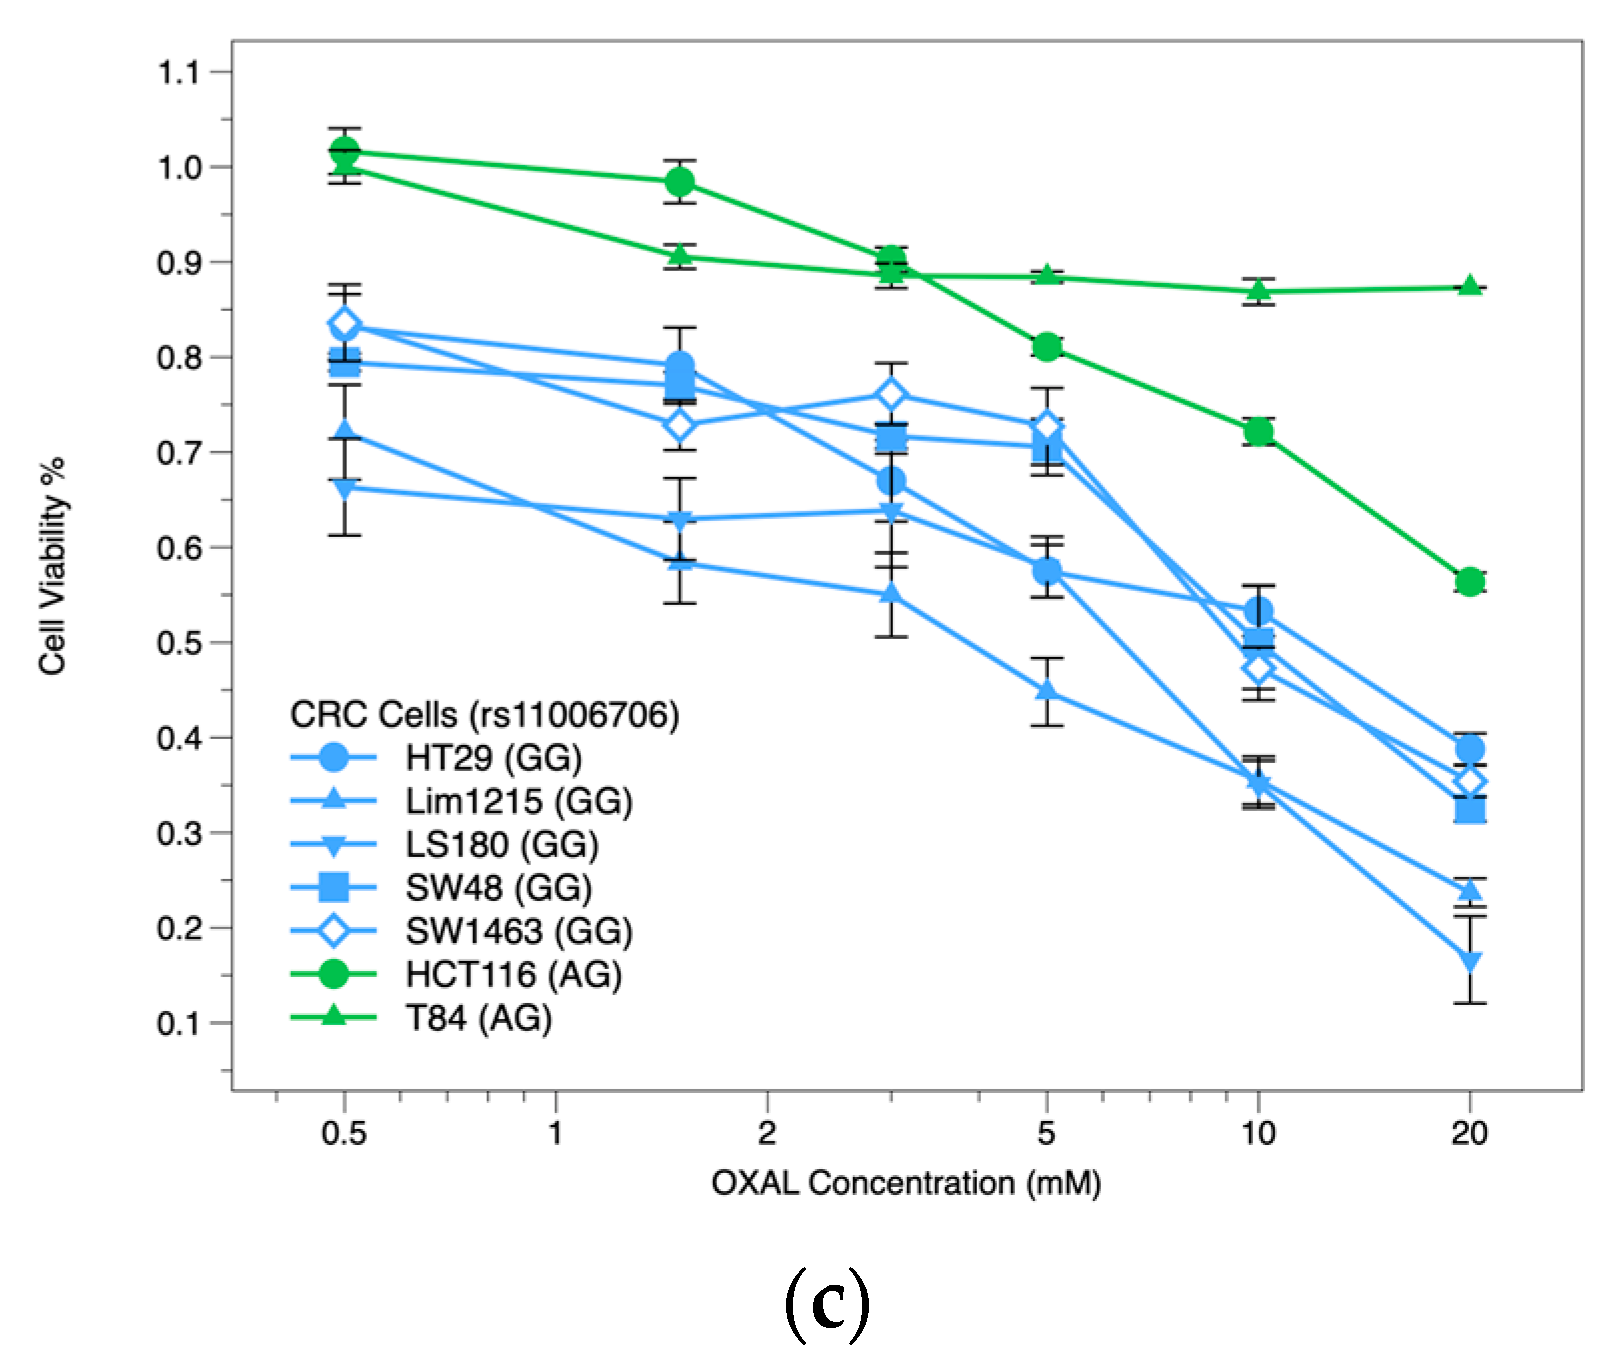
2.3. OXAL Dose Response
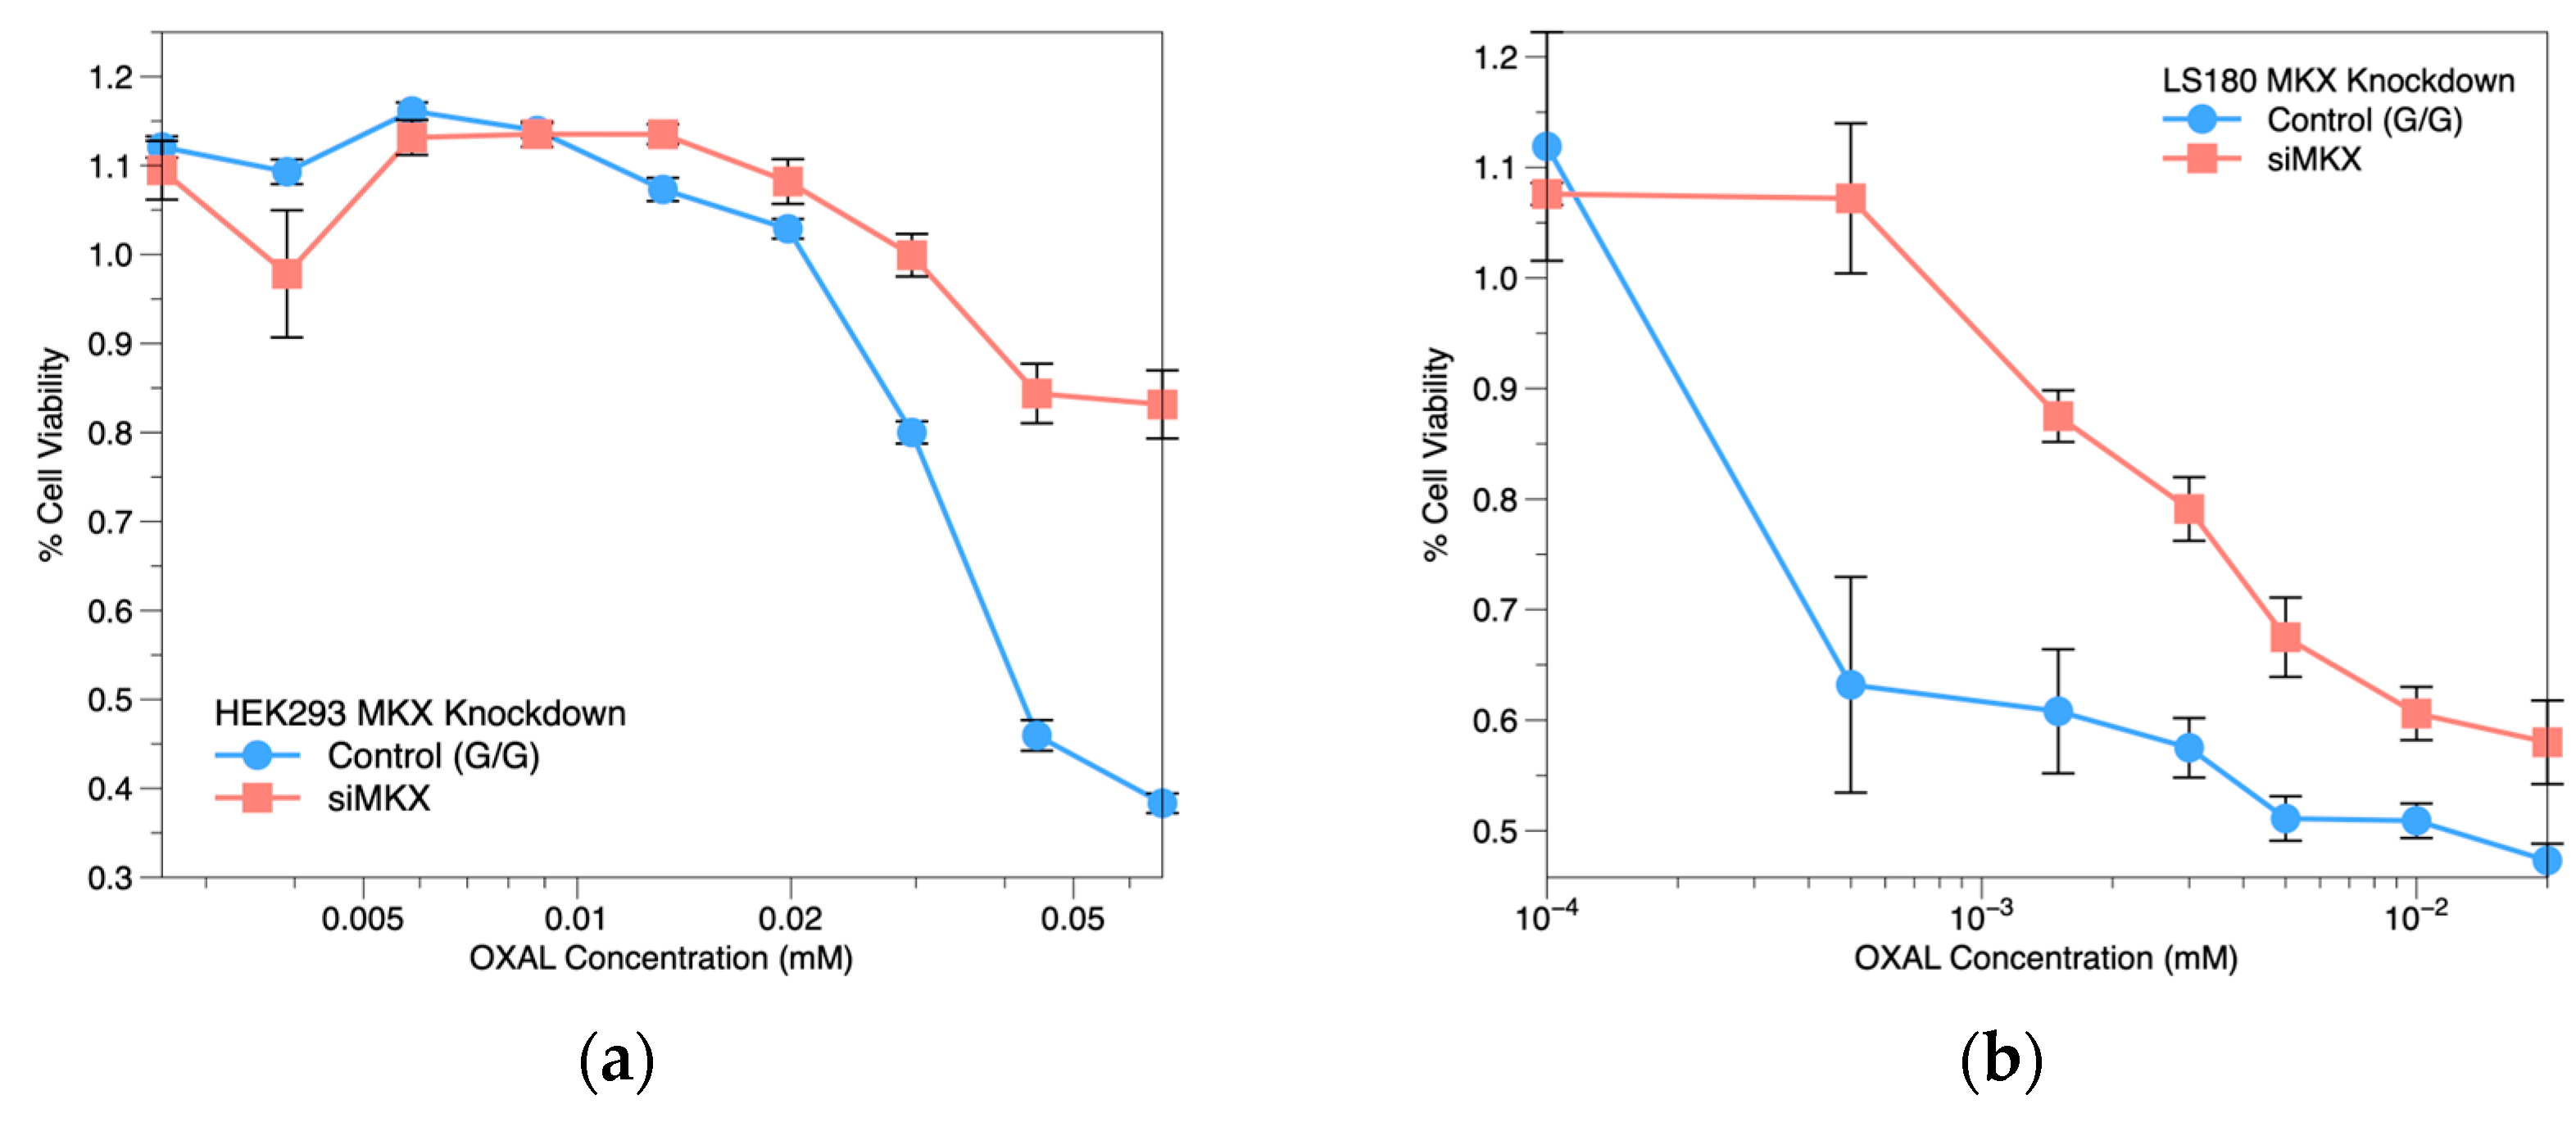
2.4. MKX siRNA Knockdown
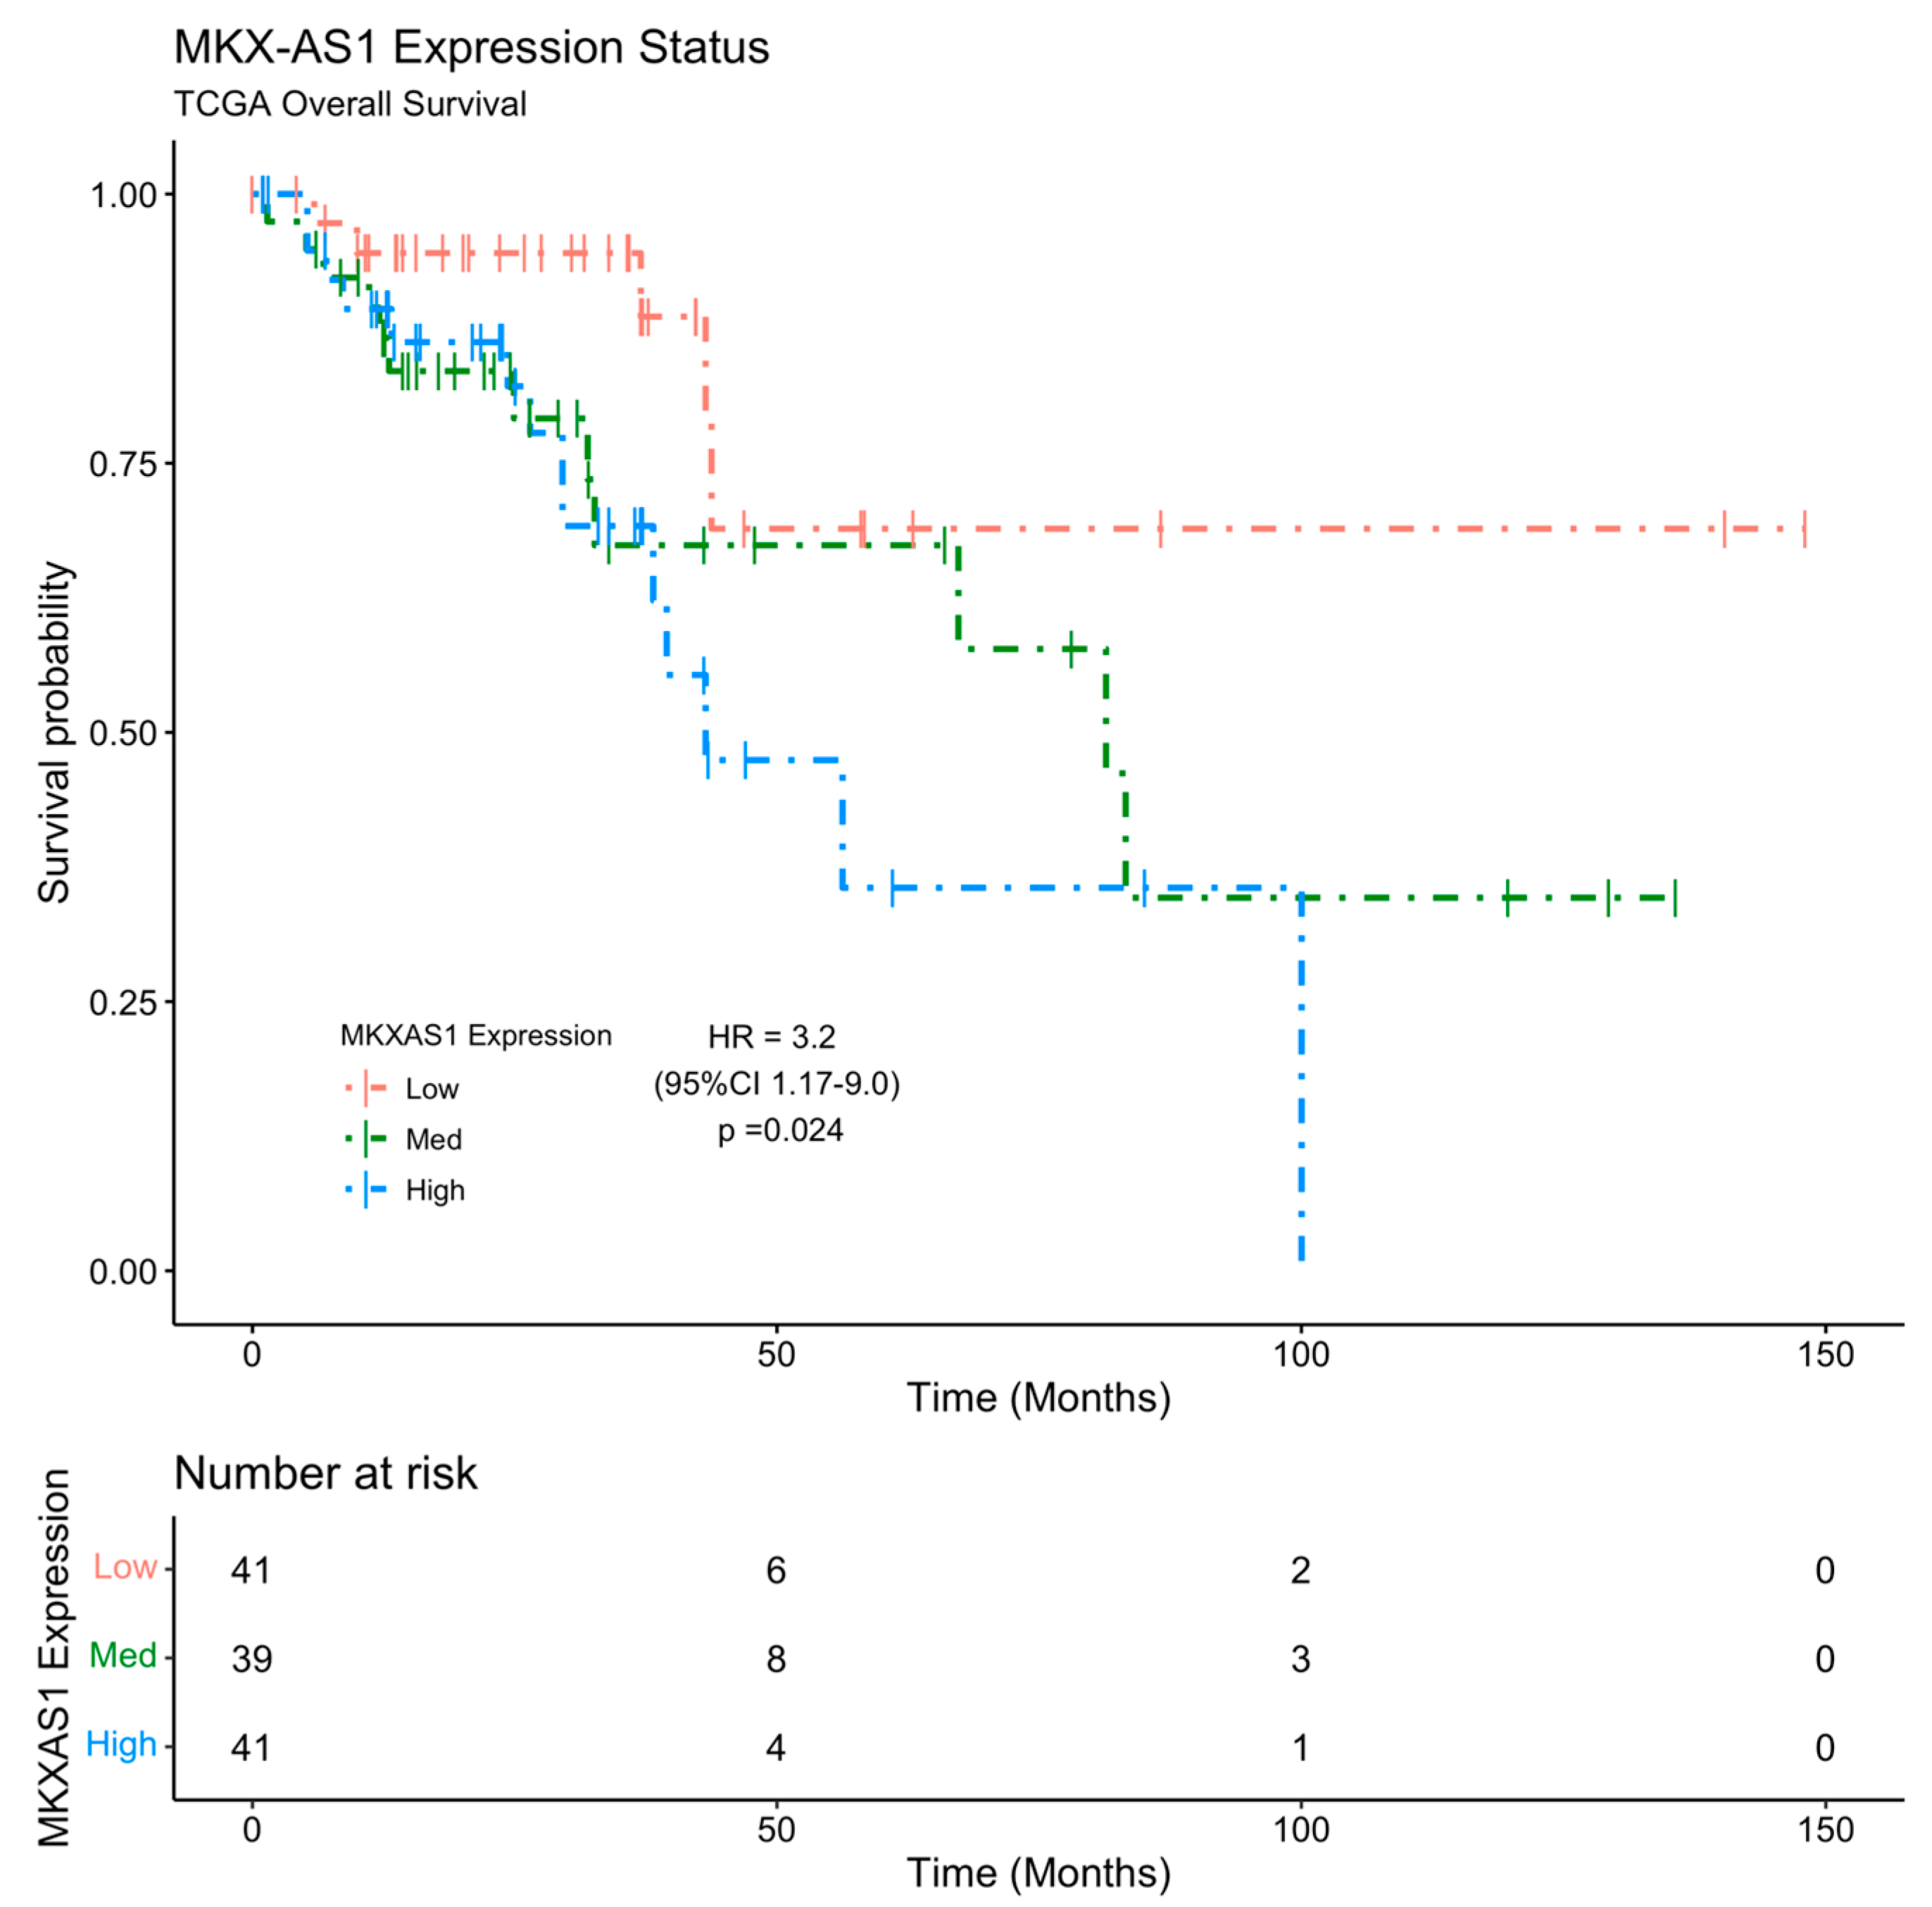
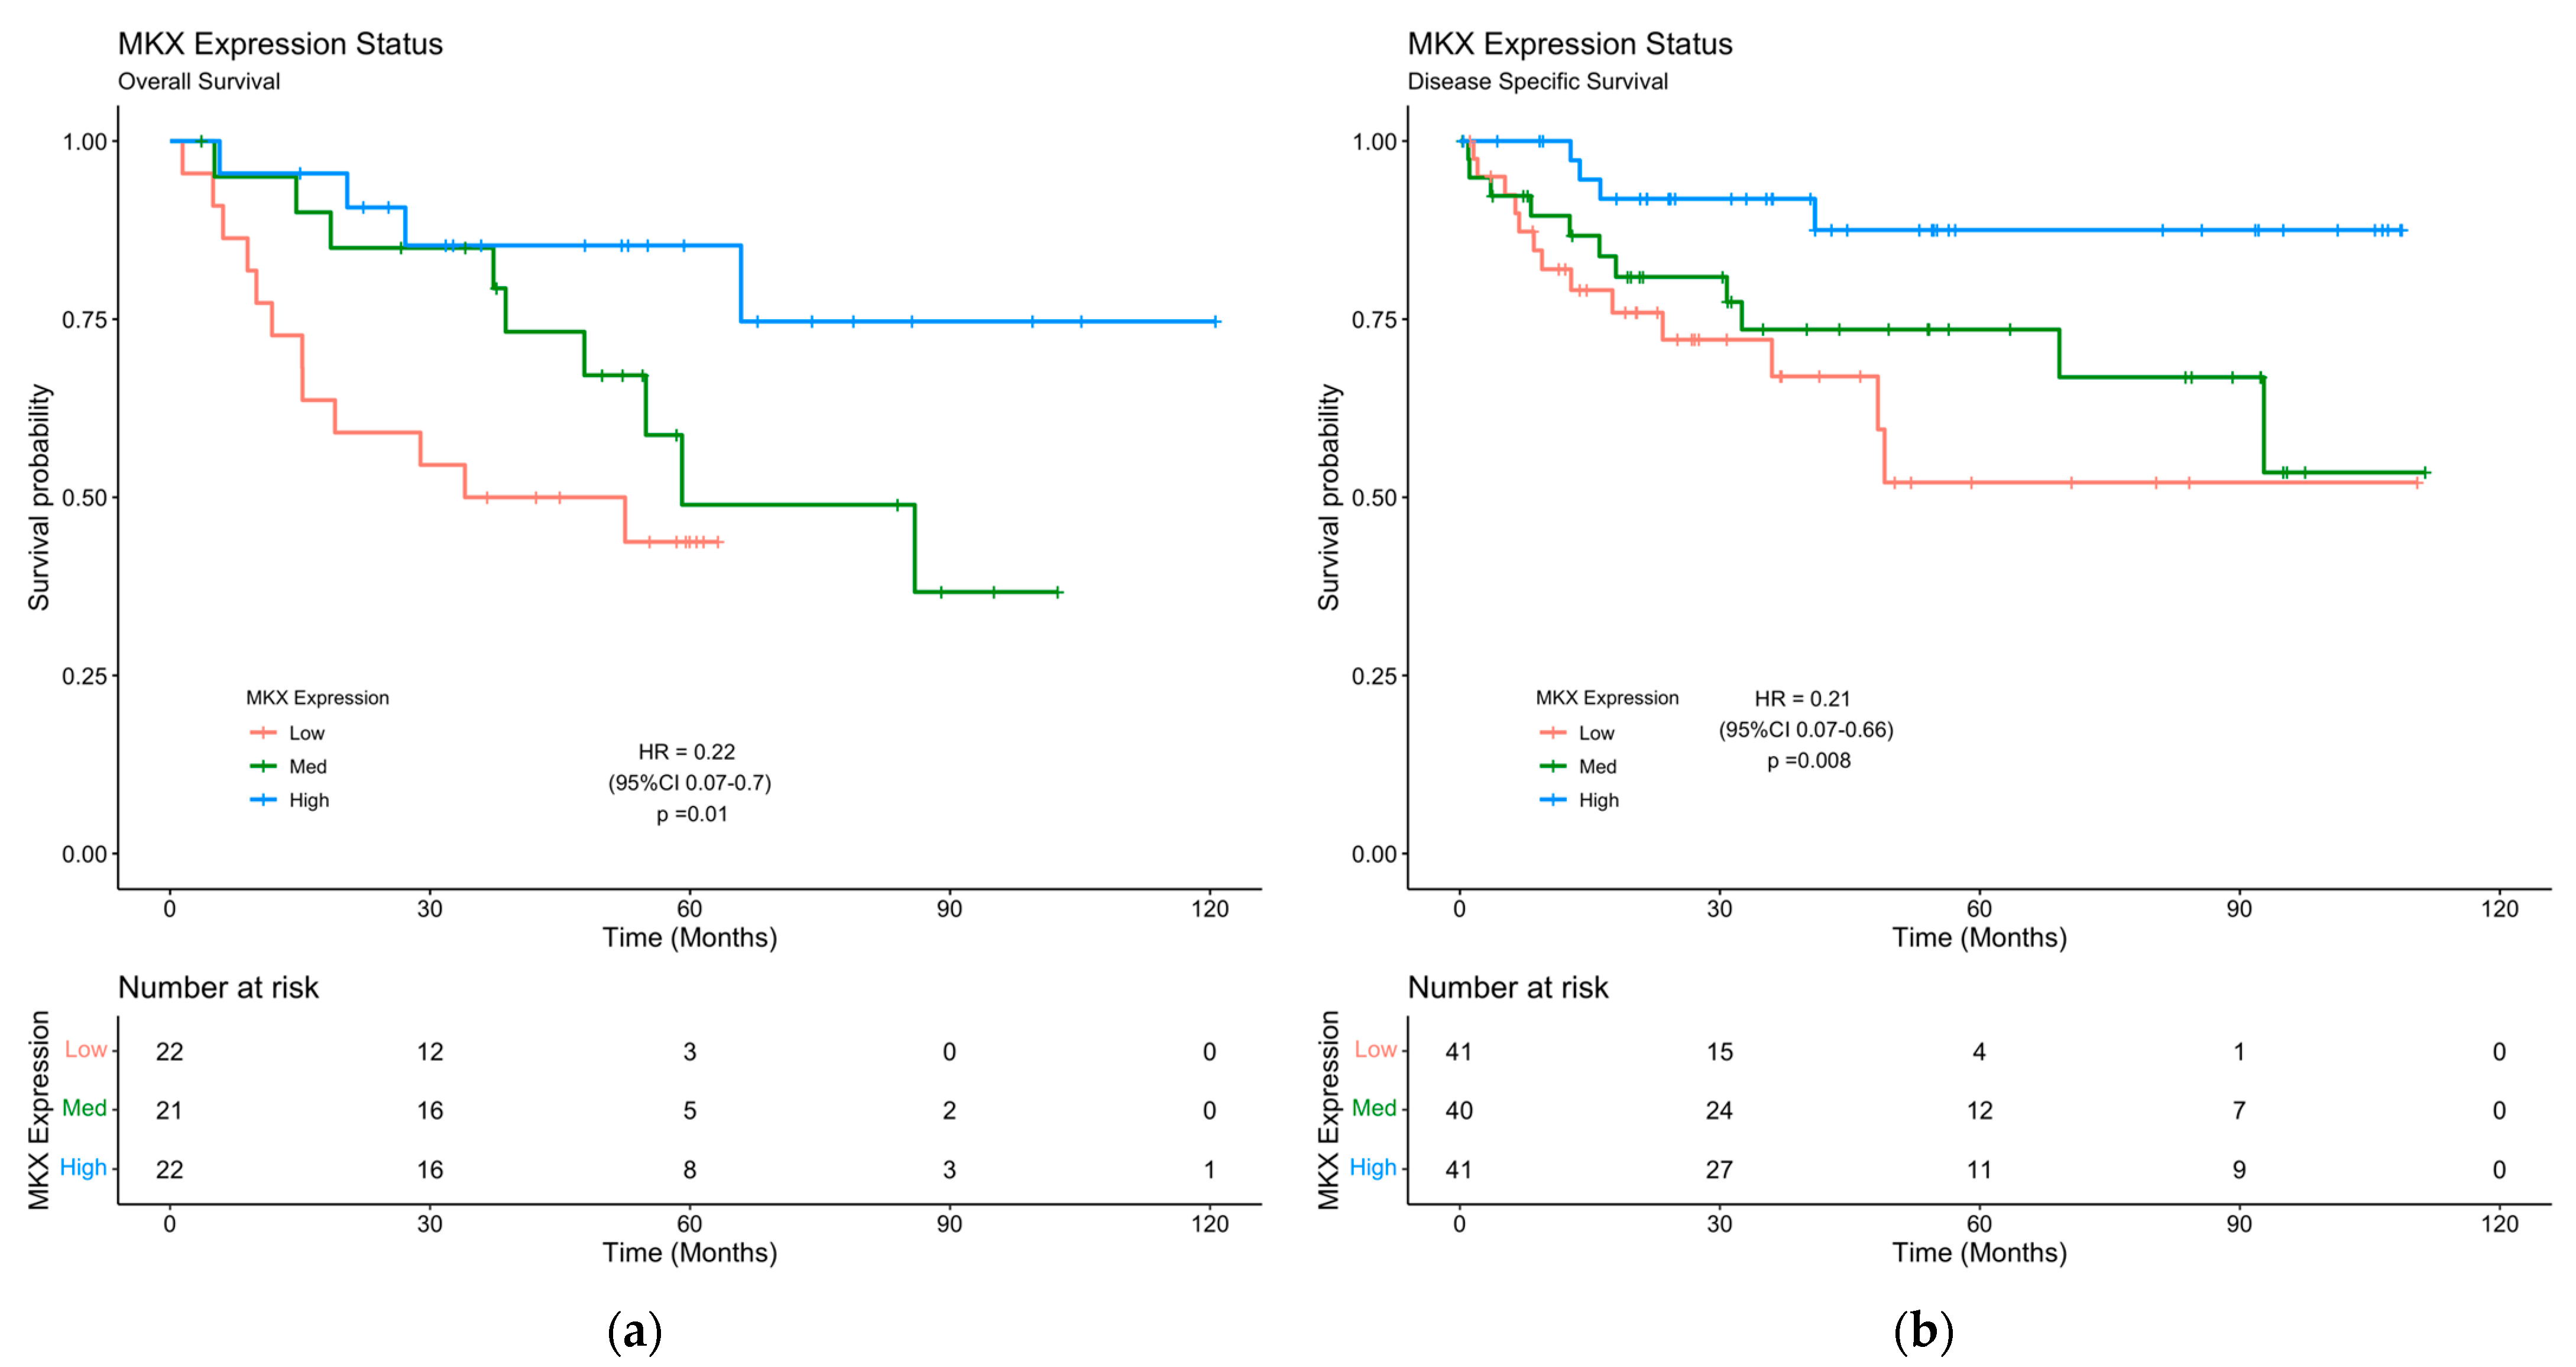
2.5. MKX-AS1 and MKX Expression Is Associated with Poor Clinical Prognosis
3. Discussion
4. Materials and Methods
4.1. Cell Lines Culture and Genetic Data
4.2. Dose Response
4.3. SNP Genotyping and mRNA Expression
4.4. shRNA Knockdown
4.5. Clinical Datasets
4.6. Statistical Analysis
5. Conclusions
Supplementary Materials
Author Contributions
Funding
Institutional Review Board Statement
Informed Consent Statement
Data Availability Statement
Acknowledgments
Conflicts of Interest
References
- Siegel, R.L.; Miller, K.D.; Goding Sauer, A.; Fedewa, S.A.; Butterly, L.F.; Anderson, J.C.; Cercek, A.; Smith, R.A.; Jemal, A. Colorectal cancer statistics, 2020. CA Cancer J. Clin. 2020, 70, 145–164. [Google Scholar] [CrossRef]
- Lai, E.; Liscia, N.; Donisi, C.; Mariani, S.; Tolu, S.; Pretta, A.; Persano, M.; Pinna, G.; Balconi, F.; Pireddu, A.; et al. Molecular-Biology-Driven Treatment for Metastatic Colorectal Cancer. Cancers 2020, 12, 1214. [Google Scholar] [CrossRef] [PubMed]
- Smeets, D.; Miller, I.S.; O’Connor, D.P.; Das, S.; Moran, B.; Boeckx, B.; Gaiser, T.; Betge, J.; Barat, A.; Klinger, R.; et al. Copy number load predicts outcome of metastatic colorectal cancer patients receiving bevacizumab combination therapy. Nat. Commun. 2018, 9, 4112. [Google Scholar] [CrossRef] [PubMed]
- Provenzale, D.; Ness, R.M.; Llor, X.; Weiss, J.M.; Abbadessa, B.; Cooper, G.; Early, D.S.; Friedman, M.; Giardiello, F.M.; Glaser, K.; et al. NCCN guidelines insights: Colorectal cancer screening, version 2.2020. J. Natl. Compr. Cancer Netw. 2020, 18, 1312–1320. [Google Scholar] [CrossRef] [PubMed]
- Cortejoso, L.; García, M.I.; García-Alfonso, P.; González-Haba, E.; Escolar, F.; Sanjurjo, M.; López-Fernández, L.A. Differential toxicity biomarkers for irinotecan- and oxaliplatin-containing chemotherapy in colorectal cancer. Cancer Chemother. Pharmacol. 2013, 71, 1463–1472. [Google Scholar] [CrossRef] [PubMed]
- Comella, P.; Casaretti, R.; Sandomenico, C.; Avallone, A.; Franco, L. Role of oxaliplatin in the treatment of colorectal cancer. Ther. Clin. Risk Manag. 2009, 5, 229–238. [Google Scholar] [CrossRef] [PubMed]
- Yang, A.D.; Fan, F.; Camp, E.R.; van Buren, G.; Liu, W.; Somcio, R.; Gray, M.J.; Cheng, H.; Hoff, P.M.; Ellis, L.M. Chronic oxaliplatin resistance induces epithelial-to-mesenchymal transition in colorectal cancer cell lines. Clin. Cancer Res. 2006, 12, 4147–4153. [Google Scholar] [CrossRef]
- Ranieri, G.; Laforgia, M.; Nardulli, P.; Ferraiuolo, S.; Molinari, P.; Marech, I.; Gadaleta, C.D. Oxaliplatin-Based Intra-arterial Chemotherapy in Colo-Rectal Cancer Liver Metastases: A Review from Pharmacology to Clinical Application. Cancers 2019, 11, 141. [Google Scholar] [CrossRef]
- Amatu, A.; Mauri, G.; Tosi, F.; Bencardino, K.; Bonazzina, E.; Gori, V.; Ruggieri, L.; Arena, S.; Bardelli, A.; Marsoni, S.; et al. Efficacy of Retreatment with Oxaliplatin-Based Regimens in Metastatic Colorectal Cancer Patients: The RETROX-CRC Retrospective Study. Cancers 2022, 14, 1197. [Google Scholar] [CrossRef]
- Benson, A.B.; Venook, A.P.; Al-Hawary, M.M.; Arain, M.A.; Chen, Y.-J.; Ciombor, K.K.; Cohen, S.; Cooper, H.S.; Deming, D.; Garrido-Laguna, I.; et al. NCCN guidelines insights: Rectal cancer, version 6.2020. J. Natl. Compr. Cancer Netw. 2020, 18, 806–815. [Google Scholar] [CrossRef]
- Benson, A.B.; Venook, A.P.; Al-Hawary, M.M.; Cederquist, L.; Chen, Y.-J.; Ciombor, K.K.; Cohen, S.; Cooper, H.S.; Deming, D.; Engstrom, P.F.; et al. NCCN guidelines insights: Colon cancer, version 2.2018. J. Natl. Compr. Cancer Netw. 2018, 16, 359–369. [Google Scholar] [CrossRef] [PubMed]
- Arango, D.; Wilson, A.J.; Shi, Q.; Corner, G.A.; Arañes, M.J.; Nicholas, C.; Lesser, M.; Mariadason, J.M.; Augenlicht, L.H. Molecular mechanisms of action and prediction of response to oxaliplatin in colorectal cancer cells. Br. J. Cancer 2004, 91, 1931–1946. [Google Scholar] [CrossRef] [PubMed]
- Akhtari, F.S.; Green, A.J.; Small, G.W.; Havener, T.M.; House, J.S.; Roell, K.R.; Reif, D.M.; McLeod, H.L.; Wiltshire, T.; Motsinger-Reif, A.A. High-throughput screening and genome-wide analyses of 44 anticancer drugs in the 1000 Genomes cell lines reveals an association of the NQO1 gene with the response of multiple anticancer drugs. PLoS Genet. 2021, 17, e1009732. [Google Scholar] [CrossRef] [PubMed]
- Pauli, C.; Hopkins, B.D.; Prandi, D.; Shaw, R.; Fedrizzi, T.; Sboner, A.; Sailer, V.; Augello, M.; Puca, L.; Rosati, R.; et al. Personalized in vitro and in vivo cancer models to guide precision medicine. Cancer Discov. 2017, 7, 462–477. [Google Scholar] [CrossRef] [PubMed]
- Brown, C.C.; Havener, T.M.; Medina, M.W.; Jack, J.R.; Krauss, R.M.; McLeod, H.L.; Motsinger-Reif, A.A. Genome-wide association and pharmacological profiling of 29 anticancer agents using lymphoblastoid cell lines. Pharmacogenomics 2014, 15, 137–146. [Google Scholar] [CrossRef]
- Niu, N.; Wang, L. In vitro human cell line models to predict clinical response to anticancer drugs. Pharmacogenomics 2015, 16, 273–285. [Google Scholar] [CrossRef]
- Menden, M.P.; Casale, F.P.; Stephan, J.; Bignell, G.R.; Iorio, F.; McDermott, U.; Garnett, M.J.; Saez-Rodriguez, J.; Stegle, O. The germline genetic component of drug sensitivity in cancer cell lines. Nat. Commun. 2018, 9, 3385. [Google Scholar] [CrossRef]
- Garnett, M.J.; Edelman, E.J.; Heidorn, S.J.; Greenman, C.D.; Dastur, A.; Lau, K.W.; Greninger, P.; Thompson, I.R.; Luo, X.; Soares, J.; et al. Systematic identification of genomic markers of drug sensitivity in cancer cells. Nature 2012, 483, 570–575. [Google Scholar] [CrossRef]
- Wheeler, H.E.; Dolan, M.E. Lymphoblastoid cell lines in pharmacogenomic discovery and clinical translation. Pharmacogenomics 2012, 13, 55–70. [Google Scholar] [CrossRef]
- 1000 Genomes Project Consortium; Auton, A.; Brooks, L.D.; Durbin, R.M.; Garrison, E.P.; Kang, H.M.; Korbel, J.O.; Marchini, J.L.; McCarthy, S.; McVean, G.A.; et al. A global reference for human genetic variation. Nature 2015, 526, 68–74. [Google Scholar] [CrossRef]
- Dean, L. Fluorouracil therapy and DPYD genotype. In Medical Genetics Summaries; Pratt, V., McLeod, H., Dean, L., Malheiro, A., Rubinstein, W., Eds.; National Center for Biotechnology Information (US): Bethesda, MD, USA, 2012. [Google Scholar]
- Jiang, L.; Wang, L.; Zhang, Z.; Wang, Z.; Wang, X.; Wang, S.; Luan, X.; Xia, Y.; Liu, Y. The pharmacokinetic interaction between irinotecan and sunitinib. Cancer Chemother. Pharmacol. 2020, 85, 443–448. [Google Scholar] [CrossRef] [PubMed]
- Yau, T.O. Precision treatment in colorectal cancer: Now and the future. JGH Open 2019, 3, 361–369. [Google Scholar] [CrossRef] [PubMed]
- Molnár, B.; Galamb, O.; Péterfia, B.; Wichmann, B.; Csabai, I.; Bodor, A.; Kalmár, A.; Szigeti, K.A.; Barták, B.K.; Nagy, Z.B.; et al. Gene promoter and exon DNA methylation changes in colon cancer development—mRNA expression and tumor mutation alterations. BMC Cancer 2018, 18, 695. [Google Scholar] [CrossRef]
- Perego, P.; Robert, J. Oxaliplatin in the era of personalized medicine: From mechanistic studies to clinical efficacy. Cancer Chemother. Pharmacol. 2016, 77, 5–18. [Google Scholar] [CrossRef] [PubMed]
- Karas, S.; Mathijssen, R.H.J.; van Schaik, R.H.N.; Forrest, A.; Wiltshire, T.; Innocenti, F.; Bies, R.R. Model-Based Prediction of Irinotecan-Induced Grade 4 Neutropenia in Advanced Cancer Patients: Influence of Demographic and Clinical Factors. Clin. Pharmacol. Ther. 2022, 112, 316–326. [Google Scholar] [CrossRef]
- Karas, S.; Etheridge, A.S.; Nickerson, D.A.; Cox, N.J.; Mohlke, K.L.; Cecchin, E.; Toffoli, G.; Mathijssen, R.H.J.; Forrest, A.; Bies, R.R.; et al. Integration of DNA sequencing with population pharmacokinetics to improve the prediction of irinotecan exposure in cancer patients. Br. J. Cancer 2022, 126, 640–651. [Google Scholar] [CrossRef] [PubMed]
- Brown, C.C.; Havener, T.M.; Medina, M.W.; Krauss, R.M.; McLeod, H.L.; Motsinger-Reif, A.A. Multivariate methods and software for association mapping in dose-response genome-wide association studies. BioData Min. 2012, 5, 21. [Google Scholar] [CrossRef]
- Wight, M.; Werner, A. The functions of natural antisense transcripts. Essays Biochem. 2013, 54, 91–101. [Google Scholar] [CrossRef] [PubMed]
- Werner, A.; Sayer, J.A. Naturally occurring antisense RNA: Function and mechanisms of action. Curr. Opin. Nephrol. Hypertens. 2009, 18, 343–349. [Google Scholar] [CrossRef]
- Khorkova, O.; Myers, A.J.; Hsiao, J.; Wahlestedt, C. Natural antisense transcripts. Hum. Mol. Genet. 2014, 23, R54–R63. [Google Scholar] [CrossRef]
- Faghihi, M.A.; Wahlestedt, C. Regulatory roles of natural antisense transcripts. Nat. Rev. Mol. Cell Biol. 2009, 10, 637–643. [Google Scholar] [CrossRef] [PubMed]
- Saberi, F.; Kamali, M.; Najafi, A.; Yazdanparast, A.; Moghaddam, M.M. Natural antisense RNAs as mRNA regulatory elements in bacteria: A review on function and applications. Cell. Mol. Biol. Lett. 2016, 21, 6. [Google Scholar] [CrossRef] [PubMed]
- GTEx Consortium Human genomics. The Genotype-Tissue Expression (GTEx) pilot analysis: Multitissue gene regulation in humans. Science 2015, 348, 648–660. [Google Scholar] [CrossRef] [PubMed]
- Best, M.G.; Sol, N.; Kooi, I.; Tannous, J.; Westerman, B.A.; Rustenburg, F.; Schellen, P.; Verschueren, H.; Post, E.; Koster, J.; et al. RNA-Seq of Tumor-Educated Platelets Enables Blood-Based Pan-Cancer, Multiclass, and Molecular Pathway Cancer Diagnostics. Cancer Cell 2015, 28, 666–676. [Google Scholar] [CrossRef] [PubMed]
- Hajjari, M.; Salavaty, A. HOTAIR: An oncogenic long non-coding RNA in different cancers. Cancer Biol. Med. 2015, 12, 666–676. [Google Scholar] [CrossRef]
- Zhang, Y.; Jin, T.; Shen, H.; Yan, J.; Guan, M.; Jin, X. Identification of Long Non-Coding RNA Expression Profiles and Co-Expression Genes in Thyroid Carcinoma Based on The Cancer Genome Atlas (TCGA) Database. Med. Sci. Monit. 2019, 25, 9752–9769. [Google Scholar] [CrossRef]
- Liu, X.; Xie, T.; Mao, X.; Xue, L.; Chu, X.; Chen, L. MicroRNA-149 Increases the Sensitivity of Colorectal Cancer Cells to 5-Fluorouracil by Targeting Forkhead Box Transcription Factor FOXM1. Cell. Physiol. Biochem. 2016, 39, 617–629. [Google Scholar] [CrossRef]
- Sewda, A.; Agopian, A.J.; Goldmuntz, E.; Hakonarson, H.; Morrow, B.E.; Taylor, D.; Mitchell, L.E. Pediatric Cardiac Genomics Consortium Gene-based genome-wide association studies and meta-analyses of conotruncal heart defects. PLoS ONE 2019, 14, e0219926. [Google Scholar] [CrossRef]
- Chen, G. Mkx Mediates Tenogenic Differentiation But Incompletely Inhibits The Proliferation of Hypoxic MSCs. Stem Cell Res. Ther. 2021, 12, 426. [Google Scholar] [CrossRef]
- Yang, F.; Richardson, D.W. Comparative Analysis of Tenogenic Gene Expression in Tenocyte-Derived Induced Pluripotent Stem Cells and Bone Marrow-Derived Mesenchymal Stem Cells in Response to Biochemical and Biomechanical Stimuli. Stem Cells Int. 2021, 2021, 8835576. [Google Scholar] [CrossRef]
- Milet, C.; Duprez, D. The Mkx homeoprotein promotes tenogenesis in stem cells and improves tendon repair. Ann. Transl. Med. 2015, 3, S33. [Google Scholar] [CrossRef] [PubMed]
- Sieh, W.; Rothstein, J.H.; Klein, R.J.; Alexeeff, S.E.; Sakoda, L.C.; Jorgenson, E.; McBride, R.B.; Graff, R.E.; McGuire, V.; Achacoso, N.; et al. Identification of 31 loci for mammographic density phenotypes and their associations with breast cancer risk. Nat. Commun. 2020, 11, 5116. [Google Scholar] [CrossRef] [PubMed]
- Khonthun, C.; Saikachain, N.; Popluechai, S.; Kespechara, K.; Hiranyakas, A.; Srikummool, M.; Surangkul, D. Microarray Analysis of Gene Expression Involved in Butyrate-Resistant Colorectal Carcinoma HCT116 Cells. Asian Pac. J. Cancer Prev. 2020, 21, 1739–1746. [Google Scholar] [CrossRef]
- Tomar, T.; Alkema, N.G.; Schreuder, L.; Meersma, G.J.; de Meyer, T.; van Criekinge, W.; Klip, H.G.; Fiegl, H.; van Nieuwenhuysen, E.; Vergote, I.; et al. Methylome analysis of extreme chemoresponsive patients identifies novel markers of platinum sensitivity in high-grade serous ovarian cancer. BMC Med. 2017, 15, 116. [Google Scholar] [CrossRef] [PubMed]
- Zanoni, M.; Piccinini, F.; Arienti, C.; Zamagni, A.; Santi, S.; Polico, R.; Bevilacqua, A.; Tesei, A. 3D tumor spheroid models for in vitro therapeutic screening: A systematic approach to enhance the biological relevance of data obtained. Sci. Rep. 2016, 6, 19103. [Google Scholar] [CrossRef] [PubMed]
- Nath, S.; Devi, G.R. Three-dimensional culture systems in cancer research: Focus on tumor spheroid model. Pharmacol. Ther. 2016, 163, 94–108. [Google Scholar] [CrossRef] [PubMed]
- Hicks, W.H.; Bird, C.E.; Pernik, M.N.; Haider, A.S.; Dobariya, A.; Abdullah, K.G.; Aoun, S.G.; Bentley, R.T.; Cohen-Gadol, A.A.; Bachoo, R.M.; et al. Large animal models of glioma: Current status and future prospects. Anticancer Res. 2021, 41, 5343–5353. [Google Scholar] [CrossRef]
- Jones, T.S.; Holland, E.C. Animal models for glioma drug discovery. Expert Opin. Drug Discov. 2011, 6, 1271–1283. [Google Scholar] [CrossRef]
- Grenade, C.; Phelps, M.A.; Villalona-Calero, M.A. Race and ethnicity in cancer therapy: What have we learned? Clin. Pharmacol. Ther. 2014, 95, 403–412. [Google Scholar] [CrossRef]
- Tawk, R.; Abner, A.; Ashford, A.; Brown, C.P. Differences in colorectal cancer outcomes by race and insurance. Int. J. Environ. Res. Public Health 2015, 13, 48. [Google Scholar] [CrossRef]
- Jian, X.; He, H.; Zhu, J.; Zhang, Q.; Zheng, Z.; Liang, X.; Chen, L.; Yang, M.; Peng, K.; Zhang, Z.; et al. Hsa_circ_001680 affects the proliferation and migration of CRC and mediates its chemoresistance by regulating BMI1 through miR-340. Mol. Cancer 2020, 19, 20. [Google Scholar] [CrossRef]
- Bian, L.; Zhi, X.; Ma, L.; Zhang, J.; Chen, P.; Sun, S.; Li, J.; Sun, Y.; Qin, J. Hsa_circRNA_103809 regulated the cell proliferation and migration in colorectal cancer via miR-532-3p/FOXO4 axis. Biochem. Biophys. Res. Commun. 2018, 505, 346–352. [Google Scholar] [CrossRef]
- Jia, Z.; An, J.; Liu, Z.; Zhang, F. Non-Coding RNAs in Colorectal Cancer: Their Functions and Mechanisms. Front. Oncol. 2022, 12, 783079. [Google Scholar] [CrossRef]
- Krishnamurthy, N.; Kurzrock, R. Targeting the Wnt/beta-catenin pathway in cancer: Update on effectors and inhibitors. Cancer Treat. Rev. 2018, 62, 50–60. [Google Scholar] [CrossRef]
- Bugter, J.M.; Fenderico, N.; Maurice, M.M. Mutations and mechanisms of WNT pathway tumour suppressors in cancer. Nat. Rev. Cancer 2021, 21, 5–21. [Google Scholar] [CrossRef] [PubMed]
- Kishimoto, Y.; Ohkawara, B.; Sakai, T.; Ito, M.; Masuda, A.; Ishiguro, N.; Shukunami, C.; Docheva, D.; Ohno, K. Wnt/β-catenin signaling suppresses expressions of Scx, Mkx, and Tnmd in tendon-derived cells. PLoS ONE 2017, 12, e0182051. [Google Scholar] [CrossRef]
- Yu, J.; Han, Z.; Sun, Z.; Wang, Y.; Zheng, M.; Song, C. LncRNA SLCO4A1-AS1 facilitates growth and metastasis of colorectal cancer through β-catenin-dependent Wnt pathway. J. Exp. Clin. Cancer Res. 2018, 37, 222. [Google Scholar] [CrossRef] [PubMed]
- Otabe, K.; Nakahara, H.; Hasegawa, A.; Matsukawa, T.; Ayabe, F.; Onizuka, N.; Inui, M.; Takada, S.; Ito, Y.; Sekiya, I.; et al. Transcription factor Mohawk controls tenogenic differentiation of bone marrow mesenchymal stem cells in vitro and in vivo. J. Orthop. Res. 2015, 33, 1–8. [Google Scholar] [CrossRef]
- Wang, D.; Pun, C.C.M.; Huang, S.; Tang, T.C.M.; Ho, K.K.W.; Rothrauff, B.B.; Yung, P.S.H.; Blocki, A.M.; Ker, E.D.F.; Tuan, R.S. Tendon-derived extracellular matrix induces mesenchymal stem cell tenogenesis via an integrin/transforming growth factor-β crosstalk-mediated mechanism. FASEB J. 2020, 34, 8172–8186. [Google Scholar] [CrossRef] [PubMed]
- Ito, Y.; Toriuchi, N.; Yoshitaka, T.; Ueno-Kudoh, H.; Sato, T.; Yokoyama, S.; Nishida, K.; Akimoto, T.; Takahashi, M.; Miyaki, S.; et al. The Mohawk homeobox gene is a critical regulator of tendon differentiation. Proc. Natl. Acad. Sci. USA 2010, 107, 10538–10542. [Google Scholar] [CrossRef]
- Rao, Y.; Zhu, C.; Suen, H.C.; Huang, S.; Liao, J.; Ker, D.F.E.; Tuan, R.S.; Wang, D. Tenogenic induction of human adipose-derived stem cells by soluble tendon extracellular matrix: Composition and transcriptomic analyses. Stem Cell Res. Ther. 2022, 13, 380. [Google Scholar] [CrossRef] [PubMed]
- Kazmierczak, D.; Jopek, K.; Sterzynska, K.; Ginter-Matuszewska, B.; Nowicki, M.; Rucinski, M.; Januchowski, R. The significance of micrornas expression in regulation of extracellular matrix and other drug resistant genes in drug resistant ovarian cancer cell lines. Int. J. Mol. Sci. 2020, 21, 2619. [Google Scholar] [CrossRef] [PubMed]
- Galindo-Pumariño, C.; Collado, M.; Castillo, M.E.; Barquín, J.; Romio, E.; Larriba, M.J.; Muñoz de Mier, G.J.; Carrato, A.; de la Pinta, C.; Pena, C. SNAI1-expressing fibroblasts and derived-extracellular matrix as mediators of drug resistance in colorectal cancer patients. Toxicol. Appl. Pharmacol. 2022, 450, 116171. [Google Scholar] [CrossRef]
- Jurj, A.; Ionescu, C.; Berindan-Neagoe, I.; Braicu, C. The extracellular matrix alteration, implication in modulation of drug resistance mechanism: Friends or foes? J. Exp. Clin. Cancer Res. 2022, 41, 276. [Google Scholar] [CrossRef]
- Thul, P.J.; Åkesson, L.; Wiking, M.; Mahdessian, D.; Geladaki, A.; Ait Blal, H.; Alm, T.; Asplund, A.; Björk, L.; Breckels, L.M.; et al. A subcellular map of the human proteome. Science 2017, 356, eaal3321. [Google Scholar] [CrossRef]
- Uhlen, M.; Karlsson, M.J.; Zhong, W.; Tebani, A.; Pou, C.; Mikes, J.; Lakshmikanth, T.; Forsström, B.; Edfors, F.; Odeberg, J.; et al. A genome-wide transcriptomic analysis of protein-coding genes in human blood cells. Science 2019, 366, eaax9198. [Google Scholar] [CrossRef]
- Uhlen, M.; Zhang, C.; Lee, S.; Sjöstedt, E.; Fagerberg, L.; Bidkhori, G.; Benfeitas, R.; Arif, M.; Liu, Z.; Edfors, F.; et al. A pathology atlas of the human cancer transcriptome. Science 2017, 357, 2507. [Google Scholar] [CrossRef]
- Sehgal, R.; Sheahan, K.; O’Connell, P.R.; Hanly, A.M.; Martin, S.T.; Winter, D.C. Lynch syndrome: An updated review. Genes 2014, 5, 497–507. [Google Scholar] [CrossRef]
- Valle, L.; Vilar, E.; Tavtigian, S.V.; Stoffel, E.M. Genetic predisposition to colorectal cancer: Syndromes, genes, classification of genetic variants and implications for precision medicine. J. Pathol. 2019, 247, 574–588. [Google Scholar] [CrossRef] [PubMed]
- Kuipers, E.J.; Grady, W.M.; Lieberman, D.; Seufferlein, T.; Sung, J.J.; Boelens, P.G.; van de Velde, C.J.H.; Watanabe, T. Colorectal cancer. Nat. Rev. Dis. Prim. 2015, 1, 15065. [Google Scholar] [CrossRef]
- Abdo, N.; Xia, M.; Brown, C.C.; Kosyk, O.; Huang, R.; Sakamuru, S.; Zhou, Y.-H.; Jack, J.R.; Gallins, P.; Xia, K.; et al. Population-based in vitro hazard and concentration-response assessment of chemicals: The 1000 genomes high-throughput screening study. Environ. Health Perspect. 2015, 123, 458–466. [Google Scholar] [CrossRef] [PubMed]
- Lievens, A.; Van Aelst, S.; Van den Bulcke, M.; Goetghebeur, E. Enhanced analysis of real-time PCR data by using a variable efficiency model: FPK-PCR. Nucleic Acids Res. 2012, 40, e10. [Google Scholar] [CrossRef]
- Schindelin, J.; Arganda-Carreras, I.; Frise, E.; Kaynig, V.; Longair, M.; Pietzsch, T.; Preibisch, S.; Rueden, C.; Saalfeld, S.; Schmid, B.; et al. Fiji: An open-source platform for biological-image analysis. Nat. Methods 2012, 9, 676–682. [Google Scholar] [CrossRef] [PubMed]
- Schneider, C.A.; Rasband, W.S.; Eliceiri, K.W. NIH Image to ImageJ: 25 years of image analysis. Nat. Methods 2012, 9, 671–675. [Google Scholar] [CrossRef] [PubMed]
- Goldman, M.J.; Craft, B.; Hastie, M.; Repečka, K.; McDade, F.; Kamath, A.; Banerjee, A.; Luo, Y.; Rogers, D.; Brooks, A.N.; et al. Visualizing and interpreting cancer genomics data via the Xena platform. Nat. Biotechnol. 2020, 38, 675–678. [Google Scholar] [CrossRef]
- Cerami, E.; Gao, J.; Dogrusoz, U.; Gross, B.E.; Sumer, S.O.; Aksoy, B.A.; Jacobsen, A.; Byrne, C.J.; Heuer, M.L.; Larsson, E.; et al. The cBio cancer genomics portal: An open platform for exploring multidimensional cancer genomics data. Cancer Discov. 2012, 2, 401–404. [Google Scholar] [CrossRef] [PubMed]
- Chen, D.-T.; Hernandez, J.M.; Shibata, D.; McCarthy, S.M.; Humphries, L.A.; Clark, W.; Elahi, A.; Gruidl, M.; Coppola, D.; Yeatman, T. Complementary strand microRNAs mediate acquisition of metastatic potential in colonic adenocarcinoma. J. Gastrointest. Surg. 2012, 16, 905–912; discussion 912. [Google Scholar] [CrossRef]
- Tripathi, M.K.; Deane, N.G.; Zhu, J.; An, H.; Mima, S.; Wang, X.; Padmanabhan, S.; Shi, Z.; Prodduturi, N.; Ciombor, K.K.; et al. Nuclear factor of activated T-cell activity is associated with metastatic capacity in colon cancer. Cancer Res. 2014, 74, 6947–6957. [Google Scholar] [CrossRef]
- Del Rio, M.; Mollevi, C.; Bibeau, F.; Vie, N.; Selves, J.; Emile, J.F.; Roger, P.; Gongora, C.; Robert, J.; Tubiana-Mathieu, N.; et al. Molecular subtypes of metastatic colorectal cancer are associated with patient response to irinotecan-based therapies. Eur. J. Cancer 2017, 76, 68–75. [Google Scholar] [CrossRef] [PubMed]
- Hu, Y.; Gaedcke, J.; Emons, G.; Beissbarth, T.; Grade, M.; Jo, P.; Yeager, M.; Chanock, S.J.; Wolff, H.; Camps, J.; et al. Colorectal cancer susceptibility loci as predictive markers of rectal cancer prognosis after surgery. Genes Chromosomes Cancer 2018, 57, 140–149. [Google Scholar] [CrossRef]
- Smirnov, P.; Safikhani, Z.; El-Hachem, N.; Wang, D.; She, A.; Olsen, C.; Freeman, M.; Selby, H.; Gendoo, D.M.A.; Grossmann, P.; et al. PharmacoGx: An R package for analysis of large pharmacogenomic datasets. Bioinformatics 2016, 32, 1244–1246. [Google Scholar] [CrossRef] [PubMed]
- Rentzsch, P.; Schubach, M.; Shendure, J.; Kircher, M. CADD-Splice-improving genome-wide variant effect prediction using deep learning-derived splice scores. Genome Med. 2021, 13, 31. [Google Scholar] [CrossRef]
- Bendl, J.; Musil, M.; Štourač, J.; Zendulka, J.; Damborský, J.; Brezovský, J. Predictsnp2: A unified platform for accurately evaluating SNP effects by exploiting the different characteristics of variants in distinct genomic regions. PLoS Comput. Biol. 2016, 12, e1004962. [Google Scholar] [CrossRef] [PubMed]
- Bahcall, O. FunSeq for cancer genomics. Nat. Genet. 2013, 45, 1273. [Google Scholar] [CrossRef]
- Ritchie, G.R.S.; Dunham, I.; Zeggini, E.; Flicek, P. Functional annotation of noncoding sequence variants. Nat. Methods 2014, 11, 294–296. [Google Scholar] [CrossRef] [PubMed]
- Quang, D.; Chen, Y.; Xie, X. DANN: A deep learning approach for annotating the pathogenicity of genetic variants. Bioinformatics 2015, 31, 761–763. [Google Scholar] [CrossRef]
- Shihab, H.A.; Gough, J.; Mort, M.; Cooper, D.N.; Day, I.N.M.; Gaunt, T.R. Ranking non-synonymous single nucleotide polymorphisms based on disease concepts. Hum Genomics 2014, 8, 11. [Google Scholar] [CrossRef]


Disclaimer/Publisher’s Note: The statements, opinions and data contained in all publications are solely those of the individual author(s) and contributor(s) and not of MDPI and/or the editor(s). MDPI and/or the editor(s) disclaim responsibility for any injury to people or property resulting from any ideas, methods, instructions or products referred to in the content. |
© 2023 by the authors. Licensee MDPI, Basel, Switzerland. This article is an open access article distributed under the terms and conditions of the Creative Commons Attribution (CC BY) license (https://creativecommons.org/licenses/by/4.0/).
Share and Cite
Gonzalez, R.D.; Small, G.W.; Green, A.J.; Akhtari, F.S.; Motsinger-Reif, A.A.; Quintanilha, J.C.F.; Havener, T.M.; Reif, D.M.; McLeod, H.L.; Wiltshire, T. MKX-AS1 Gene Expression Associated with Variation in Drug Response to Oxaliplatin and Clinical Outcomes in Colorectal Cancer Patients. Pharmaceuticals 2023, 16, 757. https://doi.org/10.3390/ph16050757
Gonzalez RD, Small GW, Green AJ, Akhtari FS, Motsinger-Reif AA, Quintanilha JCF, Havener TM, Reif DM, McLeod HL, Wiltshire T. MKX-AS1 Gene Expression Associated with Variation in Drug Response to Oxaliplatin and Clinical Outcomes in Colorectal Cancer Patients. Pharmaceuticals. 2023; 16(5):757. https://doi.org/10.3390/ph16050757
Chicago/Turabian StyleGonzalez, Ricardo D., George W. Small, Adrian J. Green, Farida S. Akhtari, Alison A. Motsinger-Reif, Julia C. F. Quintanilha, Tammy M. Havener, David M. Reif, Howard L. McLeod, and Tim Wiltshire. 2023. "MKX-AS1 Gene Expression Associated with Variation in Drug Response to Oxaliplatin and Clinical Outcomes in Colorectal Cancer Patients" Pharmaceuticals 16, no. 5: 757. https://doi.org/10.3390/ph16050757