
Biomarker Quantification, Spectroscopic, and Molecular Docking Studies of the Active Compounds Isolated from the Edible Plant Sisymbrium irio L.
 , ,
, ,  , , , , ,
Abstract
:1. Introduction
2. Results
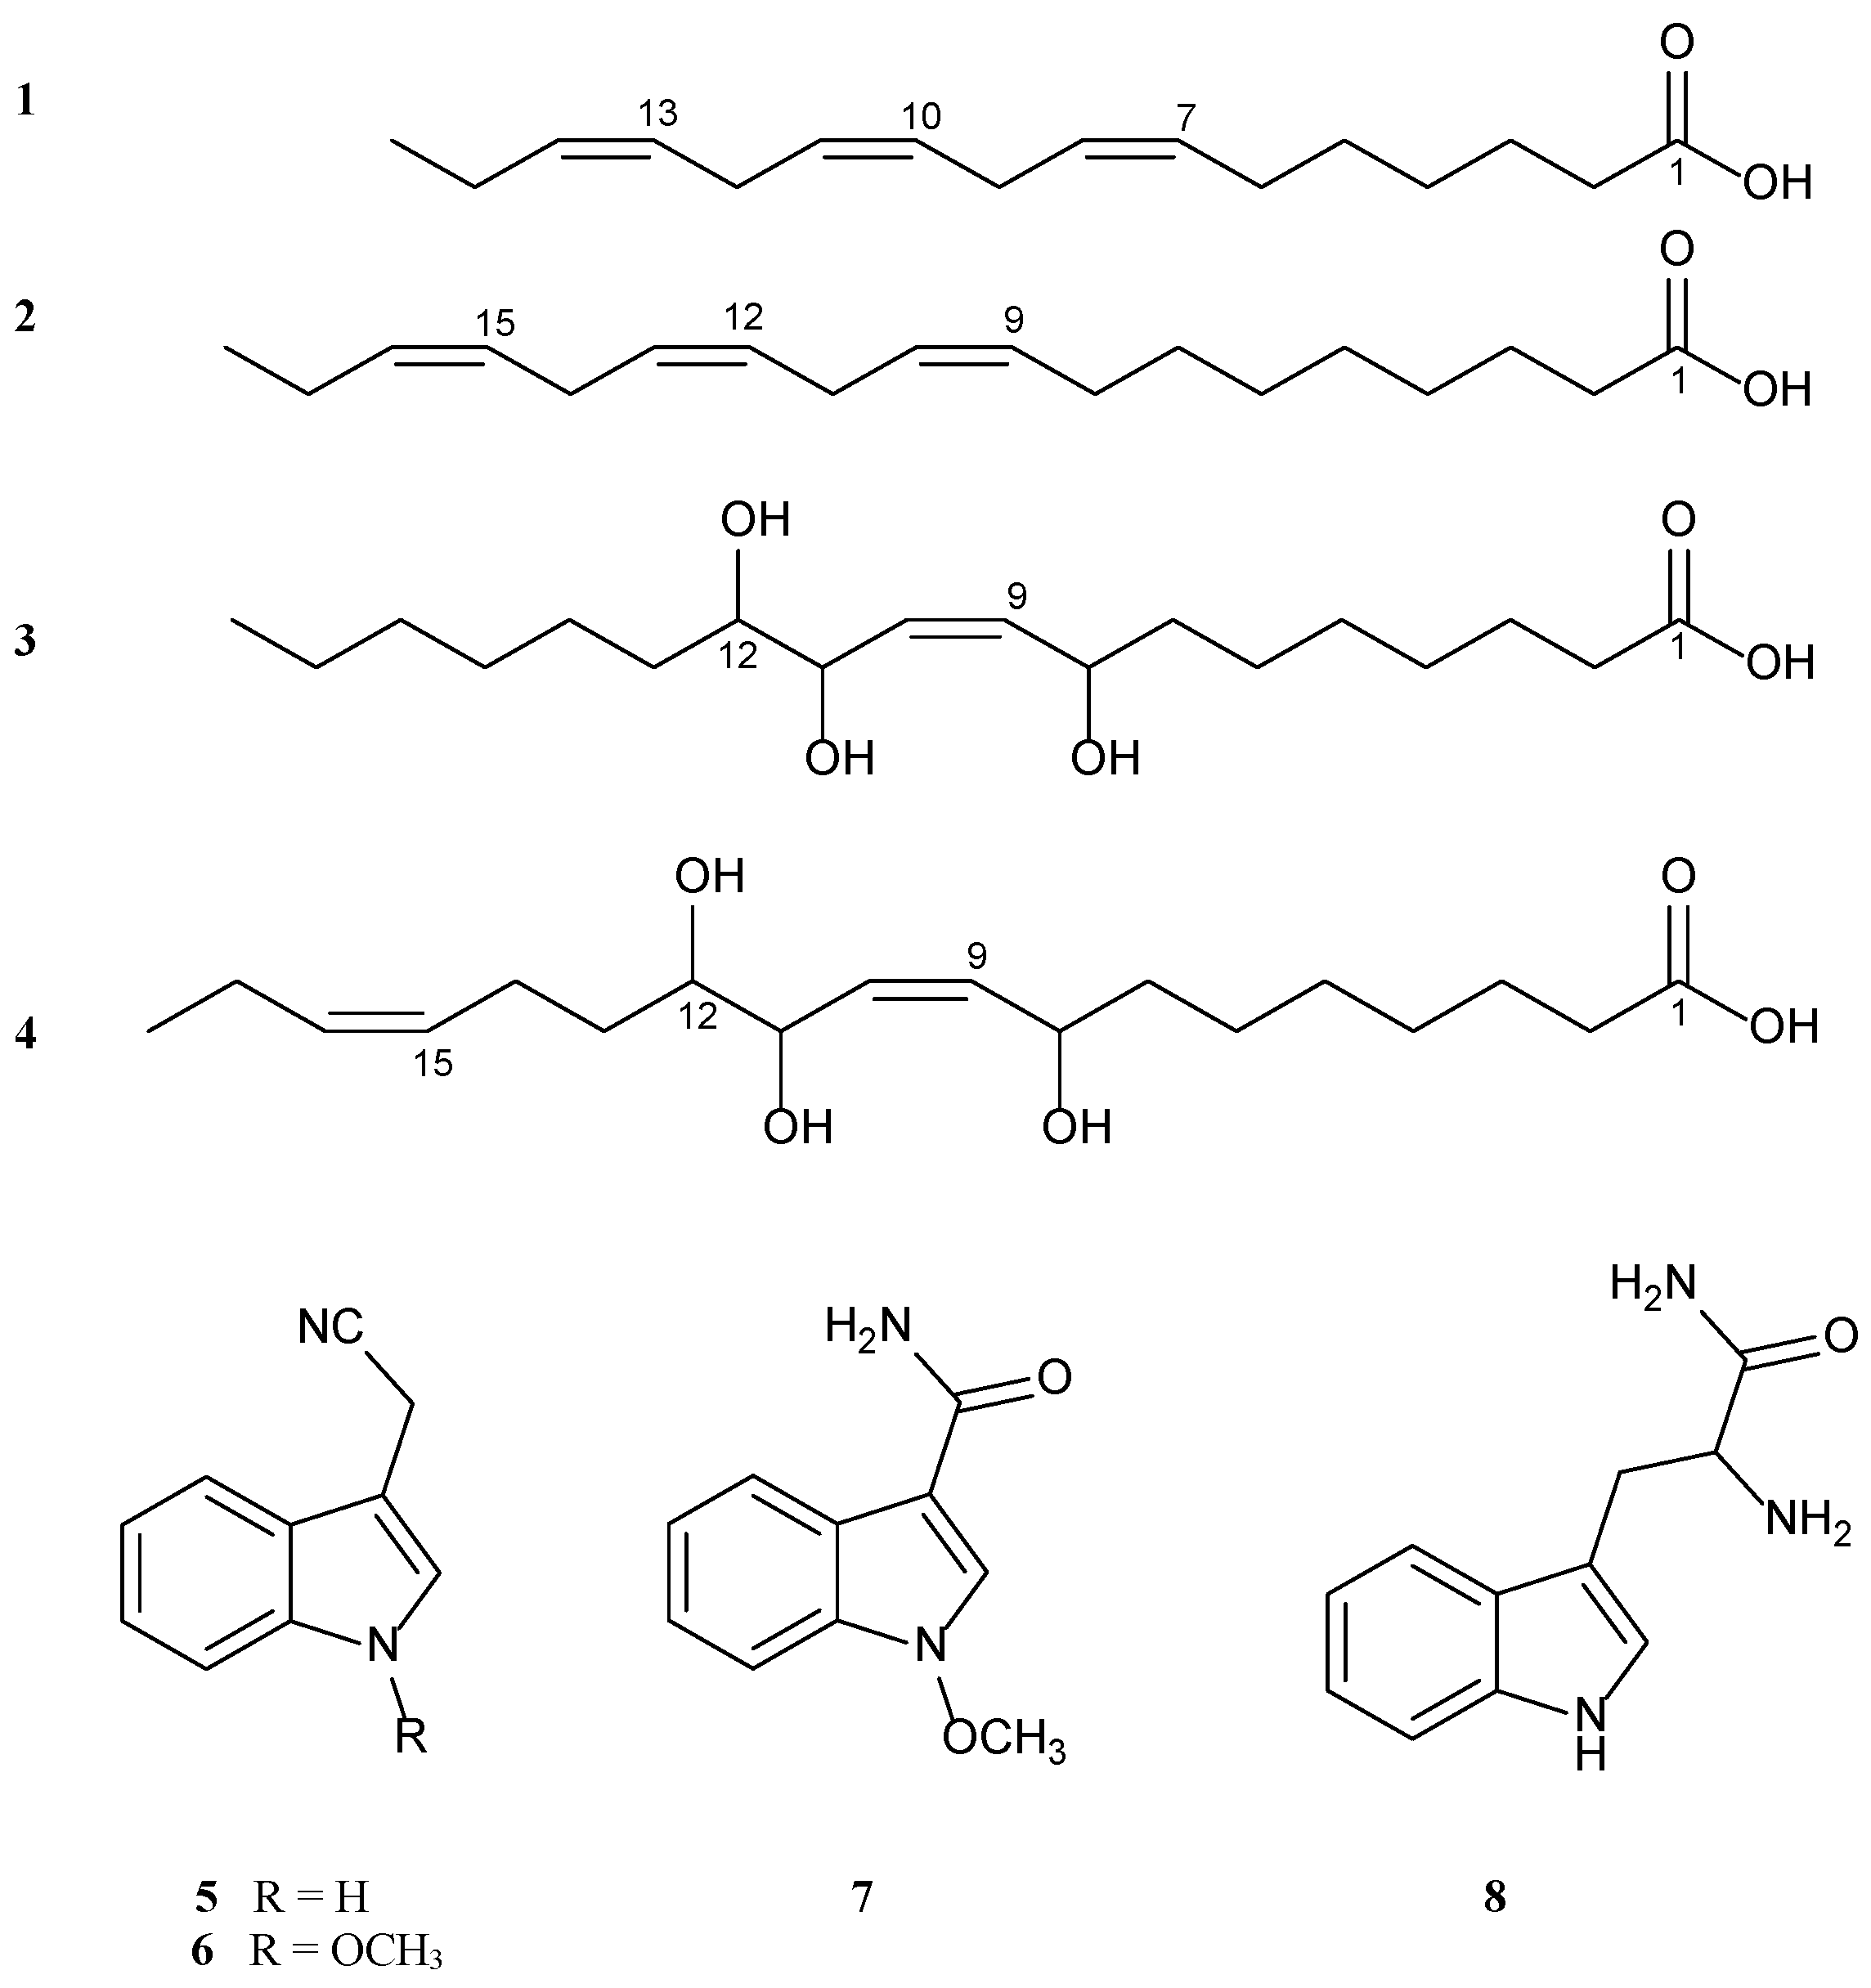
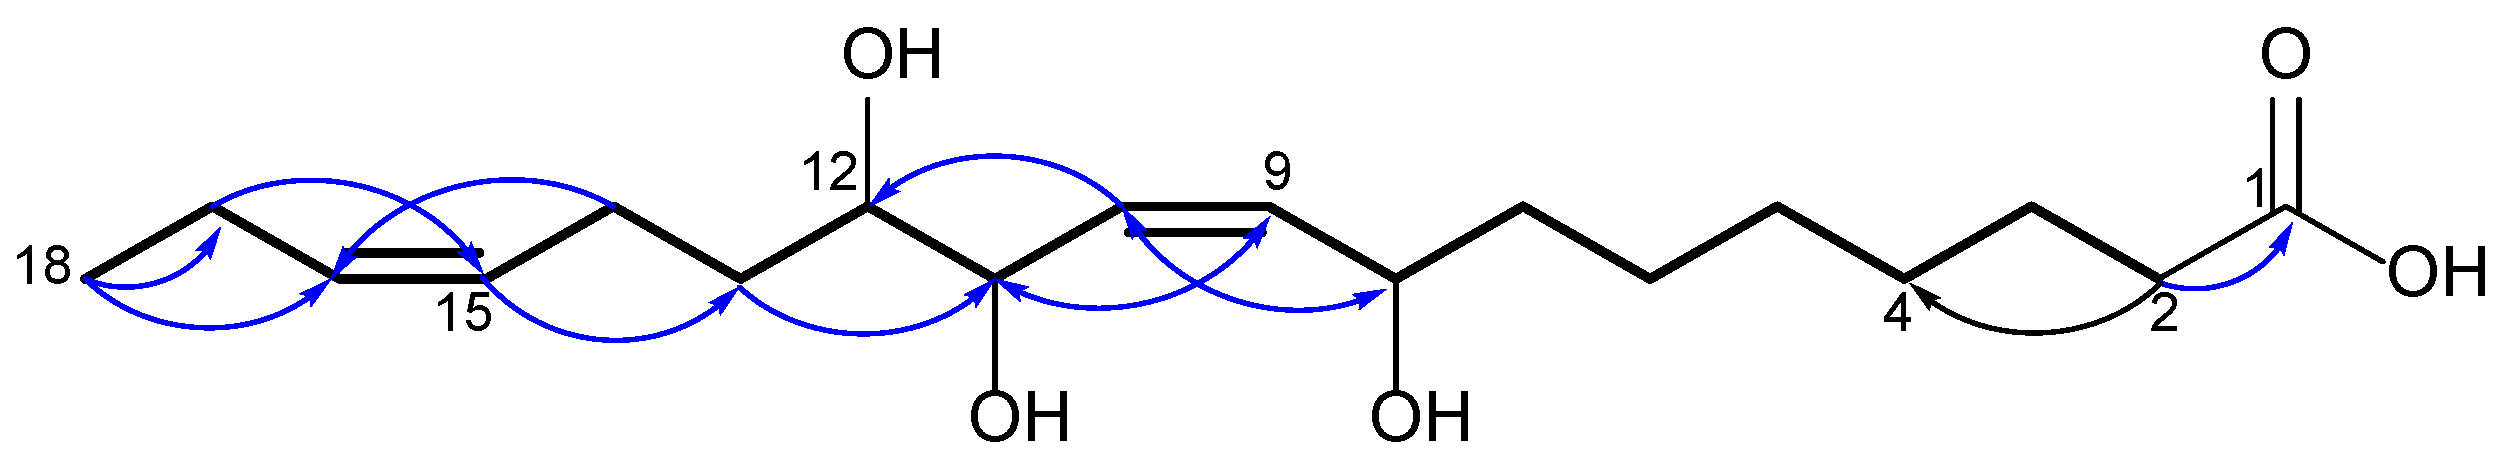
2.1. Identification of Isolated Compounds
2.2. Analysis of Molecular Docking
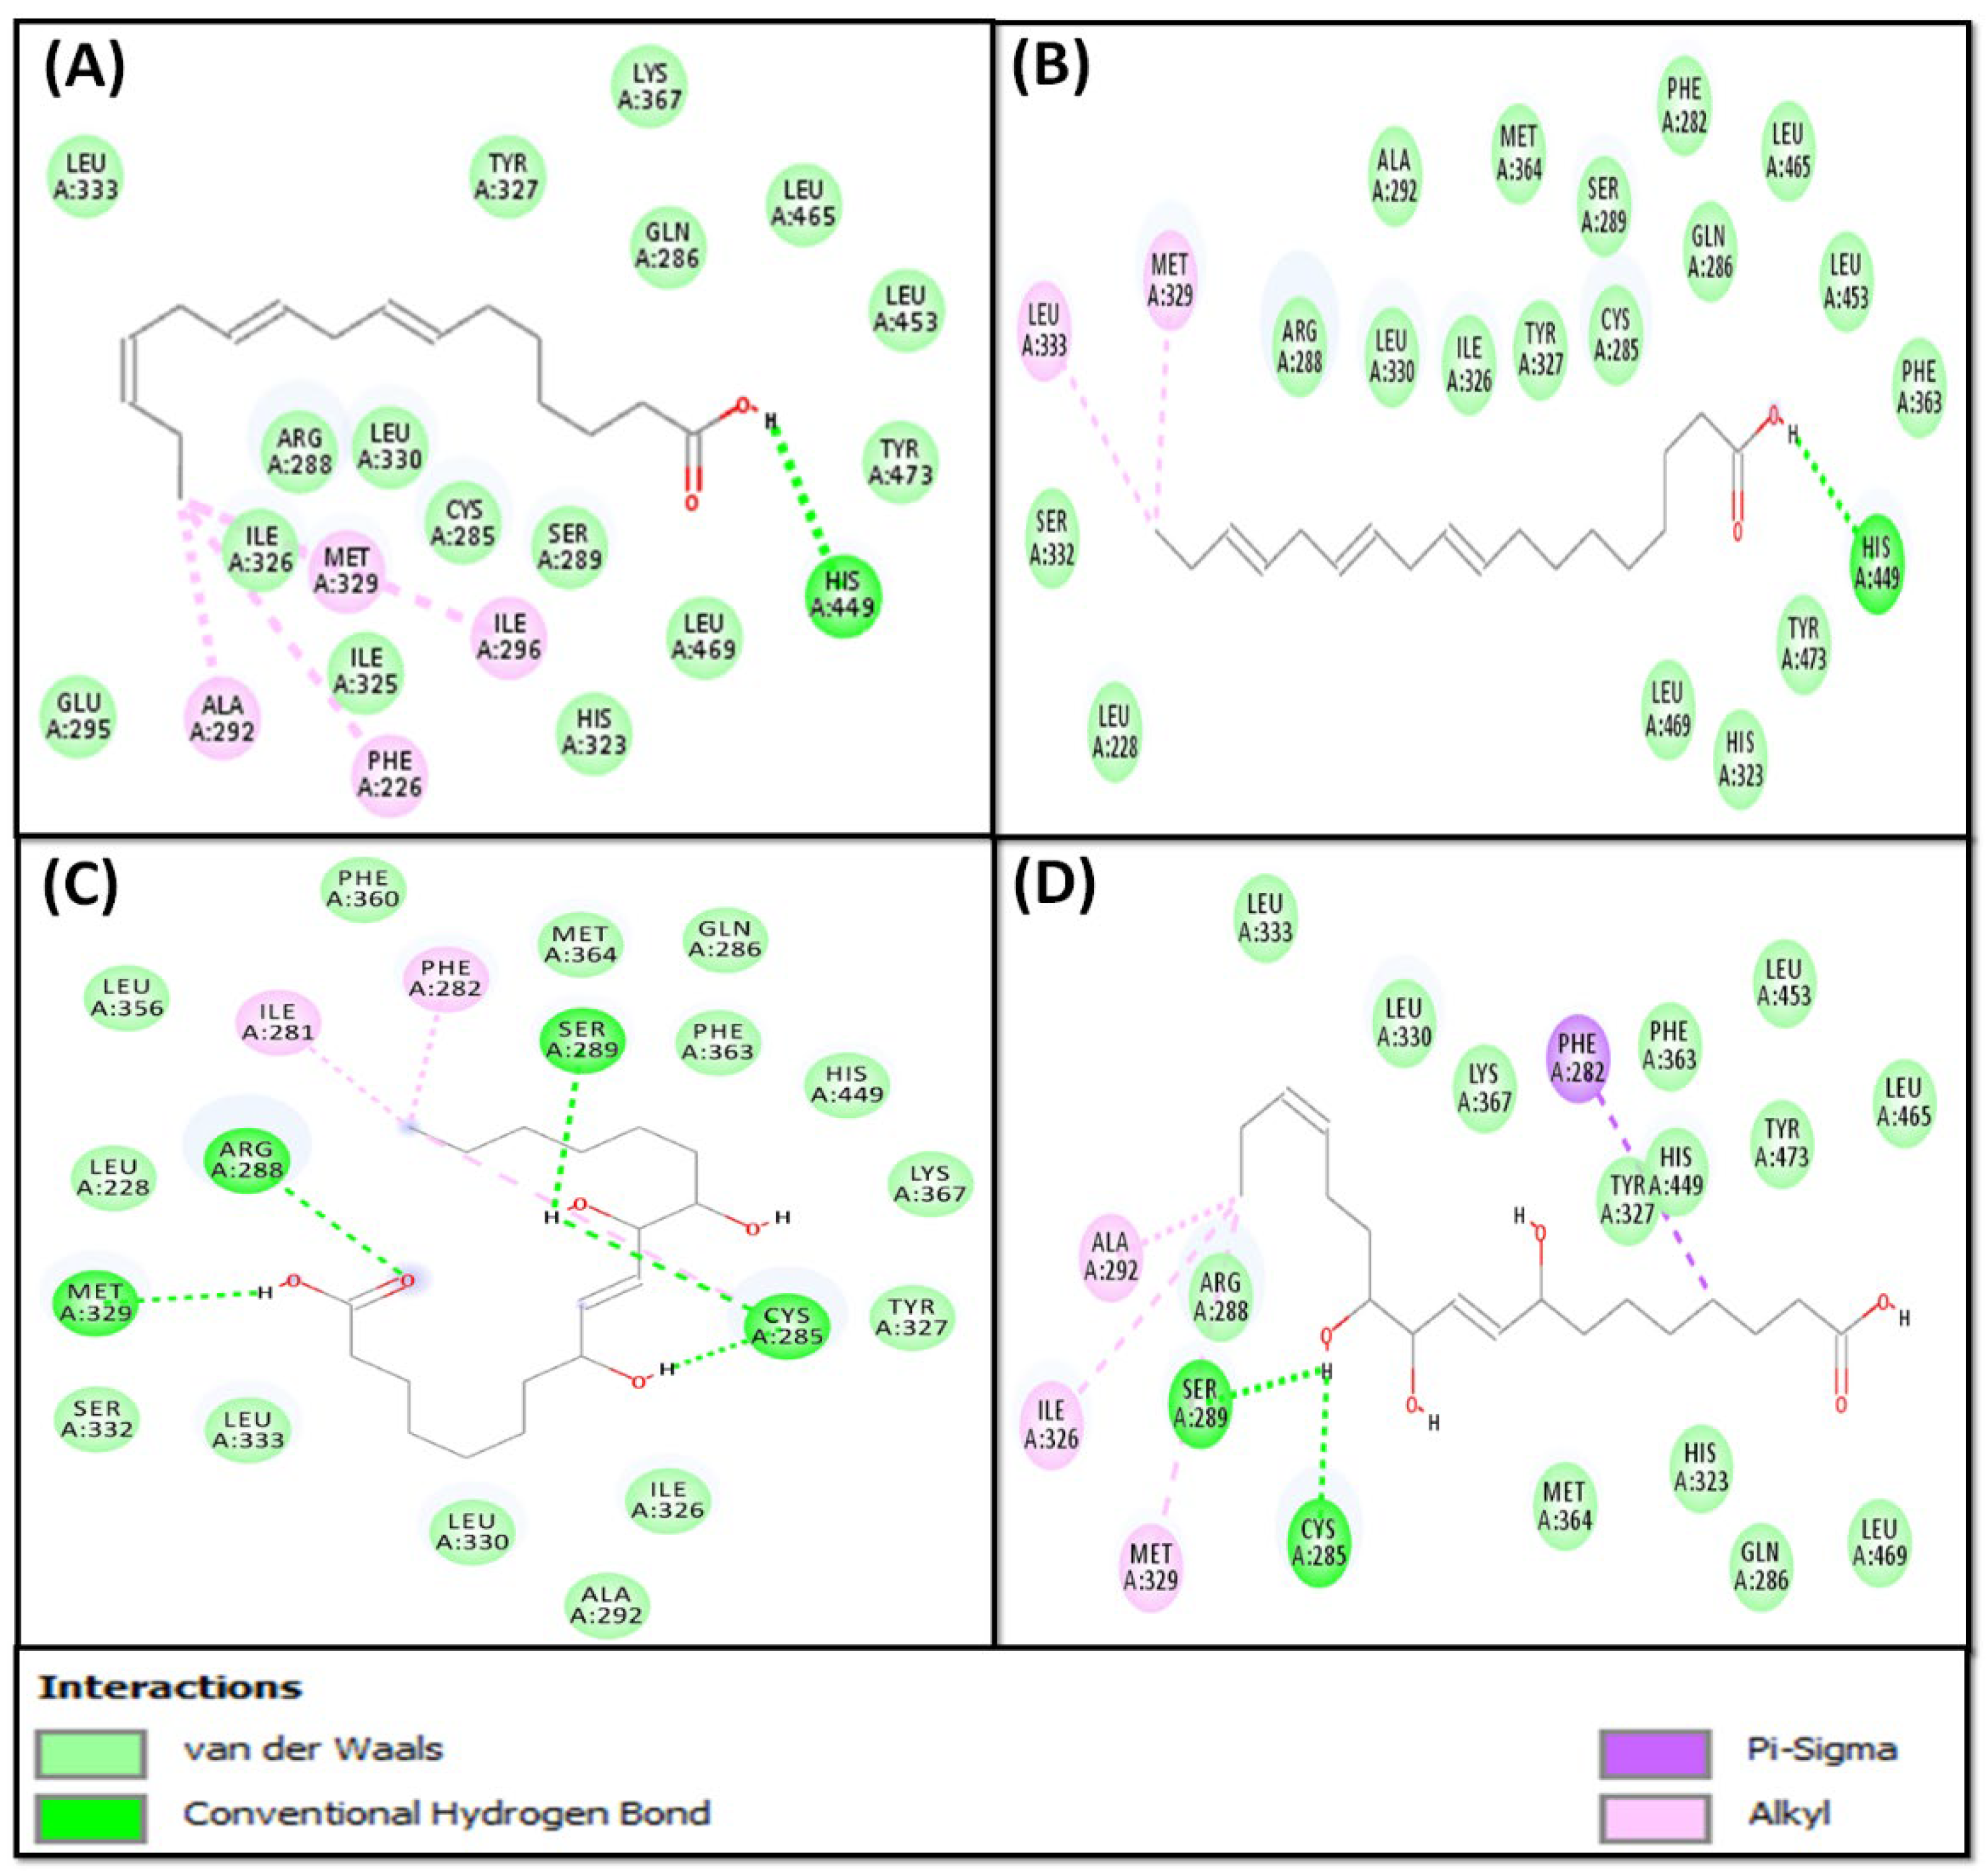
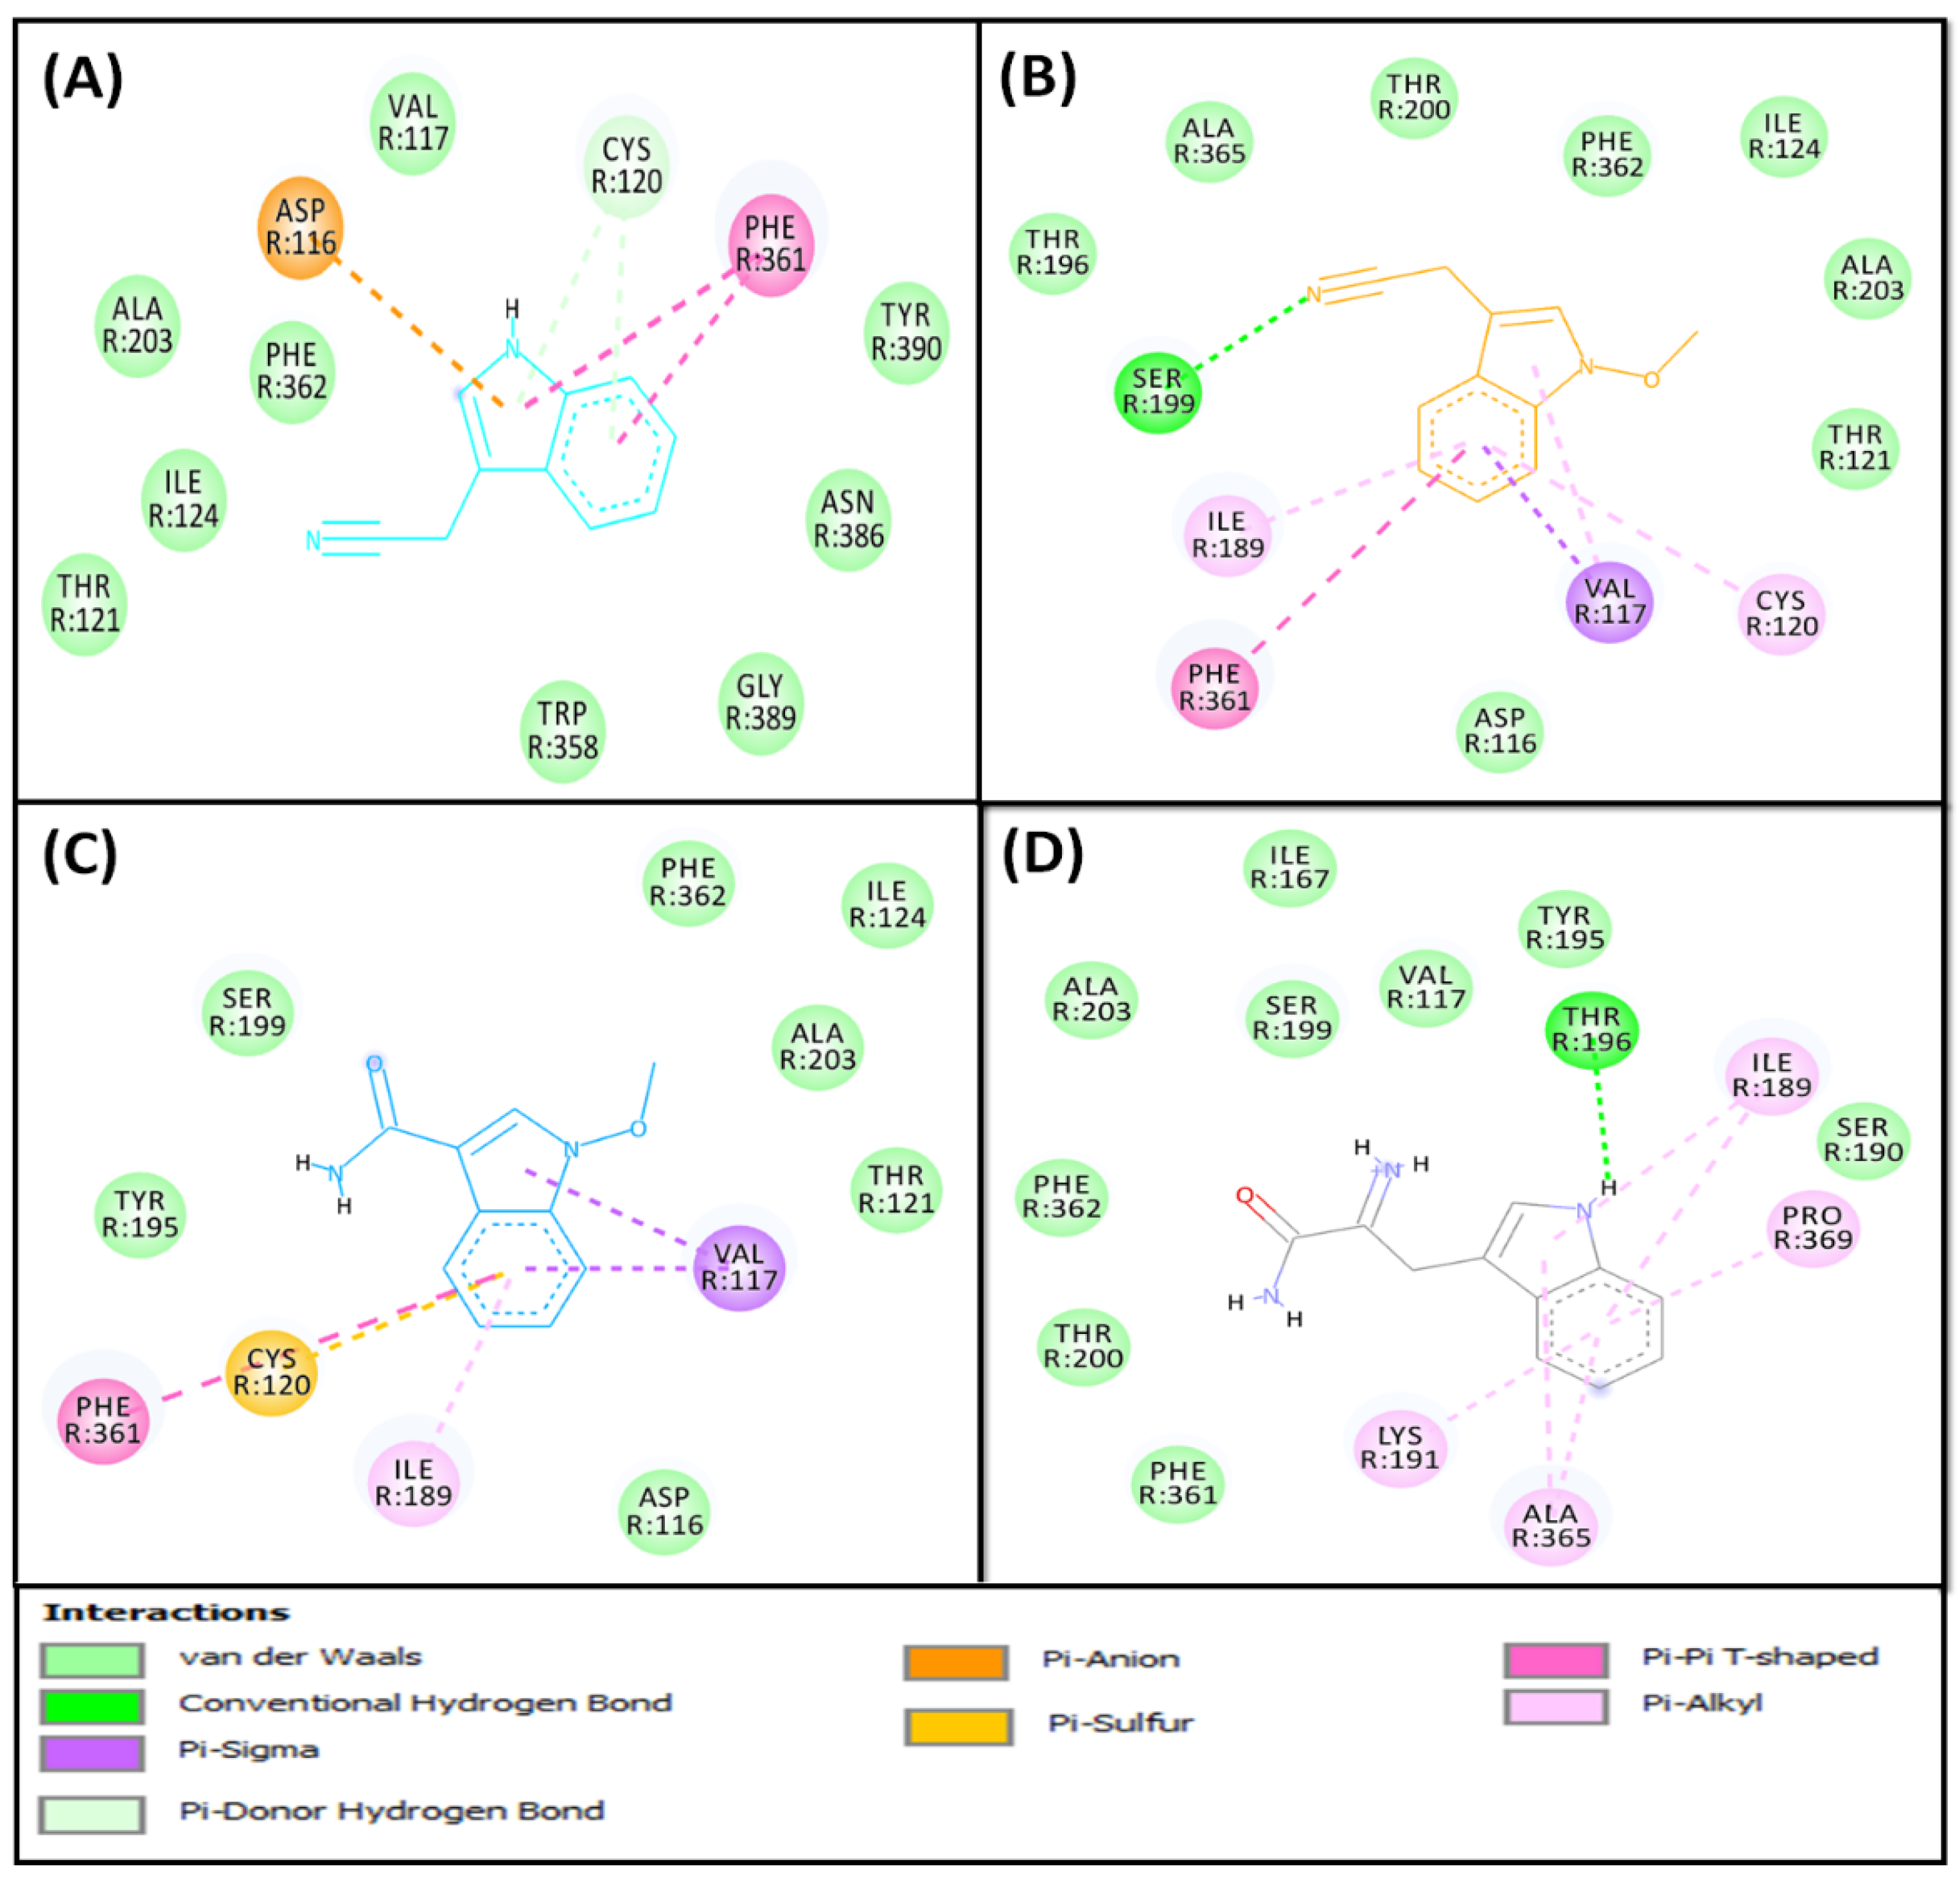
2.2.1. Molecular Docking of Fatty Acids (1–4) with PPAR-γ
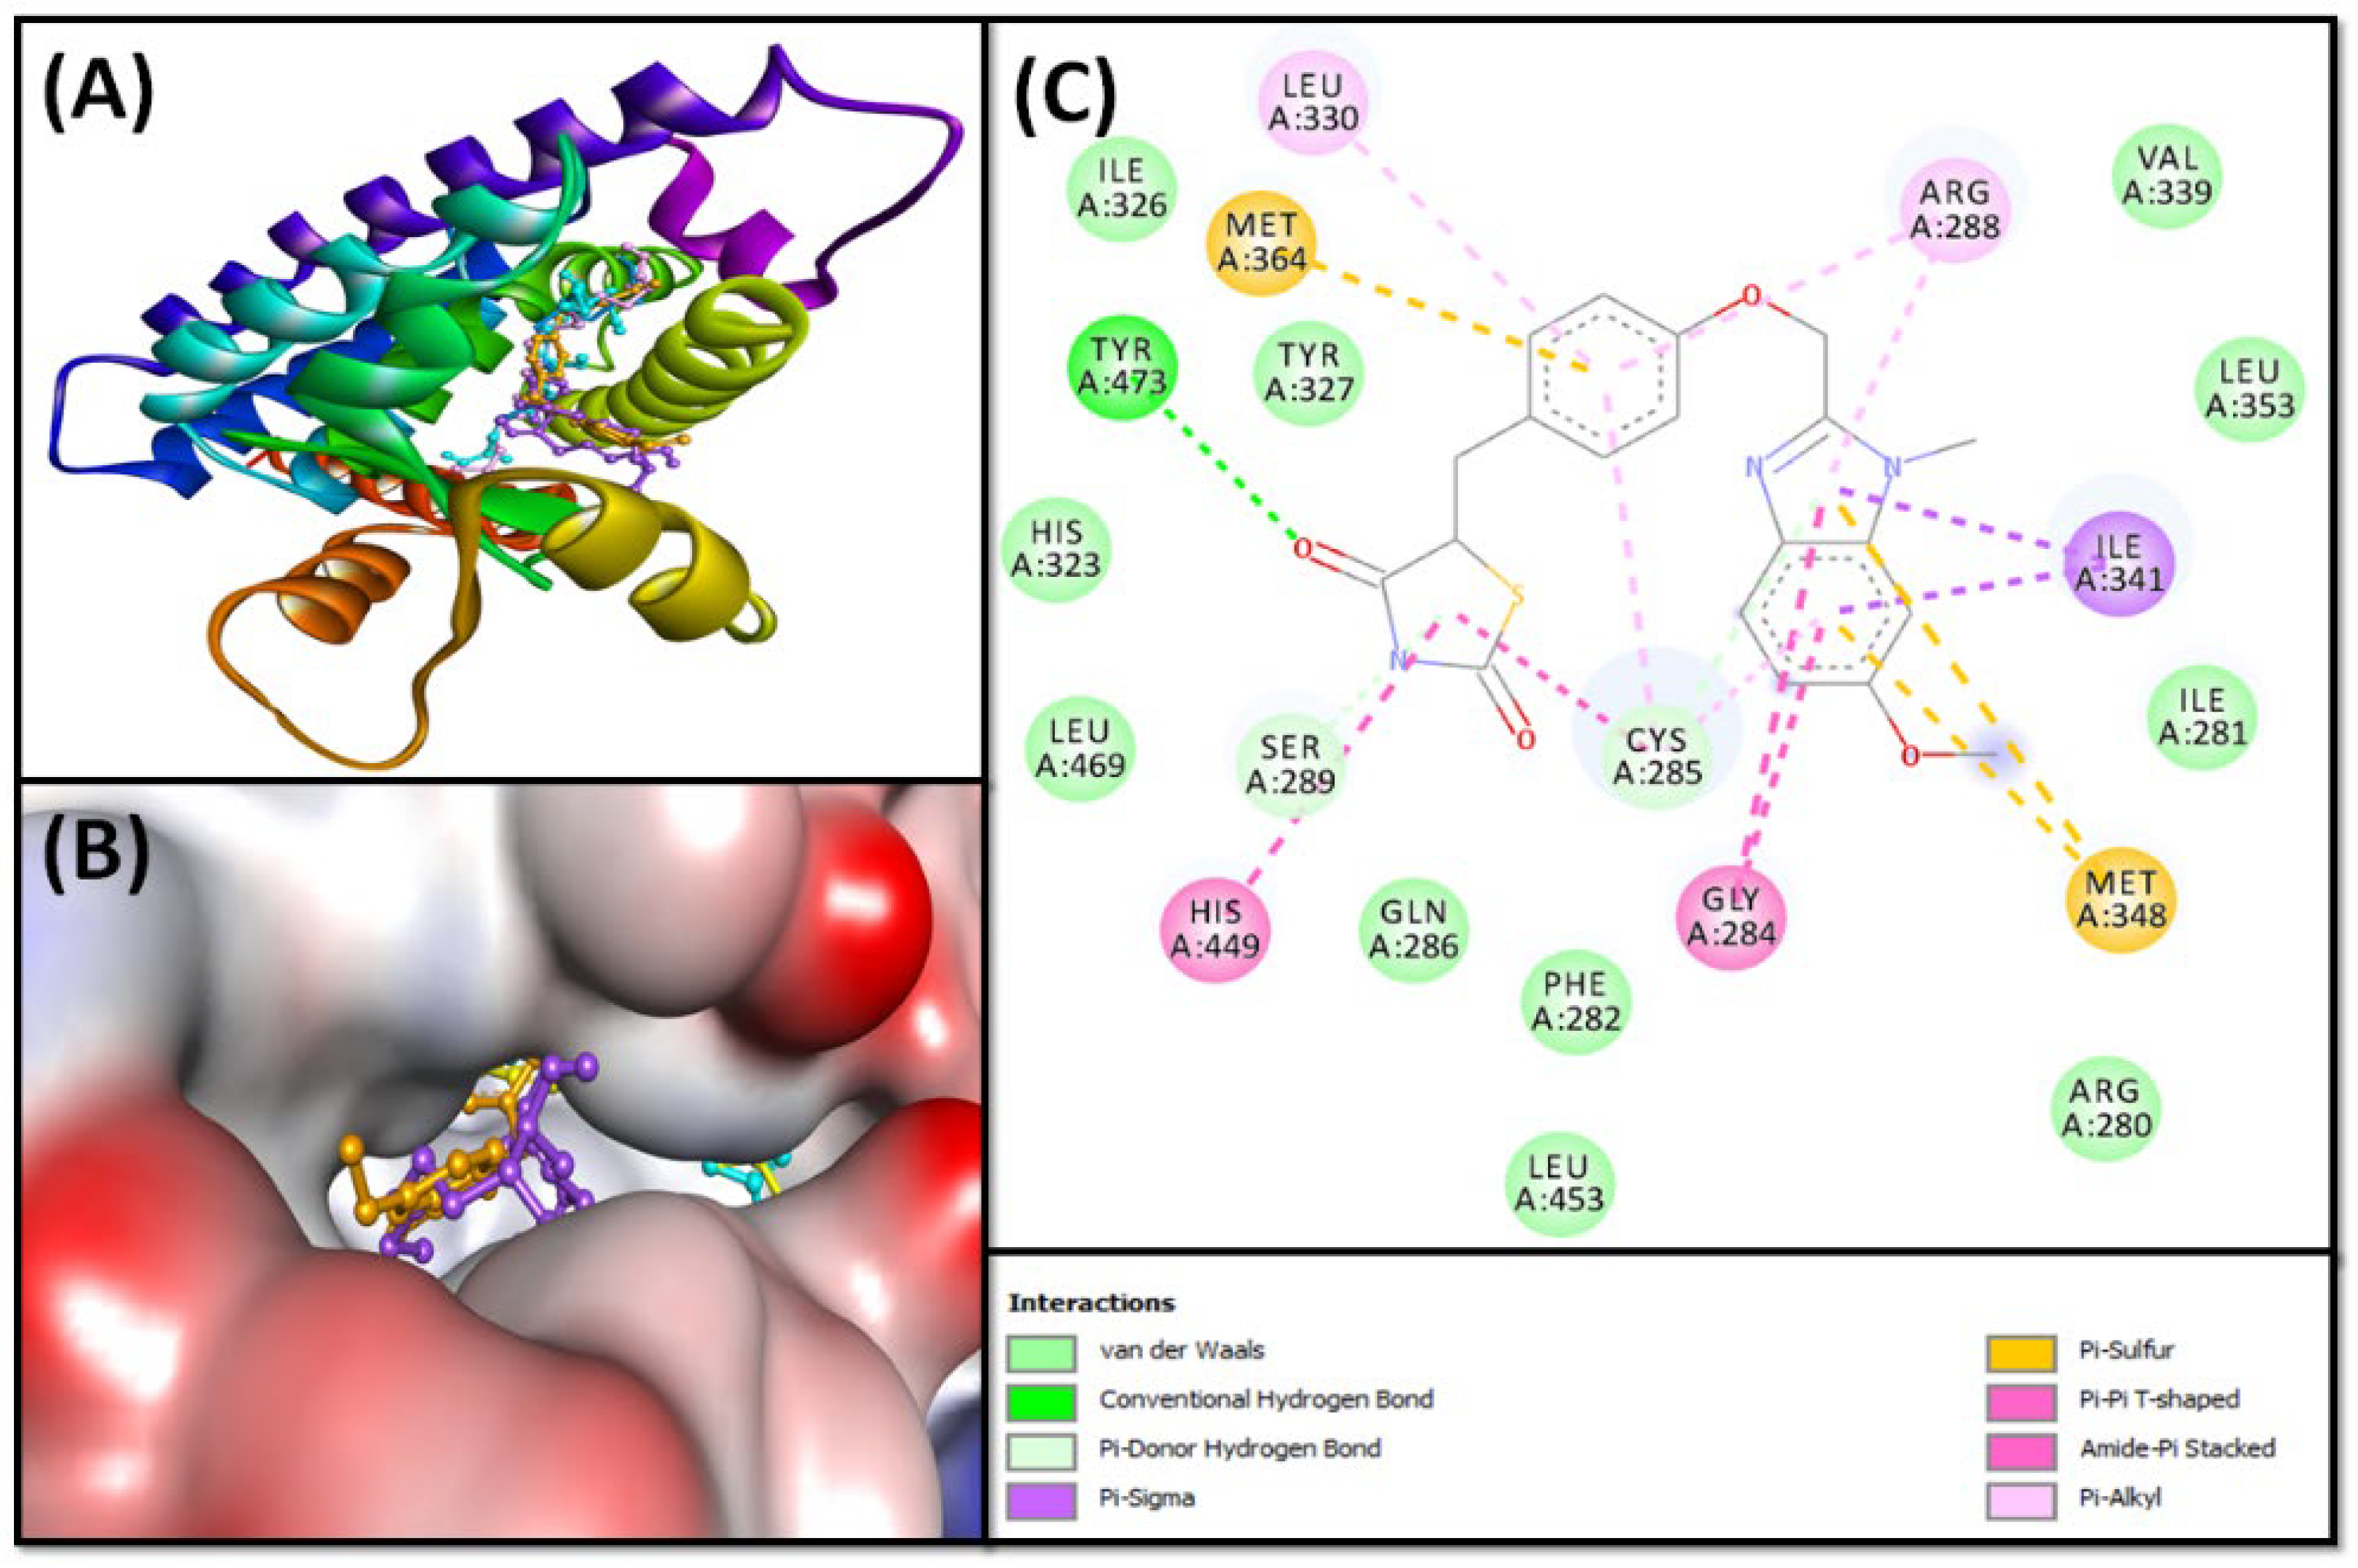
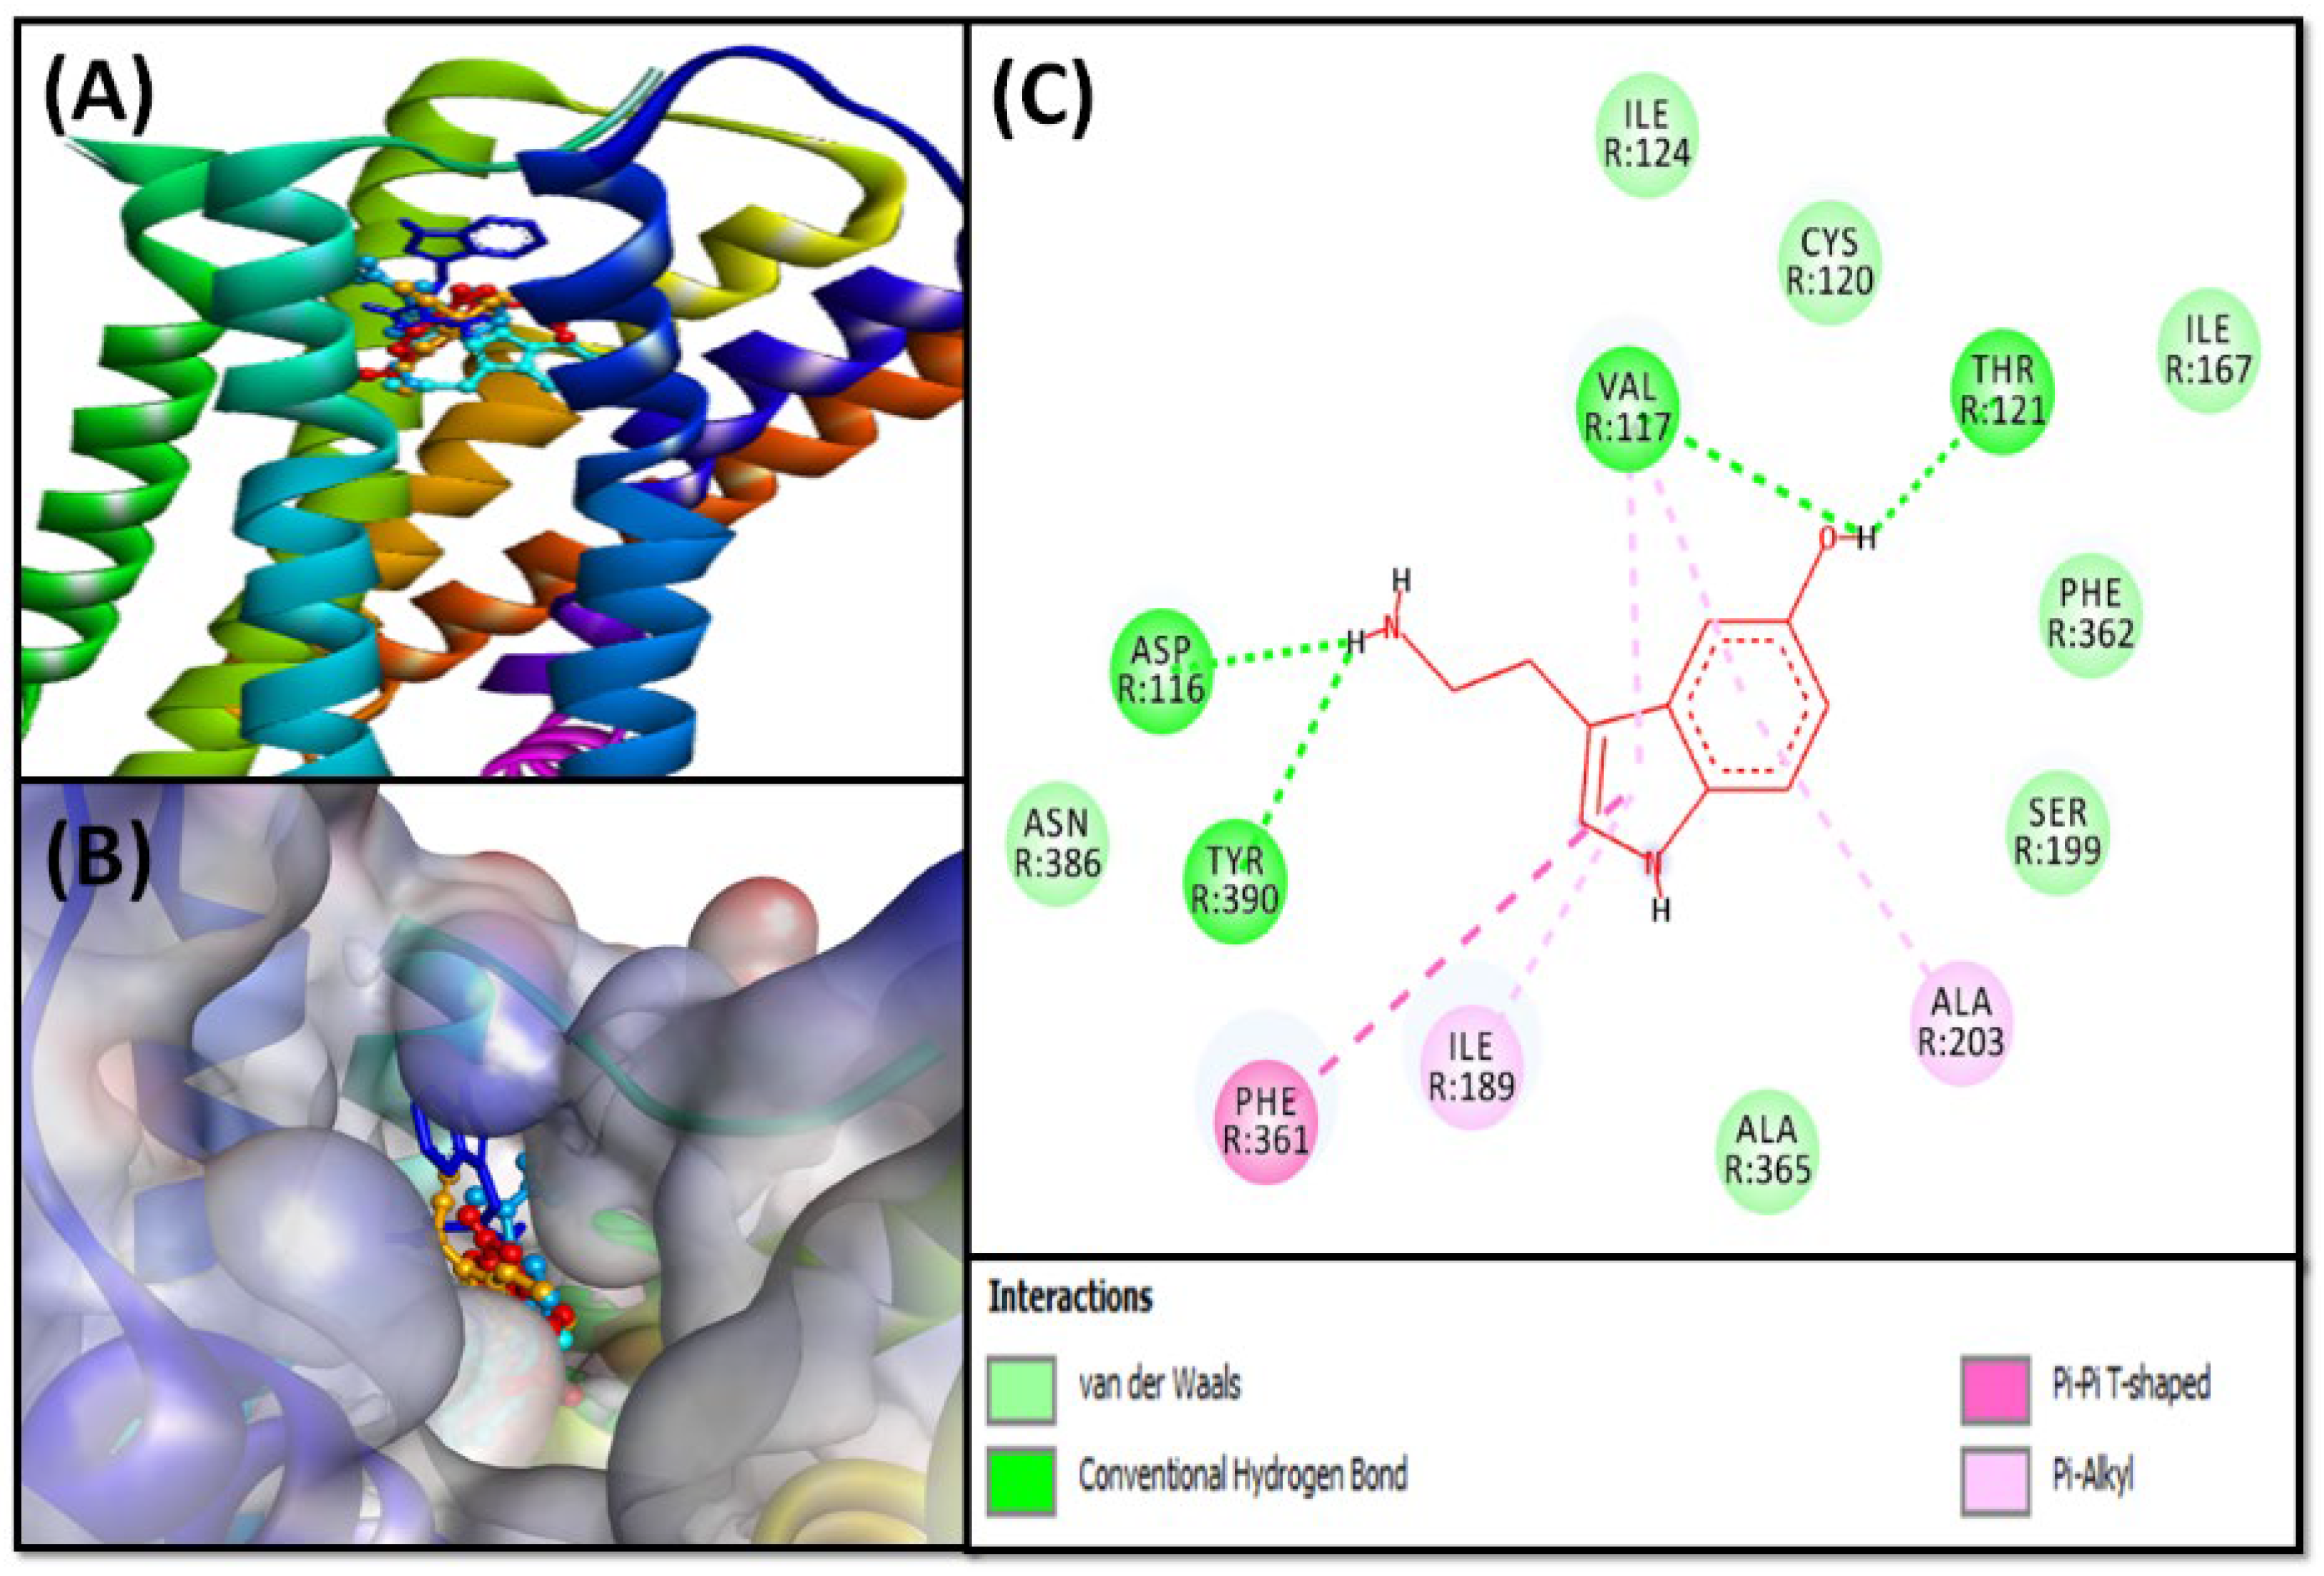
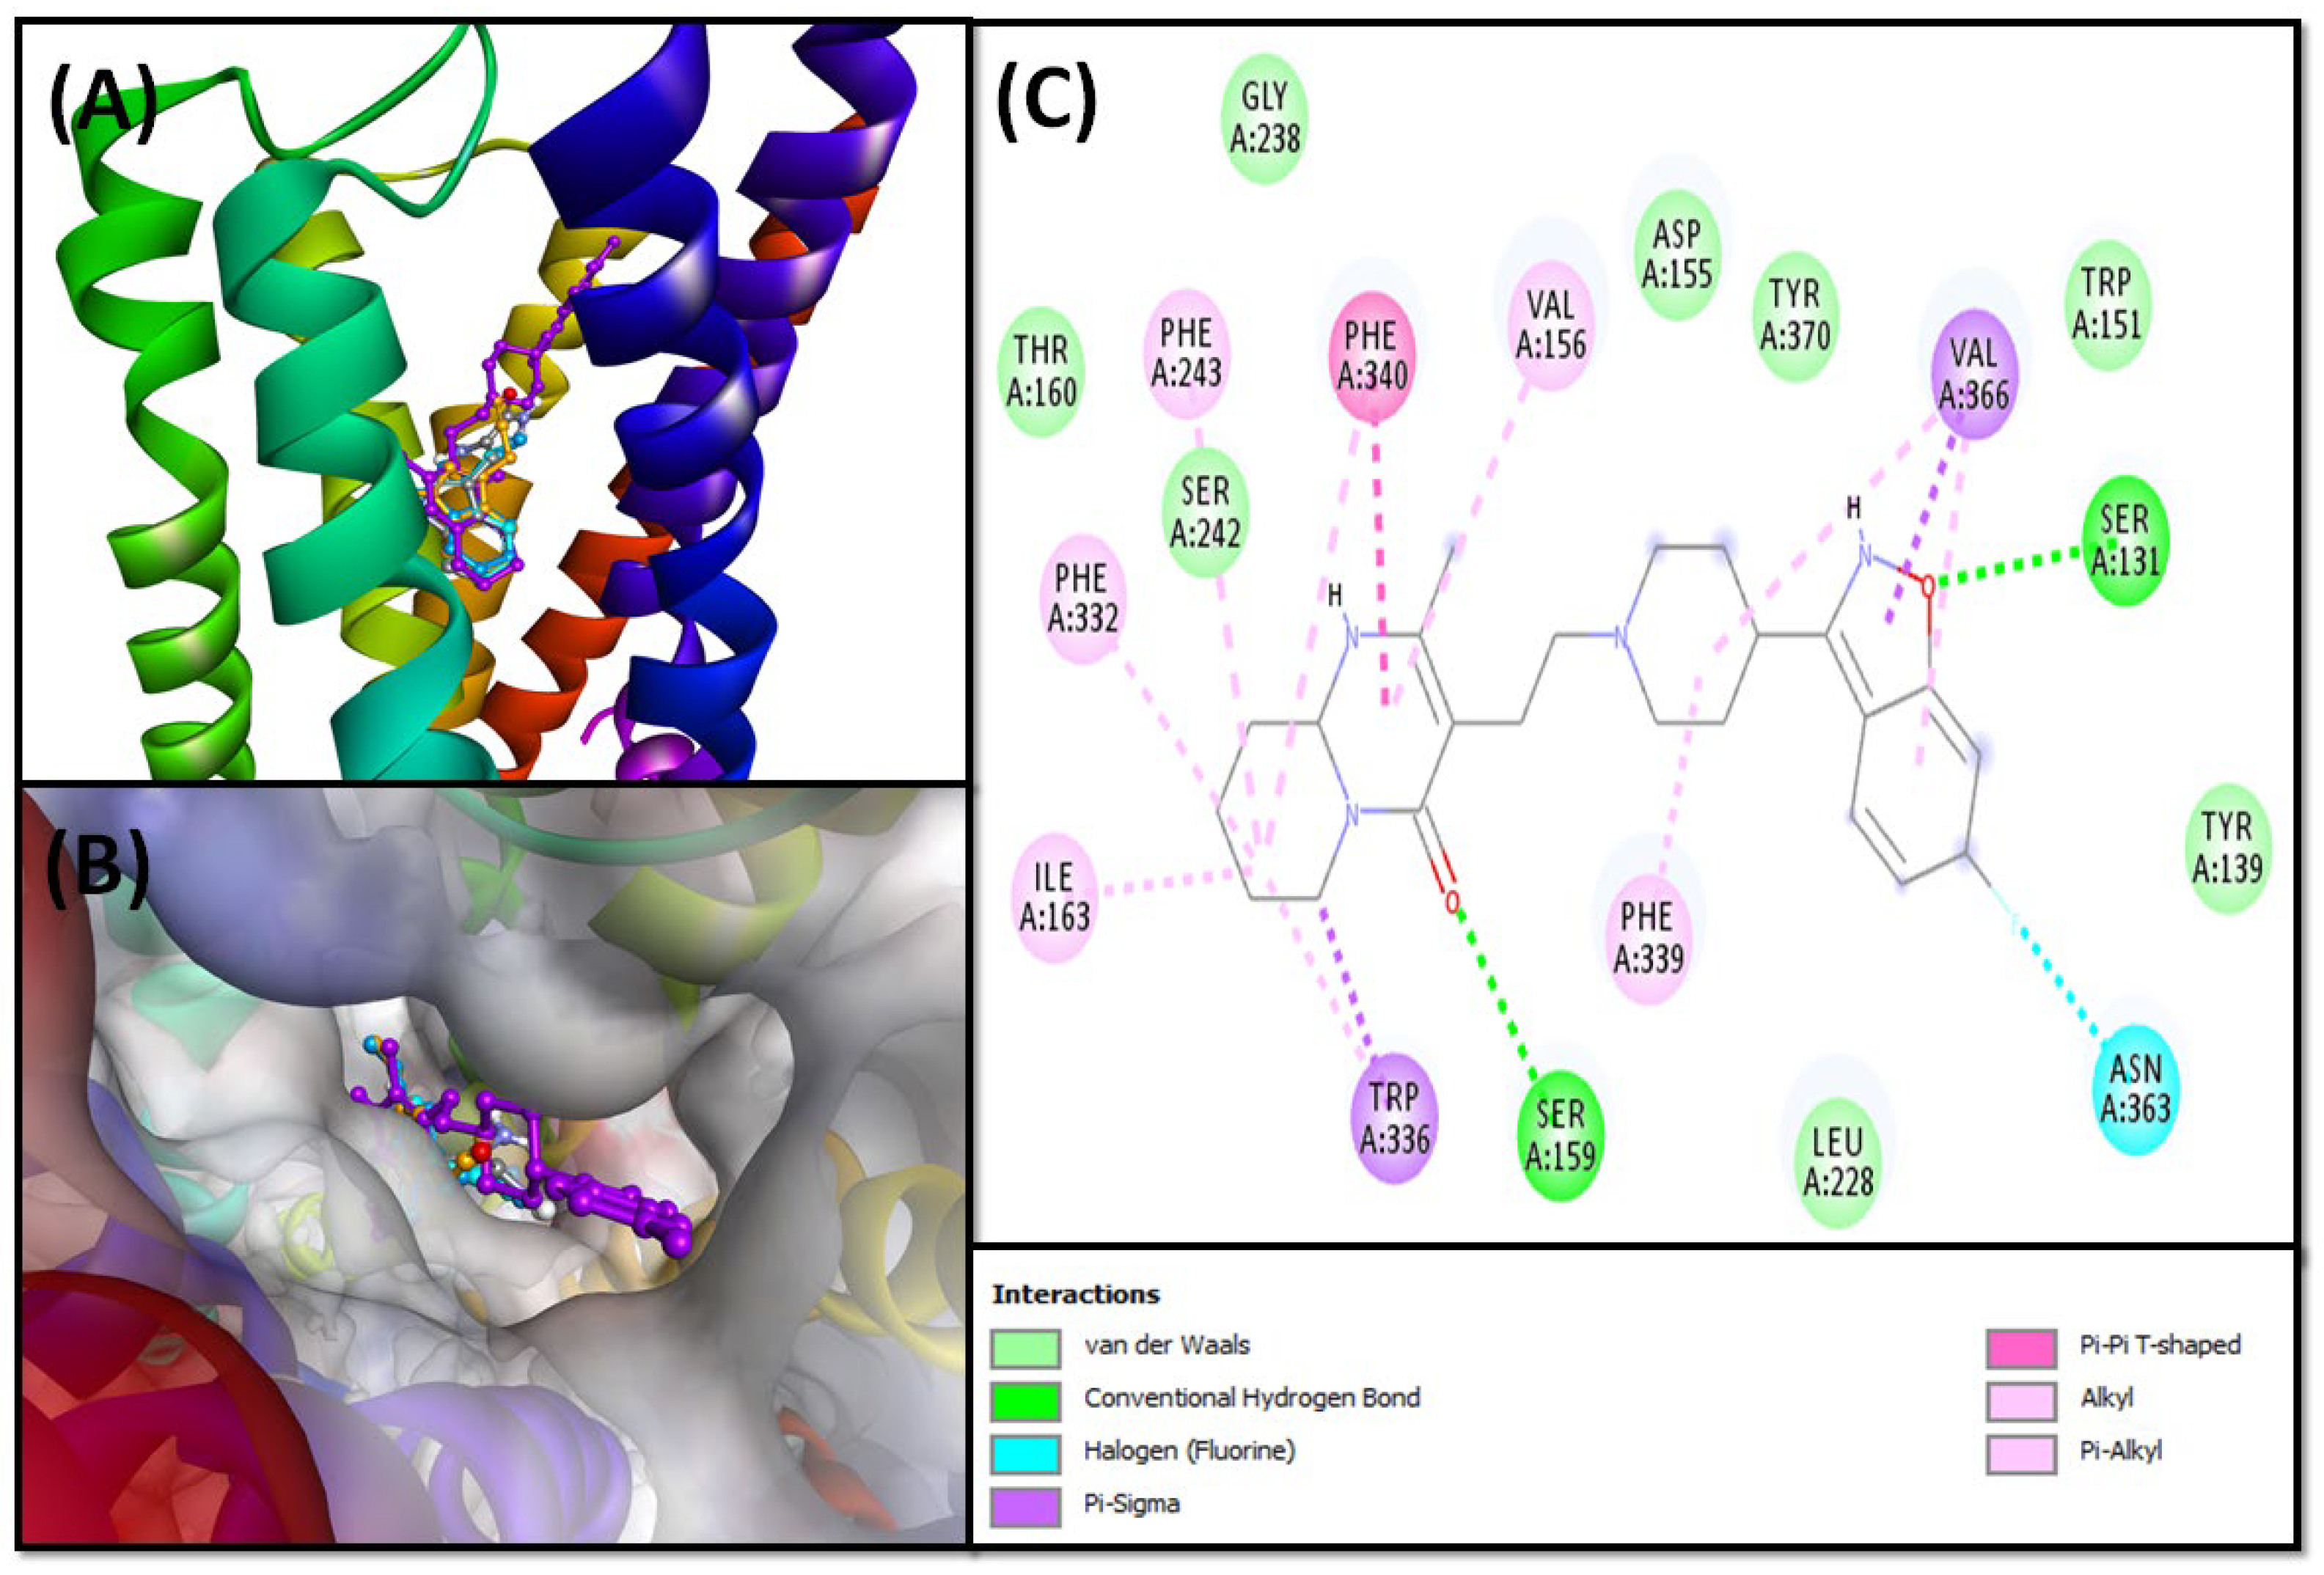
2.2.2. Molecular Docking of Compounds 5–8 with 5-HT1A and 5-HT2A Serotonin Receptors
5-HT1A Binding Interaction
5-HT2A Binding Interaction
2.3. Prediction of Physicochemical, Pharmacokinetic, Drug-Likeness, and Toxicity
2.4. Analysis of Free Energy Calculations
2.5. Analysis of Moelcular Dynamics Simulation (MDS)
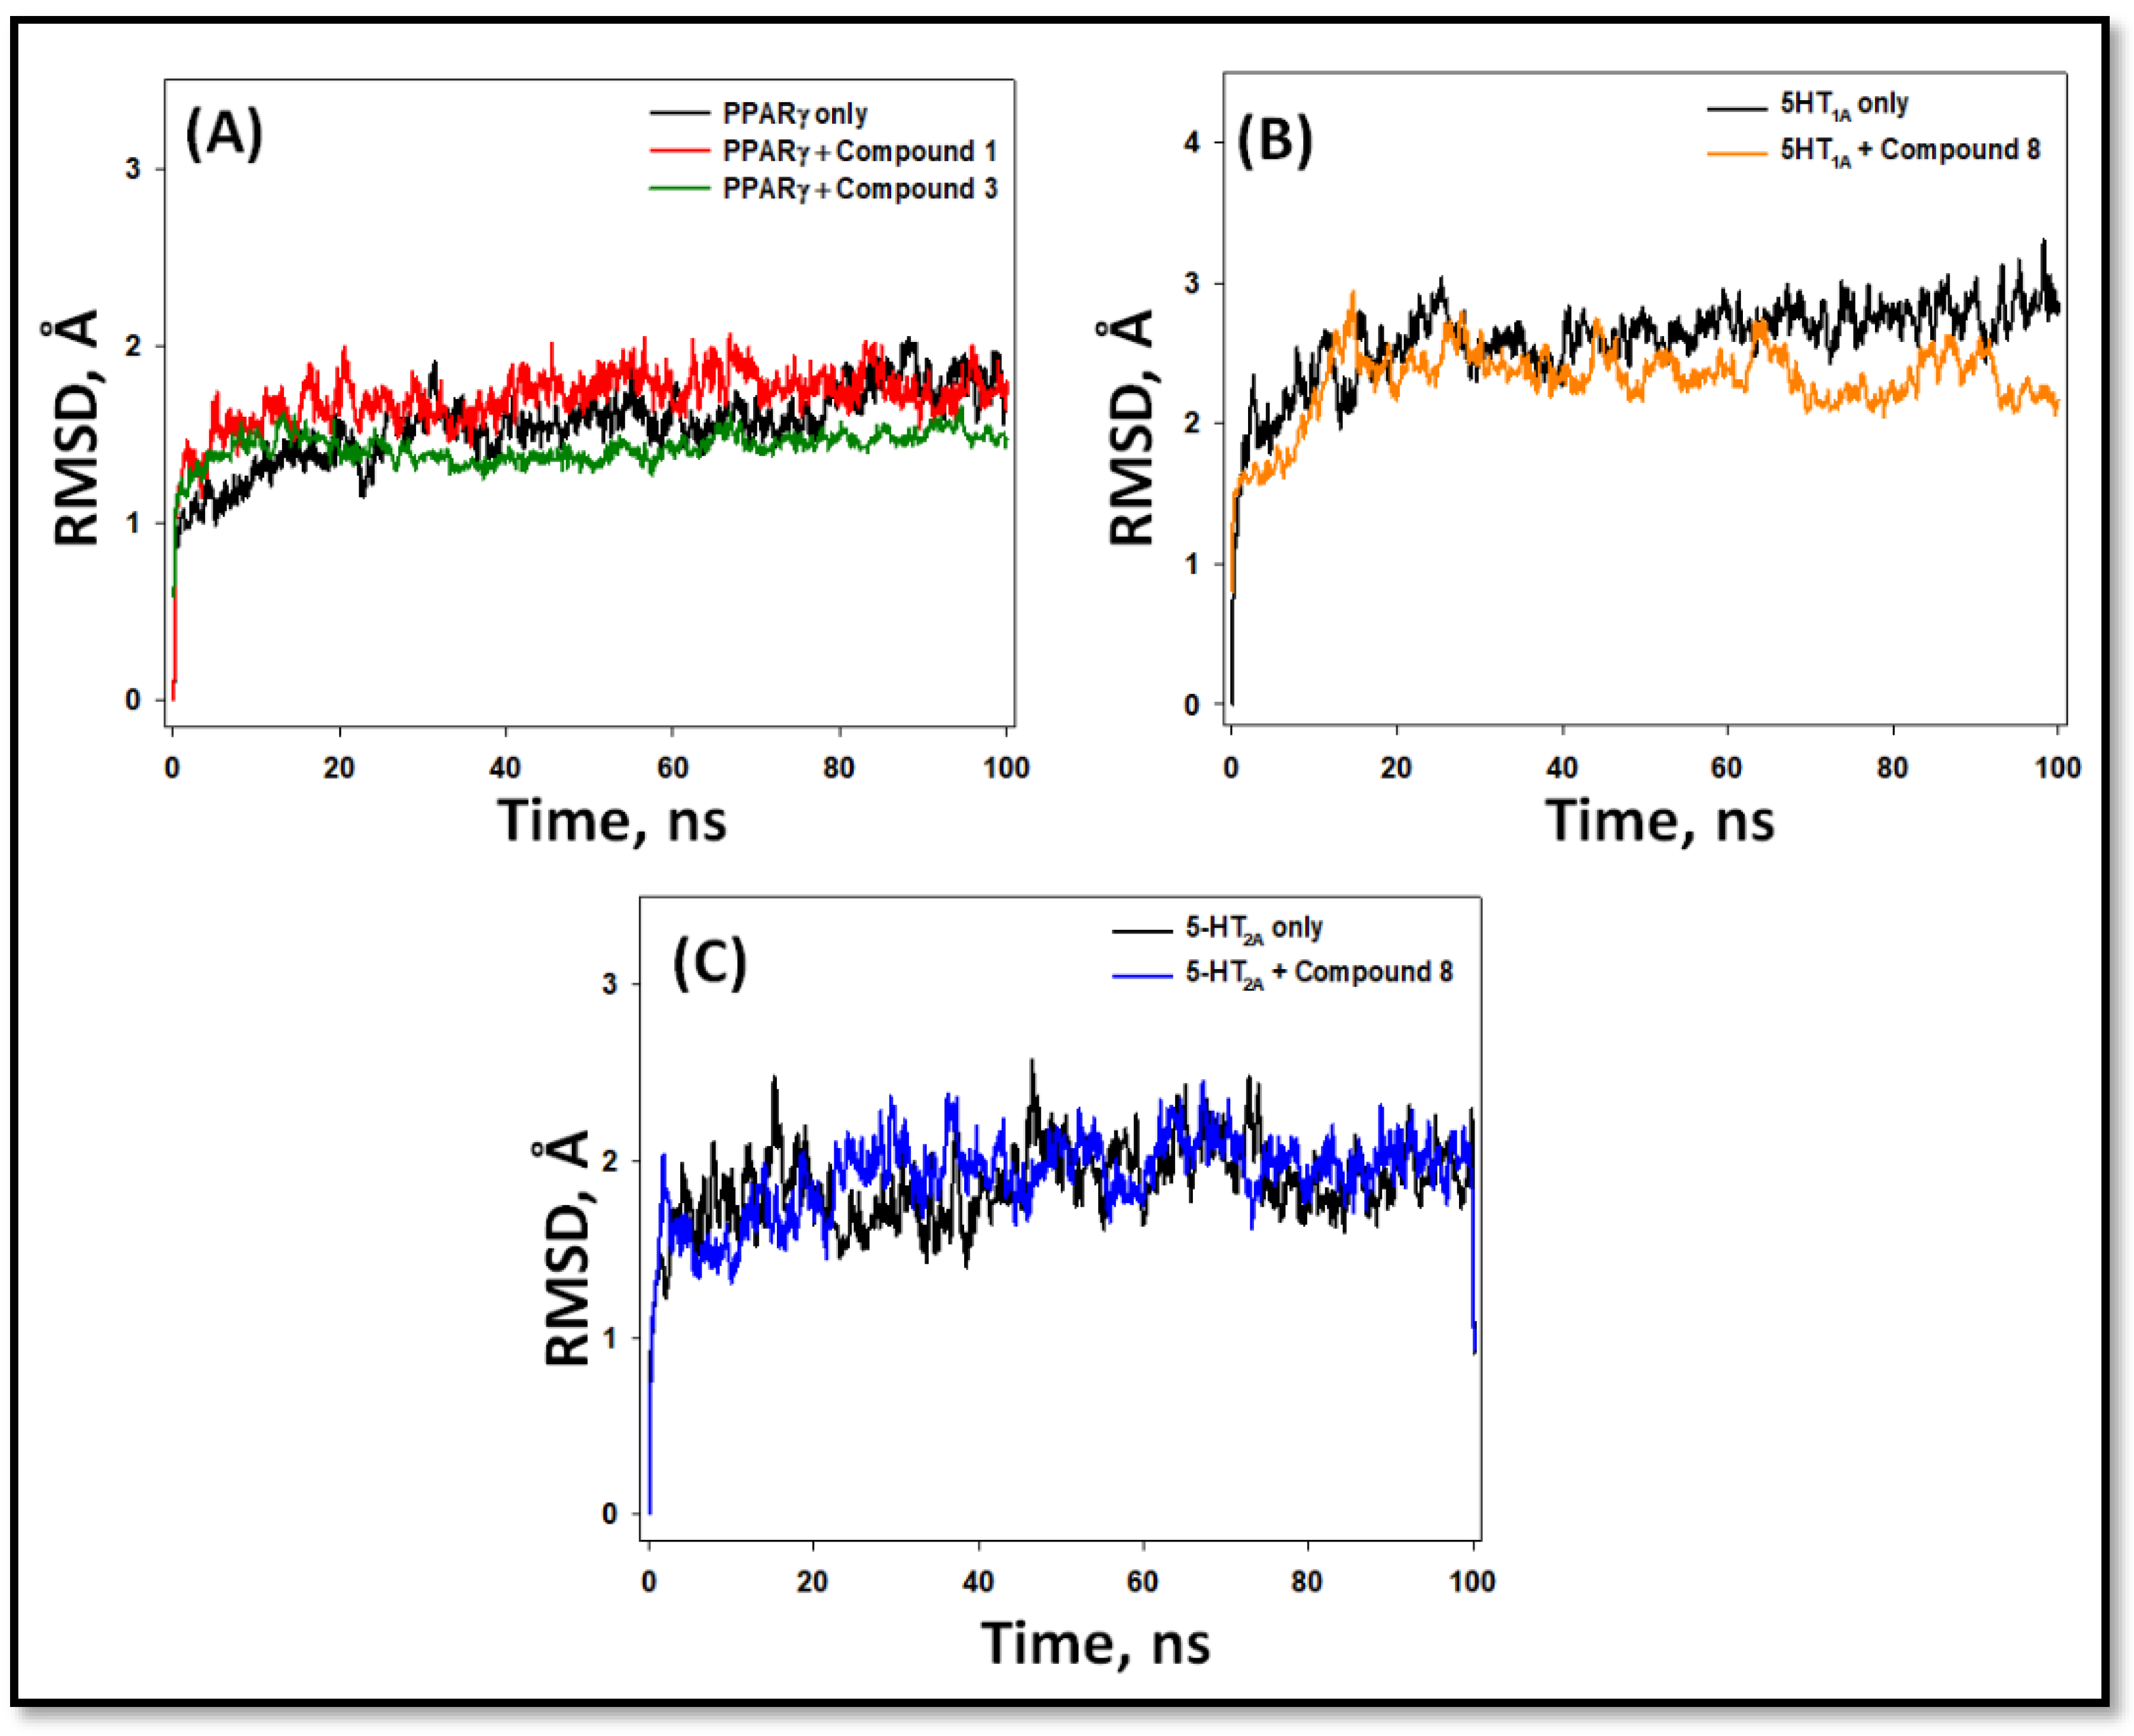
2.5.1. Root Mean Square Deviation (RMSD)
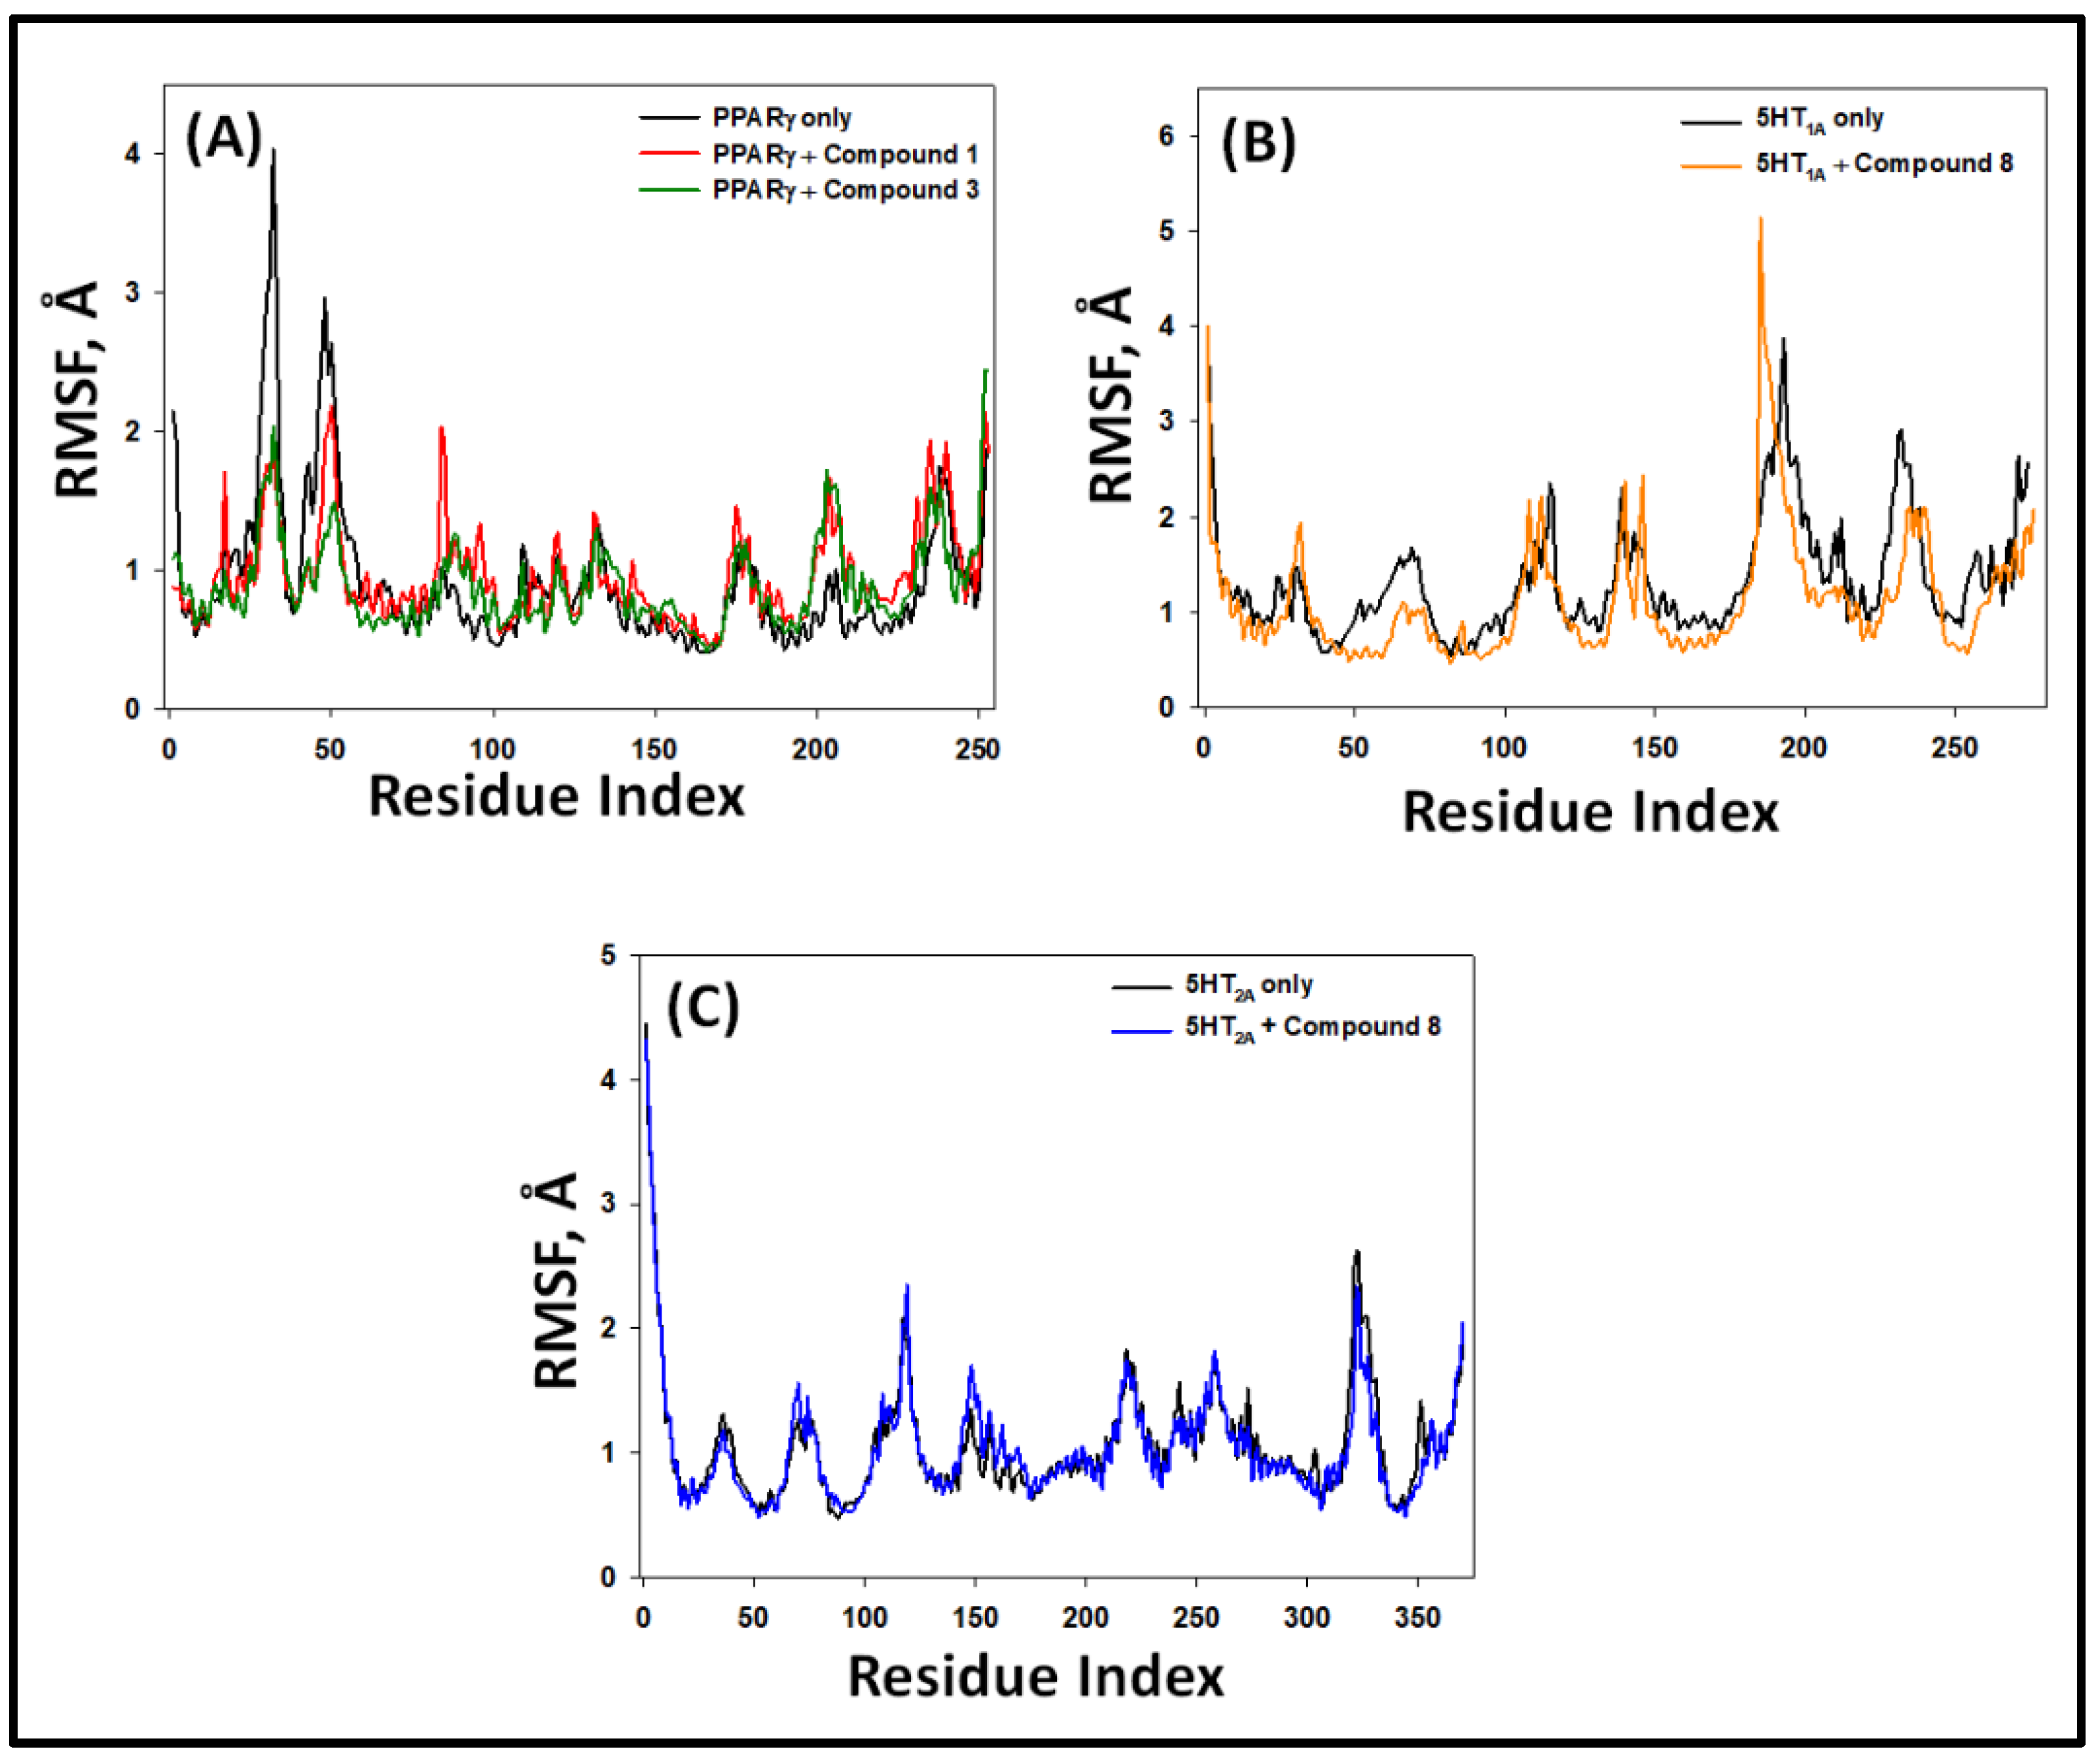
2.5.2. Root Mean Square Fluctuation (RMSF)
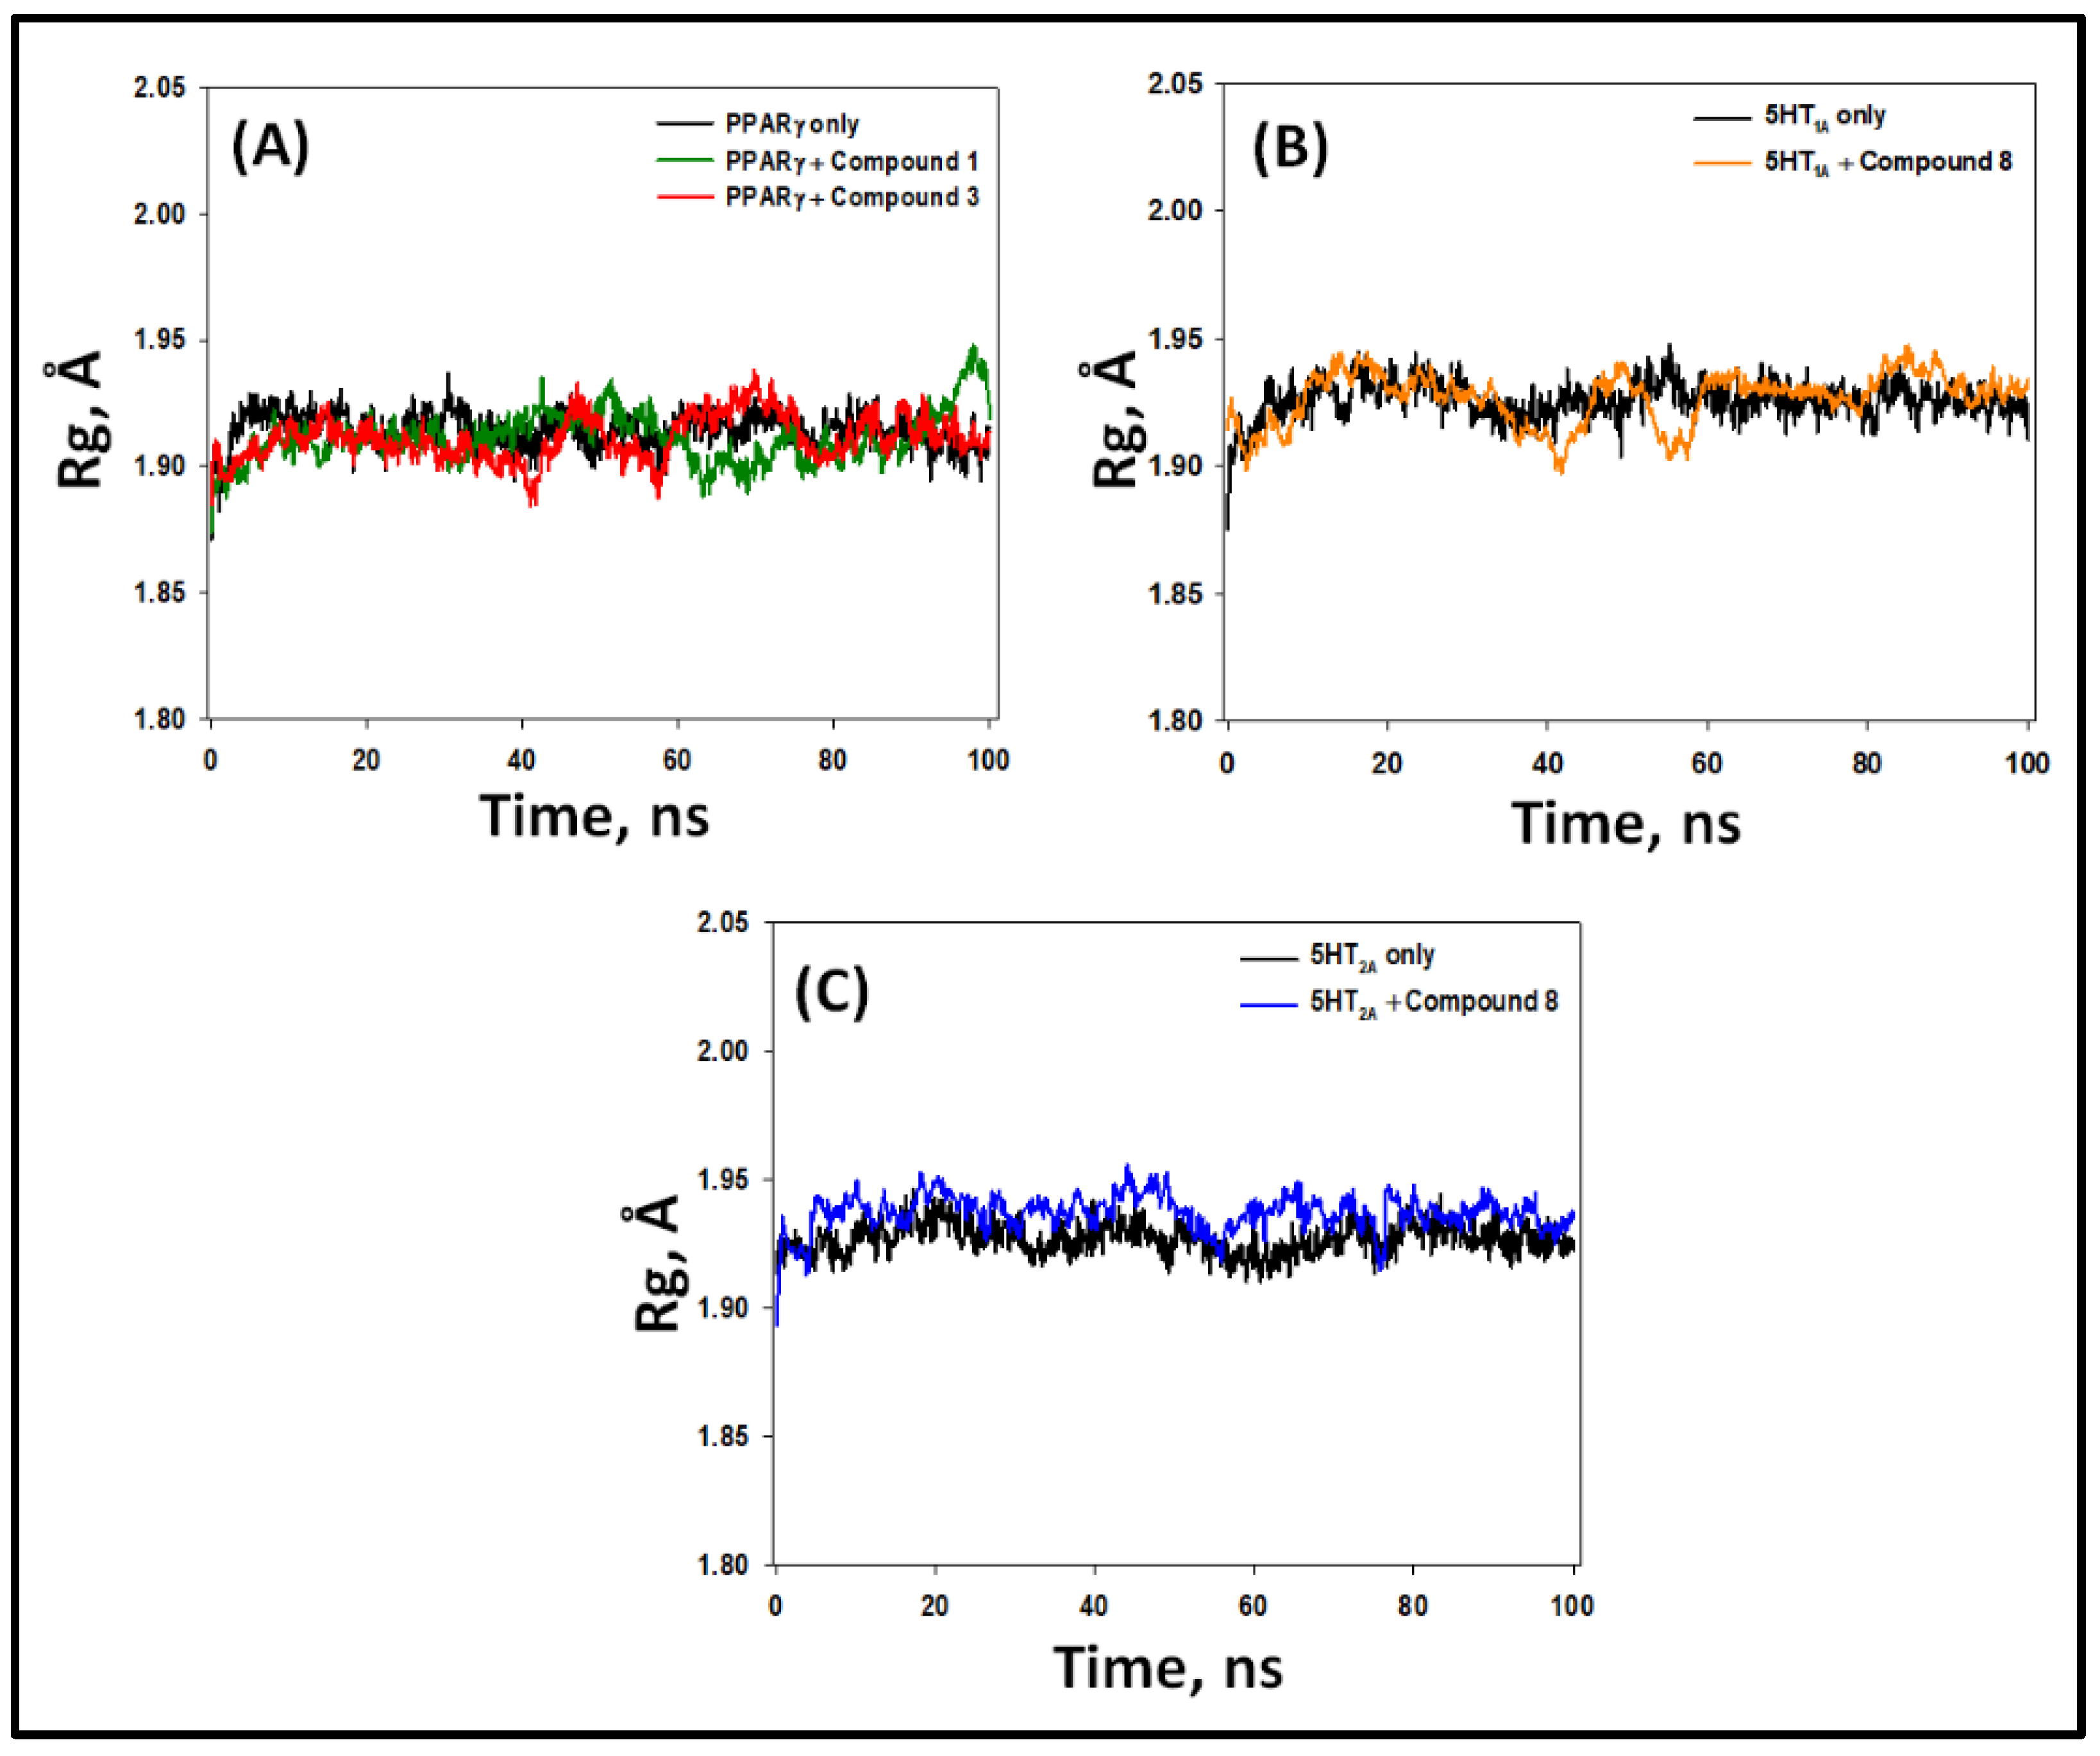
2.5.3. Radius of Gyration (Rg)
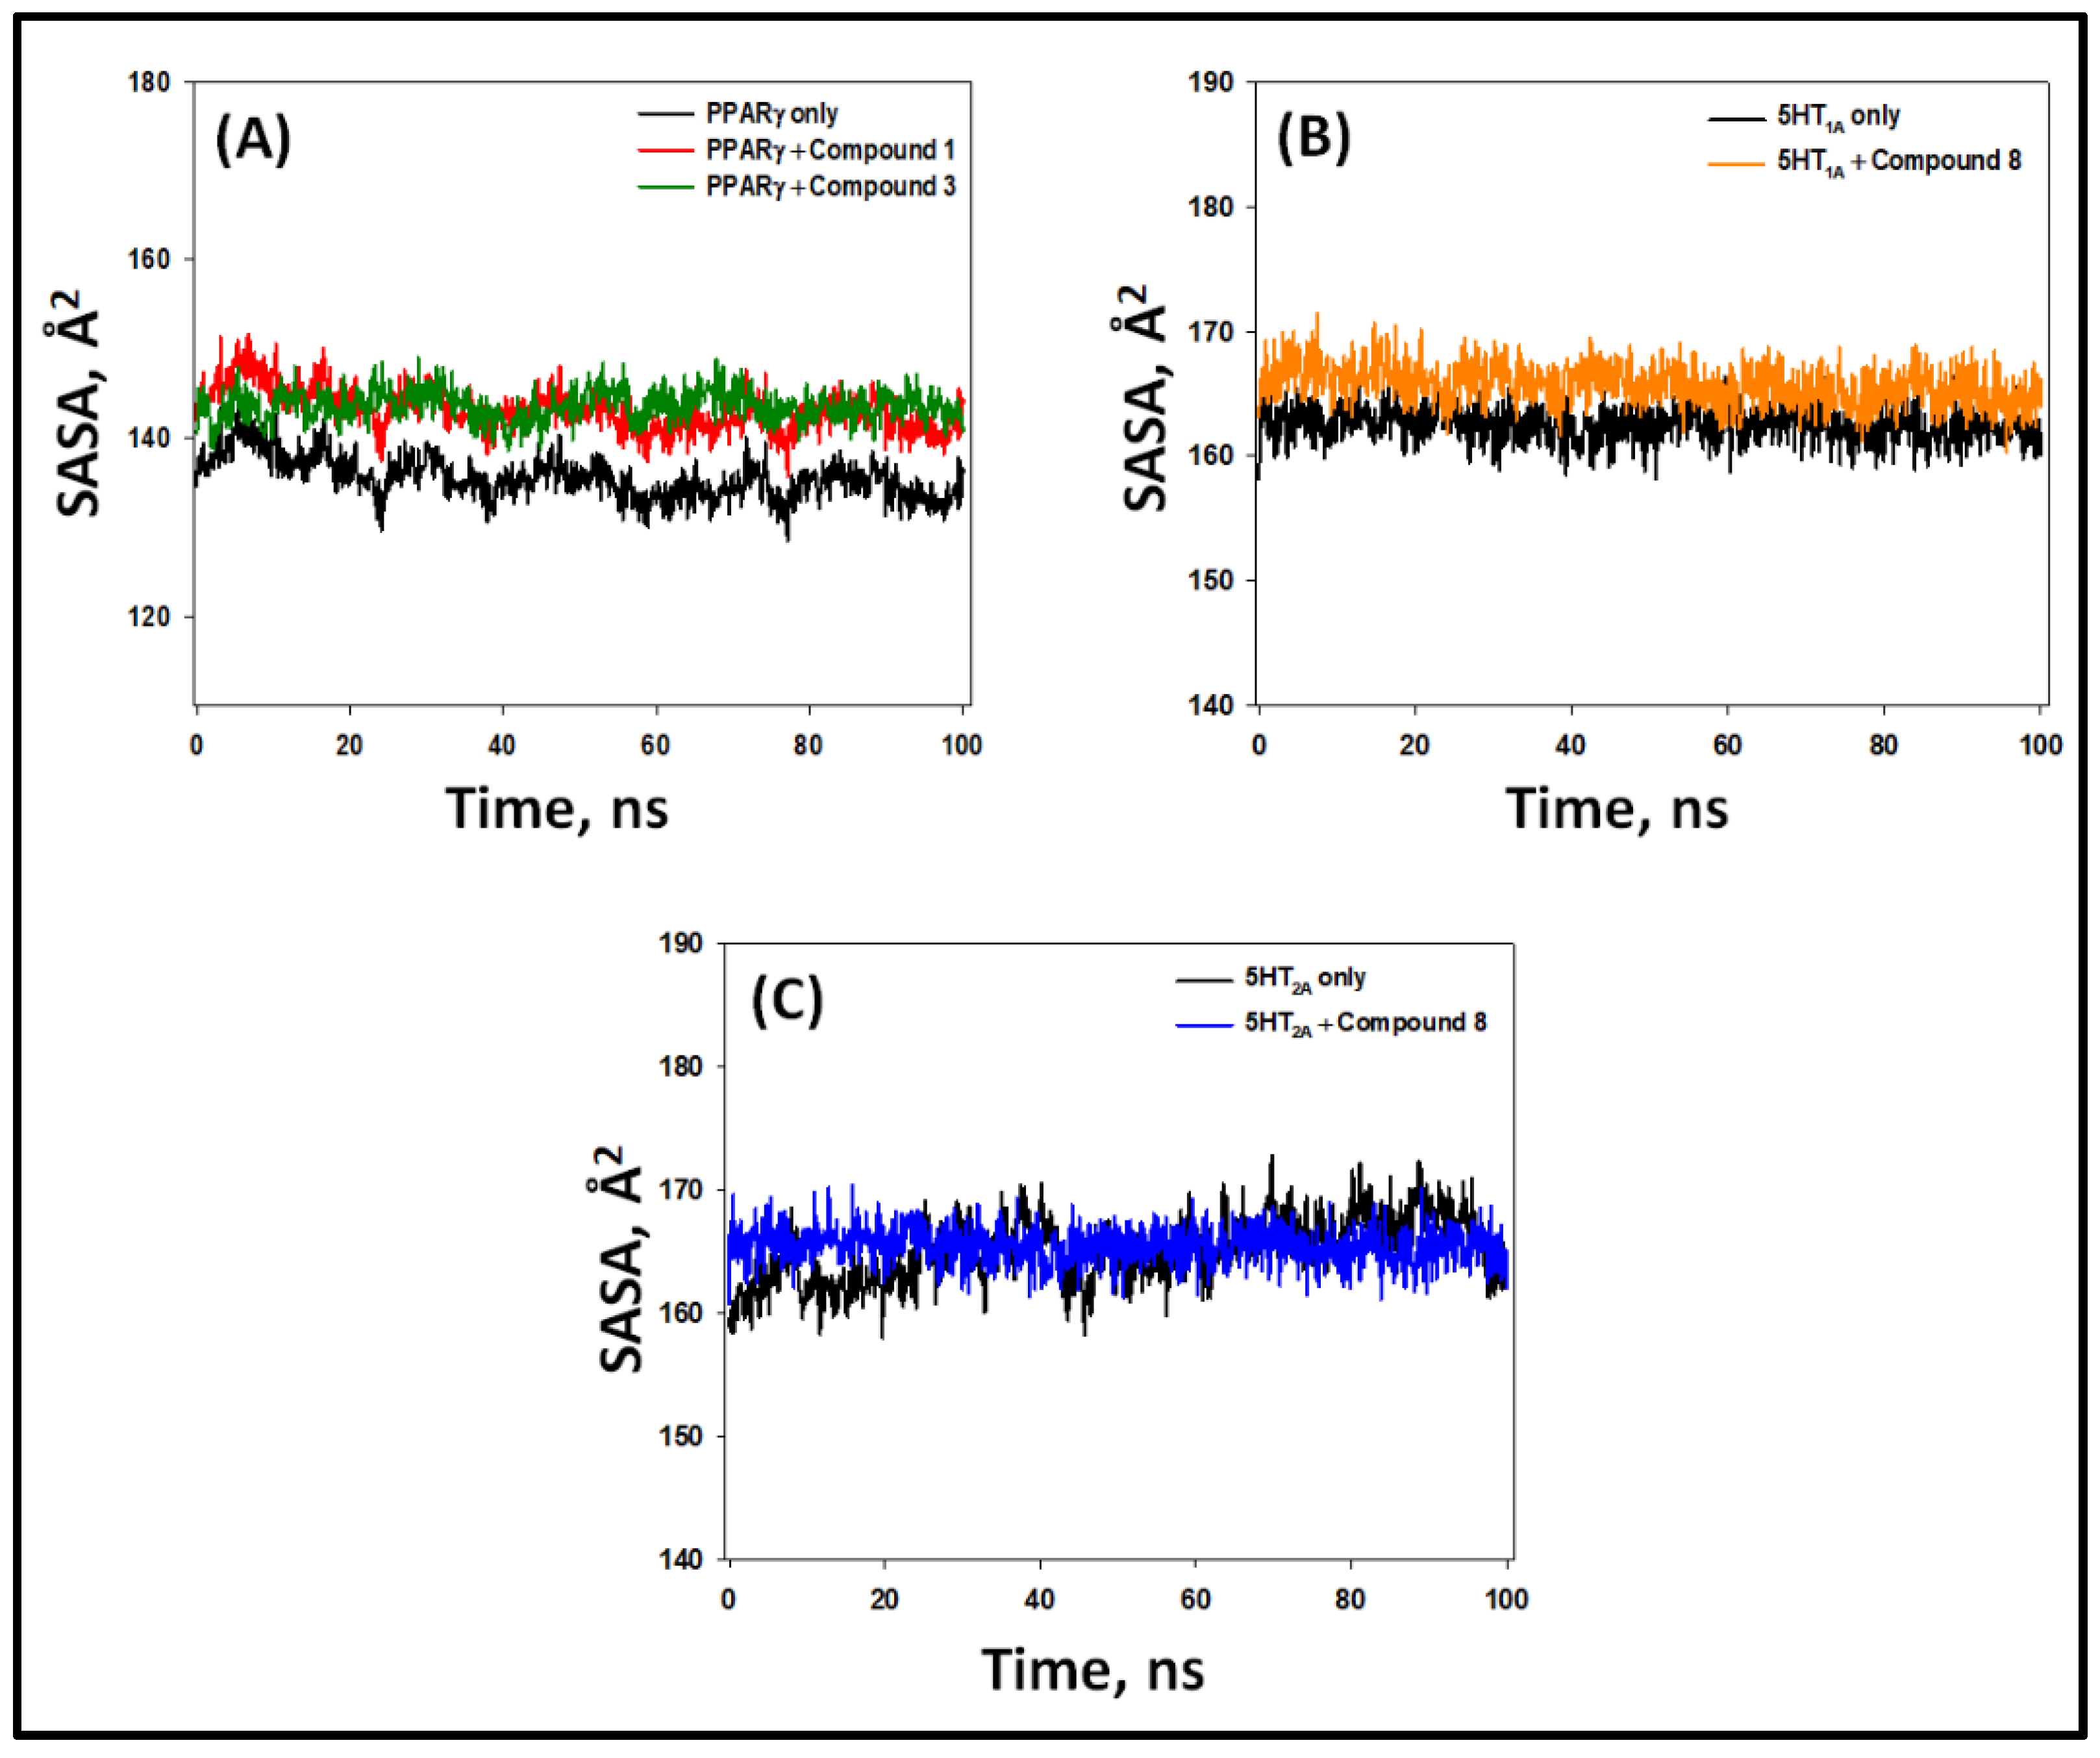
2.5.4. Solvent-Accessible Surface Area (SASA)
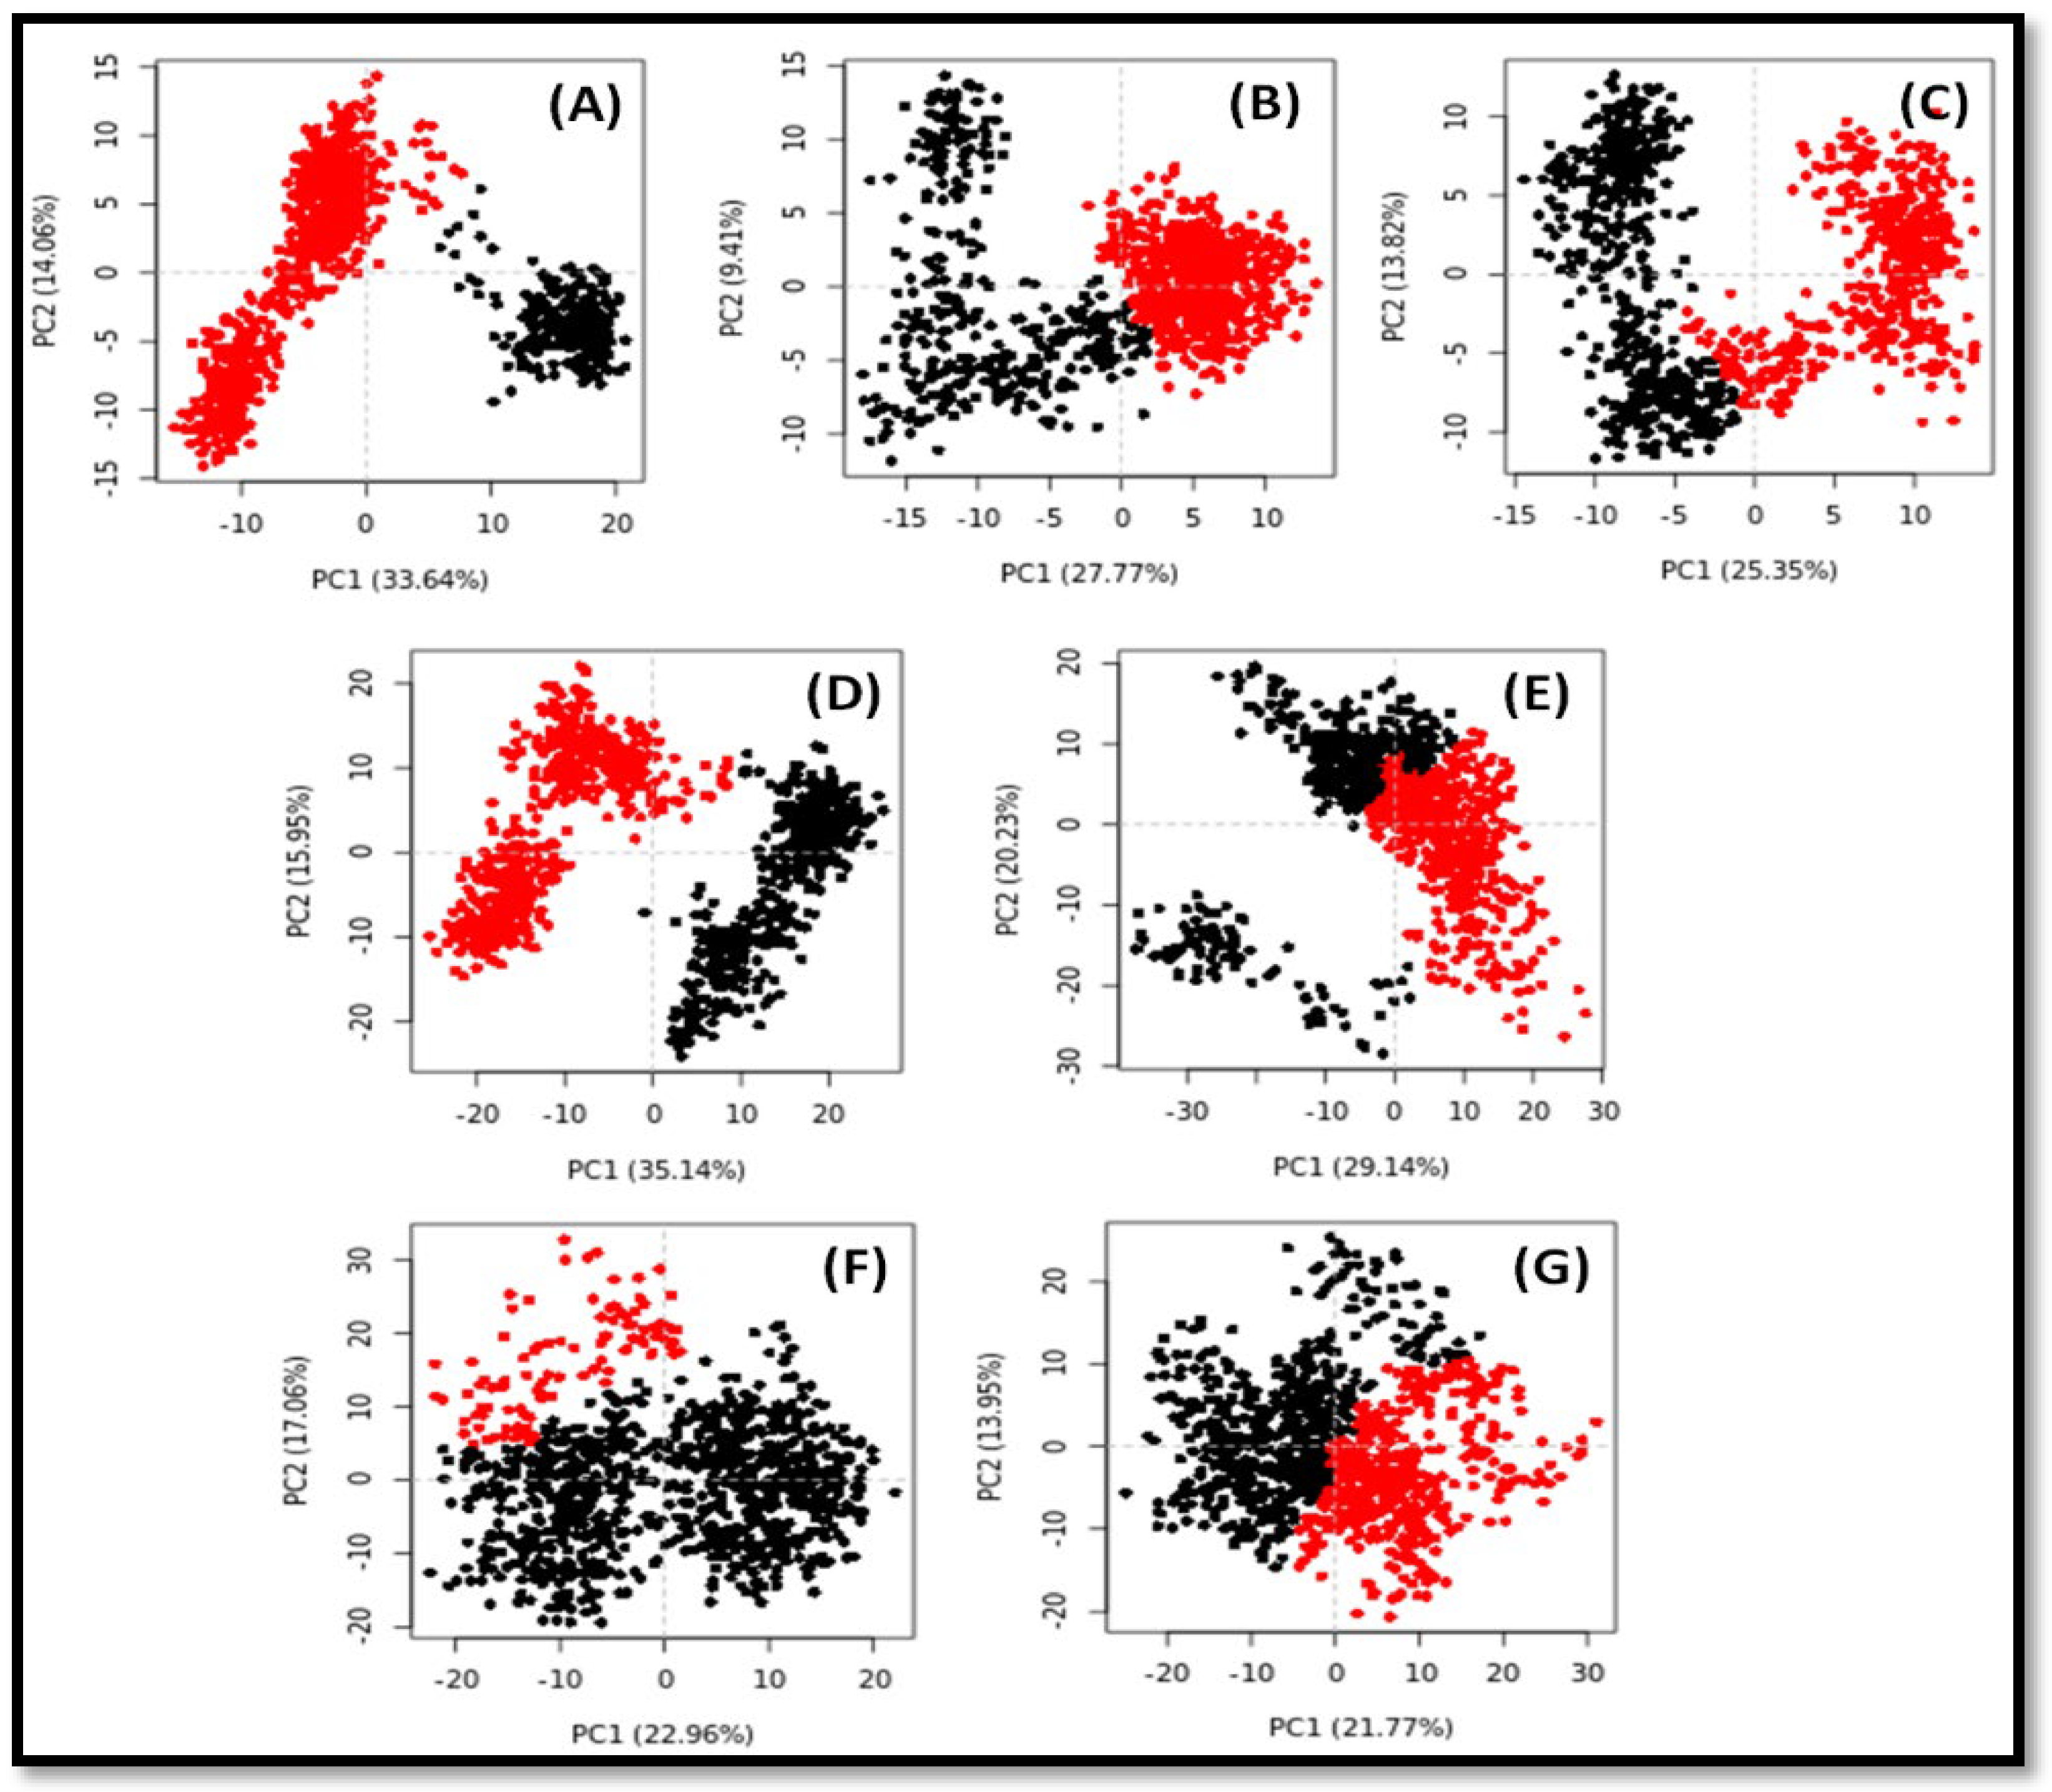
2.6. Principal Component Analysis (PCA) or Essential Dynamics (ED) Analysis
2.7. HPTLC Analysis of α-Linolenic in the Aerial Parts of S. irio
3. Discussion
4. Materials and Methods
4.1. Apparatus and Chemicals
4.2. Plant Material
4.3. Extraction and Isolation of Compounds
4.4. Molecular Docking
4.5. Prediction of Physicochemical, Pharmacokinetic, Drug-Likeness, and Toxicity
4.6. Molecular Dynamics Simulation (MDS)
4.7. Free Energy Calculations
4.8. Principal Component Analysis (PCA) or Essential Dynamics (ED)
4.9. Standardization of S. irio Extract by a Validated HPTLC Method
5. Conclusions
Supplementary Materials
Author Contributions
Funding
Informed Consent Statement
Data Availability Statement
Acknowledgments
Conflicts of Interest
References
- Rahman, M.; Khatun, A.; Liu, L.; Barkla, B.J. Brassicaceae Mustards: Traditional and Agronomic Uses in Australia and New Zealand. Molecules 2018, 23, 231. [Google Scholar] [CrossRef] [PubMed] [Green Version]
- Zorzan, M.; Zucca, P.; Collazuol, D.; Peddio, S.; Rescigno, A.; Pezzani, R. Sisymbrium officinale, the Plant of Singers: A Review of Its Properties and Uses. Planta Med. 2020, 86, 1088–9928. [Google Scholar] [CrossRef] [PubMed]
- Tiwari, M.; Bhargava, P. Current updates on Sisymbrium irio linn: A traditional medicinal plant. Plant Arch. 2021, 21, 411–419. [Google Scholar] [CrossRef]
- Borgonovo, G.; Zimbaldi, N.; Guarise, M.; Bedussi, F.; Winnig, M.; Vennegeerts, T.; Bassoli, A. Glucosinolates in Sisymbrium officinale (L.) Scop.: Comparative analysis in cultivated and wild plants and In Vitro assays with T2Rs bitter taste receptors. Molecules 2019, 24, 4572. [Google Scholar] [CrossRef] [PubMed] [Green Version]
- Al-Jaber, N.A. Phytochemical and biological studies of Sisymbrium irio L. Growing in Saudi Arabia. J. Saudi Chem. Soc. 2011, 15, 345–350. [Google Scholar] [CrossRef] [Green Version]
- Guil-Guerrero, J.; Giménez-Martínez, J.; Torija-Isasa, M. Nutritional composition of wild edible Crucifer species. J. Food Biochem. 2007, 23, 283–294. [Google Scholar] [CrossRef]
- Shah, S.; Rehmanullah, S.; Muhammad, Z. Pharmacognostic standardization and pharmacological study of Sisymbrium irio L. Am. J. Res. Commun. 2013, 1, 241–253. [Google Scholar]
- Khalil, H.E.; Aljeshi, Y.M.; Saleh, F.A. Phytochemical Analysis and In Vitro Antioxidant Properties of Sisymbrium irio L. Growing in Saudi Arabia: A Comparative Study. Res. J. Pharm. Biol. Chem. Sci. 2017, 8, 2533–2540. [Google Scholar]
- Hailu, B.T.; Gupta, R.K.; Rani, A. Sisymbrium irio L: An Herb used in the Unani system of medicine for broad spectrum therapeutical applications. Indian. J. Tradit. Knowl. 2019, 18, 140–143. [Google Scholar]
- Rajapaksha, H.; Bhatia, H.; Wegener, K.; Petrovsky, N.; Bruning, J.B. X-ray crystal structure of rivoglitazone bound to PPARγ and PPAR subtype selectivity of TZDs. Biochim. Biophys. Acta Gen. Subj. 2017, 1861, 1981–1991. [Google Scholar] [CrossRef]
- Bockaert, J.; Claeysen, S.; Bécamel, C.; Dumuis, A.; Marin, P. Neuronal 5-HT metabotropic receptors: Fine-tuning of their structure, signaling, and roles in synaptic modulation. Cell Tissue Res. 2006, 326, 553–572. [Google Scholar] [CrossRef]
- Kemp, D.E.; Canan, F.; Goldstein, B.I.; McIntyre, R.S. Long-acting risperidone: A review of its role in the treatment of bipolar disorder. Adv. Ther. 2009, 26, 588–599. [Google Scholar] [CrossRef] [PubMed] [Green Version]
- Al-Wahaibi, L.H.; Rehman, M.T.; Al-Saleem, M.S.M.; Basudan, O.A.; El-Gamal, A.A.; AlAjmi, M.F.; Backheet, E.Y.; Khalifa, A.A.; Abdel-Mageed, W.M. Phenolics from the heartwood of Tecoma mollis as potential inhibitors of COVID-19 virus main protease and spike proteins: An In silico study. Pharmacogn. Mag. 2021, 17, 278–286. [Google Scholar]
- Saikia, S.; Bordoloi, M. Molecular Docking: Challenges, Advances and its Use in Drug Discovery Perspective. Curr. Drug Targets 2019, 20, 501–521. [Google Scholar] [CrossRef]
- Asilbekova, D.T.; Ozek, G.; Ozek, T.; Bobakulov, K.M.; Baser, K.H.C.; Sagdullaev, S.S. Essential oil and lipids from leaves of Ferula kuhistanica. Chem. Nat. Compd. 2019, 55, 993–998. [Google Scholar] [CrossRef]
- Kazemeini, S.; Tarzi, B.; Bakhoda, H.; Larijani, K.; Damanafshan, P. Evaluation of the minerals content and fatty acids profiles in Descurainia Sophia and Sisymbrium irio. Bulg. Chem. Commun. 2015, 47, 112–118. [Google Scholar]
- Alexandri, E.; Ahmed, R.; Siddiqui, H.; Choudhary, M.I.; Tsiafoulis, C.G.; Gerothanassis, I.P. High Resolution NMR Spectroscopy as a Structural and Analytical Tool for Unsaturated Lipids in Solution. Molecules 2017, 22, 1663. [Google Scholar] [CrossRef] [Green Version]
- Al-Qudah, M.A.; Abu Zarga, M.H. Chemical constituents of Sisymbrium irio L. from Jordan. Nat. Prod. Res. 2010, 24, 448–456. [Google Scholar] [CrossRef]
- Prajapati, R.; Seong, S.H.; Kim, H.R.; Jung, H.A.; Choi, J.S. Isolation and identification of bioactive compounds from the tuber of Brassica oleracea var. gongylodes. Nat. Prod. Sci. 2010, 26, 214–220. [Google Scholar]
- Monde, K.; Sasaki, K.; Shirata, A.; Takasugi, M. Studies on stress metabolites. Part 15. Metboxybrassenins A and B, sulfur-containing stress metabolites from Brassica oleracea var. capitata. Phytochemistry 1991, 30, 3921–3922. [Google Scholar] [CrossRef]
- Alhadrami, H.A.; Thissera, B.; Hassan, M.H.A.; Behery, F.A.; Ngwa, C.J.; Hassan, H.M.; Pradel, G.; Abdelmohsen, U.R.; Rateb, M.E. Bio-Guided isolation of antimalarial metabolites from the coculture of two red sea sponge-derived Actinokineospora and Rhodococcus spp. Mar. Drugs 2021, 19, 109. [Google Scholar] [CrossRef] [PubMed]
- Yang, X.; Wong, M.; Wang, N.; Chan, A.S.; Yao, X. A new eudesmane derivative and a new fatty acid ester from Sambucus williamsii. Chem. Pharm. Bull. 2006, 54, 676–678. [Google Scholar] [CrossRef] [PubMed] [Green Version]
- Ben Nejma, A.; Znati, M.; Nguir, A.; Daich, A.; Othman, M.; Lawson, A.M.; Ben Jannet, H. Phytochemical and biological studies of Atriplex inflata f. Muell.: Isolation of secondary bioactive metabolites. J. Pharm. Pharmacol. 2017, 69, 1064–1074. [Google Scholar] [CrossRef]
- Brown, T.J.; Brainard, J.; Song, F.; Wang, X.; Abdelhamid, A.; Hooper, L. PUFAH Group. Omega-3, omega-6, and total dietary polyunsaturated fat for prevention and treatment of type 2 diabetes mellitus: Systematic review and meta-analysis of randomised controlled trials. BMJ 2019, 366, l4697. [Google Scholar] [CrossRef] [PubMed] [Green Version]
- Wang, J.; Han, L.; Wang, D.; Li, P.; Shahidi, F. Conjugated Fatty Acids in Muscle Food Products and Their Potential Health Benefits: A Review. J. Agric. Food Chem. 2020, 68, 13530–13540. [Google Scholar] [CrossRef]
- Popp-Snijders, C.; Schouten, J.A.; Heine, R.J.; van der Meer, J.; van der Veen, E.A. Dietary supplementation of omega-3 polyunsaturated fatty acids improves insulin sensitivity in non-insulin-dependent diabetes. Diabetes Res. 1987, 4, 141–147. [Google Scholar]
- Hawash, M.; Jaradat, N.; Elaraj, J.; Hamdan, A.; Lebdeh, S.A.; Halawa, T. Evaluation of the hypoglycemic effect of seven wild folkloric edible plants from Palestine. J. Complement. Integr. Med. 2019, 17, 20190032. [Google Scholar] [CrossRef]
- Daina, A.; Michielin, O.; Zoete, V. SwissADME: A free web tool to evaluate pharmacokinetics, drug-likeness and medicinal chemistry friendliness of small molecules. Sci. Rep. 2017, 7, 42717. [Google Scholar] [CrossRef] [Green Version]
- Rochat, B.; Baumann, P.; Audus, K.L. Transport mechanisms for the antidepressant citalopram in brain microvessel endothelium. Brain Res. 1999, 831, 229–236. [Google Scholar] [CrossRef]
- Jabir, N.R.; Rehman, M.T.; Tabrez, S.; Alserihi, R.F.; AlAjmi, M.F.; Khan, M.S.; Husain, F.M.; Ahmed, B.A. Identification of Butyrylcholinesterase and Monoamine Oxidase B Targeted Ligands and their Putative Application in Alzheimer’s Treatment: A Computational Strategy. Curr. Pharm. Des. 2021, 27, 2425–2434. [Google Scholar] [CrossRef]
- Jolliffe, I.T. Principal Component Analysis; Springer Series in Statistics; Springer: New York, NY, USA, 2002. [Google Scholar]
- Harper, C.R.; Edwards, M.J.; DeFilipis, A.P.; Jacobson, T.A. Flaxseed oil increases the plasma concentrations of cardioprotective (n-3) fatty acids in humans. J. Nutr. 2006, 136, 83–87. [Google Scholar] [CrossRef] [PubMed] [Green Version]
- Gomes, P.M.; Hollanda-Miranda, W.R.; Beraldo, R.A.; Castro, A.V.; Geloneze, B.; Foss, M.C.; Foss-Freitas, M.C. Supplementation of α-linolenic acid improves serum adiponectin levels and insulin sensitivity in patients with type 2 diabetes. Nutrition 2015, 31, 853–857. [Google Scholar] [CrossRef] [PubMed]
- Michalik, L.; Auwerx, J.; Berger, J.P.; Chatterjee, V.K.; Glass, C.K.; Gonzalez, F.J.; Grimaldi, P.A.; Kadowaki, T.; Lazar, M.A.; O’Rahilly, S.; et al. International Union of Pharmacology. LXI. Peroxisome proliferator-activated receptors. Pharmacol. Rev. 2006, 58, 726–741. [Google Scholar] [CrossRef] [PubMed]
- Holliday, N.D.; Watson, S.J.; Brown, A.G. Drug discovery opportunities and challenges at G protein coupled receptors for long chain free fatty acids. Front. Endocrinol. 2011, 2, 112. [Google Scholar] [CrossRef] [Green Version]
- Grygiel-Górniak, B. Peroxisome proliferator-activated receptors and their ligands: Nutritional and clinical implications—A review. Nutr. J. 2014, 13, 17. [Google Scholar] [CrossRef] [Green Version]
- Hamid, H.A.; Ramli, A.N.; Yusoff, M.M. Indole alkaloids from plants as potential leads for antidepressant drugs: A Mini Review. Front. Pharmacol. 2017, 8, 96. [Google Scholar] [CrossRef] [Green Version]
- Ndombera, F.T.; Maiyoh, G.K.; Tuei, V.C. Pharmacokinetic, Physicochemical and Medicinal Properties of N-glycoside Anti-cancer Agent More Potent than 2-Deoxy-D-Glucose in Lung Cancer Cells. J. Pharm. Pharmacol. 2019, 7, 165–176. [Google Scholar]
- Hoosain, F.G.; Choonara, Y.E.; Tomar, L.K.; Kumar, P.; Tyagi, C.; du Toit, L.C.; Pillay, V. Bypassing P-Glycoprotein Drug Efflux Mechanisms: Possible Applications in Pharmacoresistant Schizophrenia Therapy. Biomed. Res. Int. 2015, 2015, 484963. [Google Scholar] [CrossRef] [Green Version]
- Chen, C.; Lee, M.-H.; Weng, C.-F.; Leong, M.K. Theoretical Prediction of the Complex P-Glycoprotein Substrate Efflux Based on the Novel Hierarchical Support Vector Regression Scheme. Molecules 2018, 23, 1820. [Google Scholar] [CrossRef] [Green Version]
- Kumarnsit, E.; Vongvatcharanon, U.; Keawpradub, N.; Intasaro, P. Fos-like immunoreactivity in rat dorsal raphe nuclei induced by alkaloid extract of Mitragyna speciosa. Neurosci. Lett. 2007, 416, 128–132. [Google Scholar] [CrossRef]
- Jawna-Zboińska, K.; Blecharz-Klin, K.; Joniec-Maciejak, I.; Wawer, A.; Pyrzanowska, J.; Piechal, A.; Mirowska-Guzel, D.; Widy-Tyszkiewicz, E. Passiflora incarnata L. Improves Spatial Memory, Reduces Stress, and Affects Neurotransmission in Rats. Phytother. Res. 2016, 30, 781–789. [Google Scholar] [CrossRef] [PubMed]
- Al-Shabib, N.A.; Khan, J.M.; Malik, A.; Alsenaidy, M.A.; Rehman, M.T.; AlAjmi, M.F.; Alsenaidy, A.M.; Husain, F.M.; Khan, R.H. Molecular insight into binding behavior of polyphenol (rutin) with beta lactoglobulin: Spectroscopic, molecular docking and MD simulation studies. J. Mol. Liq. 2018, 269, 511–520. [Google Scholar] [CrossRef]
- Al-Saleem, M.S.M.; Al-Wahaibi, L.H.; Rehman, M.T.; AlAjmi, M.F.; Alkahtani, R.A.; Abdel-Mageed, W.M. Phenolic compounds of Heliotropium europaeum and their biological activities. Pharmacogn. Mag. 2020, 16, 108–116. [Google Scholar]
- Tan, Y.; Xu, P.; Huang, S.; Yang, G.; Zhou, F.; He, X.; Ma, H.; Xu, H.E.; Jiang, Y. Structural insights into the ligand binding and Gi coupling of serotonin receptor 5-HT5A. Cell Discov. 2022, 8, 50–58. [Google Scholar] [CrossRef]
- Kimura, K.T.; Asada, H.; Inoue, A.; Kadji, F.; Im, D.; Mori, C.; Arakawa, T.; Hirata, K.; Nomura, Y.; Nomura, N.; et al. Structures of the 5-HT2A receptor in complex with the antipsychotics risperidone and zotepine. Nat. Struct. Mol. Biol. 2019, 26, 121–128. [Google Scholar] [CrossRef] [PubMed]
- Rehman, M.T.; AlAjmi, M.F.; Hussain, A. Natural Compounds as Inhibitors of SARS-CoV-2 Main Protease (3CLpro): A Molecular Docking and Simulation Approach to Combat COVID-19. Curr. Pharm. Des. 2021, 27, 3577–3589. [Google Scholar] [CrossRef] [PubMed]
- AlAjmi, M.F.; Azhar, A.; Owais, M.; Rashid, S.; Hasan, S.; Hussain, A.; Rehman, M.T. Antiviral potential of some novel structural analogs of standard drugs repurposed for the treatment of COVID-19. J. Biomol. Struct. Dyn. 2021, 39, 6676–6688. [Google Scholar] [CrossRef]
- Branka, A.C. Nose-Hoover chain method for nonequilibrium molecular dynamics simulation. Phys. Rev. E Stat. Phys. Plasmas Fluids Relat. Interdiscip. Topics 2000, 61, 4769–4773. [Google Scholar]
- Martyna, G.J.; Tobias, D.J.; Klein, M.L. Constant pressure molecular dynamics algorithms. J. Chem. Phys. 1994, 101, 4177–4189. [Google Scholar] [CrossRef]
- Iqbal, D.; Rehman, M.T.; Bin Dukhyil, A.; Rizvi, S.; Al Ajmi, M.F.; Alshehri, B.M.; Banawas, S.; Khan, M.S.; Alturaiki, W.; Alsaweed, M. High-Throughput Screening and Molecular Dynamics Simulation of Natural Product-like Compounds against Alzheimer’s Disease through Multitarget Approach. Pharmaceuticals 2021, 14, 937. [Google Scholar] [CrossRef]
- Ichiye, T.; Karplus, M. Collective motions in proteins: A covariance analysis of atomic fluctuations in molecular dynamics and normal mode simulations. Proteins 1991, 11, 205–217. [Google Scholar] [CrossRef] [PubMed]
- Grant, B.J.; Skjaerven, L.; Yao, X.Q. The Bio3D packages for structural bioinformatics. Protein Sci. 2021, 30, 20–30. [Google Scholar] [CrossRef] [PubMed]


| No. | 4 | |
|---|---|---|
| δC, Mult. | δH, Mult (J in Hz) | |
| 1 | 177.9, C | - |
| 2 | 35.0, CH2 | 2.16, t (7.3) |
| 3 | 26.0, CH2 | 1.48, br t (7.2) |
| 4 | 30.1, CH2 | 1.22, m |
| 5 | 30.3, CH2 | 1.22, m |
| 6 | 26.4, CH2 | 1.22, m |
| 7 | 38.2, CH2 | 1.41, m |
| 8 | 73.0, CH | 3.98, m |
| 9 | 136.5, CH | 5.60, m |
| 10 | 131.0, CH | 5.60, m |
| 11 | 75.8, CH | 3.85, t (6.0) |
| 12 | 75.7, CH | 3.38, m |
| 13 | 31.5, CH2 | a. 2.24, m b. 2.02, m |
| 14 | 30.5, CH2 | 1.22, m |
| 15 | 126.3, CH | 5.34, m |
| 16 | 134.4, CH | 5.34, m |
| 17 | 21.6, CH2 | 1.95 br. t (6.5) |
| 18 | 14.6, CH3 | 0.85, t (7.4) |
| Compound | ΔG kcal mol−1 | Receptor Amino Acids |
|---|---|---|
| Rivoglitazone | −8.2 | ARG280, ILE281, PHE282, GLY284, CYS285, GLN286, ARG288, SER289, HIS323, ILE326, TYR327, LEU330, VAL339, ILE341, MET348, LEU353, MET364, HIS449, LEU453, LEU469, TYR473 |
| 1 | −6.7 | PHE226, CYS285, GLN286, ARG288, SER289, ALA292, GLU295, ILE296, HIS323, ILE325, ILE326, TYR327, MET329, LEU330, LEU333, LYS367, HIS449, LEU453, LEU465, LEU469, TYR473 |
| 2 | −6.0 | LEU228, PHE282, CYS285, GLN286, ARG288, SER289, ALA292, HIS323, ILE326, TYR327, MET329, LEU330, SER332, LEU333, PHE363, MET364, HIS449, LEU453, LEU465, LEU469, TYR473 |
| 3 | −7.4 | LEU228, ILE281, PHE282, CYS285, GLN286, ARG288, SER289, ALA292, ILE326, TYR327, MET329, LEU330, SER332, LEU333, LEU356, PHE360, PHE363, MET364, LYS367, HIS449 |
| 4 | −6.1 | PHE282, CYS285, GLN286, ARG288, SER289, ALA292, HIS323, ILE326, TYR327, MET329, LEU330, LEU333, PHE363, MET364, LYS367, HIS449, LEU453, LEU465, LEU469, TYR473 |
| Compound | ΔG kcal mol−1 | Receptor Amino Acids |
|---|---|---|
| Serotonin | −6.1 | ASP116, VAL117, CYS120, THR121, ILE124, ILE167, ILE189, SER199, ALA203, PHE361, PHE362, ALA365, ASN386, TYR390 |
| 5 | −6.4 | ASP116, VAL117, CYS120, THR121, ILE124, ALA203, TRP358, PHE361, PHE362, ASN386, GLY389, TYR390 |
| 6 | −6.4 | ASP116, VAL117, CYS120, THR121, ILE124, ILE189, THR196, SER199, THR200, ALA203, PHE361, PHE362, ALA365 |
| 7 | −6.5 | ASP116, VAL117, CYS120, THR121, ILE124, ILE189, TRY195, SER199, ALA203, PHE362 |
| 8 | −6.9 | VAL117, ILE189, SER190, LYS191, TYR195, THR196, SER199, THR200, PHE361, PHE362, ALA365, PRO369 |
| Compound | ΔG kcal mol−1 | Receptor Amino Acids |
|---|---|---|
| Risperidone | −11.8 | SER131, TYR139, TRP151, ASP155, VAL156, SER159, THR160, ILE163, LEU228, GLY238, SER242, PHE243, PHE332, TRP336, PHE339, PHE340, ASN363, VAL366, TYR370 |
| 5 | −7.3 | ASP155, VAL156, SER159, THR160, ILE163, TRP336, SER242, PHE243, PHE332, TRP336, PHE339, PHE340, TYR370 |
| 6 | −7.5 | ASP155, VAL156, SER159, THR160, ILE163, GLY238, SER242, PHE243, PHE332, TRP336, PHE339, PHE340 |
| 7 | −7.4 | LEU123, ASP155, VAL156, SER159, THR160, ILE163, GLY238, SER242, PHE243, PHE332, TRP336, PHE339, PHE340, TYR370 |
| 8 | −8.1 | LEU123, ASP155, VAL156, SER159, THR160, ILE163, SER242, PHE243, PHE332, TRP336, PHE339, PHE340, VAL366, TYR370 |
| Property | Compound ID | |||||||
|---|---|---|---|---|---|---|---|---|
| 1 | 2 | 3 | 4 | 5 | 6 | 7 | 8 | |
| Molecular weight | 250.38 | 278.43 | 330.46 | 328.44 | 186.2140 | 156.18 | 190.2020 | 203.2450 |
| Molecular formula | C16H26O2 | C18H30O2 | C18H34O5 | C18H32O5 | C11H10N2O | C11H10N2O | C10H10N2O2 | C11H13N3O |
| Lipophilicity (Log Po/w) | 4.88 | 5.66 | 3.02 | 2.80 | 2.23 | 1.77 | 0.80 | 0.52 |
| Water solubility (ESOL) | Insoluble | Insoluble | Soluble (−2.88) | Soluble (−2.88) | Soluble (−2.64) | Soluble (−2.31) | Soluble (−2.47) | Very soluble (−1.71) |
| TPSA | 37.3 | 37.3 | 97.99 | 97.99 | 37.95 | 39.58 | 57.25 | 84.9 |
| Lipinski | Yes | Yes | Yes | Yes | Yes | Yes | Yes | Yes |
| GIT absorption | --- | --- | High | High | High | High | High | High |
| BBB permeability | --- | --- | No | No | Yes | Yes | Yes | No |
| P-gp substrate | --- | --- | Yes | Yes | No | No | No | No |
| Bioavailability score | --- | --- | 0.56 | 0.56 | 0.55 | 0.55 | 0.55 | 0.55 |
| H-bond (donors/acceptors) | 1/2 | 1/2 | 4/5 | 4/5 | 0/2 | 1/1 | 1/2 | 3/2 |
| CYP450-1A2 | --- | --- | No | No | Yes | Yes | Yes | No |
| CYP2D6 | --- | --- | Yes | Yes | No | No | No | No |
| CYP2C19/2C9/3A4 | --- | --- | No | No | No | No | No | No |
| PAINS | No | No | No | No | No | No | No | No |
| Target Protein | Compounds | ΔG or ΔGBind | ΔGCoulomb | ΔGCovalent | ΔGH-bond | ΔGSA or ΔGSol_Lipo | ΔGPacking | ΔGSolv or ΔGSolGB | ΔGvdW |
|---|---|---|---|---|---|---|---|---|---|
| PPAR-γ | Compound 1 | −54.55 | −46.20 | 10.06 | −2.74 | −8.54 | −5.20 | 51.15 | −53.08 |
| Compound 2 | −45.58 | −18.22 | 6.91 | −2.11 | −15.70 | −0.49 | 19.58 | −35.55 | |
| Compound 3 | −57.23 | −52.92 | 9.92 | −3.90 | −11.13 | −4.30 | 55.84 | −50.74 | |
| Compound 4 | −49.86 | −31.73 | 2.89 | −3.04 | −8.09 | −1.71 | 30.21 | −38.39 | |
| 5-HT1A | Compound 5 | −52.79 | −11.85 | 5.18 | −2.37 | −17.41 | −5.54 | 18.30 | −39.10 |
| Compound 6 | −44.92 | 2.00 | −0.49 | −1.54 | −10.24 | −4.99 | 1.81 | −31.47 | |
| Compound 7 | −55.02 | −18.20 | 2.84 | −1.68 | −17.12 | −7.56 | 21.31 | −34.61 | |
| Compound 8 | −57.98 | −9.78 | 4.95 | −1.19 | −19.13 | −4.56 | 12.31 | −40.58 | |
| 5-HT2A | Compound 5 | −28.18 | −23.58 | 17.14 | −2.13 | −13.08 | −1.58 | 25.34 | −30.29 |
| Compound 6 | −45.58 | −18.22 | 6.91 | −2.11 | −15.70 | −0.49 | 19.58 | −35.55 | |
| Compound 7 | −36.15 | −17.54 | 0.83 | −1.16 | −8.45 | −7.36 | 13.55 | −16.02 | |
| Compound 8 | −57.90 | −9.78 | 4.95 | −1.19 | −19.13 | −4.56 | 12.31 | −40.5 |
Disclaimer/Publisher’s Note: The statements, opinions and data contained in all publications are solely those of the individual author(s) and contributor(s) and not of MDPI and/or the editor(s). MDPI and/or the editor(s) disclaim responsibility for any injury to people or property resulting from any ideas, methods, instructions or products referred to in the content. |
© 2023 by the authors. Licensee MDPI, Basel, Switzerland. This article is an open access article distributed under the terms and conditions of the Creative Commons Attribution (CC BY) license (https://creativecommons.org/licenses/by/4.0/).
Share and Cite
Al-Massarani, S.M.; Aldurayhim, L.S.; Alotaibi, I.A.; Abdelmageed, M.W.M.; Rehman, M.T.; Basudan, O.A.; Abdel-Kader, M.S.; Alajmi, M.F.; Abdel Bar, F.M.; Alam, P.; et al. Biomarker Quantification, Spectroscopic, and Molecular Docking Studies of the Active Compounds Isolated from the Edible Plant Sisymbrium irio L. Pharmaceuticals 2023, 16, 498. https://doi.org/10.3390/ph16040498
Al-Massarani SM, Aldurayhim LS, Alotaibi IA, Abdelmageed MWM, Rehman MT, Basudan OA, Abdel-Kader MS, Alajmi MF, Abdel Bar FM, Alam P, et al. Biomarker Quantification, Spectroscopic, and Molecular Docking Studies of the Active Compounds Isolated from the Edible Plant Sisymbrium irio L. Pharmaceuticals. 2023; 16(4):498. https://doi.org/10.3390/ph16040498
Chicago/Turabian StyleAl-Massarani, Shaza M., Latifah S. Aldurayhim, Ibtisam A. Alotaibi, Mostafa W. M. Abdelmageed, Md Tabish Rehman, Omer A. Basudan, Maged S. Abdel-Kader, Mohamed F. Alajmi, Fatma M. Abdel Bar, Perwez Alam, and et al. 2023. "Biomarker Quantification, Spectroscopic, and Molecular Docking Studies of the Active Compounds Isolated from the Edible Plant Sisymbrium irio L." Pharmaceuticals 16, no. 4: 498. https://doi.org/10.3390/ph16040498