


Compensative Resistance to Erastin-Induced Ferroptosis in GPX4 Knock-Out Mutants in HCT116 Cell Lines

 , , and
Abstract
: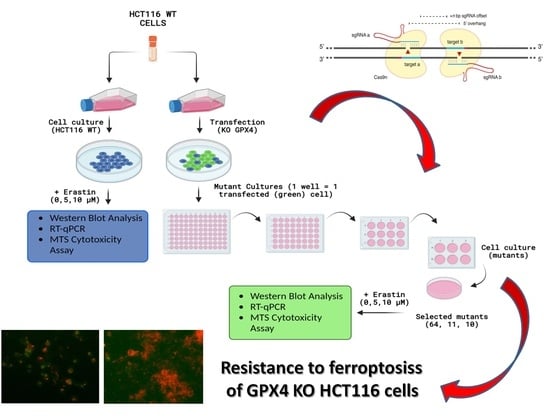
1. Introduction
2. Results
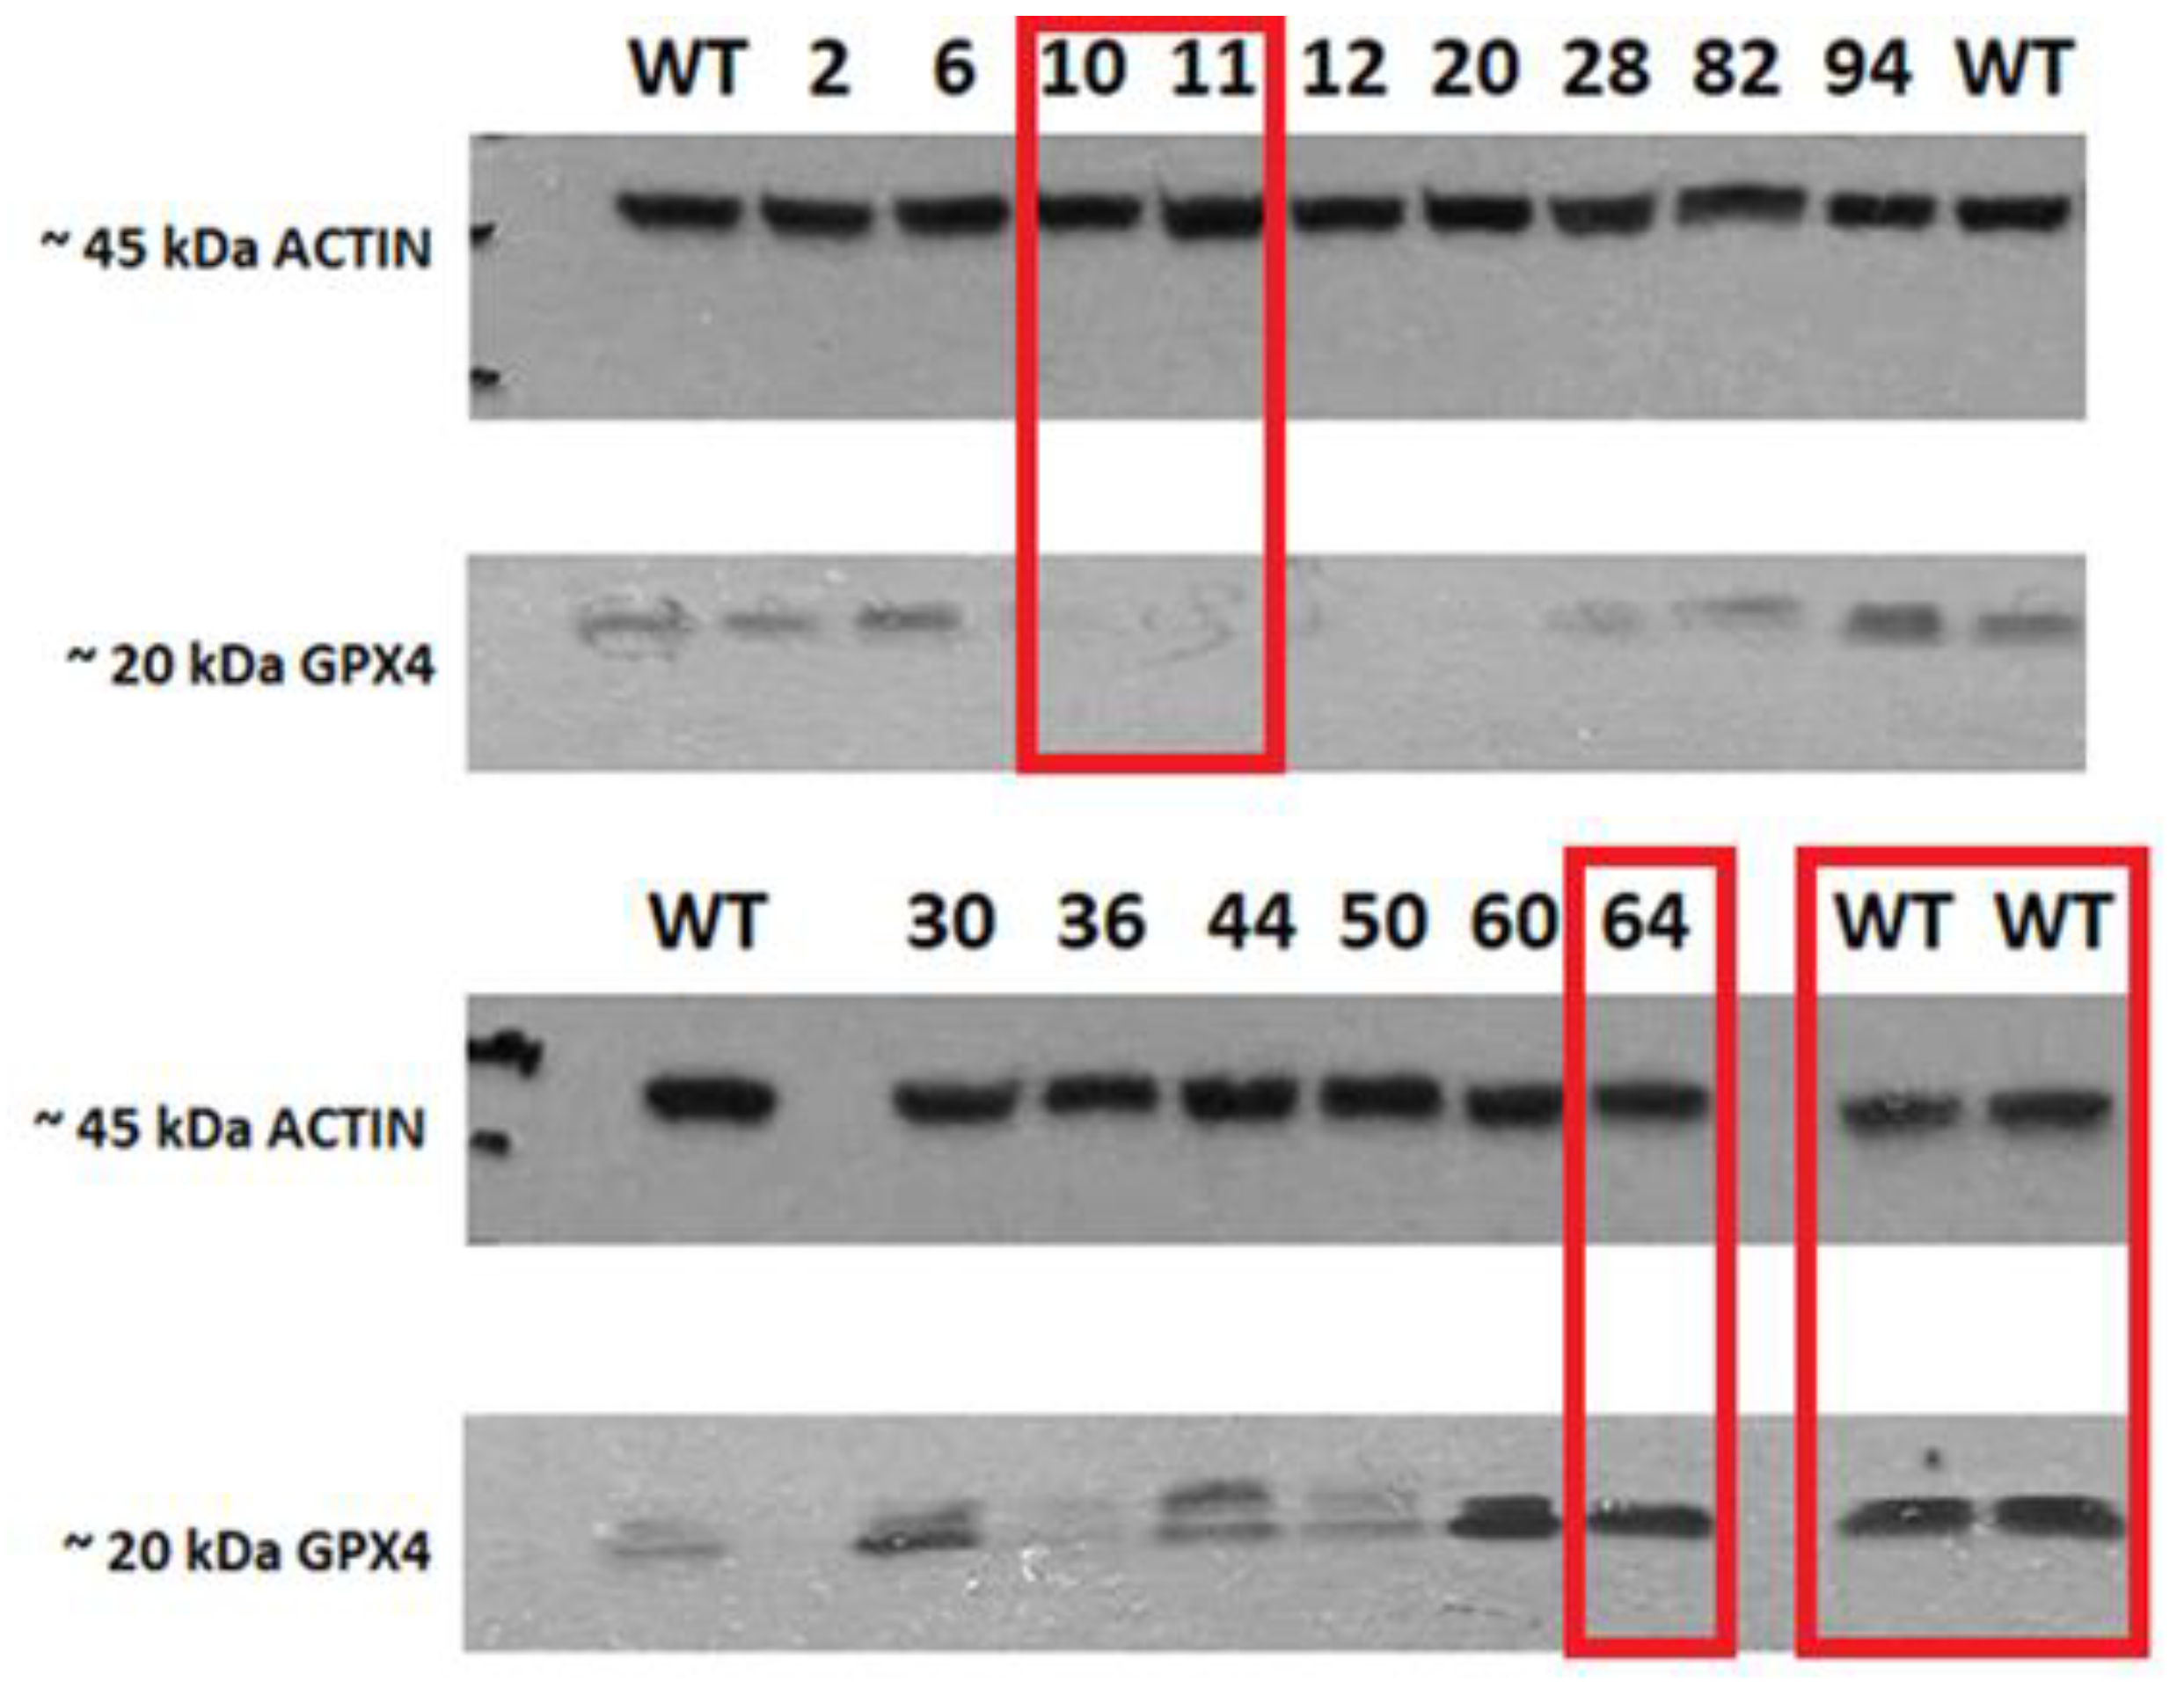
2.1. Evaluation of CRISPR/Cas-9 Knock-Out for GPX4 by Western Blot
2.2. Cell Viability after Ferroptosis Induction
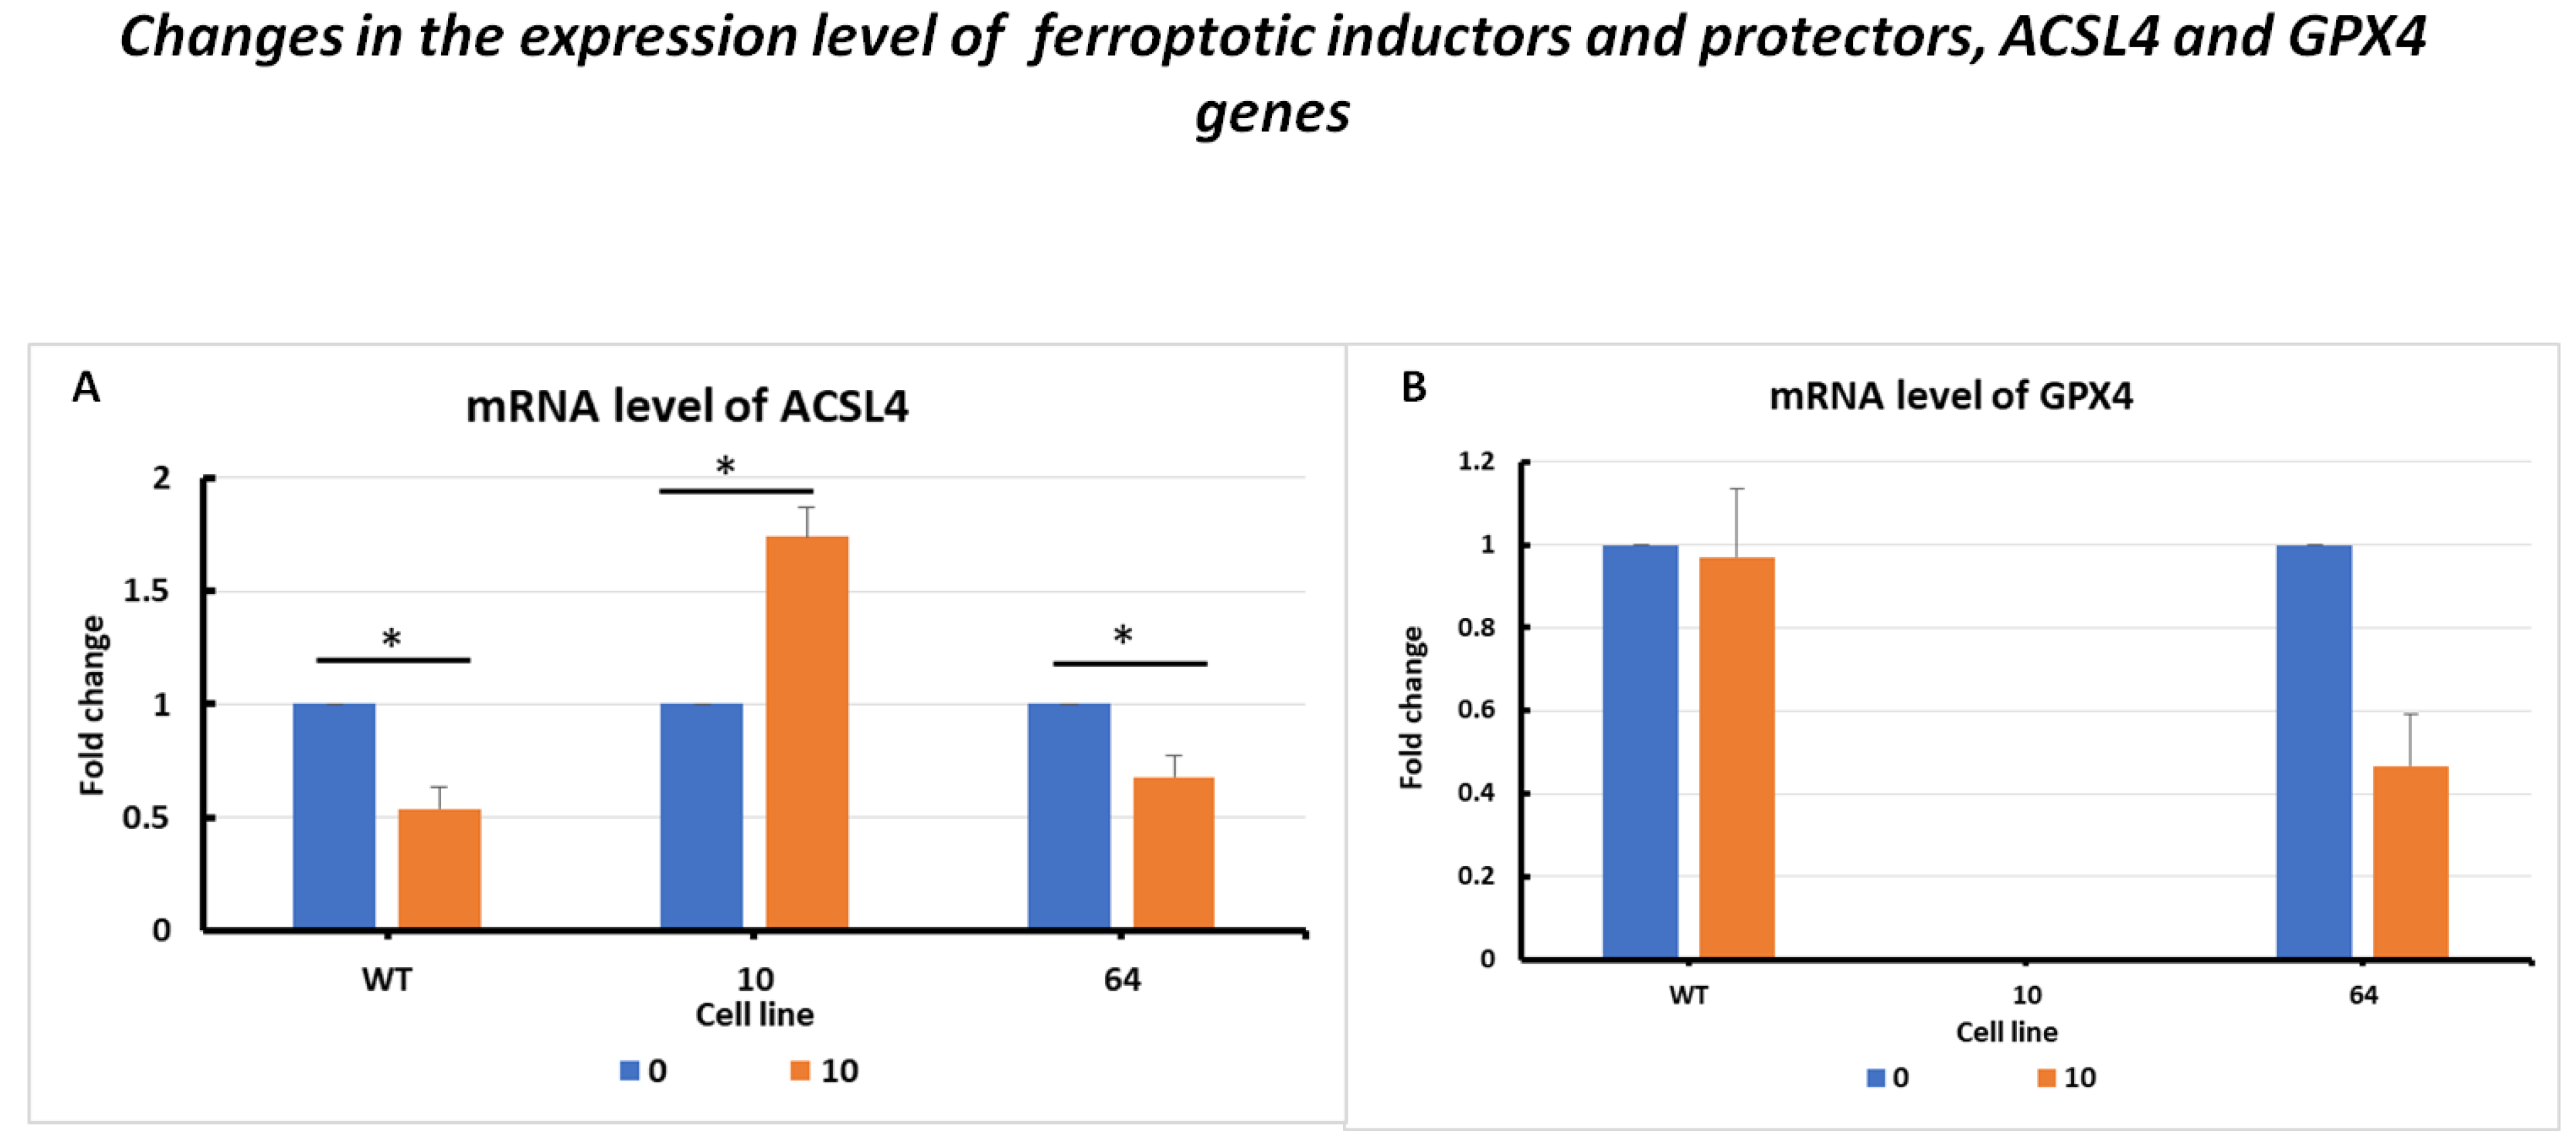
2.3. Changes in the Expression Levels of Ferroptotic Pathway Marker Genes
2.3.1. Changes in the Expression Levels of the Inductors and Protectors against Ferroptosis, ACSL4 and GPX4 Genes
2.3.2. Changes in the Expression Levels of Intra- and Extracellular Iron Transporters, TFRC and FSP1 Genes
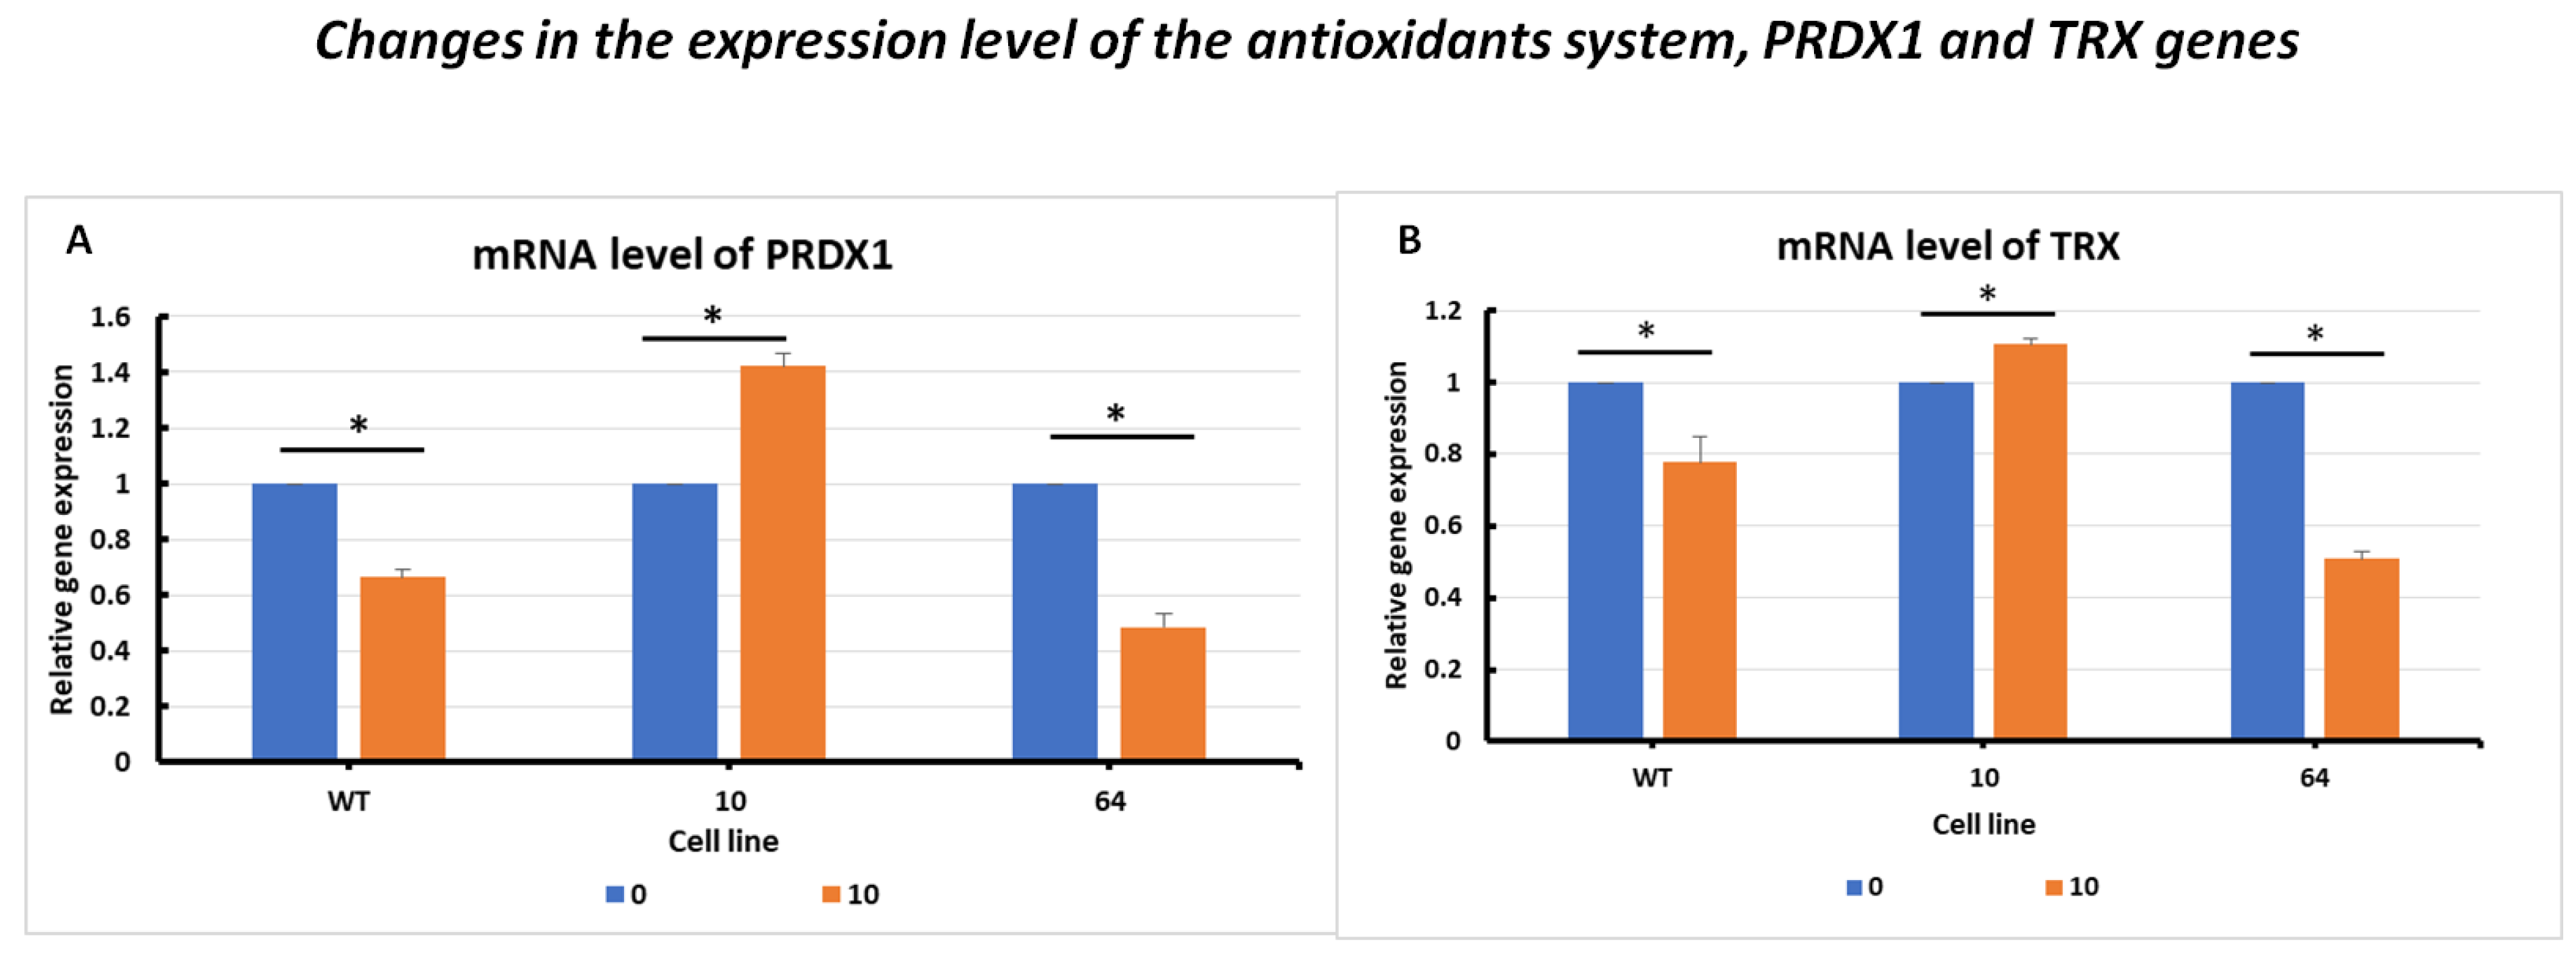
2.3.3. Changes in the Expression Level of the Antioxidant System, PRDX1 and TRX Genes
2.3.4. Changes in the Expression Level of Extracellular Small Vehicle Production, PROM1 and PROM2 Genes
2.4. Correlations between Genes
3. Discussion
3.1. Sensitiveness to Ferroptosis Induction upon GPX4 Status in HCT116 Cell Lines
3.2. Alternative Antioxidant System upon Erastin Regulation
3.3. Iron Homeostasis for Intracellular Ferroptosis Execution
- During ferroptosis induction, an increase in cellular labile iron is typically observed [28];
- Excess heme and non-heme iron can directly induce ferroptosis [30];
- Iron increases cell sensitivity to ferroptosis inducers (e.g., erastin) [29];
- Iron chelators block ferroptotic cell death in vitro and in vivo [29];
- Several heme and non-heme iron-containing enzymes, such as ALOX, NOX, and CYP, are responsible for lipid peroxidation [31].
4. Materials and Methods
4.1. Cell Culture
4.2. MTS Cytotoxicity Assay
4.2.1. IC50 Determination
4.2.2. Modification of HCT116 Cell Lines
4.2.3. Western Blot CRISPR/Cas-9 Mutant’s Protein Detection
4.2.4. Real-Time qPCR for Marker Genes Evaluation
4.2.5. RT-qPCR and Data Statistical Analysis
5. Conclusions
Supplementary Materials
Author Contributions
Funding
Institutional Review Board Statement
Informed Consent Statement
Data Availability Statement
Acknowledgments
Conflicts of Interest
References
- Seibt, T.M.; Proneth, B.; Conrad, M. Role of GPX4 in ferroptosis and its pharmacological implication. Free Radic. Biol. Med. 2019, 133, 144–152. [Google Scholar] [CrossRef] [PubMed]
- Ma, T.; Du, J.; Zhang, Y.; Wang, Y.; Wang, B.; Zhang, T. GPX4-independent ferroptosis—A new strategy in disease’s therapy. Cell Death Discov. 2022, 8, 1–8. [Google Scholar] [CrossRef] [PubMed]
- Song, X.; Wang, X.; Liu, Z.; Yu, Z. Role of GPX4-Mediated Ferroptosis in the Sensitivity of Triple Negative Breast Cancer Cells to Gefitinib. Front. Oncol. 2020, 10, 597434. [Google Scholar] [CrossRef]
- Available online: https://ec.europa.eu/eurostat/statistics-explained/index.php?title=Causes_of_death_statistics (accessed on 6 June 2023).
- Available online: https://en.wikipedia.org/wiki/List_of_causes_of_death_by_rate (accessed on 6 June 2023).
- Hassannia, B.; Vandenabeele, P.; Vanden Berghe, T. Targeting Ferroptosis to Iron Out Cancer. Cancer Cell 2019, 35, 830–849. [Google Scholar] [CrossRef] [PubMed]
- Nie, Q.; Hu, Y.; Yu, X.; Li, X.; Fang, X. Induction and application of ferroptosis in cancer therapy. Cancer Cell Int. 2022, 22, 12. [Google Scholar] [CrossRef]
- Cai, H.; Ren, Y.; Chen, S.; Wang, Y.; Chu, L. Ferroptosis and tumor immunotherapy: A promising combination therapy for tumors. Front. Oncol. 2023, 13, 1119369. [Google Scholar] [CrossRef] [PubMed]
- Zhou, Y.; Shen, Y.; Chen, C.; Sui, X.; Yang, J.; Wang, L.; Zhou, J. The crosstalk between autophagy and ferroptosis: What can we learn to target drug resistance in cancer? Cancer Biol. Med. 2019, 16, 630–646. [Google Scholar] [CrossRef]
- Baskar, R.; Lee, K.A.; Yeo, R.; Yeoh, K.W. Cancer and radiation therapy: Current advances and future directions. Int. J. Med. Sci. 2012, 9, 193–199. [Google Scholar] [CrossRef]
- Lei, G.; Zhang, Y.; Koppula, P.; Liu, X.; Zhang, J.; Lin, S.H.; Ajani, J.A.; Xiao, Q.; Liao, Z.; Wang, H.; et al. The role of ferroptosis in ionizing radiation-induced cell death and tumor suppression. Cell Res. 2020, 30, 146–162. [Google Scholar] [CrossRef]
- Pan, X.; Lin, Z.; Jiang, D.; Yu, Y.; Yang, D.; Zhou, H.; Zhan, D.; Liu, S.; Peng, G.; Chen, Z.; et al. Erastin decreases radioresistance of NSCLC cells partially by inducing GPX4-mediated ferroptosis. Oncol. Lett. 2019, 17, 3001–3008. [Google Scholar] [CrossRef]
- Shibata, Y.; Yasui, H.; Higashikawa, K.; Miyamoto, N.; Kuge, Y. Erastin, a ferroptosis-inducing agent, sensitized cancer cells to X-ray irradiation via glutathione starvation in vitro and in vivo. PLoS ONE 2019, 14, e0225931. [Google Scholar] [CrossRef]
- Sleire, L.; Skeie, B.S.; Netland, I.A.; Førde, H.E.; Dodoo, E.; Selheim, F.; Leiss, L.; Heggdal, J.I.; Pedersen, P.H.; Wang, J.; et al. Drug repurposing: Sulfasalazine sensitizes gliomas to gamma knife radiosurgery by blocking cystine uptake through system Xc-, leading to glutathione depletion. Oncogene 2015, 34, 5951–5959. [Google Scholar] [CrossRef]
- Nackiewicz, J.; Gąsowska-Bajger, B.; Kołodziej, L.; Poliwoda, A.; Pogoda-Mieszczak, K.; Skonieczna, M. Comparison of the degradation mechanisms of diclofenac in the presence of iron octacarboxyphthalocyanine and myeloperoxidase. Spectrochim. Acta Part A Mol. Biomol. Spectrosc. 2023, 287 Pt 2, 122113. [Google Scholar] [CrossRef] [PubMed]
- Li, J.; Cao, F.; Yin, H.; Huang, Z.; Lin, Z.; Mao, N.; Sun, B.; Wang, G. Ferroptosis: Past, Present and Future. Cell Death Dis. 2020, 11, 1–13. [Google Scholar] [CrossRef]
- Liu, H.; Hu, H.; Li, G.; Zhang, Y.; Wu, F.; Liu, X.; Wang, K.; Zhang, C.; Jiang, T. Ferroptosis-Related Gene Signature Predicts Glioma Cell Death and Glioma Patient Progression. Front. Cell Dev. Biol. 2020, 8, 538. [Google Scholar] [CrossRef] [PubMed]
- Zhou, N.; Yuan, X.; Du, Q.; Zhang, Z.; Shi, X.; Bao, J.; Ning, Y.; Peng, L. FerrDb V2: Update of the manually curated database of ferroptosis regulators and ferroptosis-disease associations. Nucleic Acids Res. 2023, 51, D571–D582. [Google Scholar] [CrossRef]
- Homma, T.; Kobayashi, S.; Conrad, M.; Konno, H.; Yokoyama, C.; Fujii, J. Nitric Oxide Protects against Ferroptosis by Aborting the Lipid Peroxidation Chain Reaction. Nitric Oxide 2021, 115, 34–43. [Google Scholar] [CrossRef] [PubMed]
- Brown, C.W.; Amante, J.J.; Chhoy, P.; Elaimy, A.L.; Liu, H.; Zhu, L.J.; Baer, C.E.; Dixon, S.J.; Mercurio, A.M. Prominin2 Drives Ferroptosis Resistance by Stimulating Iron Export. Dev. Cell 2019, 51, 575–586. [Google Scholar] [CrossRef]
- Tang, D.; Chen, X.; Kang, R.; Kroemer, G. Ferroptosis: Molecular Mechanisms and Health Implications. Cell Res. 2021, 31, 107–125. [Google Scholar] [CrossRef]
- Moriwaki, T.; Yoshimura, A.; Tamari, Y.; Sasanuma, H.; Takeda, S.; Seki, M.; Tano, K. PRDX1 Is Essential for the Viability and Maintenance of Reactive Oxygen Species in Chicken DT40. Genes Environ. 2021, 43, 35. [Google Scholar] [CrossRef]
- Harris, I.S.; Treloar, A.E.; Inoue, S.; Sasaki, M.; Gorrini, C.; Lee, K.C.; Yung, K.Y.; Brenner, D.; Knobbe-Thomsen, C.B.; Cox, M.A.; et al. Glutathione and Thioredoxin Antioxidant Pathways Synergize to Drive Cancer Initiation and Progression. Cancer Cell 2015, 27, 211–222. [Google Scholar] [CrossRef] [PubMed]
- Llabani, E.; Hicklin, R.W.; Lee, H.Y.; Motika, S.E.; Crawford, L.A.; Weerapana, E.; Hergenrother, P.J. Diverse Compounds from Pleuromutilin Lead to a Thioredoxin Inhibitor and Inducer of Ferroptosis. Nat. Chem. 2019, 11, 521–532. [Google Scholar] [CrossRef] [PubMed]
- Bersuker, K.; Hendricks, J.M.; Li, Z.; Magtanong, L.; Ford, B.; Tang, P.H.; Roberts, M.A.; Tong, B.; Maimone, T.J.; Zoncu, R.; et al. The CoQ Oxidoreductase FSP1 Acts Parallel to GPX4 to Inhibit Ferroptosis. Nature 2019, 575, 688–692. [Google Scholar] [CrossRef] [PubMed]
- Hadian, K. Ferroptosis Suppressor Protein 1 (FSP1) and Coenzyme Q10 Cooperatively Suppress Ferroptosis. Biochemistry 2020, 59, 637–638. [Google Scholar] [CrossRef] [PubMed]
- Chen, X.; Yu, C.; Kang, R.; Tang, D. Iron Metabolism in Ferroptosis. Front. Cell Dev. Biol. 2020, 8, 590226. [Google Scholar] [CrossRef]
- Hou, W.; Xie, Y.; Song, X.; Sun, X.; Lotze, M.T.; Zeh, H.J.; Kang, R.; Tang, D. Autophagy Promotes Ferroptosis by Degradation of Ferritin. Autophagy 2016, 12, 1425–1428. [Google Scholar] [CrossRef]
- Dixon, S.J.; Lemberg, K.M.; Lamprecht, M.R.; Skouta, R.; Zaitsev, E.M.; Gleason, C.E.; Patel, D.N.; Bauer, A.J.; Cantley, A.M.; Yang, W.S.; et al. Ferroptosis: An Iron-Dependent Form of Nonapoptotic Cell Death. Cell 2012, 149, 1060–1072. [Google Scholar] [CrossRef]
- Li, Q.; Han, X.; Lan, X.; Gao, Y.; Wan, J.; Durham, F.; Cheng, T.; Yang, J.; Wang, Z.; Jiang, C.; et al. Inhibition of Neuronal Ferroptosis Protects Hemorrhagic Brain. JCI Insight 2017, 2, 1–19. [Google Scholar] [CrossRef]
- Yang, W.-H.; Huang, Z.; Wu, J.; Ding, C.-K.C.; Murphy, S.K.; Chi, J.-T. A TAZ–ANGPTL4–NOX2 Axis Regulates Ferroptotic Cell Death and Chemoresistance in Epithelial Ovarian Cancer. Mol. Cancer Res. 2020, 18, 79–90. [Google Scholar] [CrossRef]
- Livak, K.J.; Schmittgen, T.D. Analysis of Relative Gene Expression Data Using Real-Time Quantitative PCR and the 2−ΔΔCT Method. Methods 2001, 25, 402–408. [Google Scholar] [CrossRef]
- Adamiec-Organisciok, M. Regulation of Programmed and Unprogrammed Cell Death in Various Cell Lines. Ph.D. Thesis, Silesian University of Technology, Gliwice, Poland, 2023. [Google Scholar]


| Cell Line | IC50 [µM] | Cell Survival Graphs |
|---|---|---|
| HCT116 WT | 10.46 ± 0.32 |  |
| HCT116 positive control (mutant No. 64) | 18.48 ± 4.36 |  |
| HCT116 GPX4 KO (mutant No. 10) | 10.85 ± 2.58 |  |
| HCT116 GPX4 KO (mutant No. 11) | 11.12 ±1.05 |  |
| Primary Antibodies | |||||
|---|---|---|---|---|---|
| Lp. | Antibody | Organism | Manufacturer | Used Dilution | Antibody Dilution Solution |
| 1 | anti-GPX4 | rabbit | Proteintech | 1:500 | 5% milk solution |
| 2 | anti-β-actin | rabbit | Sigma-Aldrich | 1:5000 | 5% milk solution |
| Secondary Antibodies | |||||
| 1 | anti-rabbit | mouse | Santa Cruz Biotechnology | 1:20,000 for GPX4 detection, 1:10,000 for β-actin detection | 5% milk solution |
| Gene ID | Temperature [°C] | Forward Primer Sequence | Reverse Primer Sequence |
|---|---|---|---|
| TFRC | 57 | 5′ GGAGACTGTCCCTCTGACTGG 3′ | 5′ GCTTCACATTCTTGCTTTCTGAG 3′ |
| ACSL4 | 57 | 5′ GCTATCTCCTCAGACACACCGA 3′ | 5′ AGGTGCTCCAACTCTGCCAGTA 3′ |
| GPX4 | 63 | 5′ AGTGAGGCAAGACCGAAGTAA 3′ | 5′ CTTCCCGAACTGGTTACACG 3′ |
| PROM1 | 60 | 5′ TCCACAGATGCTCCTAAGGC 3′ | 5′ GCGGCTGTACCACATAGAGA 3′ |
| PROM2 | 60.2 | 5′ AGAGCACCTGACATTCACCC 3′ | 5′ CTCGTACCGCACCACCTCAT 3′ |
| FSP1 | 62 | 5′ CTGCCCTTCTCTCATCTTATCCT 3′ | 5′ CTGCCTCACCATGTCCTCATAG 3′ |
| TRX | 58 | 5′ TGAAGCAGATCGAGAGCAAGAC 3′ | 5′ TTCATTAATGGTGGCTTCAAGC 3′ |
| PRDX1 | 54.4 | 5′ TCCTTTGGTATCAGACCCGA 3′ | 5′ GAGATGCCTTCATCAGCCTTT 3′ |
| RPL41 | 57–62 | 5′ TCCTGCGTTGGGATTCCGTG 3′ | 5′ ACGGTGCAACAAGCTAGCGG 3′ |
Disclaimer/Publisher’s Note: The statements, opinions and data contained in all publications are solely those of the individual author(s) and contributor(s) and not of MDPI and/or the editor(s). MDPI and/or the editor(s) disclaim responsibility for any injury to people or property resulting from any ideas, methods, instructions or products referred to in the content. |
© 2023 by the authors. Licensee MDPI, Basel, Switzerland. This article is an open access article distributed under the terms and conditions of the Creative Commons Attribution (CC BY) license (https://creativecommons.org/licenses/by/4.0/).
Share and Cite
Adamiec-Organisciok, M.; Wegrzyn, M.; Cienciala, L.; Sojka, D.; Nackiewicz, J.; Skonieczna, M. Compensative Resistance to Erastin-Induced Ferroptosis in GPX4 Knock-Out Mutants in HCT116 Cell Lines. Pharmaceuticals 2023, 16, 1710. https://doi.org/10.3390/ph16121710
Adamiec-Organisciok M, Wegrzyn M, Cienciala L, Sojka D, Nackiewicz J, Skonieczna M. Compensative Resistance to Erastin-Induced Ferroptosis in GPX4 Knock-Out Mutants in HCT116 Cell Lines. Pharmaceuticals. 2023; 16(12):1710. https://doi.org/10.3390/ph16121710
Chicago/Turabian StyleAdamiec-Organisciok, Malgorzata, Magdalena Wegrzyn, Lukasz Cienciala, Damian Sojka, Joanna Nackiewicz, and Magdalena Skonieczna. 2023. "Compensative Resistance to Erastin-Induced Ferroptosis in GPX4 Knock-Out Mutants in HCT116 Cell Lines" Pharmaceuticals 16, no. 12: 1710. https://doi.org/10.3390/ph16121710