


Searching for Natural Aurora a Kinase Inhibitors from Peppers Using Molecular Docking and Molecular Dynamics


Abstract
:1. Introduction

| No. | Ligand | Ligand Name | IC50 [µM] | LogP | Molar Mass |
|---|---|---|---|---|---|
| 1 |  | 7-(4-methylphenyl)piperlongumine | 4.9 [15] | 3.36 | 407.47 |
| 2 |  | flavokawain B | 9.4 [16] | 2.67 | 328.36 |
| 3 |  | Capsaicin | 53 [17] | 3.53 | 305.42 |
| 4 |  | 7-(4-methoxyphenyl)piperlongumine | 1.6 [15] | 2.64 | 423.47 |
| 5 |  | 2,2′,4′,6′-tetramethoxychalcone | 8.9 [16] | 2.67 | 328.36 |
| 6 |  | 3,2′,4′,6′-tetramethoxychalcone | 10.5 [16] | 2.63 | 314.34 |
| 7 |  | chabamide F | 49.9 [18] | 3.68 | 542.63 |
| 8 |  | 2′,4′,6′-tetramethoxychalcone | 9.4 [16] | 2.92 | 298.34 |
| 9 |  | 2′-hydroxy-2,4′,6′-trimethoxychalcone | 10.3 [16] | 2.63 | 314.34 |
| 10 |  | eupomatenoid-5 | 21.2 [19] | 3.33 | 293.34 |
| 11 |  | 2′-hydroxy-4′,6′-dimethoxychalcone | 38.4 [16] | 2.89 | 284.31 |
| 12 |  | chabamide G | 51.4 [18] | 3.68 | 542.63 |
| 13 |  | Piperine | 99 [20] | 2.72 | 285.34 |
| 14 |  | 4-tertbutyl-N′-1,3-benzodioxolebenzenesulphonohydrazone | 142.4 [21] | 4.76 | 360.43 |
| 15 |  | 4-tertbutyl-N′-(4-hydroxy-3-methoxy)benzylbenzenesulphonohydrazone | 144.6 [21] | 4.54 | 362.44 |
| 16 |  | 3′-methoxymiliumollin-10-al | 169.1 [22] | 3.16 | 284.31 |
2. Results and Discussion
3. Materials and Methods
- Molecular docking validation
- In this study, 12 ligands with known affinity to Aurka expressed as Kd (PubChem AID 624919) were docked to Aurora A kinase using 3 programs (Surflex—Sybyl X 1.2, AutoDock 4.2, and Glide 6.6.), (Table S1, supplementary materials);
- Kd values were correlated with scoring functions from 3 programs. The best results were obtained by Surflex, so it was recommended for further analysis (Figure S1);
- To check the correctness of docking, ligand from crystal structure 3H10 was redocked, and the low-energy conformation was compared to conformation from the crystal structure (Figure S2, supplementary materials);
- Ligands with lower affinity to Aurka (structures and Kd from PubChem AID 624919) were docked to Aurora A using Surflex (Figure S3, supplementary materials).
- Molecular docking
- Molecular dynamics (MD)
3.1. Structures Preparation
3.2. Molecular Docking
3.2.1. Active Site Identification and Grid Generation
3.2.2. Ligands Preparation
3.2.3. Glide XP-Ligand Docking
3.2.4. MM-GBSA Calculations
3.3. Molecular Dynamics (MD) Simulations
4. Conclusions
Supplementary Materials
Author Contributions
Funding
Institutional Review Board Statement
Informed Consent Statement
Data Availability Statement
Conflicts of Interest
References
- Giet, R.; Prigent, C.J. Aurora/Ipl1p-related kinases, a new oncogenic family of mitotic serine-threonine kinases. J. Cell Sci. 1999, 112, 3591–3601. [Google Scholar] [CrossRef] [PubMed]
- Kollareddy, M.; Zheleva, D.; Dzubak, P.; Brahmkshatriya, P.S.; Lepsik, M.; Hajduch, M. Aurora kinase inhibitors: Progress towards the clinic. Investig. New Drugs 2012, 30, 2411–2432. [Google Scholar] [CrossRef]
- Mountzios, G.; Terpos, E.; Dimopoulos, M.A. Aurora kinases as targets for cancer therapy. Cancer Treat. Rev. 2008, 34, 175–182. [Google Scholar] [CrossRef]
- Lee, H.H.; Zhu, Y.; Govindasamy, K.M.; Gopalan, G. Downregulation of Aurora-A overrides estrogen-mediated growth and chemoresistance in breast cancer cells. Endocr.-Relat. Cancer 2008, 15, 765–775. [Google Scholar] [CrossRef]
- Yang, N.; Wang, C.; Wang, J.; Wang, Z.; Huang, D.; Yan, M.; Kamran, M.; Liu, Q.; Xu, B. Aurora kinase A stabilizes FOXM1 to enhance paclitaxel resistance in triple-negative breast cancer. J. Cell. Mol. Med. 2019, 23, 6442–6453. [Google Scholar] [CrossRef]
- Meulenbeld, H.J.; Mathijssen, R.H.; Verweij, J.; de Wit, R.; de Jonge, M. Danusertib, an aurora kinase inhibitor. Expert Opin. Investig. Drugs 2012, 21, 383–393. [Google Scholar] [CrossRef]
- Manfredi, M.G.; Ecsedy, J.A.; Meetze, K.A.; Balani, S.K.; Burenkova, O.; Chen, W.; Galvin, K.M.; Hoar, K.M.; Huck, J.J.; LeRoy, P. Antitumor activity of MLN8054, an orally active small-molecule inhibitor of Aurora A kinase. Proc. Natl. Acad. Sci. USA 2007, 104, 4106–4111. [Google Scholar] [CrossRef] [PubMed]
- Qi, W.; Cooke, L.S.; Liu, X.; Rimsza, L.; Roe, D.J.; Persky, A.M.D.O.; Miller, T.P.; Mahadevan, D. Aurora inhibitor MLN8237 in combination with docetaxel enhances apoptosis and anti-tumor activity in mantle cell lymphoma. Biochem. Pharmacol. 2011, 81, 881–890. [Google Scholar] [CrossRef]
- Huh, H.C.; Lee, S.Y.; Lee, S.K.; Park, N.H.; Han, I.S. Capsaicin induces apoptosis of cisplatin-resistant stomach cancer cells by causing degradation of cisplatin-inducible Aurora-A protein. Nutr. Cancer 2011, 63, 1095–1103. [Google Scholar] [CrossRef] [PubMed]
- Aziz, N.; Kim, M.Y.; Cho, J.Y. Anti-inflammatory effects of luteolin: A review of in vitro, in vivo, and in silico studies. J. Ethnopharmacol. 2018, 225, 342–358. [Google Scholar] [CrossRef]
- Meng, X.-Y.; Zhang, H.-X.; Mezei, M.; Cui, M. Molecular docking: A powerful approach for structure-based drug discovery. Curr. Comp. Aided Drug Des. 2011, 7, 146–157. [Google Scholar] [CrossRef] [PubMed]
- Raghav, P.K.; Kumar, R.; Kumar, V.; Raghava, G.P. Docking-based approach for identification of mutations that disrupt binding between Bcl-2 and Bax proteins: Inducing apoptosis in cancer cells. Mol. Genet. Genom. Med. 2019, 7, e910. [Google Scholar] [CrossRef] [PubMed]
- Raghav, P.K.; Singh, A.K.; Gangenahalli, G. A change in structural integrity of c-Kit mutant D816V causes constitutive signaling. Mutat. Res. 2018, 808, 28–38. [Google Scholar] [CrossRef] [PubMed]
- Raghav, P.K.; Verma, Y.K.; Gangenahalli, G.U. Molecular dynamics simulations of the Bcl-2 protein to predict the structure of its unordered flexible loop domain. J. Mol. Model. 2012, 18, 1885–1906. [Google Scholar] [CrossRef] [PubMed]
- Puunganuru, S.R.; Madala, H.R.; Venugopal, S.N.; Samala, R.; Mikelis, C.; Srivenugopal, K.S. Design and synthesis of a C7-aryl piperlongumine derivative with potent antimicrotubule and mutant p53-reactivating properties. Eur. J. Med. Chem. 2016, 107, 233–244. [Google Scholar] [CrossRef] [PubMed]
- T Tang, Y.; Li, X.; Liu, Z.; Simoneau, A.R.; Xie, J.; Zi, X. Flavokawain B, a kava chalcone, induces apoptosis via up-regulation of death-receptor 5 and Bim expression in androgen receptor negative, hormonal refractory prostate cancer cell lines and reduces tumor growth. Int. J. Cancer 2010, 127, 1758–1768. [Google Scholar] [CrossRef]
- Bley, K.; Boorman, G.; Mohammad, B.; McKenzie, D.; Babbar, S. A comprehensive review of the carcinogenic and anticarcinogenic potential of capsaicin. Toxicol. Pathol. 2012, 40, 847–873. [Google Scholar] [CrossRef]
- Rao, V.R.S.; Suresh, G.; Babu, K.S.; Raju, S.S.; Ramakrishna, S.; Rao, J.M. Novel dimeric amide alkaloids from Piper chaba Hunter: Isolation, cytotoxic activity, and their biomimetic synthesis. Tetrahedron 2011, 67, 1885–1892. [Google Scholar] [CrossRef]
- Longato, G.B.; Rizzo, L.Y.; de Oliveira Sousa, I.M.; Tinti, S.V.; Possenti, A.; Figueira, G.M.; Ruiz, A.L.T.G.; Foglio, M.A.; de Carvalho, J.E. In vitro and in vivo anticancer activity of extracts, fractions, and eupomatenoid-5 obtained from Piper regnellii leaves. Planta Med. 2011, 77, 1482–1488. [Google Scholar] [CrossRef]
- Rama Subba Rao, V.; Suresh, G.; Ranga Rao, R.; Suresh Babu, K.; Chashoo, G.; Saxena, A.; Madhusudana Rao, J. Synthesis of piperine–amino acid ester conjugates and study of their cytotoxic activities against human cancer cell lines. Med. Chem. Res. 2012, 21, 38–46. [Google Scholar] [CrossRef]
- Fernandes, T.B.; de Azevedo, R.A.; Yang, R.; Teixeira, S.F.; Goulart Trossini, G.H.; Marzagao Barbuto, J.A.; Ferreira, A.K.; Parise-Filho, R. Arylsulfonylhydrazone induced apoptosis in MDA-MB-231 breast cancer cells. Lett. Drug Des. Discov. 2018, 15, 1288–1298. [Google Scholar] [CrossRef]
- Sawasdee, K.; Chaowasku, T.; Lipipun, V.; Dufat, T.-H.; Michel, S.; Likhitwitayawuid, K. Neolignans from leaves of Miliusa mollis. Fitoterapia 2013, 85, 49–56. [Google Scholar] [CrossRef] [PubMed]
- Raghav, P.K.; Verma, Y.K.; Gangenahalli, G.U. Peptide screening to knockdown Bcl-2’s anti-apoptotic activity: Implications in cancer treatment. Int. J. Mol. Biol. Macromol. 2012, 50, 796–814. [Google Scholar] [CrossRef]
- Schellens, J.; Boss, D.; Witteveen, P.; Zandvliet, A.; Beijnen, J.; Voogel-Fuchs, M.; Morris, C.; Wilson, D.; Voest, E. Phase I and pharmacological study of the novel aurora kinase inhibitor AZD1152. J. Clin. Oncol. 2006, 24, 3008. [Google Scholar] [CrossRef]
- Saiprasad, G.; Chitra, P.; Manikandan, R.; Sudhandiran, G. Hesperadin induces apoptosis and triggers autophagic markers through inhibition of Aurora-A mediated phosphoinositide-3-kinase/Akt/mammalian target of rapamycin and glycogen synthase kinase-3 beta signalling cascades in experimental colon carcinogenesis. Eur. J. Cancer 2014, 50, 2489–2507. [Google Scholar] [CrossRef] [PubMed]
- Katayama, H.; Sen, S. Aurora kinase inhibitors as anticancer molecules. Biochim. Biophys. Acta Gene Regul. Mech. 2010, 1799, 829–839. [Google Scholar] [CrossRef] [PubMed]
- Selleck Chemicals. Available online: https://www.selleckchem.com/ (accessed on 12 August 2022).
- Talele, T.T.; McLaughlin, M.L. Modelling. Molecular docking/dynamics studies of Aurora A kinase inhibitors. J. Mol. Graph. Model. 2008, 26, 1213–1222. [Google Scholar] [CrossRef]
- Siudem, P.; Paradowska, K.; Bukowicki, J. Conformational analysis of capsaicin using 13C, 15N MAS NMR, GIAO DFT and GA calculations. J. Mol. Struct. 2017, 1146, 773–781. [Google Scholar] [CrossRef]
- Siudem, P.; Bukowicki, J.; Wawer, I.; Paradowska, K. Structural studies of two capsaicinoids: Dihydrocapsaicin and nonivamide. 13 C and 15 N MAS NMR supported by genetic algorithm and GIAO DFT calculations. RSC Adv. 2020, 10, 18082–18092. [Google Scholar] [CrossRef]
- Siudem, P.; Paradowska, K. Structure, function, and mechanism of action of the vanilloid TRPV1 receptor. Postępy Hig. I Med. Doświadczalnej 2020, 74, 481–488. [Google Scholar] [CrossRef]
- Darré, L.; Domene, C. Binding of capsaicin to the TRPV1 ion channel. Mol. Pharm. 2015, 12, 4454–4465. [Google Scholar] [CrossRef] [PubMed]
- Leo, A.; Hansch, C.; Elkins, D. Partition coefficients and their uses. Chem. Rev. 1971, 71, 525–616. [Google Scholar] [CrossRef]
- Pollastri, M.P. Overview on the Rule of Five. Curr. Protocol. Pharmacol. 2010, 49, 9–12. [Google Scholar] [CrossRef] [PubMed]
- Chen, M.; Xiao, C.; Jiang, W.; Yang, W.; Qin, Q.; Tan, Q.; Lian, B.; Liang, Z.; Wei, C. Capsaicin inhibits proliferation and induces apoptosis in breast cancer by down-regulating FBI-1-mediated NF-κB pathway. Drug Des. Dev. Ther. 2021, 15, 125. [Google Scholar] [CrossRef]
- Chou, C.-C.; Wu, Y.-C.; Wang, Y.F.; Chou, M.J.; Kuo, S.J.; Chen, D.R. Capsaicin-induced apoptosis in human breast cancer MCF-7 cells through caspase-independent pathway. Oncol. Rep. 2009, 21, 665–671. [Google Scholar]
- Ying, Y.; Yulin, S.; Shuyan, L.; Nengzhi, J.; Huanxiang, L.; Xiaojun, Y. Molecular dynamics and free energy studies on Aurora kinase A and its mutant bound with MLN8054: Insight into molecular mechanism of subtype selectivity. Mol. BioSyst. 2012, 8, 3049–3060. [Google Scholar] [CrossRef]
- Ansari, W.A.; Rab, S.O.; Saquib, M.; Sarfraz, A.; Hussain, M.K.; Akhtar, M.S.; Ahmad, I.; Khan, M.F. Pentafuhalol-B, a Phlorotannin from Brown Algae, Strongly Inhibits the PLK-1 Overexpression in Cancer Cells as Revealed by Computational Analysis. Molecules 2023, 28, 5853. [Google Scholar] [CrossRef]
- Khan, M.F.; Ansari, W.A.; Ahamad, T.; Khan, M.A.; Khan, Z.A.; Sarfraz, A.; Khan, M.A. Bioactive components of different nasal spray solutions may defeat SARS-Cov2: Repurposing and in silico studies. J. Mol. Model. 2022, 28, 212. [Google Scholar] [CrossRef]
- Morris, G.M.; Huey, R.; Lindstrom, W.; Sanner, M.F.; Belew, R.K. AutoDock4 and AutoDockTools4: Automated docking with selective receptor flexibility. J. Comp. Chem. 2009, 30, 2785–2791. [Google Scholar] [CrossRef]
- Ansari, W.A.; Khan, M.A.; Rizvi, F.; Ali, K.; Hussain, M.K.; Saquib, M.; Khan, M.F. Computational screening of plant-derived natural products against SARS-CoV-2 variants. Future Pharmacol. 2022, 2, 558–578. [Google Scholar] [CrossRef]
- Berman, H.M.; Westbrook, J.; Feng, Z.; Gilliland, G.; Bhat, T.N.; Weissig, H.; Shindyalov, I.N.; Bourne, P.E. The Protein Data Bank. Nucleic Acids Res. 2000, 28, 235–242. [Google Scholar] [CrossRef] [PubMed]
- Jorgensen, W.L.; Chandrasekhar, J.; Madura, J.D.; Impey, R.W.; Klein, M.L. Comparison of simple potential functions for simulating liquid water. J. Chem. Phys. 1983, 79, 26. [Google Scholar] [CrossRef]


| Ligand | Surlfex Total Score | Glide XP Docking Score | MM/GBSA ΔGbind | ΔGCoulomb | ΔGvdW | ΔGGB | ΔGlipo |
|---|---|---|---|---|---|---|---|
| 1 | 6.752 | −4.734 | −72.94 | −15.04 | −42.91 | 25.72 | −45.08 |
| 2 | 6.592 | −6.816 | −62.84 | −8.45 | −36.93 | 14.42 | −44.98 |
| 3 | 6.025 | −8.075 | −67.72 | −13.26 | −33.08 | 16.37 | −35.49 |
| 4 | 6.327 | −4.935 | −71.80 | −8.01 | −47.52 | 20.19 | −47.49 |
| 5 | 6.058 | −5.736 | −63.16 | −14.29 | −41.45 | 19.12 | −41.89 |
| 6 | 5.979 | −7.877 | −70.37 | −19.78 | −35.17 | 17.58 | −33.26 |
| 7 | 5.931 | −7.982 | −92.73 | −13.48 | −58.25 | 23.40 | −47.48 |
| 8 | 5.918 | −6.785 | −62.10 | −12.69 | −35.60 | 15.95 | −39.51 |
| 9 | 5.813 | −7.601 | −69.19 | −11.39 | −42.49 | 15.87 | −38.31 |
| 10 | 5.753 | −8.137 | −69.28 | −13.59 | −33.85 | 15.61 | −39.21 |
| 11 | 5.685 | −7.526 | −62.28 | −14.55 | −35.51 | 17.35 | −32.10 |
| 12 | 5.499 | −7.096 | −89.38 | −19.83 | −48.98 | 23.12 | −46.36 |
| 13 | 5.191 | −5.846 | −67.96 | −6.34 | −38.47 | 15.09 | −41.65 |
| 14 | 5.047 | −4.895 | −50.38 | 50.45 | −42.17 | −34.91 | −22.17 |
| 15 | 4.894 | −7.568 | −68.11 | 33.84 | −39.84 | −31.17 | −33.02 |
| 16 | 4.332 | −8.055 | −66.23 | −14.67 | −31.60 | 13.11 | −34.17 |
| Ligand | BE | IC | IE | TIE | TE | UE |
|---|---|---|---|---|---|---|
| 1 | −8.97 | 263.81 nM | −10.76 | −0.97 | 1.79 | −0.97 |
| 2 | −7.22 | 5.09 μM | −9.31 | −0.65 | 2.09 | −0.65 |
| 3 | −7.13 | 13.97 μM | −10.11 | −1.32 | 2.98 | −1.32 |
| 4 | −6.30 | 24.29 μM | −8.38 | −1.65 | 2.09 | −1.65 |
| 5 | −6.08 | 35.22 μM | −8.16 | −1.13 | 2.09 | −1.13 |
| 6 | −7.66 | 2.44 μM | −9.75 | −1.21 | 2.09 | −1.21 |
| 7 | −7.57 | 2.82 μM | −9.06 | −2.35 | 1.49 | −2.35 |
| 8 | −6.62 | 14.09 μM | −8.41 | −0.63 | 1.79 | −0.63 |
| 9 | −7.09 | 6.33 μM | −9.18 | −1.14 | 2.09 | −1.14 |
| 10 | −8.3 | 823.59 nM | −9.49 | −0.69 | 1.19 | −0.69 |
| 11 | −7.66 | 2.44 μM | −9.45 | −1.18 | 1.79 | −1.18 |
| 12 | −6.79 | 10.62 μM | −8.28 | −2.54 | 1.49 | −2.54 |
| 13 | −7.90 | 1.61 μM | −8.8 | −0.39 | 0.89 | −0.39 |
| 14 | −6.3 | 4.45 μM | −8.79 | −1.51 | 1.49 | −1.51 |
| 15 | −5.91 | 18.64 μM | −8.0 | −1.57 | 2.09 | −1.57 |
| 16 | −5.84 | 19.62 μM | −7.04 | −1.02 | 1.19 | −1.02 |
| Inhibitor | Total Score | IC50 [nM] [27] |
|---|---|---|
| AZD1152 | 8.043 | 0.37 |
| Hesperadin | 5.817 | 250 |
| PHA-73935 | 6.925 | 13 |
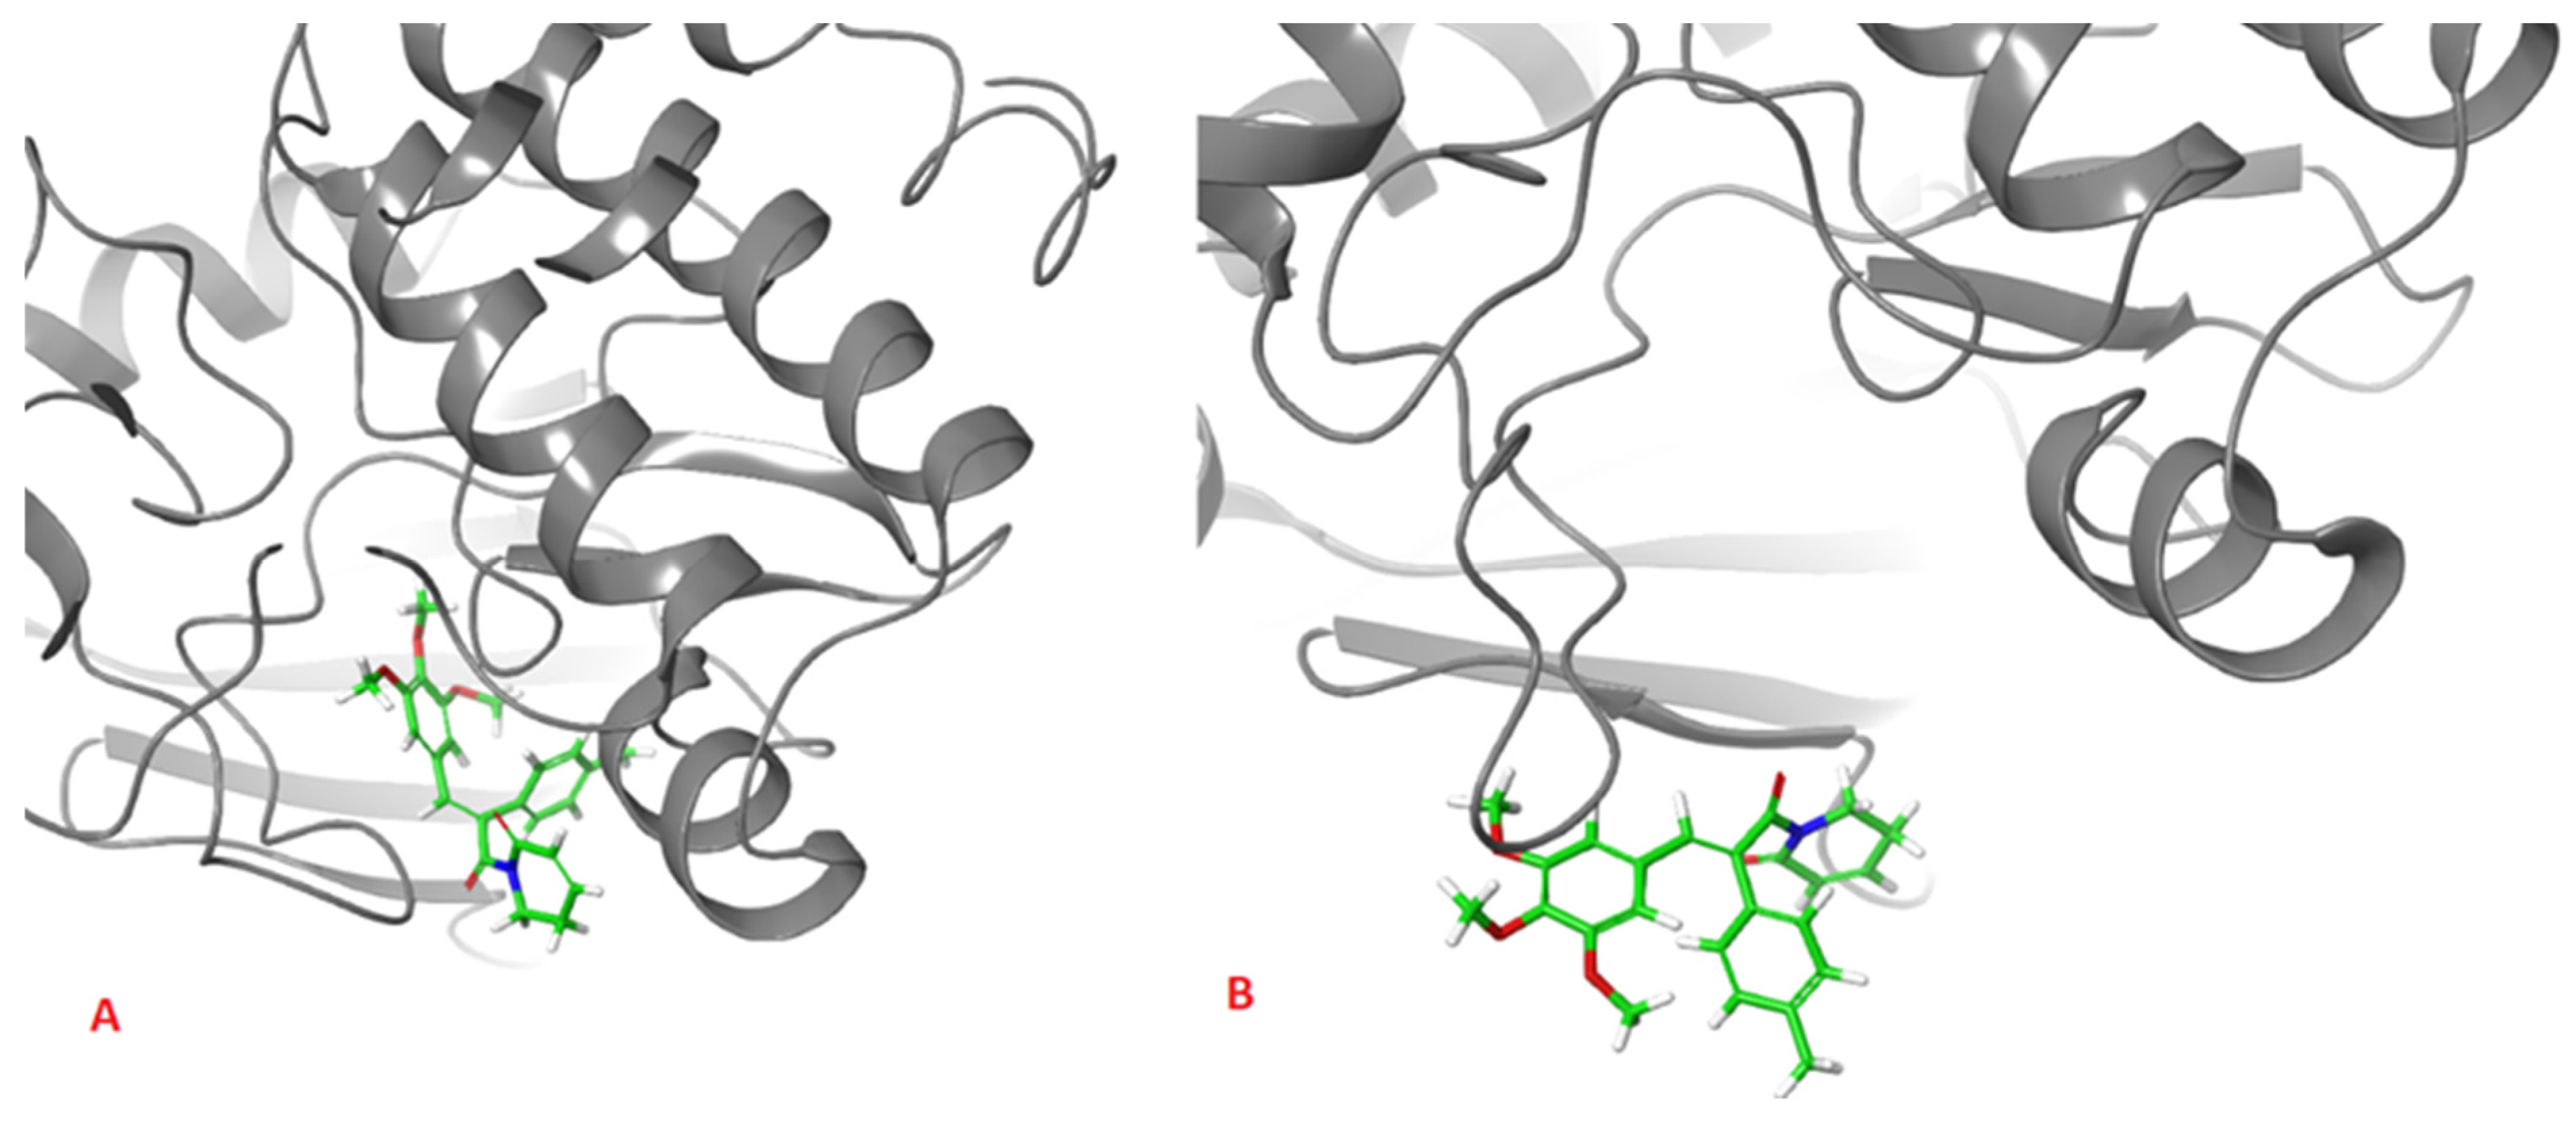
| Ligand | H-Bonding Residues | H-Bonding Water Mediated Residues | Hydrophobic Interacting Residues |
|---|---|---|---|
| (2) | Ala213, Lys162 | Val147 | |
| (3) | Ala213, Lys162, | Glu260 | Leu253 |
| AZD1152 | Ala213, Glu211, Lys224, Arg220 | Lys162, Asp274, Thr217 | Ala273, Ala160 |
Disclaimer/Publisher’s Note: The statements, opinions and data contained in all publications are solely those of the individual author(s) and contributor(s) and not of MDPI and/or the editor(s). MDPI and/or the editor(s) disclaim responsibility for any injury to people or property resulting from any ideas, methods, instructions or products referred to in the content. |
© 2023 by the authors. Licensee MDPI, Basel, Switzerland. This article is an open access article distributed under the terms and conditions of the Creative Commons Attribution (CC BY) license (https://creativecommons.org/licenses/by/4.0/).
Share and Cite
Siudem, P.; Szeleszczuk, Ł.; Paradowska, K. Searching for Natural Aurora a Kinase Inhibitors from Peppers Using Molecular Docking and Molecular Dynamics. Pharmaceuticals 2023, 16, 1539. https://doi.org/10.3390/ph16111539
Siudem P, Szeleszczuk Ł, Paradowska K. Searching for Natural Aurora a Kinase Inhibitors from Peppers Using Molecular Docking and Molecular Dynamics. Pharmaceuticals. 2023; 16(11):1539. https://doi.org/10.3390/ph16111539
Chicago/Turabian StyleSiudem, Paweł, Łukasz Szeleszczuk, and Katarzyna Paradowska. 2023. "Searching for Natural Aurora a Kinase Inhibitors from Peppers Using Molecular Docking and Molecular Dynamics" Pharmaceuticals 16, no. 11: 1539. https://doi.org/10.3390/ph16111539