
Development and Validation of a Non-Targeted Screening Method for Most Psychoactive, Analgesic, Anaesthetic, Anti-Diabetic, Anti-Coagulant and Anti-Hypertensive Drugs in Human Whole Blood and Plasma Using High-Resolution Mass Spectrometry
 , , ,
, , ,
Abstract
:
1. Introduction
2. Results and Discussion
2.1. Optimisation
2.1.1. Chromatographic Conditions and Mass Spectrometer Parameters
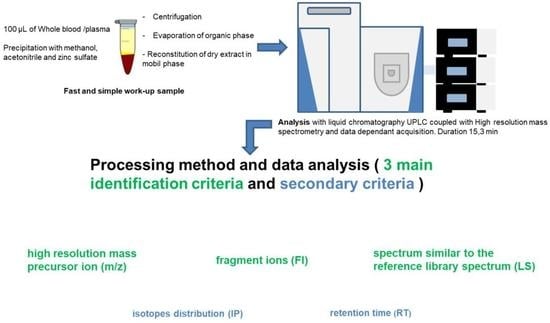
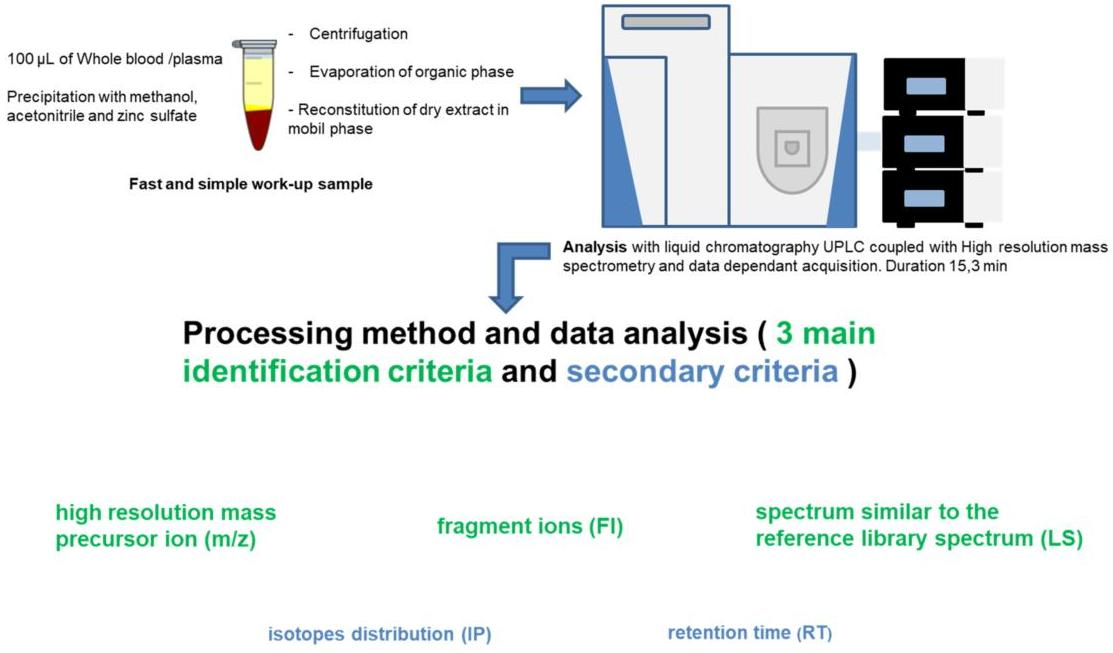
2.1.2. Sample Pretreatment
2.1.3. Library
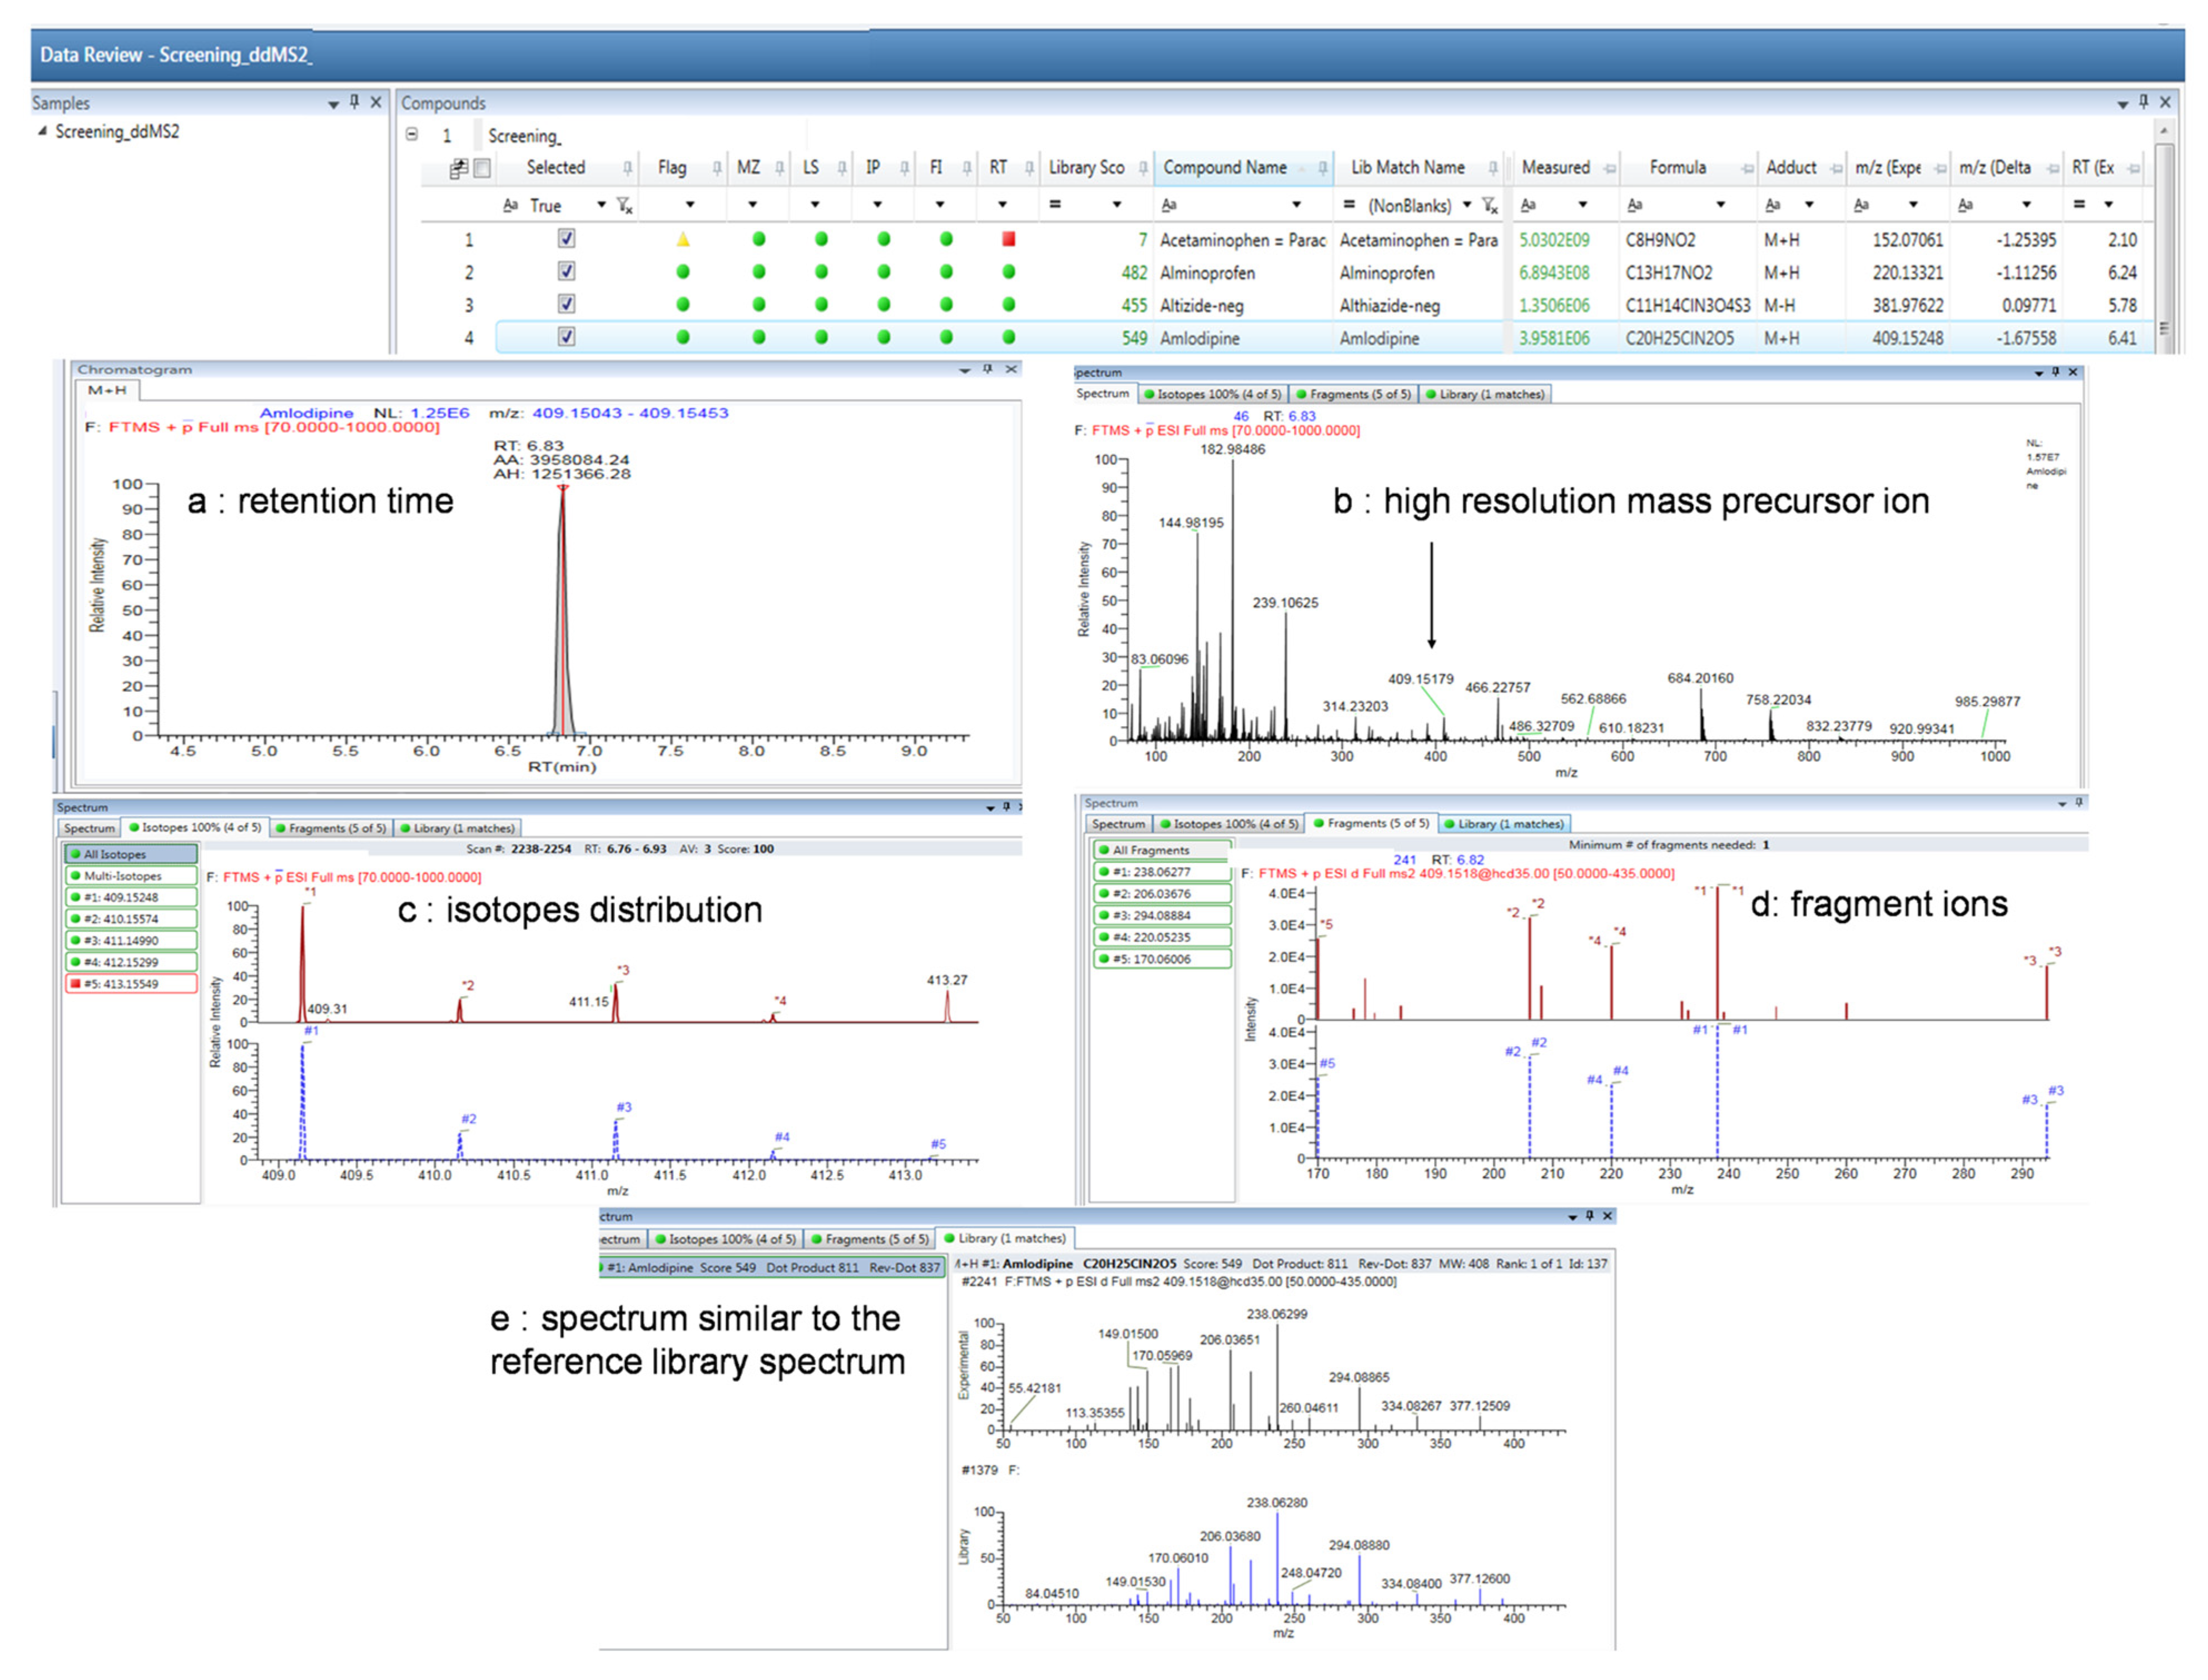
2.1.4. Screening Data Processing
2.2. Method Validation
2.2.1. Interference Studies
- 1.
- Selectivity
- 2.
- Specificity
- 3.
- Evaluating Interferences from Stable-Isotope Internal Standards and carry-over
- 4.
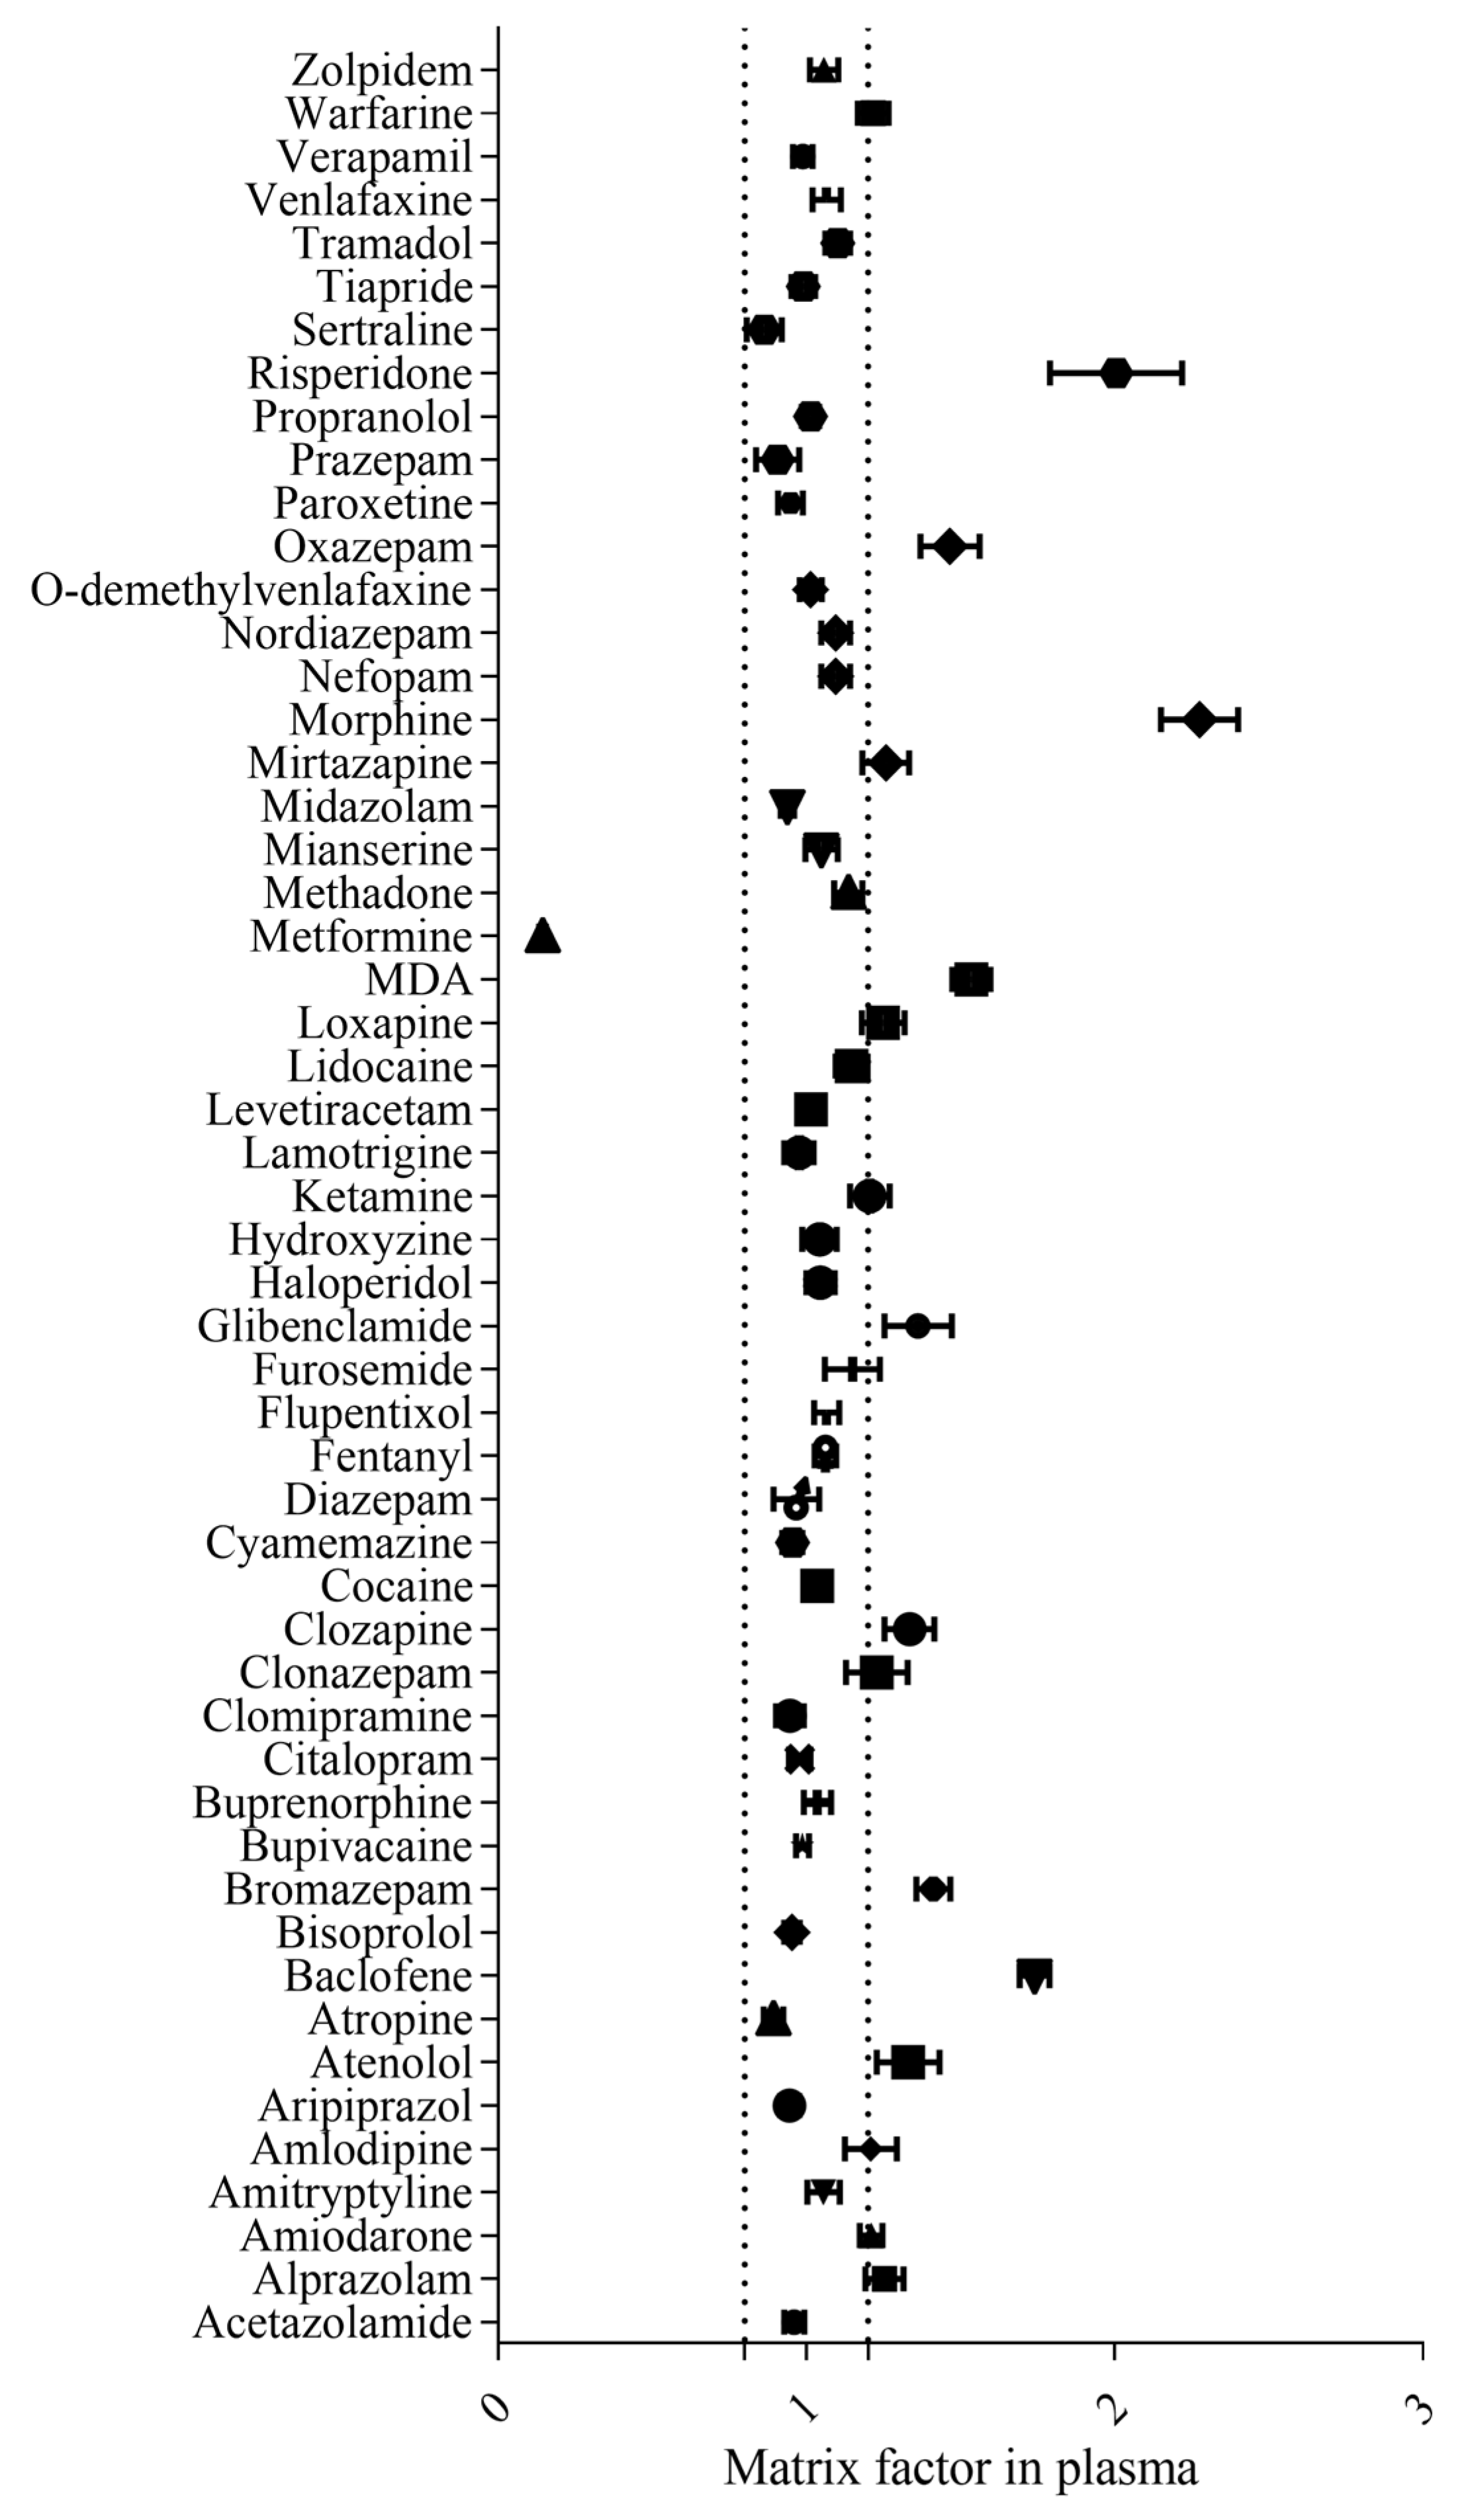
- Matrix effect
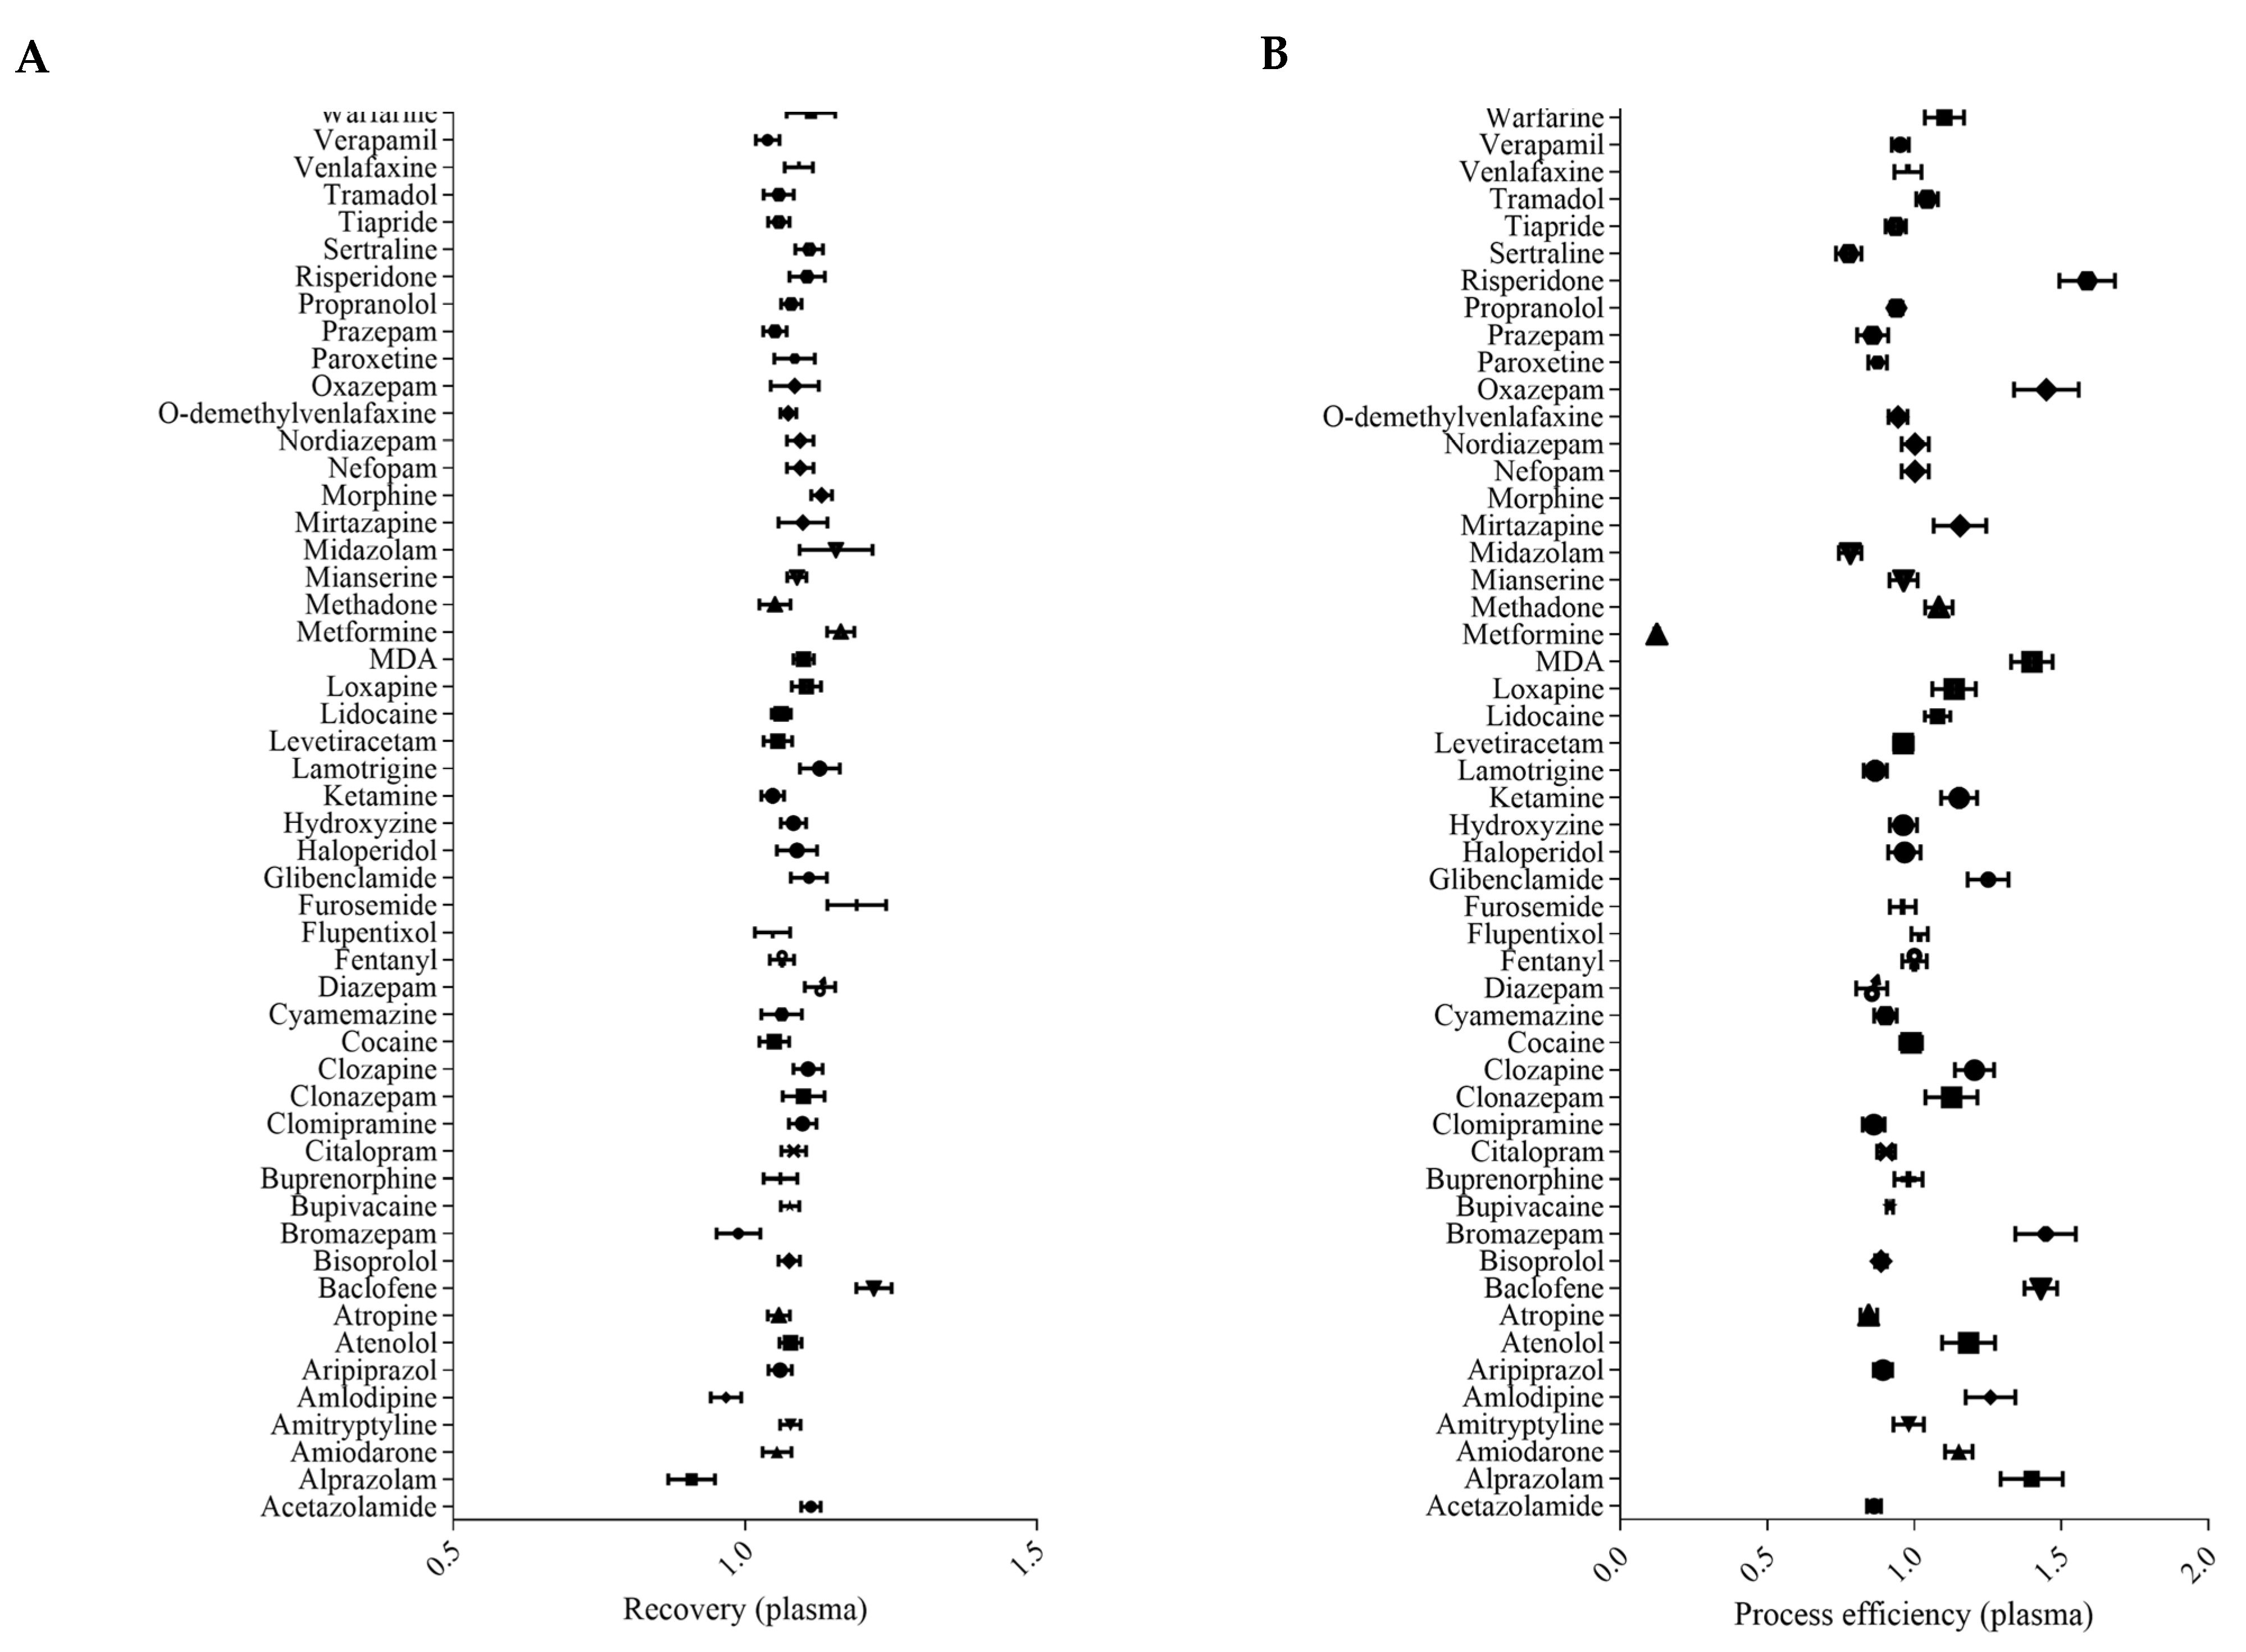
2.2.2. Recovery and Process Efficiency
2.2.3. Limit of Identification
2.2.4. Spectra Reproducibility
2.3. Applicability
3. Materials and Methods
3.1. Chemicals
3.2. Preparation of Stock Solutions and Working Solutions
3.3. Preparation of Quality Control Samples
3.4. Chromatographic and Mass Spectrometric Conditions
3.4.1. Liquid Chromatography
3.4.2. High-Resolution Mass Spectrometry
3.4.3. Screening Data Processing
- -
- for retention time, the option “ignore if not defined” was selected, and window override was 60 s;
- -
- for isotopic pattern, the fit threshold was 70 a.u., with a mass tolerance of 5 ppm and an intensity deviation tolerance of 30%;
- -
- for fragment ions, the option “ignore if not defined” was selected, the minimum number of fragments was one, the intensity threshold was 5000 a.u., the product mass tolerance was 10 mmu, and the MS order was MS²;
- -
- for general library NIST settings, MS order was MS² and isolation width was used; for the NIST setting, search type selected was MS/MS, and options “ignore precursor”, “use all peak matching”, “reverse search”, and presearch “off” were selected; a probability threshold of 10 a.u, score threshold of 80 a.u., search index (SI) threshold of 500 a.u., and reverse search index (RSI) threshold of 600 a.u. were selected; precursor and product masses tolerances were 5 ppm and 10 ppm, respectively; library score was selected as a passing value type with a passing value of 20 a.u.
3.4.4. Library
3.5. Sample Preparation
3.6. Validation Method
3.6.1. Interference Studies
- 1.
- Selectivity
- 2.
- Specificity
- 3.
- Evaluating Interferences from Stable-Isotope Internal Standards and carryover
- 4.
- Matrix effect
3.6.2. Recovery and Process Efficiency
3.6.3. Limit of Identification
3.6.4. Spectra Reproducibility
3.6.5. Statistics
4. Conclusions
Supplementary Materials
Author Contributions
Funding
Institutional Review Board Statement
Informed Consent Statement
Data Availability Statement
Acknowledgments
Conflicts of Interest
References
- Maurer, H.H. Position of Chromatographic Techniques in Screening for Detection of Drugs or Poisons in Clinical and Forensic Toxicology and/or Doping Control. Clin. Chem. Lab. Med. 2004, 42, 1310–1324. [Google Scholar] [CrossRef]
- Yuan, C.; Chen, D.; Wang, S. Drug Confirmation by Mass Spectrometry: Identification Criteria and Complicating Factors. Clin. Chim. Acta Int. J. Clin. Chem. 2015, 438, 119–125. [Google Scholar] [CrossRef]
- Maurer, H. Multi-Analyte Procedures for Screening for and Quantification of Drugs in Blood, Plasma, or Serum by Liquid Chromatography-Single Stage or Tandem Mass Spectrometry (LC-MS or LC-MS/MS) Relevant to Clinical and Forensic Toxicology. Clin. Biochem. 2005, 38, 310–318. [Google Scholar] [CrossRef]
- Cazaubon, Y.; Mauprivez, C.; Feliu, C.; Binet, L.; Oget, O.; Gozalo, C.; Djerada, Z. Population Pharmacokinetics of Articaine with 1:200,000 Epinephrine during Third Molar Surgery and Simulation of High-Dose Regimens. Eur. J. Pharm. Sci. Off. J. Eur. Fed. Pharm. Sci. 2018, 114, 38–45. [Google Scholar] [CrossRef]
- Djerada, Z.; Feliu, C.; Cazaubon, Y.; Smati, F.; Gomis, P.; Guerrot, D.; Charbit, B.; Fernandes, O.; Malinovsky, J.-M. Population Pharmacokinetic-Pharmacodynamic Modeling of Ropivacaine in Spinal Anesthesia. Clin. Pharmacokinet. 2017, 57, 1135–1147. [Google Scholar] [CrossRef]
- Djerada, Z.; Feliu, C.; Tournois, C.; Vautier, D.; Binet, L.; Robinet, A.; Marty, H.; Gozalo, C.; Lamiable, D.; Millart, H. Validation of a Fast Method for Quantitative Analysis of Elvitegravir, Raltegravir, Maraviroc, Etravirine, Tenofovir, Boceprevir and 10 Other Antiretroviral Agents in Human Plasma Samples with a New UPLC-MS/MS Technology. J. Pharm. Biomed. Anal. 2013, 86, 100–111. [Google Scholar] [CrossRef]
- Feliu, C.; Millart, H.; Guillemin, H.; Vautier, D.; Binet, L.; Fouley, A.; Djerada, Z. Validation of a Fast UPLC-MS/MS Method for Quantitative Analysis of Opioids, Cocaine, Amphetamines (and Their Derivatives) in Human Whole Blood. Bioanalysis 2015, 7, 2685–2700. [Google Scholar] [CrossRef]
- Feliu, C.; Peyret, H.; Poitevin, G.; Cazaubon, Y.; Oszust, F.; Nguyen, P.; Millart, H.; Djerada, Z. Complementary Role of P2 and Adenosine Receptors in ATP Induced-Anti-Apoptotic Effects Against Hypoxic Injury of HUVECs. Int. J. Mol. Sci. 2019, 20, 1446. [Google Scholar] [CrossRef] [Green Version]
- Feliu, C.; Peyret, H.; Brassart-Pasco, S.; Oszust, F.; Poitevin, G.; Nguyen, P.; Millart, H.; Djerada, Z. Ticagrelor Prevents Endothelial Cell Apoptosis through the Adenosine Signalling Pathway in the Early Stages of Hypoxia. Biomolecules 2020, 10, 740. [Google Scholar] [CrossRef]
- Marquet, P.; Saint-Marcoux, F.; Gamble, T.N.; Leblanc, J.C.Y. Comparison of a Preliminary Procedure for the General Unknown Screening of Drugs and Toxic Compounds Using a Quadrupole-Linear Ion-Trap Mass Spectrometer with a Liquid Chromatography-Mass Spectrometry Reference Technique. J. Chromatogr. B Analyt. Technol. Biomed. Life. Sci. 2003, 789, 9–18. [Google Scholar] [CrossRef]
- Mueller, C.A.; Weinmann, W.; Dresen, S.; Schreiber, A.; Gergov, M. Development of a Multi-Target Screening Analysis for 301 Drugs Using a QTrap Liquid Chromatography/Tandem Mass Spectrometry System and Automated Library Searching. Rapid Commun. Mass Spectrom. RCM 2005, 19, 1332–1338. [Google Scholar] [CrossRef]
- Sauvage, F.-L.; Saint-Marcoux, F.; Duretz, B.; Deporte, D.; Lachatre, G.; Marquet, P. Screening of Drugs and Toxic Compounds with Liquid Chromatography-Linear Ion Trap Tandem Mass Spectrometry. Clin. Chem. 2006, 52, 1735–1742. [Google Scholar] [CrossRef]
- Remane, D.; Meyer, M.R.; Peters, F.T.; Wissenbach, D.K.; Maurer, H.H. Fast and Simple Procedure for Liquid-Liquid Extraction of 136 Analytes from Different Drug Classes for Development of a Liquid Chromatographic-Tandem Mass Spectrometric Quantification Method in Human Blood Plasma. Anal. Bioanal. Chem. 2010, 397, 2303–2314. [Google Scholar] [CrossRef]
- Dresen, S.; Ferreirós, N.; Gnann, H.; Zimmermann, R.; Weinmann, W. Detection and Identification of 700 Drugs by Multi-Target Screening with a 3200 Q TRAP LC-MS/MS System and Library Searching. Anal. Bioanal. Chem. 2010, 396, 2425–2434. [Google Scholar] [CrossRef]
- Humbert, L.; Grisel, F.; Richeval, C.; Lhermitte, M. Screening of Xenobiotics by Ultra-Performance Liquid Chromatography-Mass Spectrometry Using in-Source Fragmentation at Increasing Cone Voltages: Library Constitution and an Evaluation of Spectral Stability. J. Anal. Toxicol. 2010, 34, 571–580. [Google Scholar] [CrossRef] [Green Version]
- Oiestad, E.L.; Johansen, U.; Oiestad, A.M.L.; Christophersen, A.S. Drug Screening of Whole Blood by Ultra-Performance Liquid Chromatography-Tandem Mass Spectrometry. J. Anal. Toxicol. 2011, 35, 280–293. [Google Scholar] [CrossRef] [Green Version]
- Broecker, S.; Herre, S.; Wüst, B.; Zweigenbaum, J.; Pragst, F. Development and Practical Application of a Library of CID Accurate Mass Spectra of More than 2500 Toxic Compounds for Systematic Toxicological Analysis by LC-QTOF-MS with Data-Dependent Acquisition. Anal. Bioanal. Chem. 2011, 400, 101–117. [Google Scholar] [CrossRef]
- de Castro, A.; Gergov, M.; Ostman, P.; Ojanperä, I.; Pelander, A. Combined Drug Screening and Confirmation by Liquid Chromatography Time-of-Flight Mass Spectrometry with Reverse Database Search. Anal. Bioanal. Chem. 2012, 403, 1265–1278. [Google Scholar] [CrossRef]
- Roemmelt, A.T.; Steuer, A.E.; Poetzsch, M.; Kraemer, T. Liquid Chromatography, in Combination with a Quadrupole Time-of-Flight Instrument (LC QTOF), with Sequential Window Acquisition of All Theoretical Fragment-Ion Spectra (SWATH) Acquisition: Systematic Studies on Its Use for Screenings in Clinical and Forensic Toxicology and Comparison with Information-Dependent Acquisition (IDA). Anal. Chem. 2014, 86, 11742–11749. [Google Scholar] [CrossRef]
- Marin, S.J.; Hughes, J.M.; Lawlor, B.G.; Clark, C.J.; McMillin, G.A. Rapid Screening for 67 Drugs and Metabolites in Serum or Plasma by Accurate-Mass LC-TOF-MS. J. Anal. Toxicol. 2012, 36, 477–486. [Google Scholar] [CrossRef]
- Guale, F.; Shahreza, S.; Walterscheid, J.P.; Chen, H.-H.; Arndt, C.; Kelly, A.T.; Mozayani, A. Validation of LC-TOF-MS Screening for Drugs, Metabolites, and Collateral Compounds in Forensic Toxicology Specimens. J. Anal. Toxicol. 2013, 37, 17–24. [Google Scholar] [CrossRef] [Green Version]
- Pedersen, A.J.; Dalsgaard, P.W.; Rode, A.J.; Rasmussen, B.S.; Müller, I.B.; Johansen, S.S.; Linnet, K. Screening for Illicit and Medicinal Drugs in Whole Blood Using Fully Automated SPE and Ultra-High-Performance Liquid Chromatography with TOF-MS with Data-Independent Acquisition. J. Sep. Sci. 2013, 36, 2081–2089. [Google Scholar] [CrossRef]
- Maurer, H.H. Perspectives of Liquid Chromatography Coupled to Low- and High-Resolution Mass Spectrometry for Screening, Identification, and Quantification of Drugs in Clinical and Forensic Toxicology. Ther. Drug Monit. 2010, 32, 324–327. [Google Scholar] [CrossRef]
- Jiwan, J.-L.H.; Wallemacq, P.; Hérent, M.-F. HPLC-High Resolution Mass Spectrometry in Clinical Laboratory? Clin. Biochem. 2011, 44, 136–147. [Google Scholar] [CrossRef]
- Ojanperä, I.; Kolmonen, M.; Pelander, A. Current Use of High-Resolution Mass Spectrometry in Drug Screening Relevant to Clinical and Forensic Toxicology and Doping Control. Anal. Bioanal. Chem. 2012, 403, 1203–1220. [Google Scholar] [CrossRef]
- Wu, A.H.; Gerona, R.; Armenian, P.; French, D.; Petrie, M.; Lynch, K.L. Role of Liquid Chromatography-High-Resolution Mass Spectrometry (LC-HR/MS) in Clinical Toxicology. Clin. Toxicol. Phila. Pa 2012, 50, 733–742. [Google Scholar] [CrossRef]
- Maurer, H.H. What Is the Future of (Ultra) High Performance Liquid Chromatography Coupled to Low and High Resolution Mass Spectrometry for Toxicological Drug Screening? J. Chromatogr. A 2013, 1292, 19–24. [Google Scholar] [CrossRef]
- Meyer, M.R.; Helfer, A.G.; Maurer, H.H. Current Position of High-Resolution MS for Drug Quantification in Clinical & Forensic Toxicology. Bioanalysis 2014, 6, 2275–2284. [Google Scholar] [CrossRef]
- Maurer, H.H.; Meyer, M.R. High-Resolution Mass Spectrometry in Toxicology: Current Status and Future Perspectives. Arch. Toxicol. 2016, 90, 2161–2172. [Google Scholar] [CrossRef]
- Helfer, A.G.; Michely, J.A.; Weber, A.A.; Meyer, M.R.; Maurer, H.H. Orbitrap Technology for Comprehensive Metabolite-Based Liquid Chromatographic-High Resolution-Tandem Mass Spectrometric Urine Drug Screening—Exemplified for Cardiovascular Drugs. Anal. Chim. Acta 2015, 891, 221–233. [Google Scholar] [CrossRef]
- Helfer, A.G.; Michely, J.A.; Weber, A.A.; Meyer, M.R.; Maurer, H.H. Liquid Chromatography-High Resolution-Tandem Mass Spectrometry Using Orbitrap Technology for Comprehensive Screening to Detect Drugs and Their Metabolites in Blood Plasma. Anal. Chim. Acta 2017, 965, 83–95. [Google Scholar] [CrossRef]
- Roche, L.; Pinguet, J.; Herviou, P.; Libert, F.; Chenaf, C.; Eschalier, A.; Authier, N.; Richard, D. Fully Automated Semi-Quantitative Toxicological Screening in Three Biological Matrices Using Turbulent Flow Chromatography/High Resolution Mass Spectrometry. Clin. Chim. Acta Int. J. Clin. Chem. 2016, 455, 46–54. [Google Scholar] [CrossRef]
- Joye, T.; Sidibé, J.; Déglon, J.; Karmime, A.; Sporkert, F.; Widmer, C.; Favrat, B.; Lescuyer, P.; Augsburger, M.; Thomas, A. Liquid Chromatography-High Resolution Mass Spectrometry for Broad-Spectrum Drug Screening of Dried Blood Spot as Microsampling Procedure. Anal. Chim. Acta 2019, 1063, 110–116. [Google Scholar] [CrossRef] [Green Version]
- European Medicines Agency (EMA). Guideline on Bioanalytical Method Validation. 21 July 2011. Available online: http://www.ema.europa.eu/docs/en_gb/document_library/scientific_guideline/2011/08/WC500109686.pdf. (accessed on 15 September 2022).
- U.S. Department of Health and Human Services Food and Drug Administration. Bioanalytical Method Validation. 2013. Available online: http://academy.gmp-compliance.org/guidemgr/files/UCM368107.PDF (accessed on 15 September 2022).
- Matuszewski, B.K.; Constanzer, M.L.; Chavez-Eng, C.M. Strategies for the Assessment of Matrix Effect in Quantitative Bioanalytical Methods Based on HPLC-MS/MS. Anal. Chem. 2003, 75, 3019–3030. [Google Scholar] [CrossRef]
- Peters, F.T.; Drummer, O.H.; Musshoff, F. Validation of New Methods. Forensic Sci. Int. 2007, 165, 216–224. [Google Scholar] [CrossRef]
- Scientific Working Group for Forensic Toxicology Scientific Working Group for Forensic Toxicology (SWGTOX) Standard Practices for Method Validation in Forensic Toxicology. J. Anal. Toxicol. 2013, 37, 452–474. [CrossRef] [Green Version]
- Polson, C.; Sarkar, P.; Incledon, B.; Raguvaran, V.; Grant, R. Optimization of Protein Precipitation Based upon Effectiveness of Protein Removal and Ionization Effect in Liquid Chromatography–Tandem Mass Spectrometry. J. Chromatogr. B 2003, 785, 263–275. [Google Scholar] [CrossRef]
- Furey, A.; Moriarty, M.; Bane, V.; Kinsella, B.; Lehane, M. Ion Suppression; a Critical Review on Causes, Evaluation, Prevention and Applications. Talanta 2013, 115, 104–122. [Google Scholar] [CrossRef]
- Hiemke, C.; Bergemann, N.; Clement, H.W.; Conca, A.; Deckert, J.; Domschke, K.; Eckermann, G.; Egberts, K.; Gerlach, M.; Greiner, C.; et al. Consensus Guidelines for Therapeutic Drug Monitoring in Neuropsychopharmacology: Update 2017. Pharmacopsychiatry 2018, 51, 9–62. [Google Scholar] [CrossRef] [Green Version]
- Schulz, M.; Schmoldt, A.; Andresen-Streichert, H.; Iwersen-Bergmann, S. Revisited: Therapeutic and Toxic Blood Concentrations of More than 1100 Drugs and Other Xenobiotics. Crit. Care Lond. Engl. 2020, 24, 195. [Google Scholar] [CrossRef]
- Frid, A.; Sterner, G.N.; Löndahl, M.; Wiklander, C.; Cato, A.; Vinge, E.; Andersson, A. Novel Assay of Metformin Levels in Patients with Type 2 Diabetes and Varying Levels of Renal Function: Clinical Recommendations. Diabetes Care 2010, 33, 1291–1293. [Google Scholar] [CrossRef] [PubMed]


| Compound Empirical Formula | RT (min) | m/z: Precursor Relative Abundances | m/z: Fragment Ion 1 Relative Abundances | m/z: Fragment Ion 2 Relative Abundances | m/z: Fragment Ion 3 Relative Abundances | m/z: Fragment Ion 4 Relative Abundances | m/z: Fragment Ion 5 Relative Abundances |
|---|---|---|---|---|---|---|---|
| O-Demethylvenlafaxine | 4.13 | 264.19581 | 58.06605 | 246.1852 | 107.04956 | 133.06494 | 201.1275 |
| C16H25NO2 | 23.2 | 100 | 13.6 | 11.9 | 5.6 | 3.0 | |
| Tramadol | 4.42 | 264.19581 | 58.06595 | 182.9018 | 246.1843 | 265.1989 | 56.0503 |
| C16H25NO2 | 10.5 | 100 | 0.9 | 0.4 | 0.4 | 0.2 | |
| MDEA | 3.79 | 208.13321 | 163.07542 | 135.04408 | 133.06488 | 105.07027 | 72.08154 |
| C12H17NO2 | 15.2 | 100 | 33.4 | 31.4 | 31.3 | 9.5 | |
| MBDB | 4.01 | 208.13321 | 135.04413 | 177.09102 | 147.08046 | 72.08154 | 136.0475 |
| C12H17NO2 | 8.2 | 100 | 12.8 | 8.1 | 7.8 | 5.3 | |
| Acepromazine | 6.02 | 327.15256 | 86.09708 | 58.06606 | 254.06337 | 239.0765 | 222.0916 |
| C19H22N2OS | 50.2 | 100 | 73.3 | 8.5 | 4.0 | 3.6 | |
| Aceprométazine | 5.94 | 327.15256 | 86.09696 | 240.04727 | 71.07362 | 239.07614 | 89.0602 |
| C19H22N2OS | 14.8 | 100 | 20.3 | 6.8 | 5.8 | 2.5 | |
| Morphine | 1.27 | 286.14377 | 201.09116 | 229.08565 | 183.08067 | 185.05997 | 211.07568 |
| C17H19NO3 | 100 | 6.9 | 4.5 | 3.4 | 3.1 | 3.0 | |
| Norcodeine | 2.95 | 286.14377 | 268.13263 | 215.10689 | 225.09088 | 121.06505 | 243.10130 |
| C17H19NO3 | 100 | 10.7 | 6.5 | 5.4 | 5.3 | 4.7 | |
| 6-MAM | 3.56 | 328.15433 | 211.07524 | 165.06987 | 193.06425 | 58.06528 | 183.08049 |
| C19H21NO4 | 100 | 13.1 | 7.5 | 7 | 6 | 4.5 | |
| Naloxone | 3.11 | 328.15433 | 310.1438 | 253.10934 | 268.13297 | 311.14734 | 269.1049 |
| C19H21NO4 | 75.4 | 100 | 22.3 | 19.5 | 11.6 | 10.3 | |
| N-Demethylclobazam | 6.42 | 287.05818 | 245.04753 | 210.07864 | 241.05254 | 269.0474 | 246.0511 |
| C15H11ClN202 | 29.2 | 100 | 13.7 | 12.4 | 4.8 | 2.7 | |
| Oxazepam | 6.40 | 287.05818 | 241.05254 | 269.04745 | 104.04984 | 231.06830 | 128.02629 |
| C15H11ClN202 | 40.4 | 100 | 40.9 | 17.6 | 15.3 | 8.7 |
Disclaimer/Publisher’s Note: The statements, opinions and data contained in all publications are solely those of the individual author(s) and contributor(s) and not of MDPI and/or the editor(s). MDPI and/or the editor(s) disclaim responsibility for any injury to people or property resulting from any ideas, methods, instructions or products referred to in the content. |
© 2023 by the authors. Licensee MDPI, Basel, Switzerland. This article is an open access article distributed under the terms and conditions of the Creative Commons Attribution (CC BY) license (https://creativecommons.org/licenses/by/4.0/).
Share and Cite
Feliu, C.; Konecki, C.; Cazaubon, Y.; Binet, L.; Vautier, D.; Fouley, A.; Gozalo, C.; Djerada, Z. Development and Validation of a Non-Targeted Screening Method for Most Psychoactive, Analgesic, Anaesthetic, Anti-Diabetic, Anti-Coagulant and Anti-Hypertensive Drugs in Human Whole Blood and Plasma Using High-Resolution Mass Spectrometry. Pharmaceuticals 2023, 16, 76. https://doi.org/10.3390/ph16010076
Feliu C, Konecki C, Cazaubon Y, Binet L, Vautier D, Fouley A, Gozalo C, Djerada Z. Development and Validation of a Non-Targeted Screening Method for Most Psychoactive, Analgesic, Anaesthetic, Anti-Diabetic, Anti-Coagulant and Anti-Hypertensive Drugs in Human Whole Blood and Plasma Using High-Resolution Mass Spectrometry. Pharmaceuticals. 2023; 16(1):76. https://doi.org/10.3390/ph16010076
Chicago/Turabian StyleFeliu, Catherine, Celine Konecki, Yoann Cazaubon, Laurent Binet, Damien Vautier, Aurélie Fouley, Claire Gozalo, and Zoubir Djerada. 2023. "Development and Validation of a Non-Targeted Screening Method for Most Psychoactive, Analgesic, Anaesthetic, Anti-Diabetic, Anti-Coagulant and Anti-Hypertensive Drugs in Human Whole Blood and Plasma Using High-Resolution Mass Spectrometry" Pharmaceuticals 16, no. 1: 76. https://doi.org/10.3390/ph16010076