

Granite Extraction Based on the SDGSAT-1 Satellite Thermal Infrared Spectrometer Imagery


Abstract
:1. Introduction
2. Methods
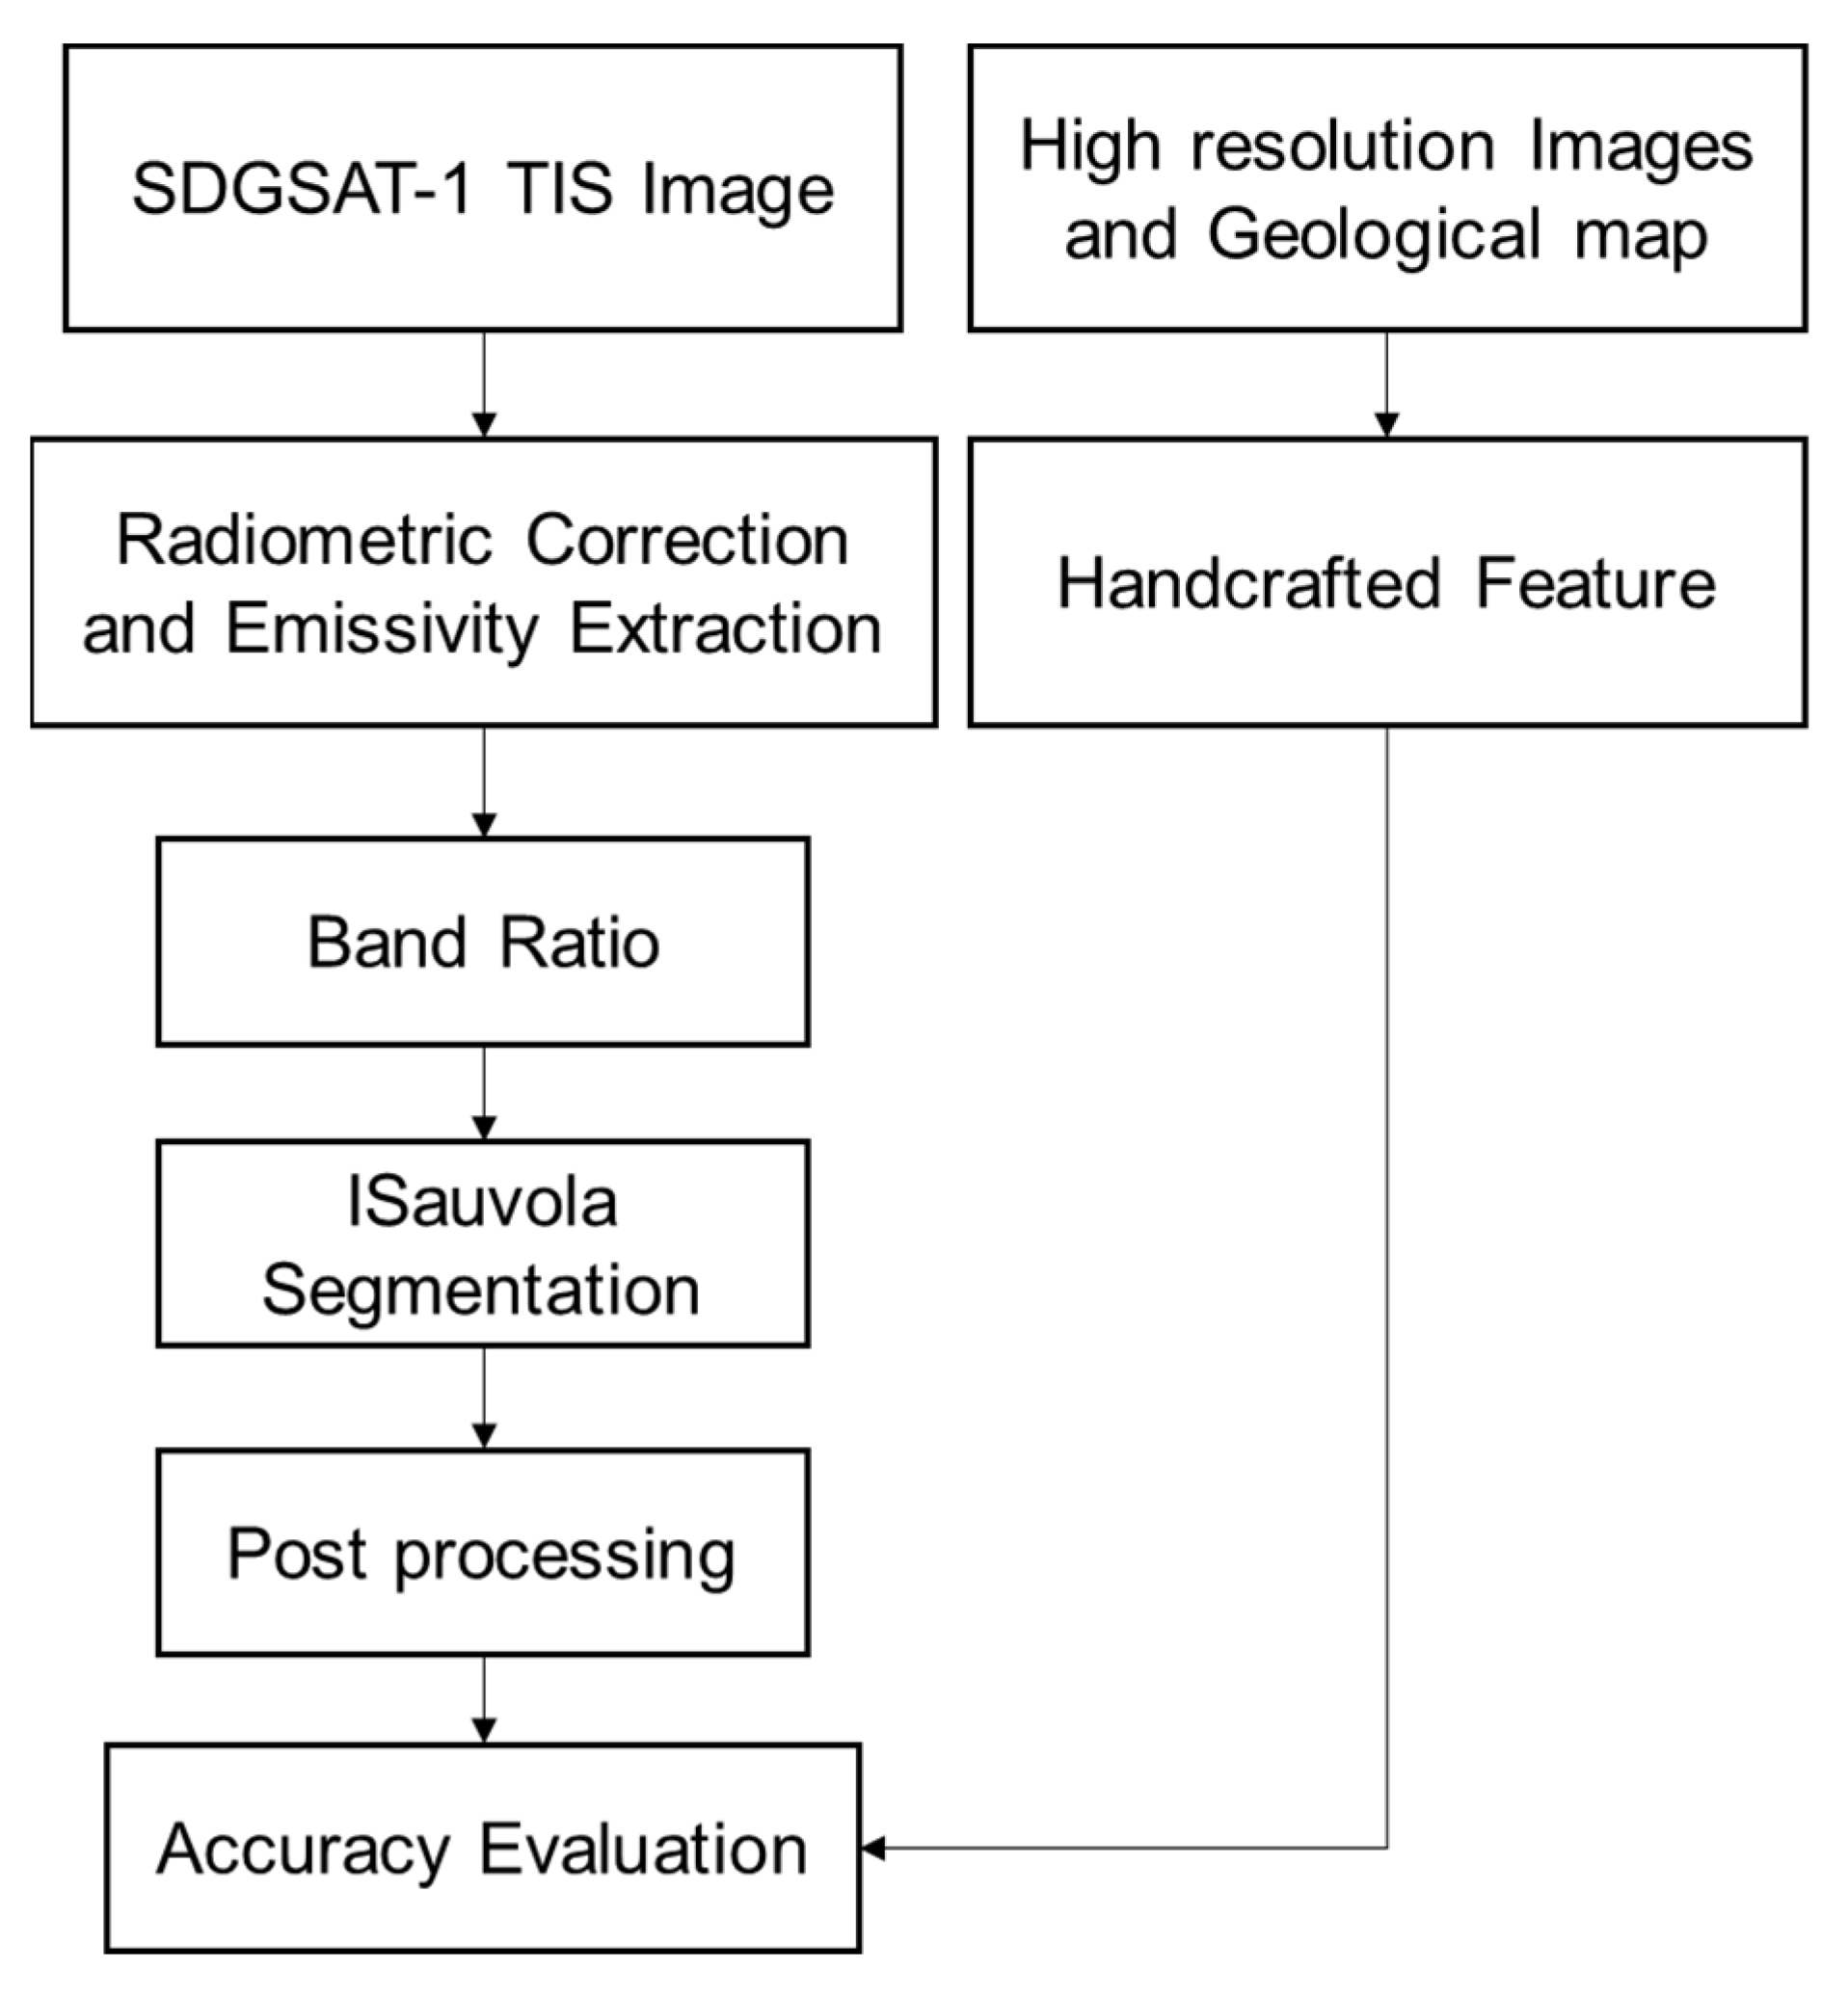
2.1. Flowchart of the Method
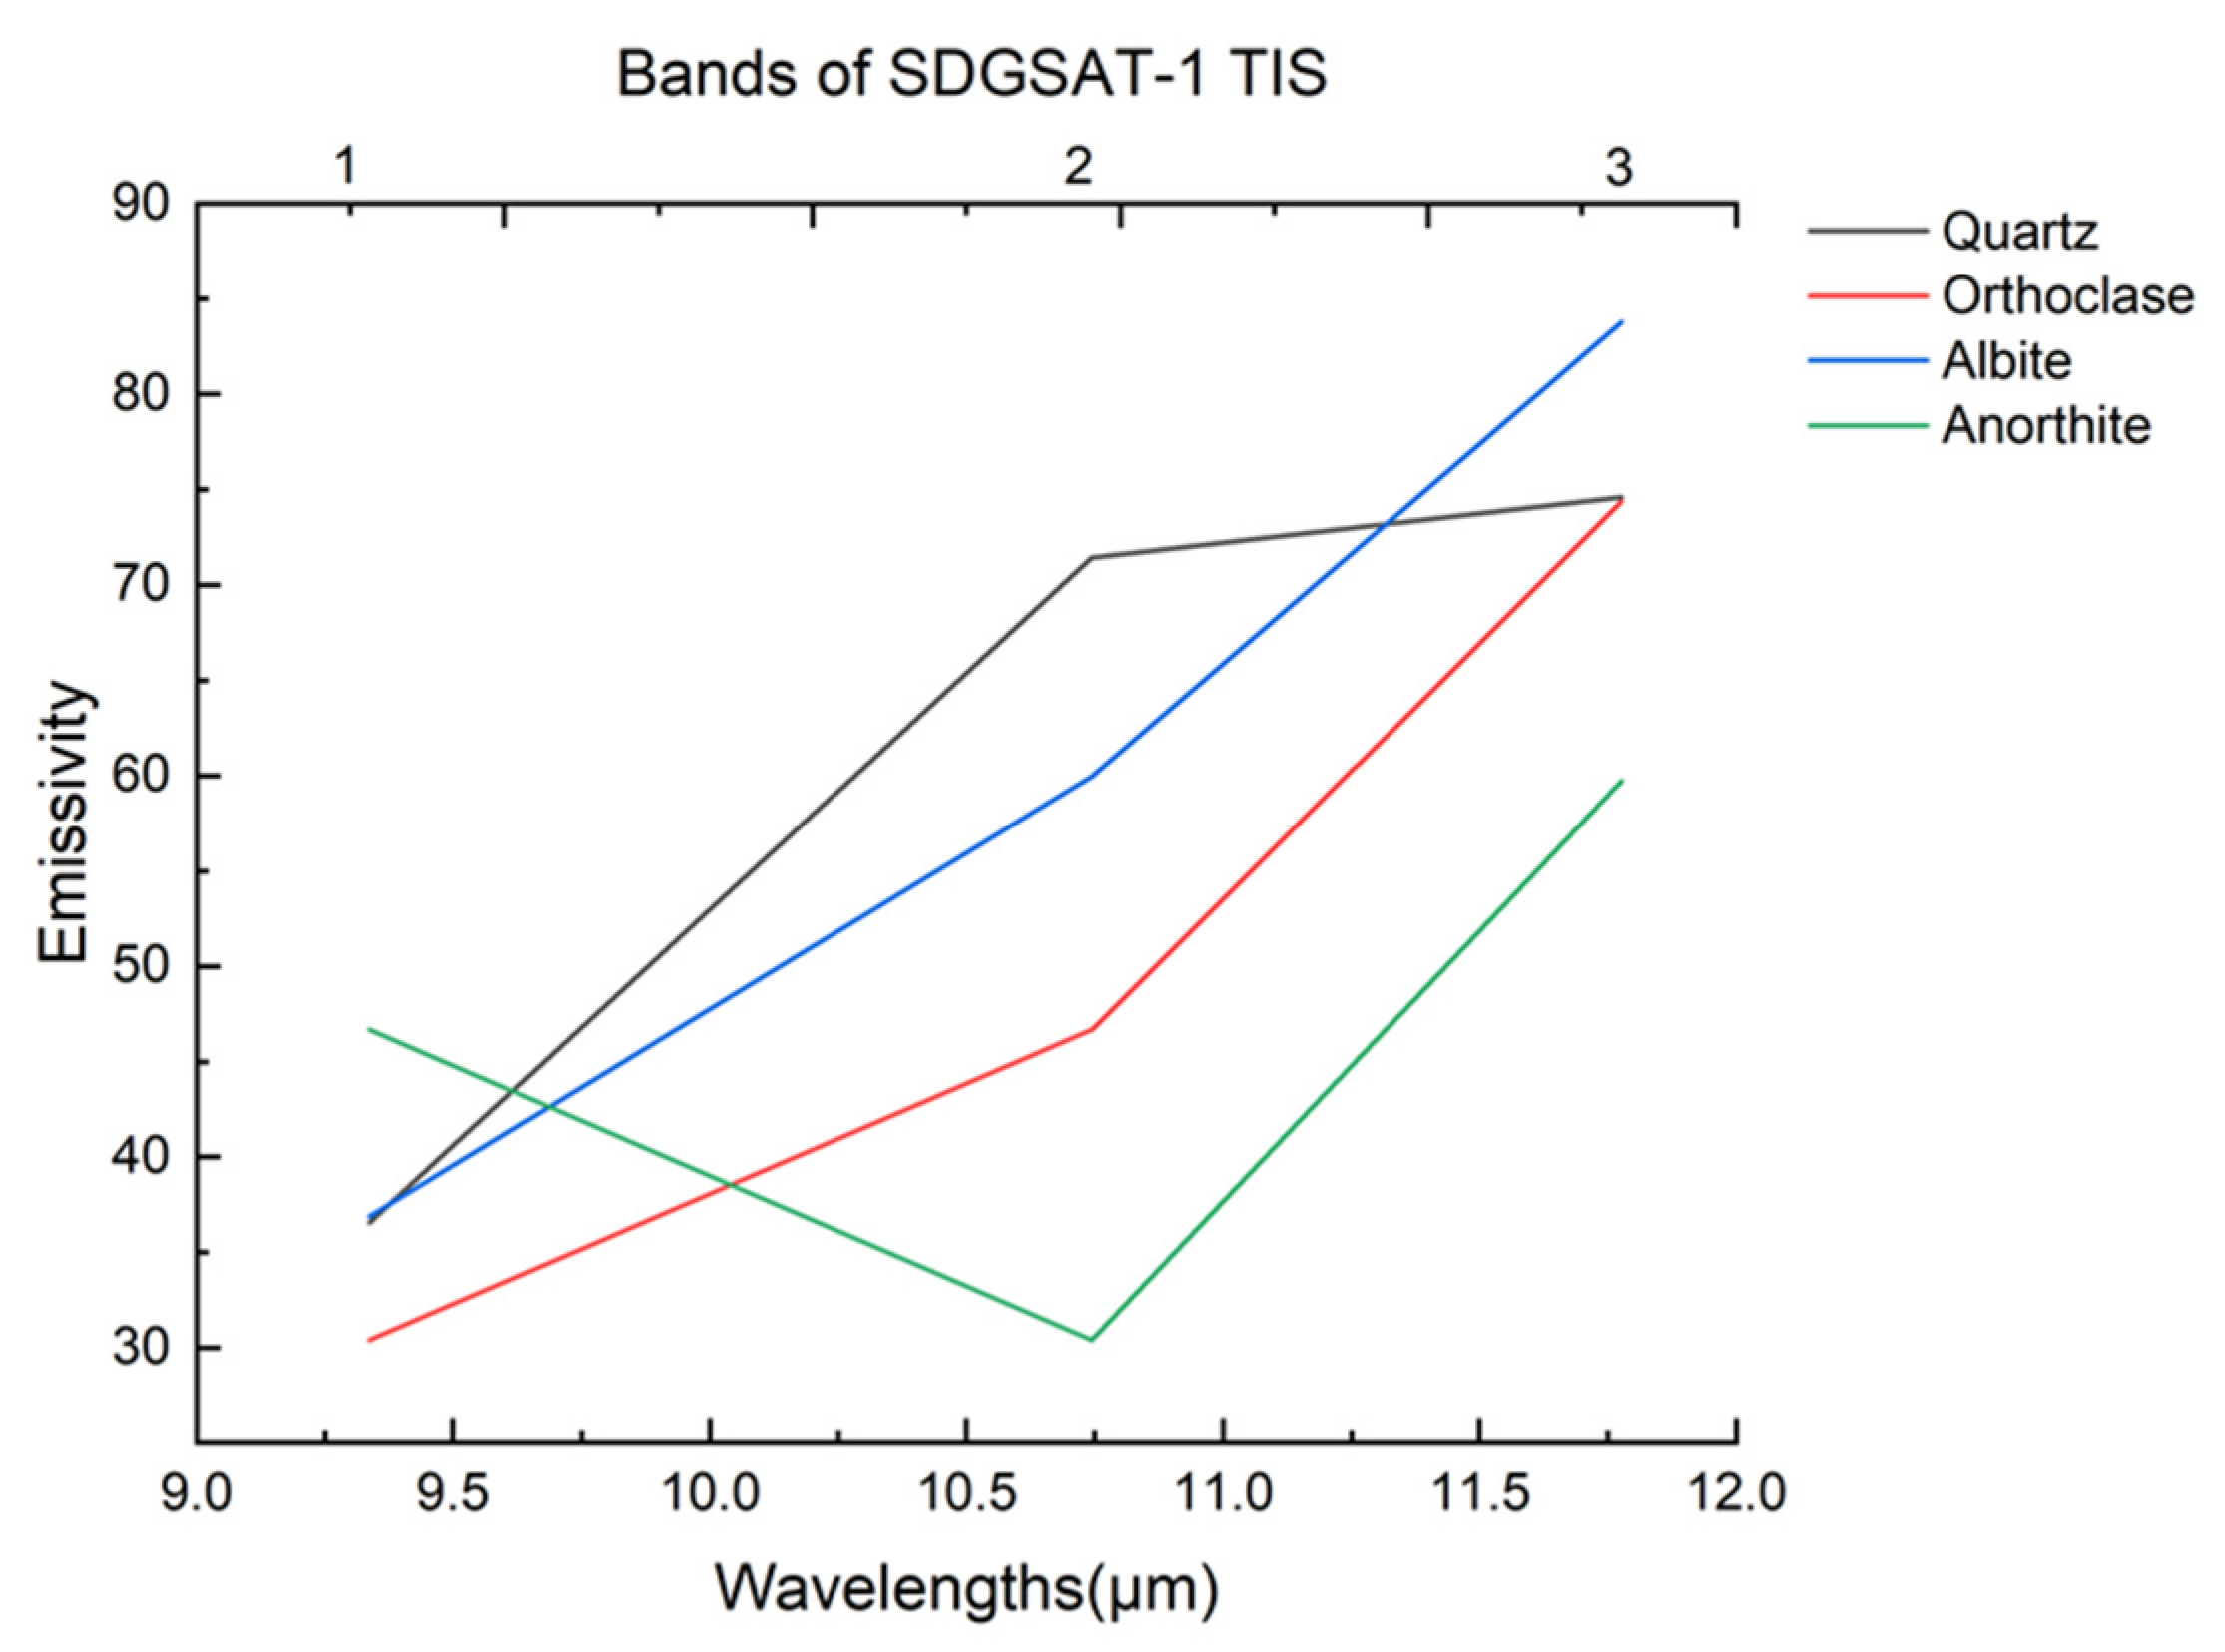
2.2. Band Ratio
2.3. Improved Sauvola Segmentation (ISauvola)
2.4. Accuracy Evaluation
3. Experiment
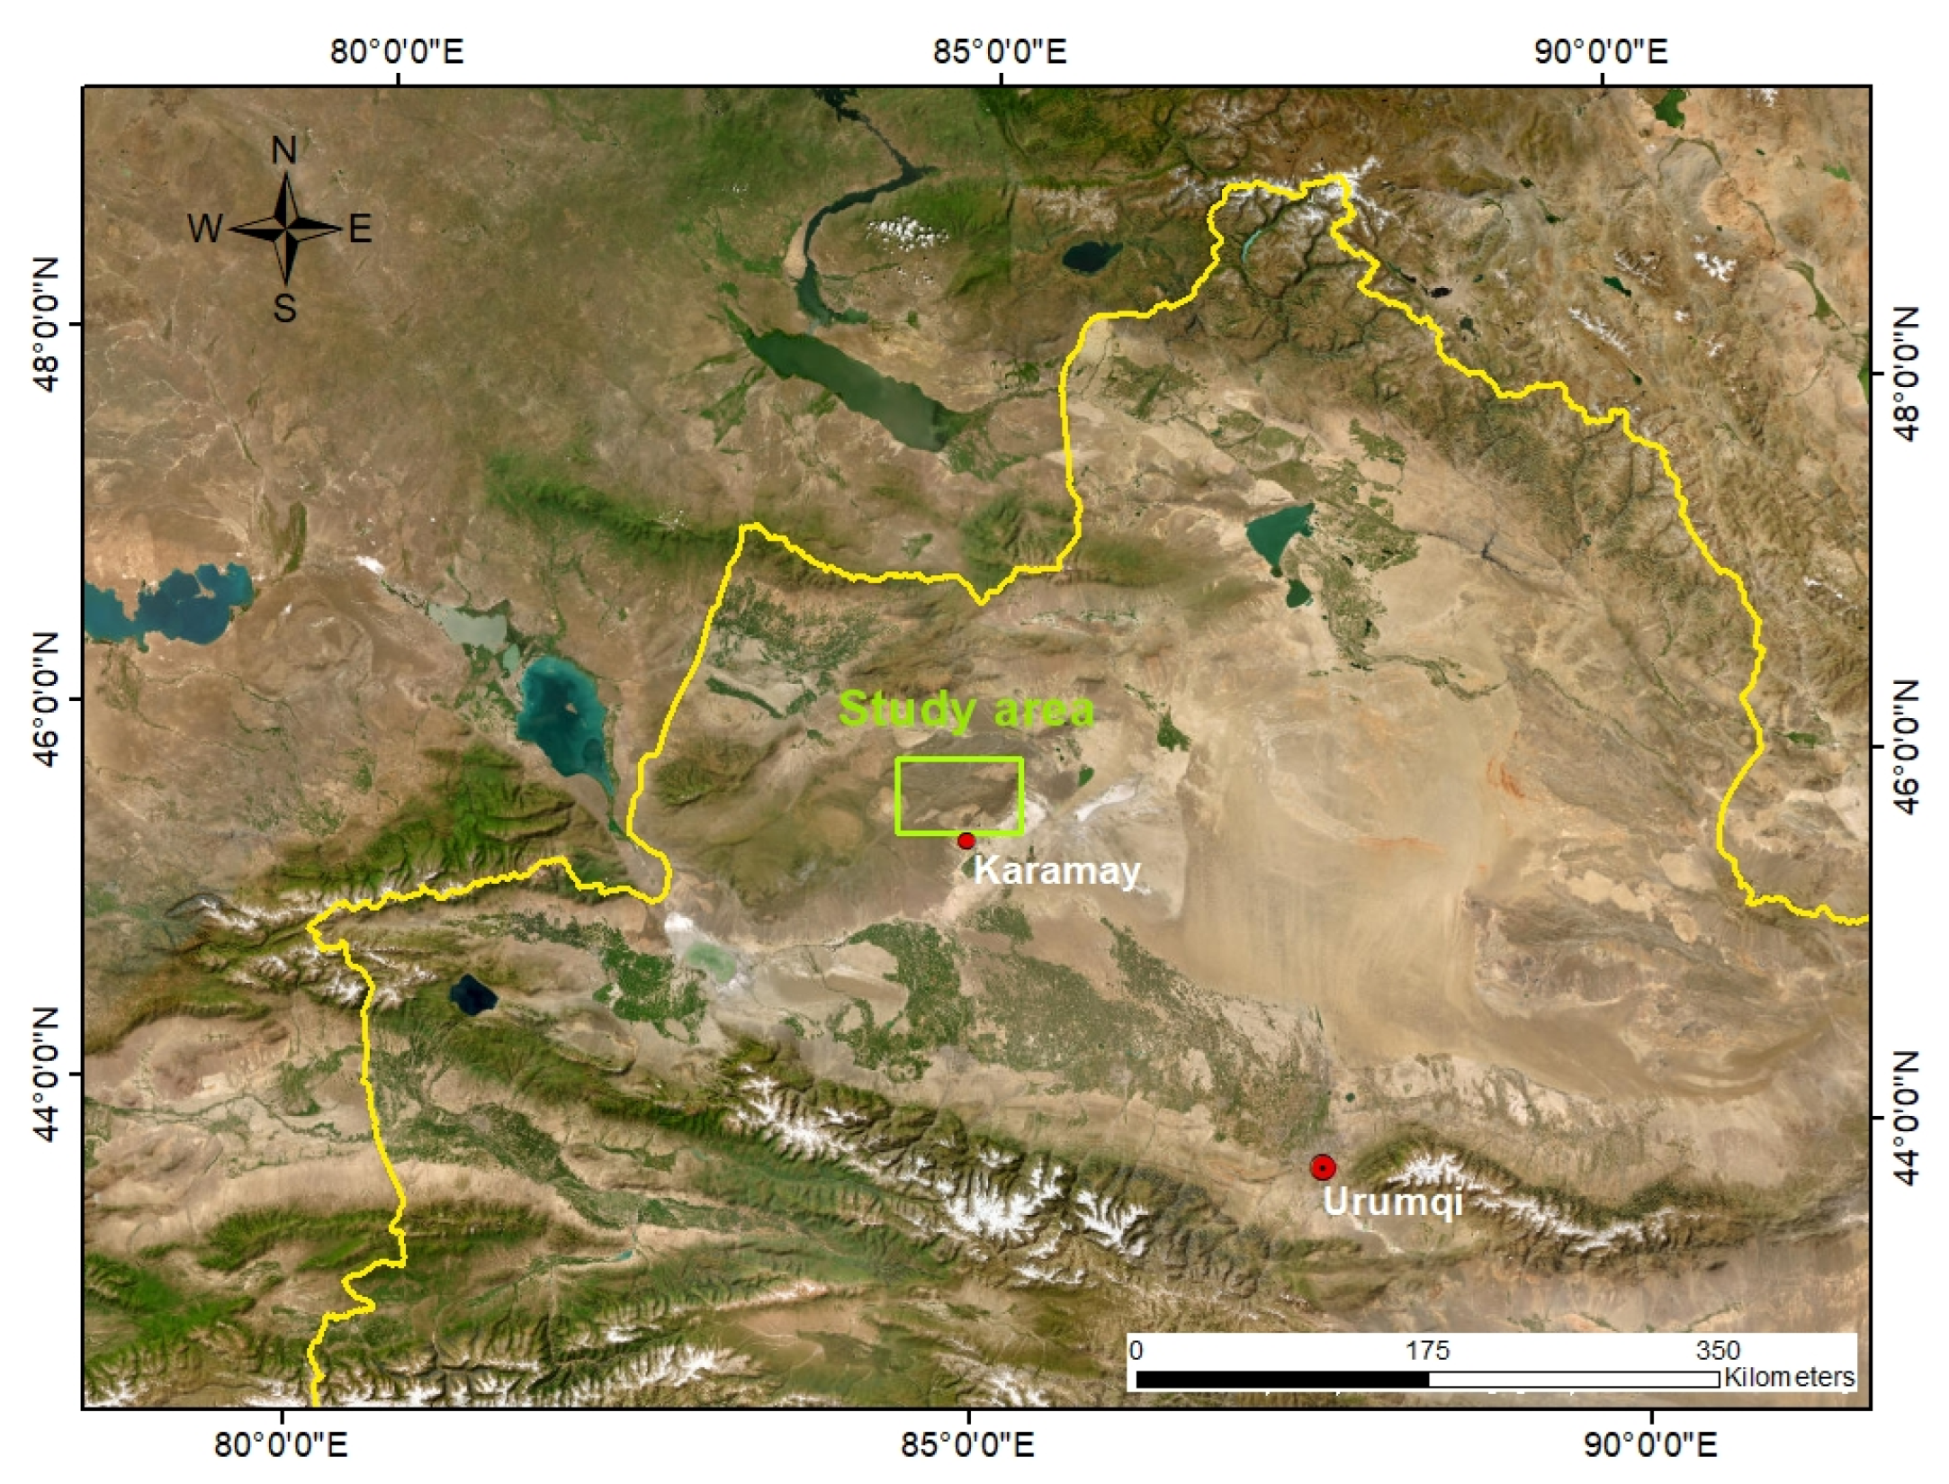
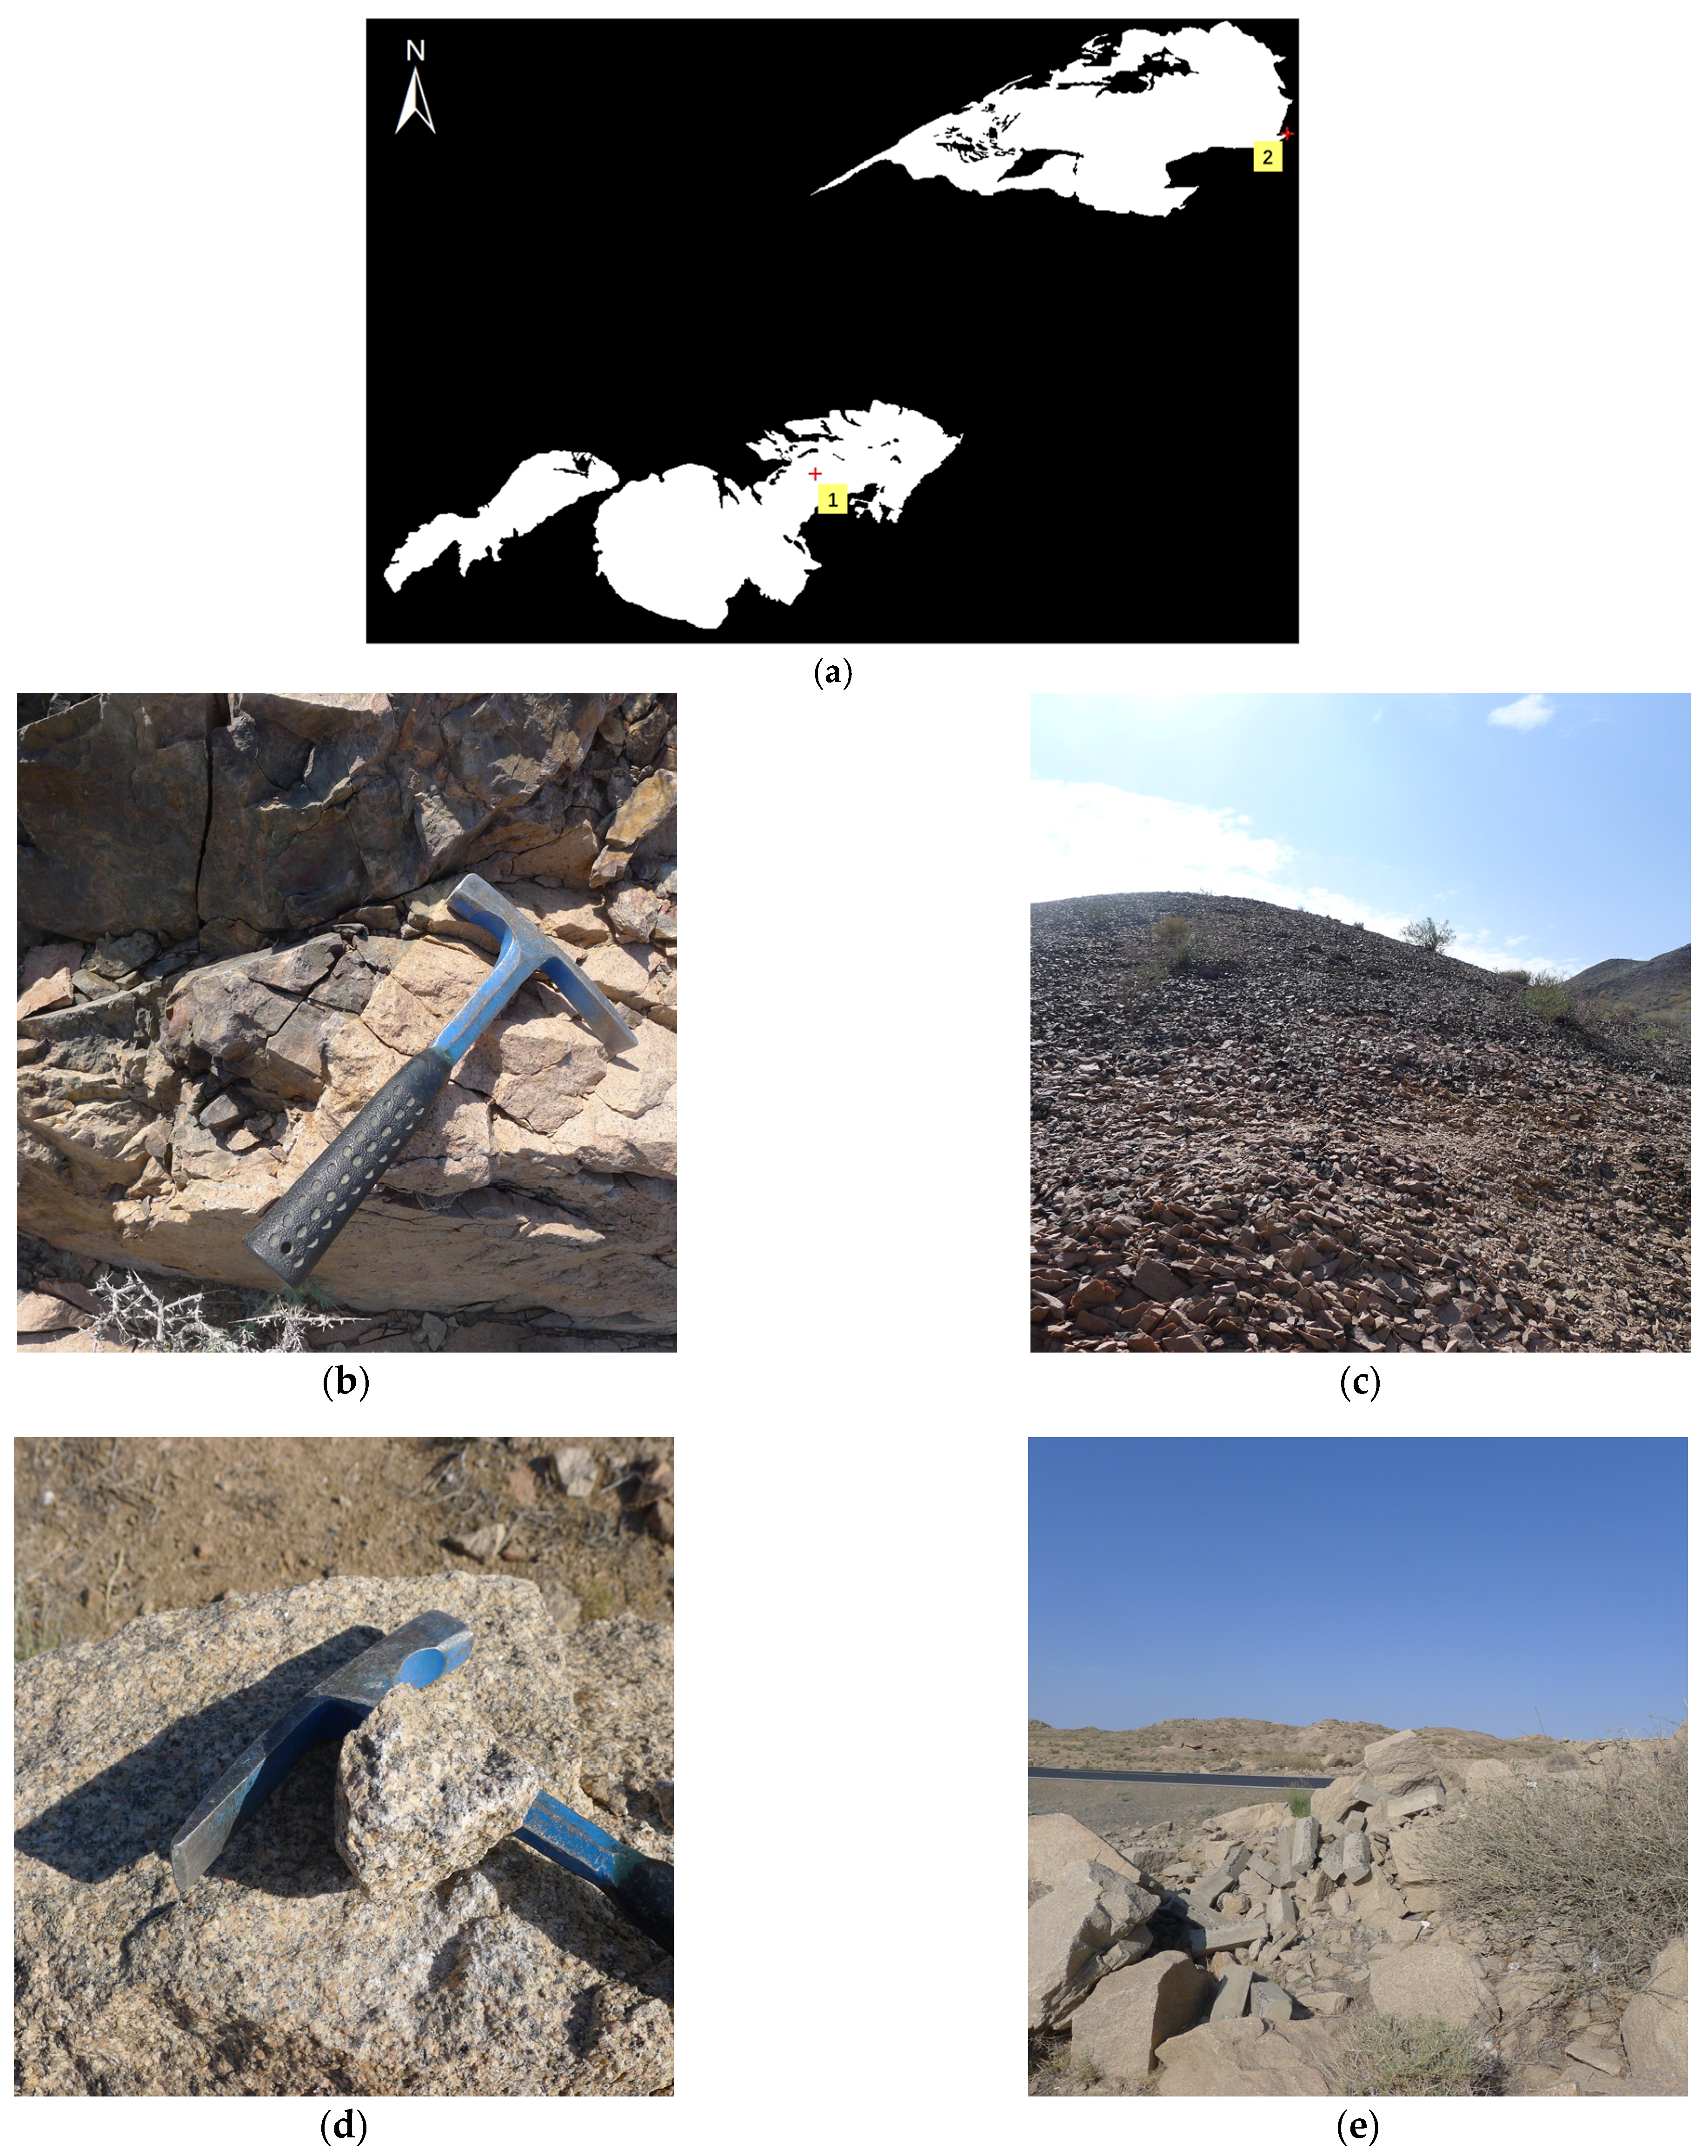
3.1. Study Area
3.2. Data and Preprocessing
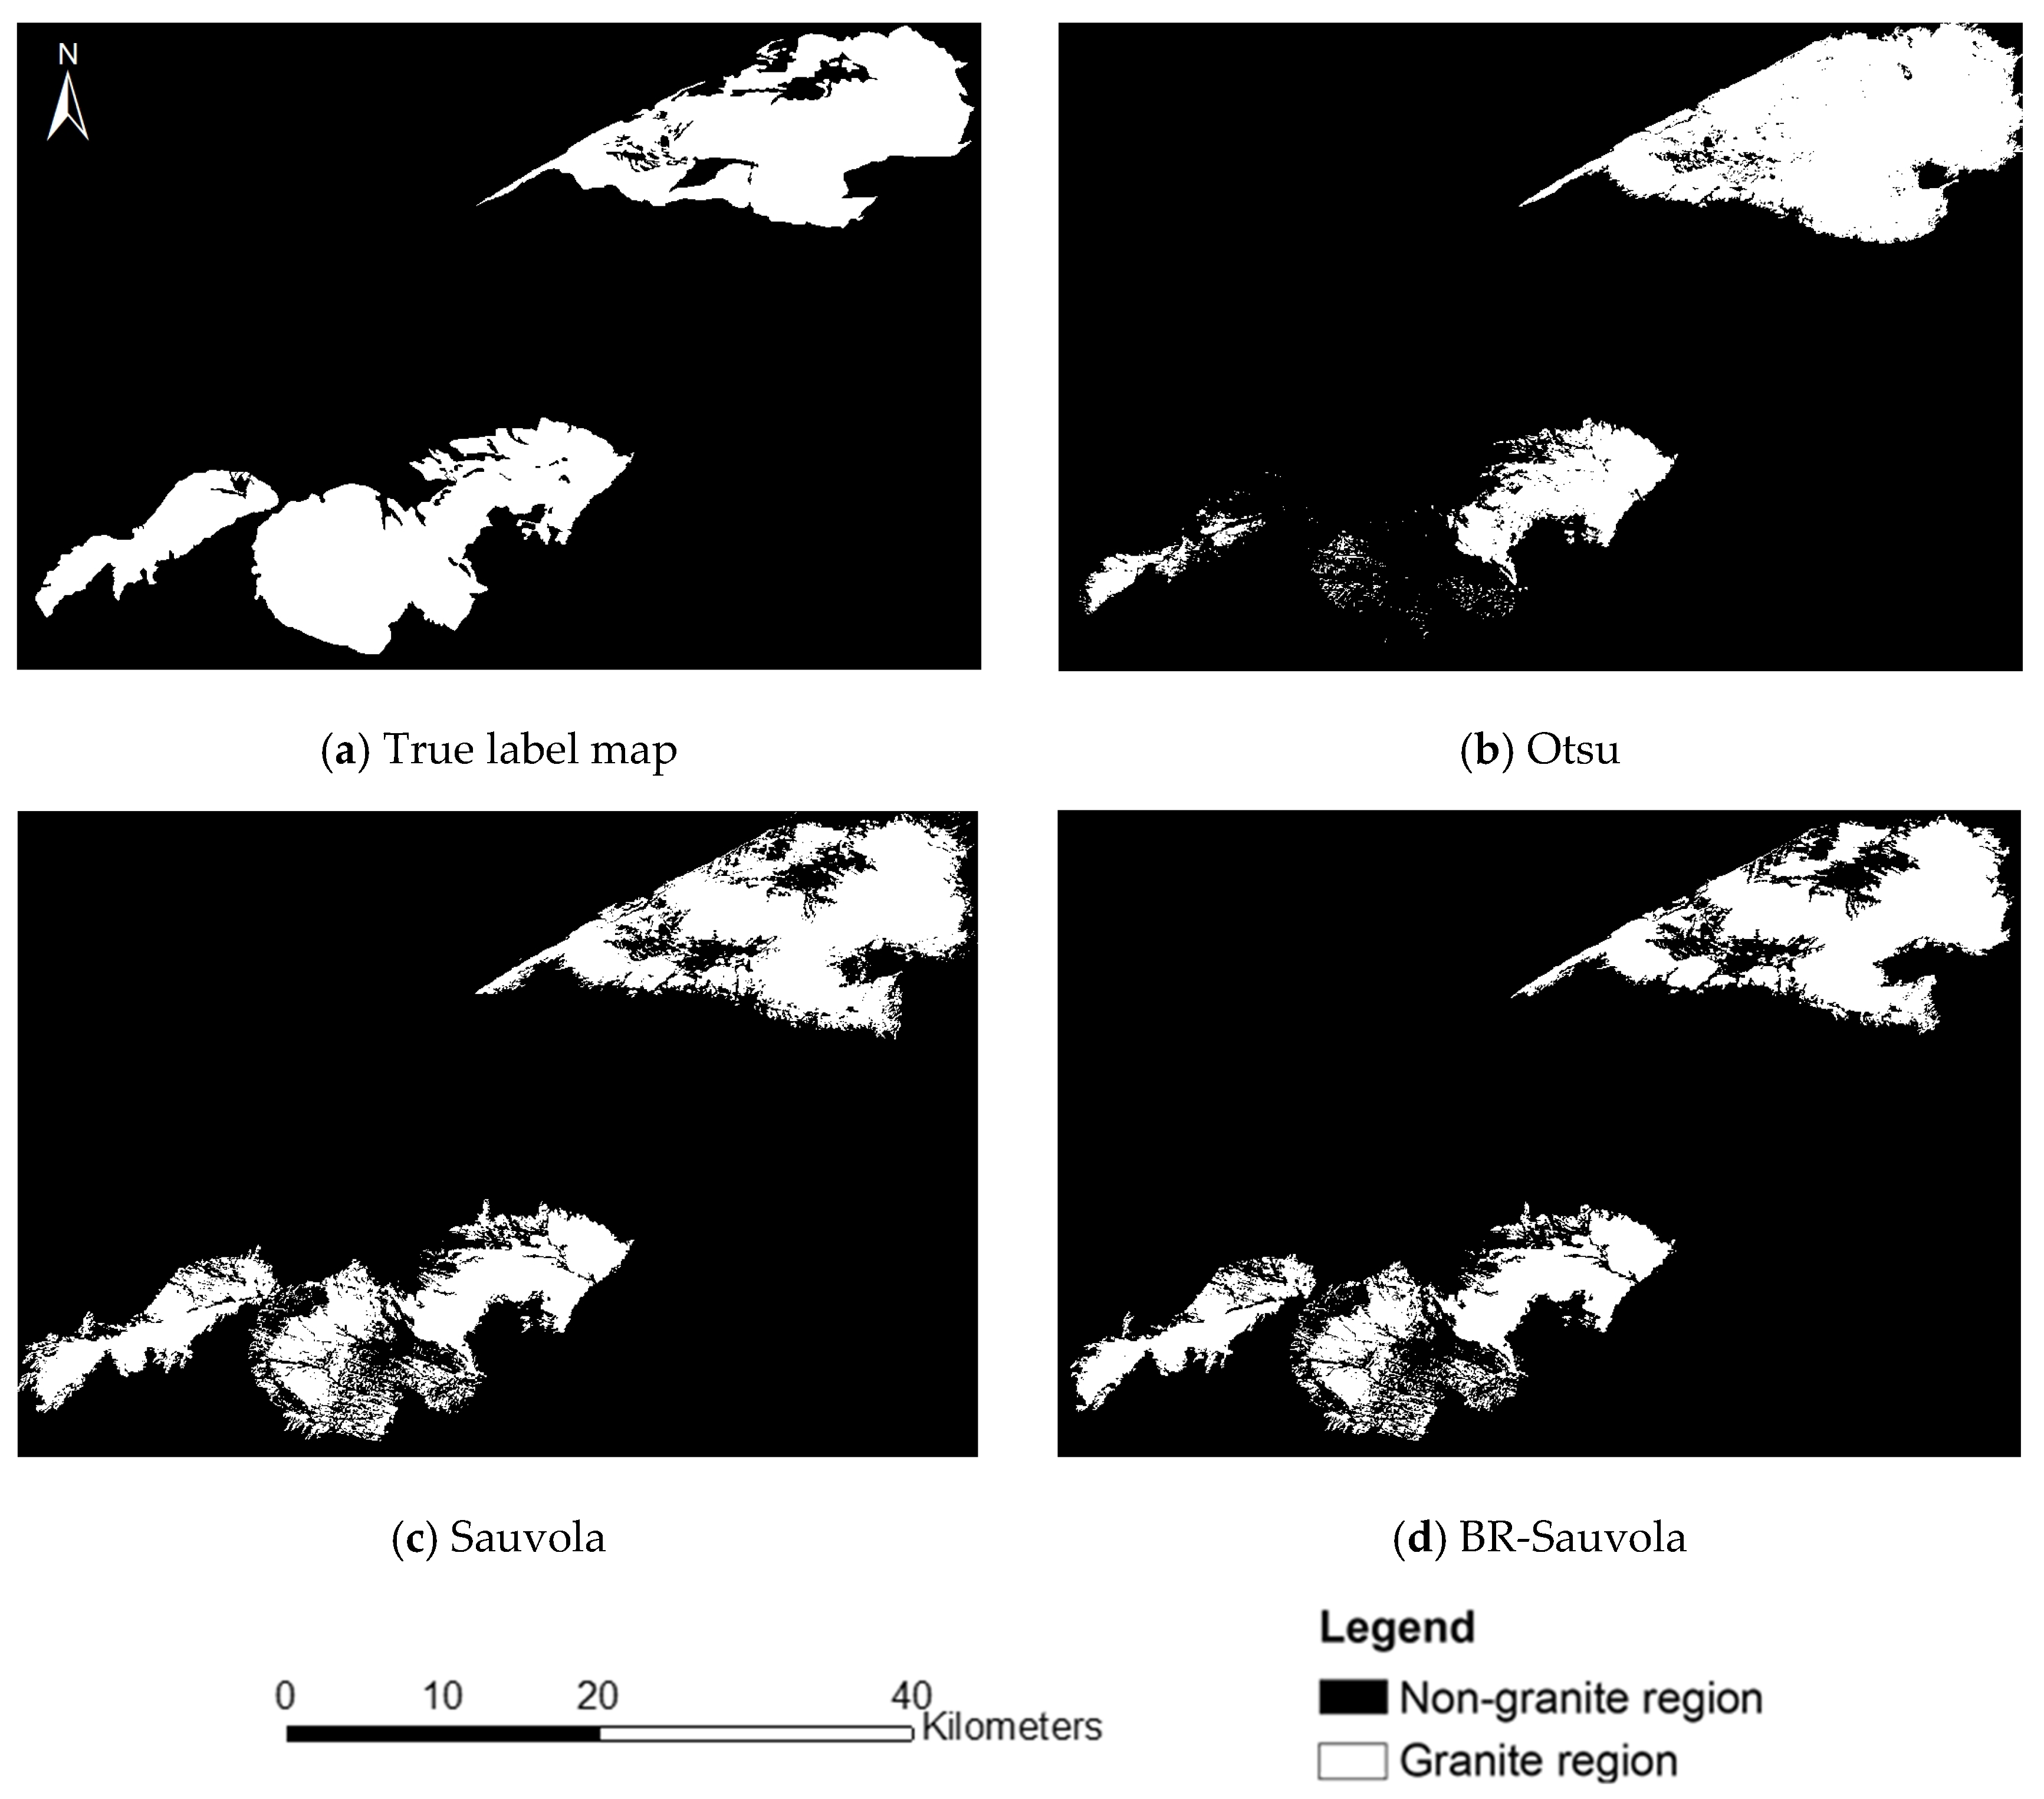
3.3. Results and Analysis
4. Discussion
5. Conclusions
- (1)
- SDGSAT-1 TIS data can serve as a valuable data source for extracting granite.
- (2)
- The BR-ISauvola method proposed in this paper is applicable to granite extraction.
Author Contributions
Funding
Institutional Review Board Statement
Informed Consent Statement
Data Availability Statement
Acknowledgments
Conflicts of Interest
References
- Liu, L.; Zhou, J.; Jiang, D.; Zhuang, D.; Mansaray, L.; Zhang, B. Targeting Mineral Resources with Remote Sensing and Field Data in the Xiemisitai Area, West Junggar, Xinjiang, China. Remote Sens. 2013, 5, 3156–3171. [Google Scholar] [CrossRef]
- Luo, S.; Yin, S.; Chen, J.; Wu, Y.; Chen, X. Lithology Identification of UAV Oblique Photography Images Based on Semantic Segmentation Neural Network Algorithm. Math. Geosci. 2023. [Google Scholar] [CrossRef]
- Girija, R.R.; Mayappan, S. Mapping of Mineral Resources and Lithological Units: A Review of Remote Sensing Techniques. Int. J. Image Data Fusion 2019, 10, 79–106. [Google Scholar] [CrossRef]
- Pal, M.; Rasmussen, T.; Porwal, A. Optimized Lithological Mapping from Multispectral and Hyperspectral Remote Sensing Images Using Fused Multi-Classifiers. Remote Sens. 2020, 12, 177. [Google Scholar] [CrossRef]
- Kumar, C.; Chatterjee, S.; Oommen, T.; Guha, A. Automated Lithological Mapping by Integrating Spectral Enhancement Techniques and Machine Learning Algorithms Using AVIRIS-NG Hyperspectral Data in Gold-Bearing Granite-Greenstone Rocks in Hutti, India. Int. J. Appl. Earth Obs. Geoinf. 2020, 86, 102006. [Google Scholar] [CrossRef]
- Wang, Z.; Zuo, R.; Jing, L. Fusion of Geochemical and Remote-Sensing Data for Lithological Mapping Using Random Forest Metric Learning. Math. Geosci. 2021, 53, 1125–1145. [Google Scholar] [CrossRef]
- Wang, Z.; Tian, S. Lithological Information Extraction and Classification in Hyperspectral Remote Sensing Data Using Backpropagation Neural Network. PLoS ONE 2021, 16, e0254542. [Google Scholar] [CrossRef]
- Wang, Z.; Zuo, R. Mapping Himalayan Leucogranites by Machine Learning Using Multi-Source Data. Earth Sci. Front. 2023, 30, 216–226. [Google Scholar] [CrossRef]
- EL-Omairi, M.A.; El Garouani, A. A Review on Advancements in Lithological Mapping Utilizing Machine Learning Algorithms and Remote Sensing Data. Heliyon 2023, 9, e20168. [Google Scholar] [CrossRef]
- Amer, R.; Kusky, T.; Ghulam, A. Lithological Mapping in the Central Eastern Desert of Egypt Using ASTER Data. J. Afr. Earth Sci. 2010, 56, 75–82. [Google Scholar] [CrossRef]
- Yao, F.; Xu, X.; Yang, J.; Wu, L.; Geng, X. A Technology for Identifying Li-Be Pegmatite Using ASTER Remote Sensing Data in Granite of Gobi Shallow-Covered Area: A Case Study of Recognition and Prediction of Li-Be Pegmatite in Jingerquan, Xinjiang. Miner. Depos. 2020, 39, 686–696. [Google Scholar] [CrossRef]
- Aisabokhae, J.; Osazuwa, I. Radiometric Mapping and Spectral Based Classification of Rocks Using Remote Sensing Data Analysis: The Precambrian Basement Complex, NW Nigeria. Remote Sens. Appl. Soc. Environ. 2021, 21, 100447. [Google Scholar] [CrossRef]
- Xie, W.; Zhao, Y.; Liu, L. Lithology Identification in Changji Area, Eastern Tianshan, Xinjiang Using GF-1 and Landsat 8 Data. Remote Sens. Technol. Appl. 2023, 38, 1423. [Google Scholar] [CrossRef]
- Shirmard, H.; Farahbakhsh, E.; Heidari, E.; Beiranvand Pour, A.; Pradhan, B.; Müller, D.; Chandra, R. A Comparative Study of Convolutional Neural Networks and Conventional Machine Learning Models for Lithological Mapping Using Remote Sensing Data. Remote Sens. 2022, 14, 819. [Google Scholar] [CrossRef]
- Sauvola, J.; Pietikäinen, M. Adaptive Document Image Binarization. Pattern Recognit. 2000, 33, 225–236. [Google Scholar] [CrossRef]
- Zhou, X.; Wang, J.; Zheng, F.; Wang, H.; Yang, H. An Overview of Coastline Extraction from Remote Sensing Data. Remote Sens. 2023, 15, 4865. [Google Scholar] [CrossRef]
- Zheng, S.; Fu, B. Lithological Mapping of Granitiods in the Western Junggar from ASTER SWIR-TIR Multispectral Data: Case Study in Karamay Pluton, Xinjiang. Acta Petrol. Sin. 2013, 29, 2936–2948. [Google Scholar]
- Zhou, Y.; Zheng, S.; An, Y.; Lai, C. ASTER VNIR-SWIR Based Lithological Mapping of Granitoids in the Western Junggar Orogen (NW Xinjiang): Improved Inputs to Random Forest Method. Earth Space Sci. 2023, 10, e2023EA002877. [Google Scholar] [CrossRef]
- Chen, L.; Li, W. Lithological Classification and Analysis Based on Random Forest and Multiple Features: A Case Study in the Qulong Copper Deposit, China. J. Appl. Remote Sens. 2023, 17, 044504. [Google Scholar] [CrossRef]
- Huang, W.; Jiao, J.; Zhao, L.; Hu, Z.; Peng, X.; Yang, L.; Li, X.; Chen, F. Thermal Discharge Temperature Retrieval and Monitoring of NPPs Based on SDGSAT-1 Images. Remote Sens. 2023, 15, 2298. [Google Scholar] [CrossRef]
- Xie, Y.; Ma, C.; Zhao, Y.; Yan, D.; Cheng, B.; Hou, X.; Chen, H.; Fu, B.; Wan, G. The Potential of Using SDGSAT-1 TIS Data to Identify Industrial Heat Sources in the Beijing–Tianjin–Hebei Region. Remote Sens. 2024, 16, 768. [Google Scholar] [CrossRef]
- Ninomiya, Y.; Fu, B.; Cudahy, T.J. Detecting Lithology with Advanced Spaceborne Thermal Emission and Reflection Radiometer (ASTER) Multispectral Thermal Infrared “Radiance-at-Sensor” Data. Remote Sens. Environ. 2005, 99, 127–139. [Google Scholar] [CrossRef]
- Liu, B.; Han, B.; Chen, J.; Ren, R.; Zheng, B.; Wang, Z.; Feng, L. Closure Time of the Junggar-Balkhash Ocean: Constraints from Late Paleozoic Volcano-Sedimentary Sequences in the Barleik Mountains, West Junggar, NW China. Tectonics 2017, 36, 2823–2845. [Google Scholar] [CrossRef]
- Liu, Y.; Wang, X.; Wu, K.; Chen, S.; Shi, Z.; Yao, W. Late Carboniferous Seismic and Volcanic Record in the Northwestern Margin of the Junggar Basin: Implication for the Tectonic Setting of the West Junggar. Gondwana Res. 2019, 71, 49–75. [Google Scholar] [CrossRef]
- Yang, G.; Li, Y.; Santosh, M.; Yang, B.; Yan, J.; Zhang, B.; Tong, L. Geochronology and Geochemistry of Basaltic Rocks from the Sartuohai Ophiolitic Mélange, NW China: Implications for a Devonian Mantle Plume within the Junggar Ocean. J. Asian Earth Sci. 2012, 59, 141–155. [Google Scholar] [CrossRef]
- Yang, G.; Li, Y.; Gu, P.; Yang, B.; Tong, L.; Zhang, H. Geochronological and Geochemical Study of the Darbut Ophiolitic Complex in the West Junggar (NW China): Implications for Petrogenesis and Tectonic Evolution. Gondwana Res. 2012, 21, 1037–1049. [Google Scholar] [CrossRef]
- Chen, B.; Zhu, Y. Petrology, Geochemistry and Zircon U-Pb Chronology of Gabbro in Darbut Ophiolitic Mélange, Xinjiang. Acta Petrol. Sin. 2011, 27, 1746–1758. [Google Scholar]
- Gao, R.; Xiao, L.; Wang, G.; He, X.; Yang, G.; Yan, S. Paleozoic Magmatism and Tectonic Setting in West Junggar. Acta Petrol. Sin. 2013, 29, 3413–3434. [Google Scholar]
- Kealy, P.S.; Hook, S.J. Separating Temperature and Emissivity in Thermal Infrared Multispectral Scanner Data: Implications for Recovering Land Surface Temperatures. IEEE Trans. Geosci. Remote Sens. 1993, 31, 1155–1164. [Google Scholar] [CrossRef]
- Yan, B. Study on Mechanism of Spectrums of Rocks and Minerals and Information Extraction Method in Thermal Remote Sensing Geology. Ph.D. Thesis, China University of Geosciences, Beijing, China, 2006. [Google Scholar]
- Shen, P.; Shen, Y.; Pan, H.; Wang, J.; Zhang, R.; Zhang, Y. Baogutu Porphyry Cu-Mo-Au Deposit, West Junggar, Northwest China: Petrology, Alteration, and Mineralization. Econ. Geol. 2010, 105, 947–970. [Google Scholar] [CrossRef]
- Li, Y.; Li, G.; Kang, L.; He, X.; Zhang, H.; Wang, J. Evidence of Zircon U-Pb Geochronology for Magma Mixing of Xiaerpu Granite in West Junggar. Acta Petrol. Sin. 2013, 29, 3023–3030. [Google Scholar]
- Gao, R.; Xiao, L.; Pirajno, F.; Wang, G.; He, X.; Yang, G.; Yan, S. Carboniferous–Permian Extensive Magmatism in the West Junggar, Xinjiang, Northwestern China: Its Geochemistry, Geochronology, and Petrogenesis. Lithos 2014, 204, 125–143. [Google Scholar] [CrossRef]
- Duan, F.; Li, Y.; Yang, G.; Zhi, Q.; Li, Y.; Tao, X.; Gao, J.; Chen, R. Late Carboniferous Adakitic Porphyries in the Huangliangzi Pluton, West Junggar (Xinjiang), NW China: Petrogenesis and Their Tectonic Implications. Geol. J. 2018, 53, 97–113. [Google Scholar] [CrossRef]
- Duan, F.; Li, Y.; Zhi, Q.; Yang, G.; Lai, C.; Xiao, H.; Lindagato, P.; Wan, Y.; Ren, Y. Magmatism and Cu–Au–Mo Mineralization of the Darbut Tectono-magmatic Zone in West Junggar (Xinjiang), NW China: An Updated Review. Geol. J. 2018, 53, 293–302. [Google Scholar] [CrossRef]


| SDGSAT-1 Thermal Infrared Spectrometer | |
|---|---|
| B1: 8~10.5 | |
| Wavelength (μm) | B2: 10.3~11.3 |
| B3: 11.5~12.5 | |
| Width (km) | 300 |
| Spatial resolution (m) | 30 |
| Band | Gain | Bias |
|---|---|---|
| 1 | 0.003947 | 0.167126 |
| 2 | 0.003946 | 0.124622 |
| 3 | 0.005329 | 0.222530 |
| Methods | Omission Error% | Commission Error% | Precision% | Recall% | F1 Score% |
|---|---|---|---|---|---|
| Otsu | 36.49 | 18.24 | 81.76 | 63.51 | 71.49 |
| Sauvola | 22.72 | 13.19 | 86.81 | 77.28 | 81.77 |
| BR-ISauvola | 24.95 | 8.76 | 91.24 | 75.05 | 82.11 |
Disclaimer/Publisher’s Note: The statements, opinions and data contained in all publications are solely those of the individual author(s) and contributor(s) and not of MDPI and/or the editor(s). MDPI and/or the editor(s) disclaim responsibility for any injury to people or property resulting from any ideas, methods, instructions or products referred to in the content. |
© 2024 by the authors. Licensee MDPI, Basel, Switzerland. This article is an open access article distributed under the terms and conditions of the Creative Commons Attribution (CC BY) license (https://creativecommons.org/licenses/by/4.0/).
Share and Cite
Yuan, B.; Wang, Q.; Yang, J.; Xu, W.; He, C. Granite Extraction Based on the SDGSAT-1 Satellite Thermal Infrared Spectrometer Imagery. Sensors 2024, 24, 1750. https://doi.org/10.3390/s24061750
Yuan B, Wang Q, Yang J, Xu W, He C. Granite Extraction Based on the SDGSAT-1 Satellite Thermal Infrared Spectrometer Imagery. Sensors. 2024; 24(6):1750. https://doi.org/10.3390/s24061750
Chicago/Turabian StyleYuan, Boqi, Qinjun Wang, Jingyi Yang, Wentao Xu, and Chaokang He. 2024. "Granite Extraction Based on the SDGSAT-1 Satellite Thermal Infrared Spectrometer Imagery" Sensors 24, no. 6: 1750. https://doi.org/10.3390/s24061750