
Spectral Investigations of Fluorescence Tracers in Automotive and Aviation Fuels under Cryogenic Conditions
Abstract
:1. Introduction
2. Materials and Method
2.1. Measurement Principle
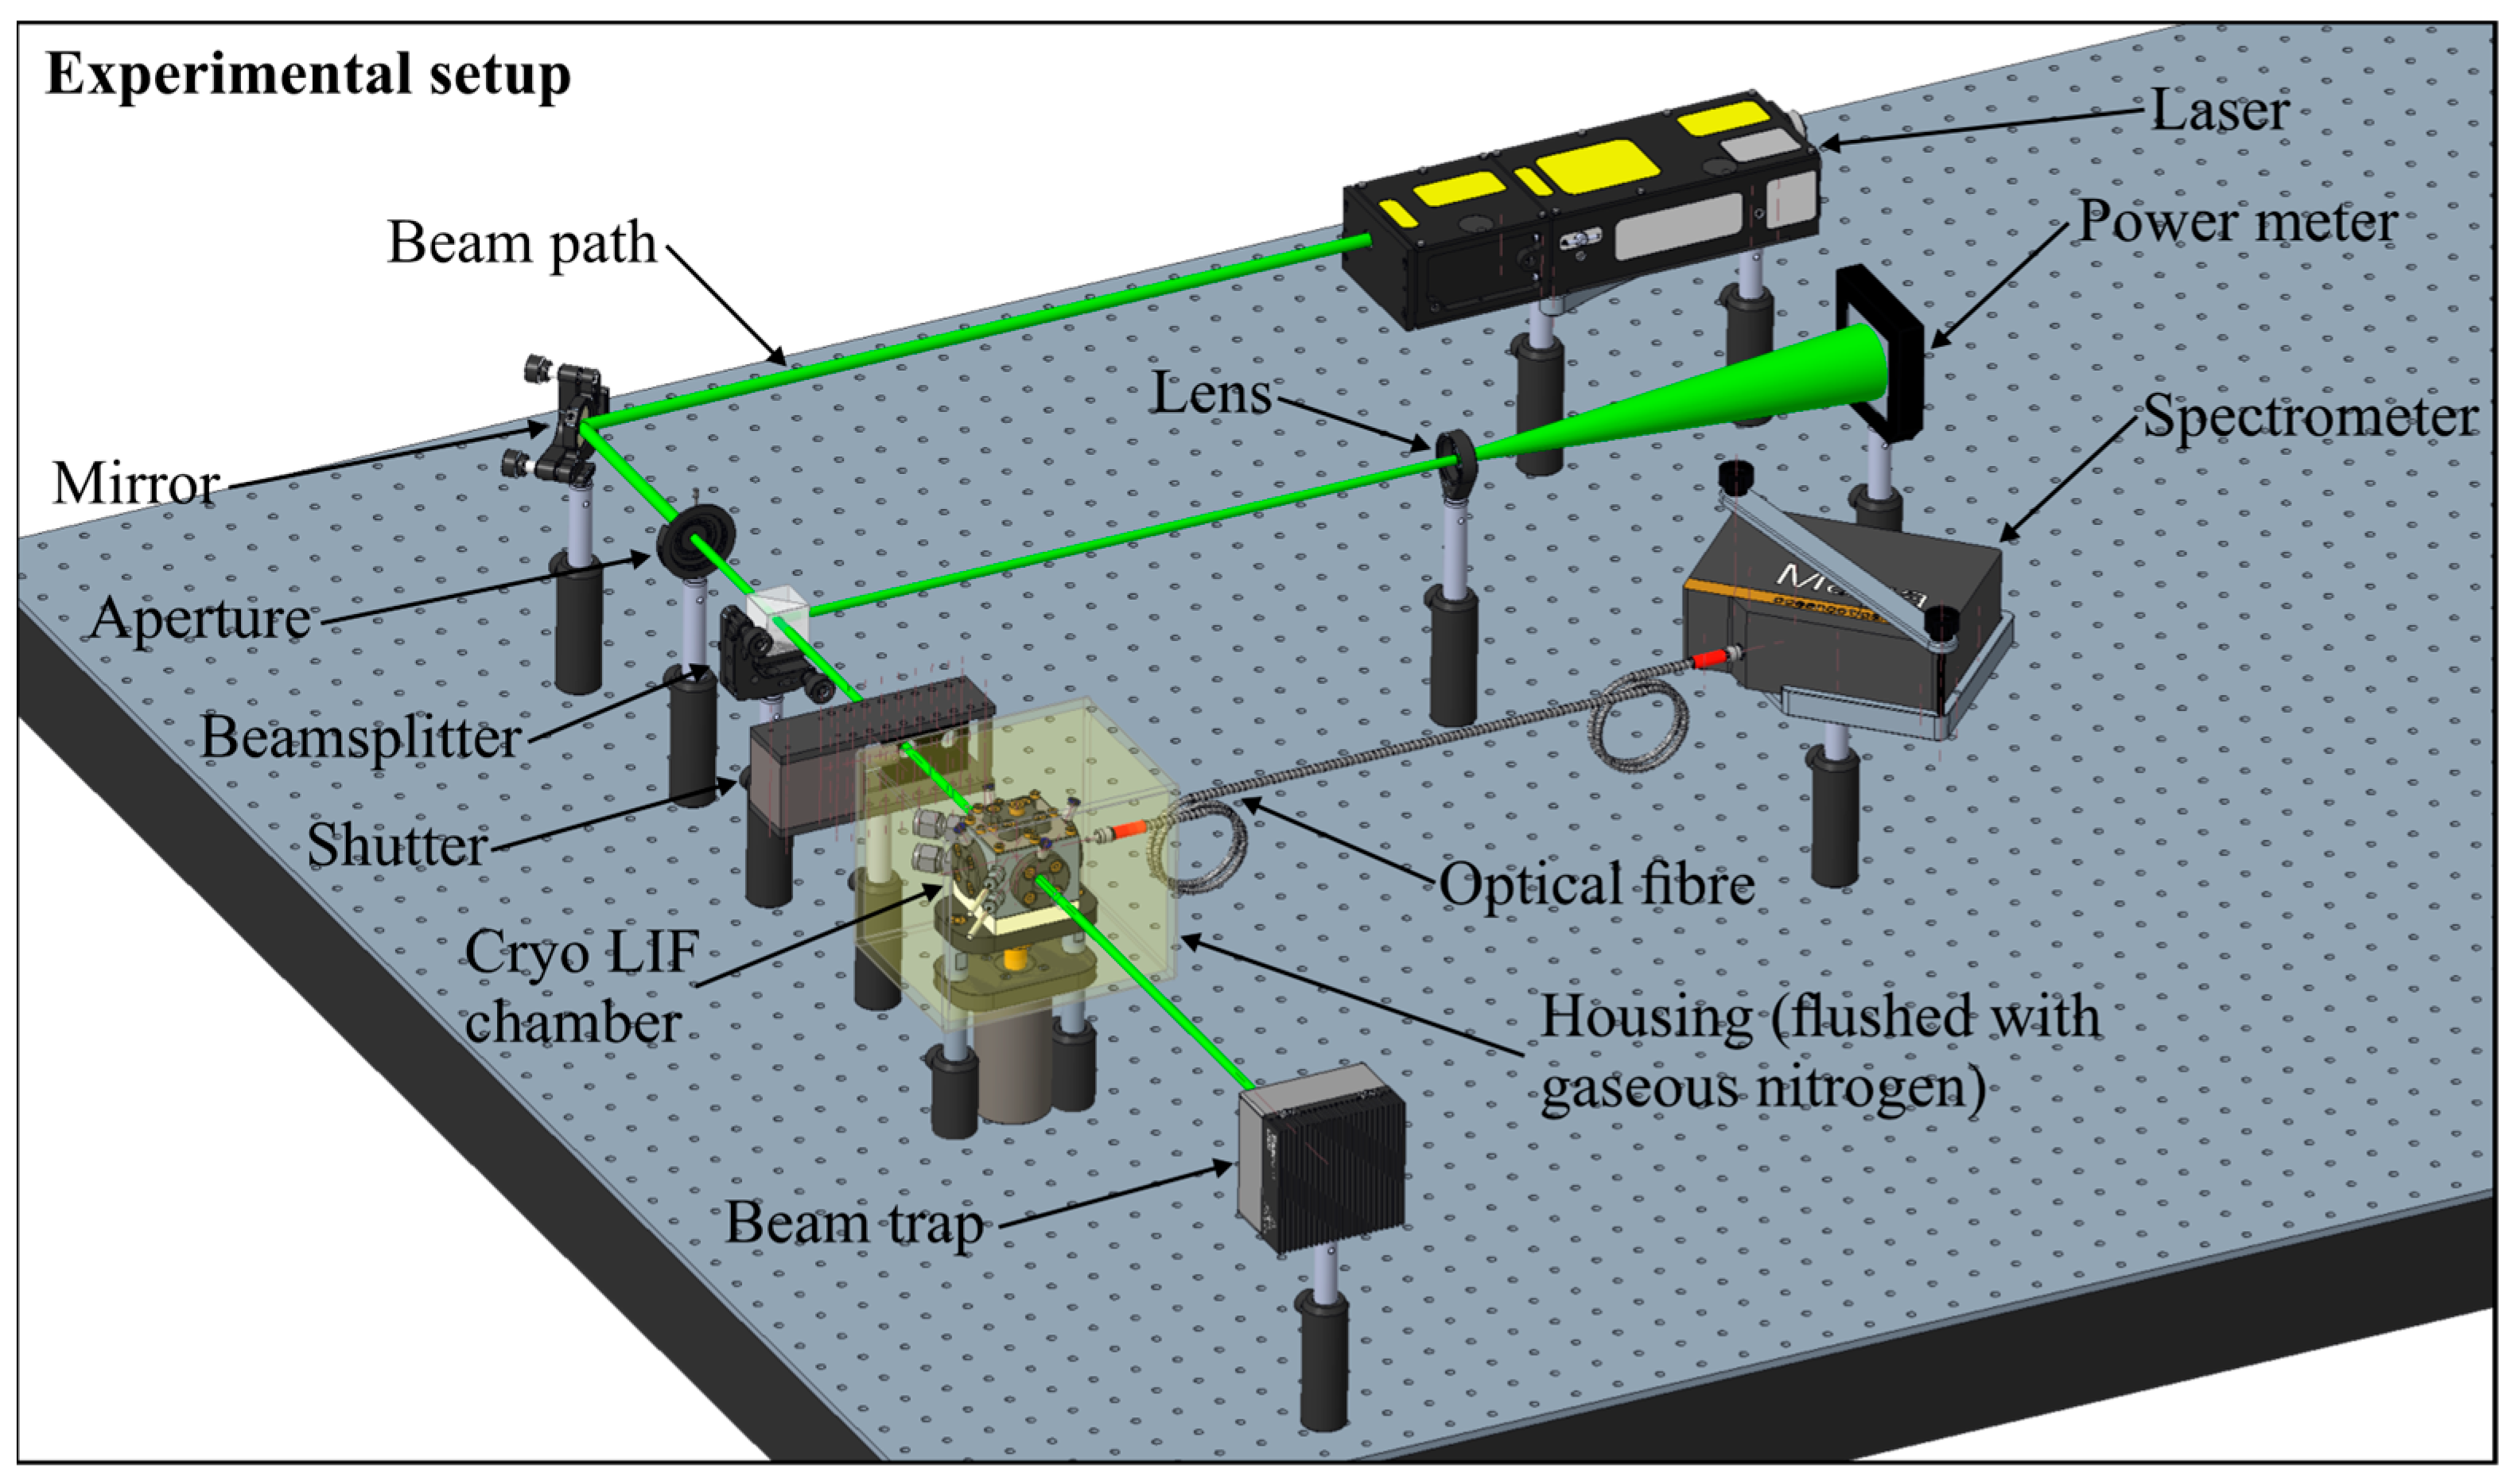
2.2. Fluorescence Spectroscopy Setup
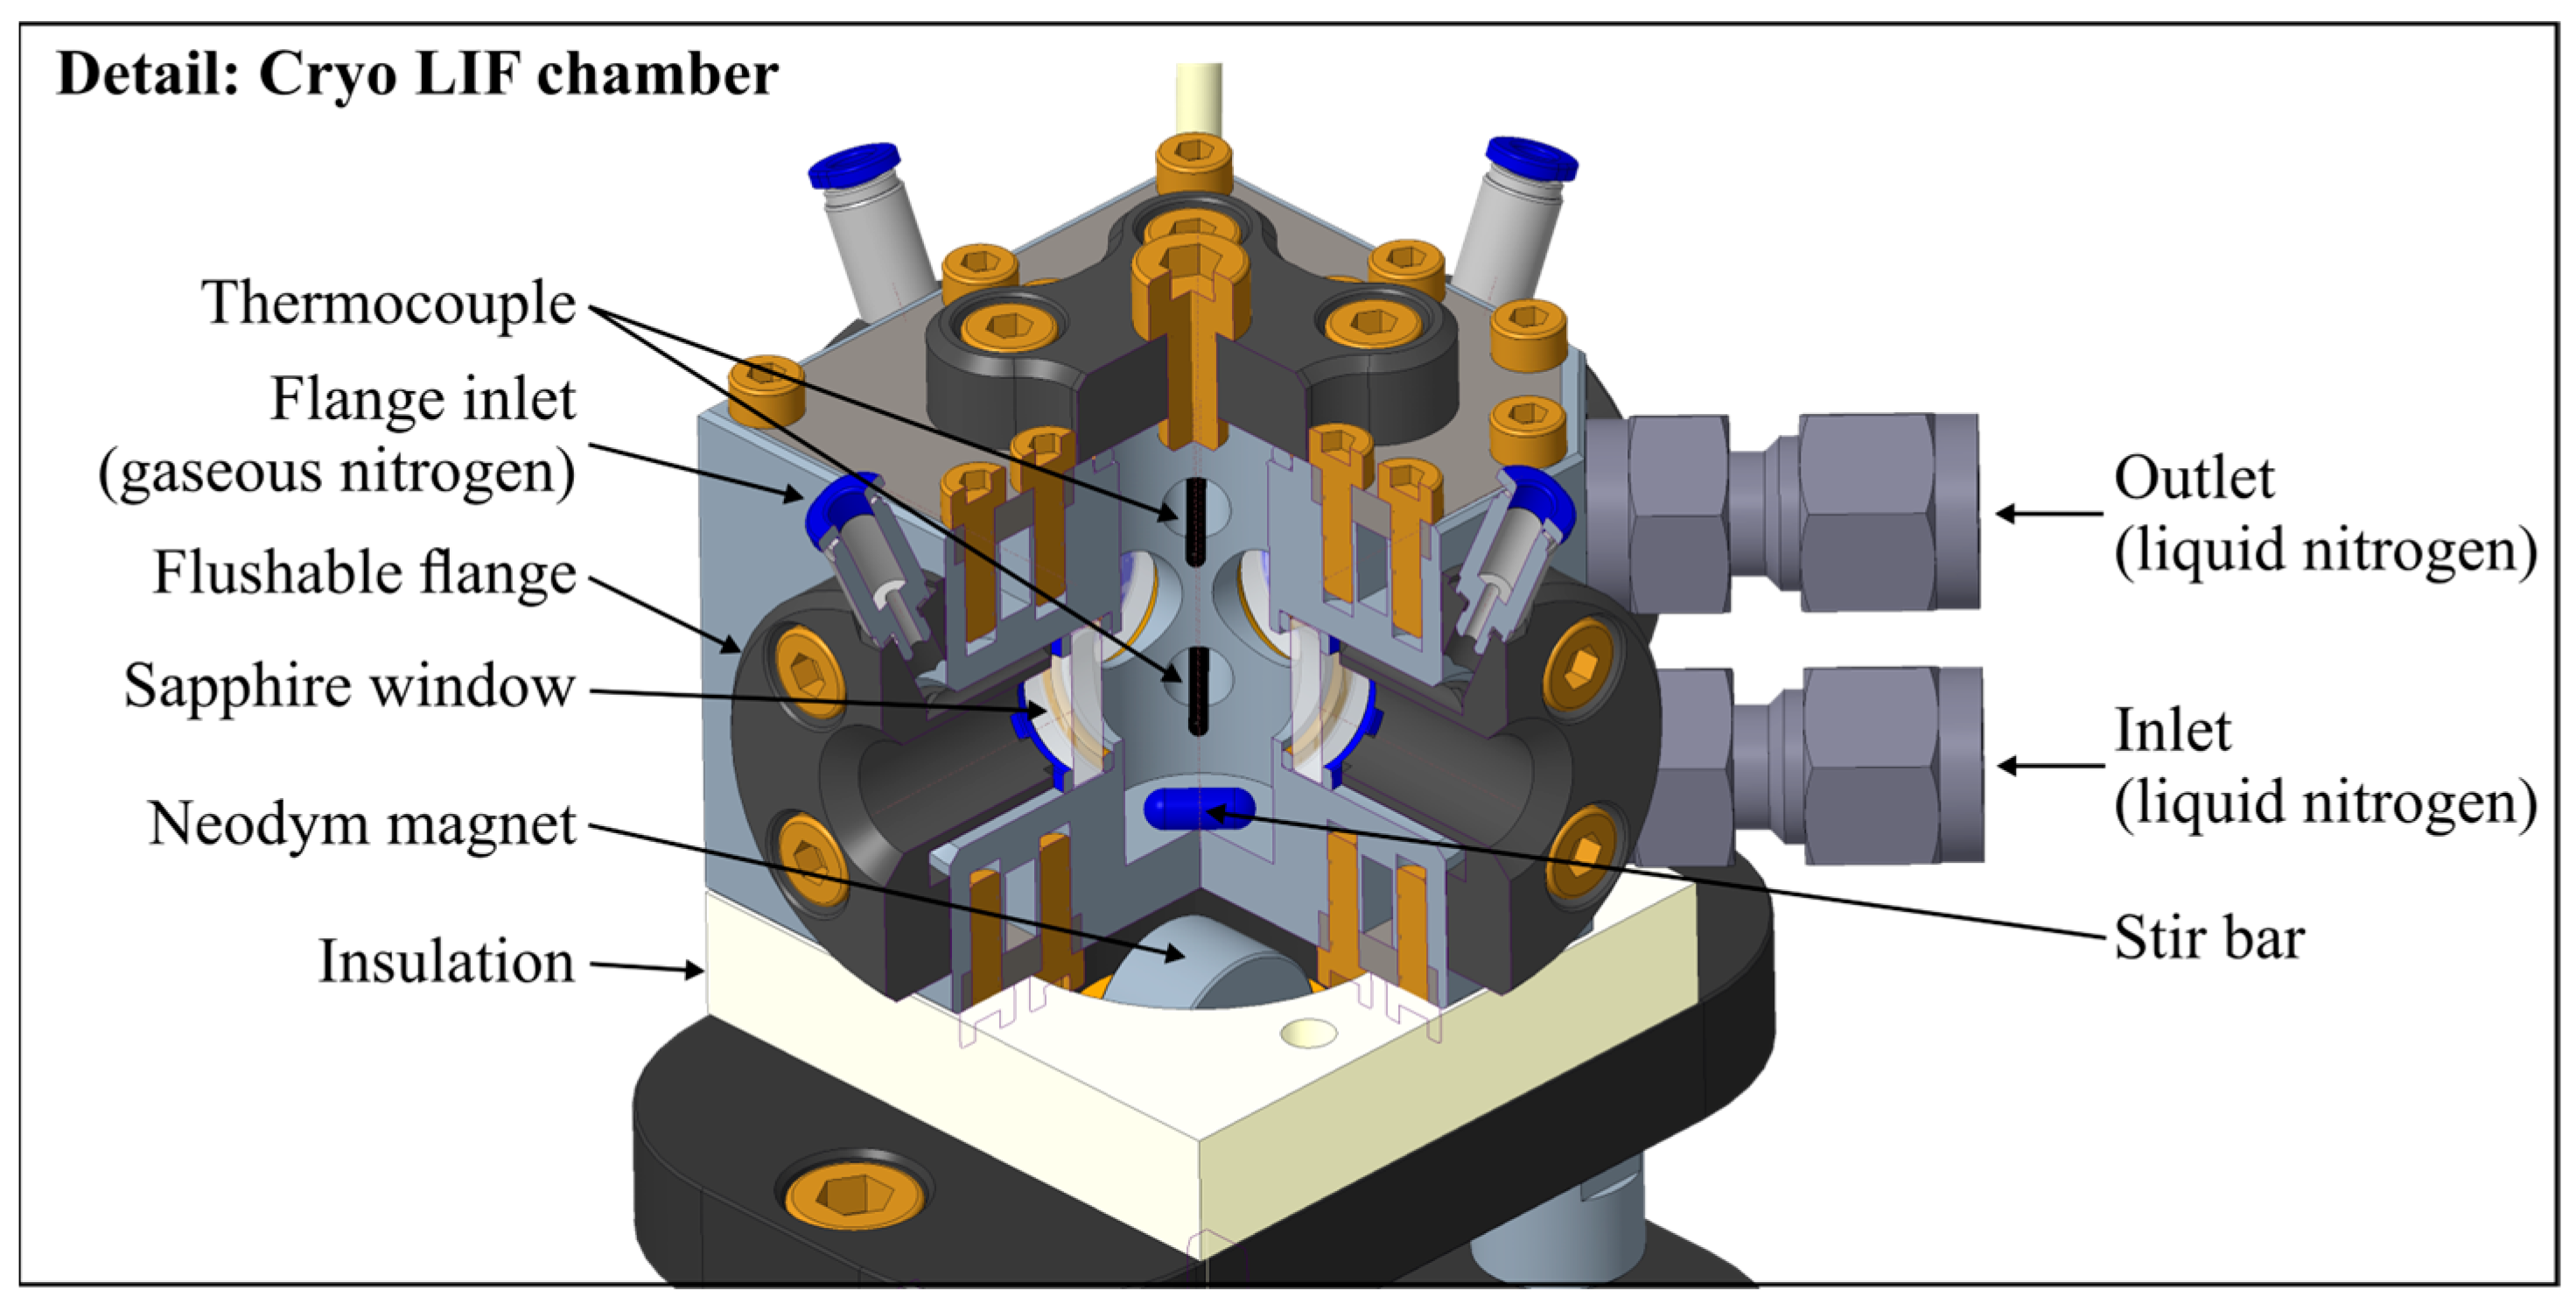
2.3. Cryo LIF Chamber
2.4. Absorption Spectroscopy Setup
3. Fuels and Tracers Used
4. Results
4.1. Concentration-Dependent Measurements
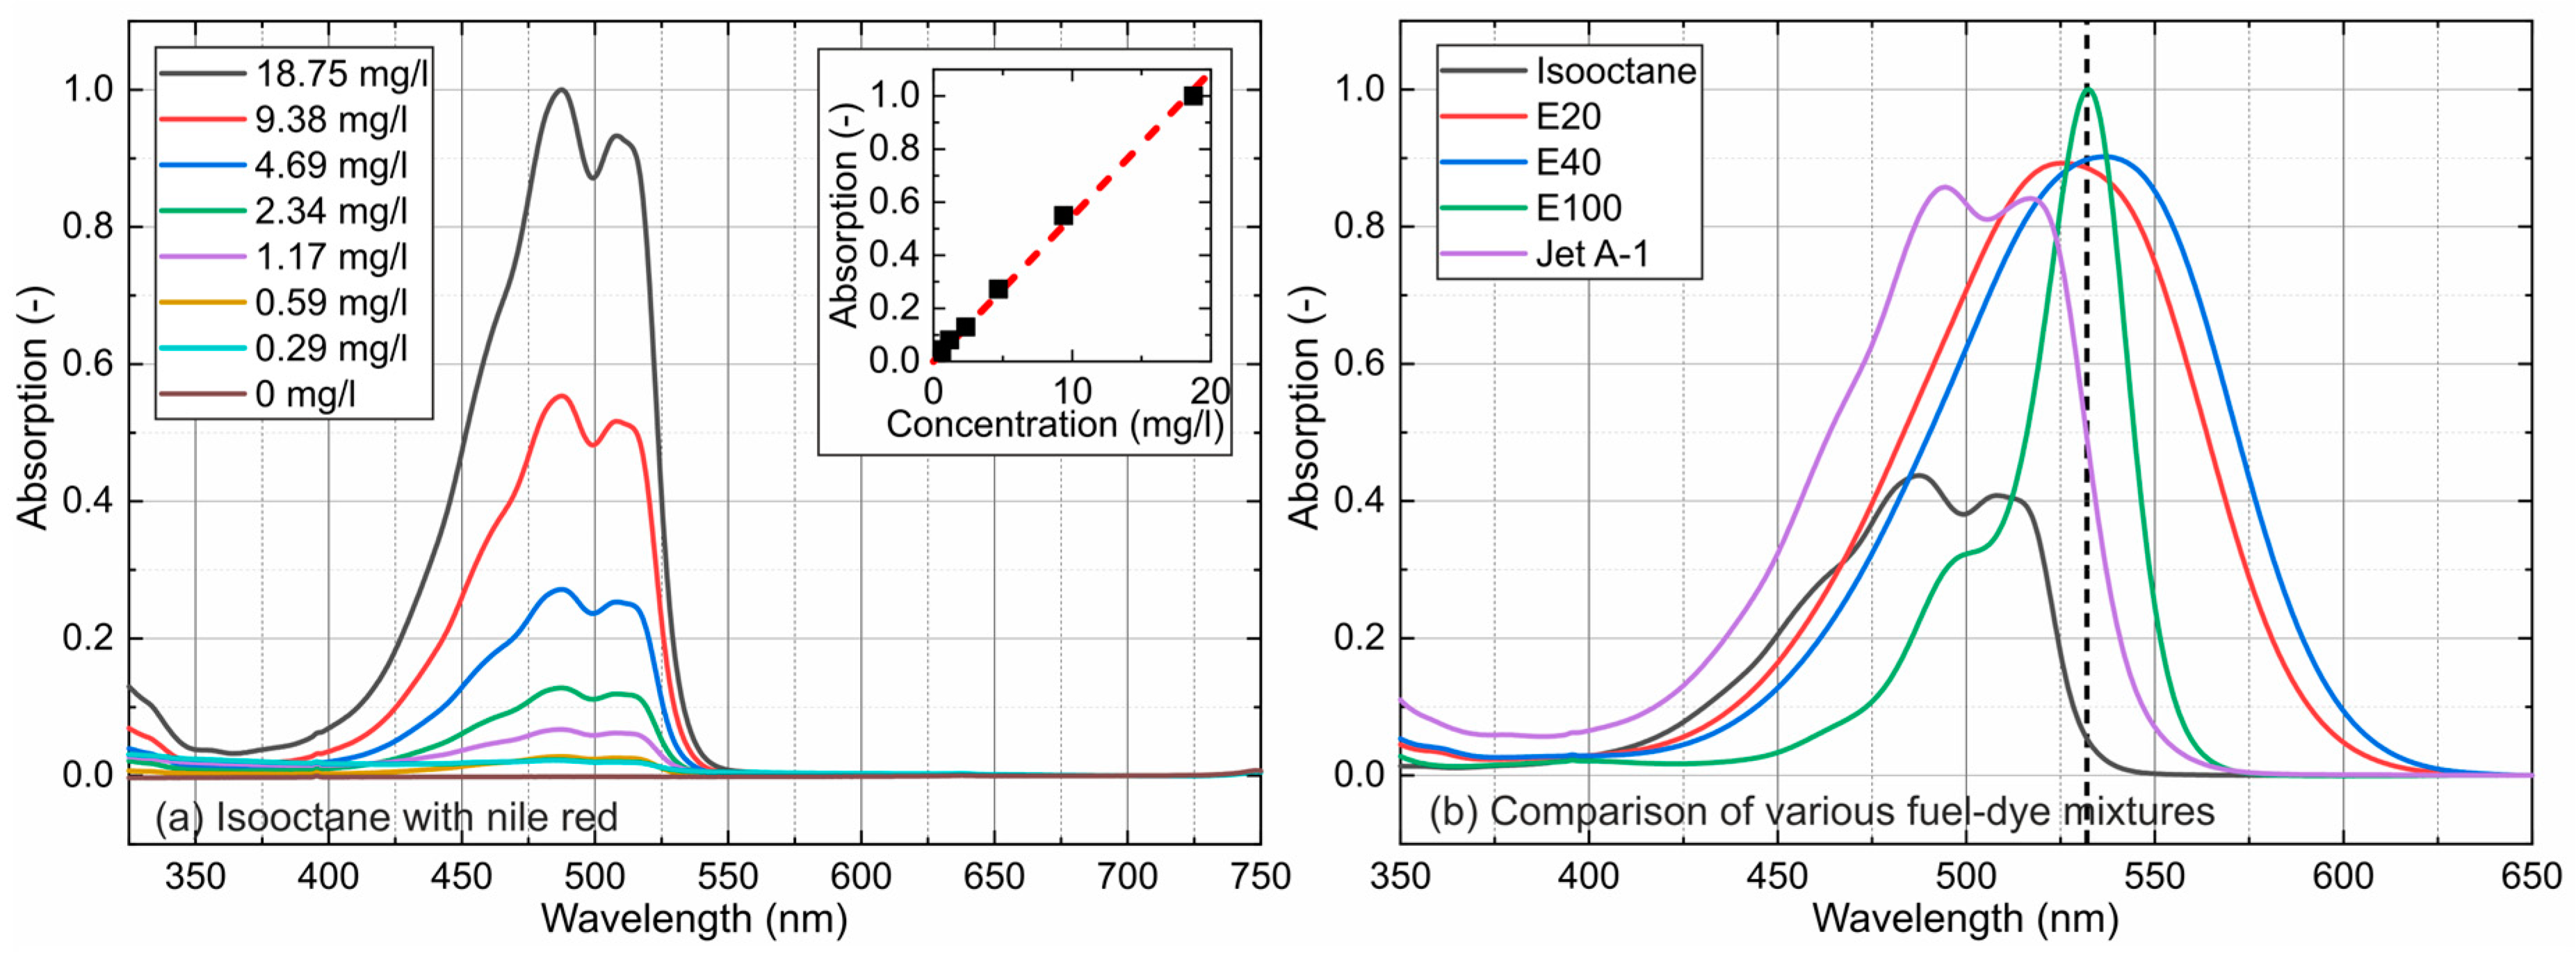
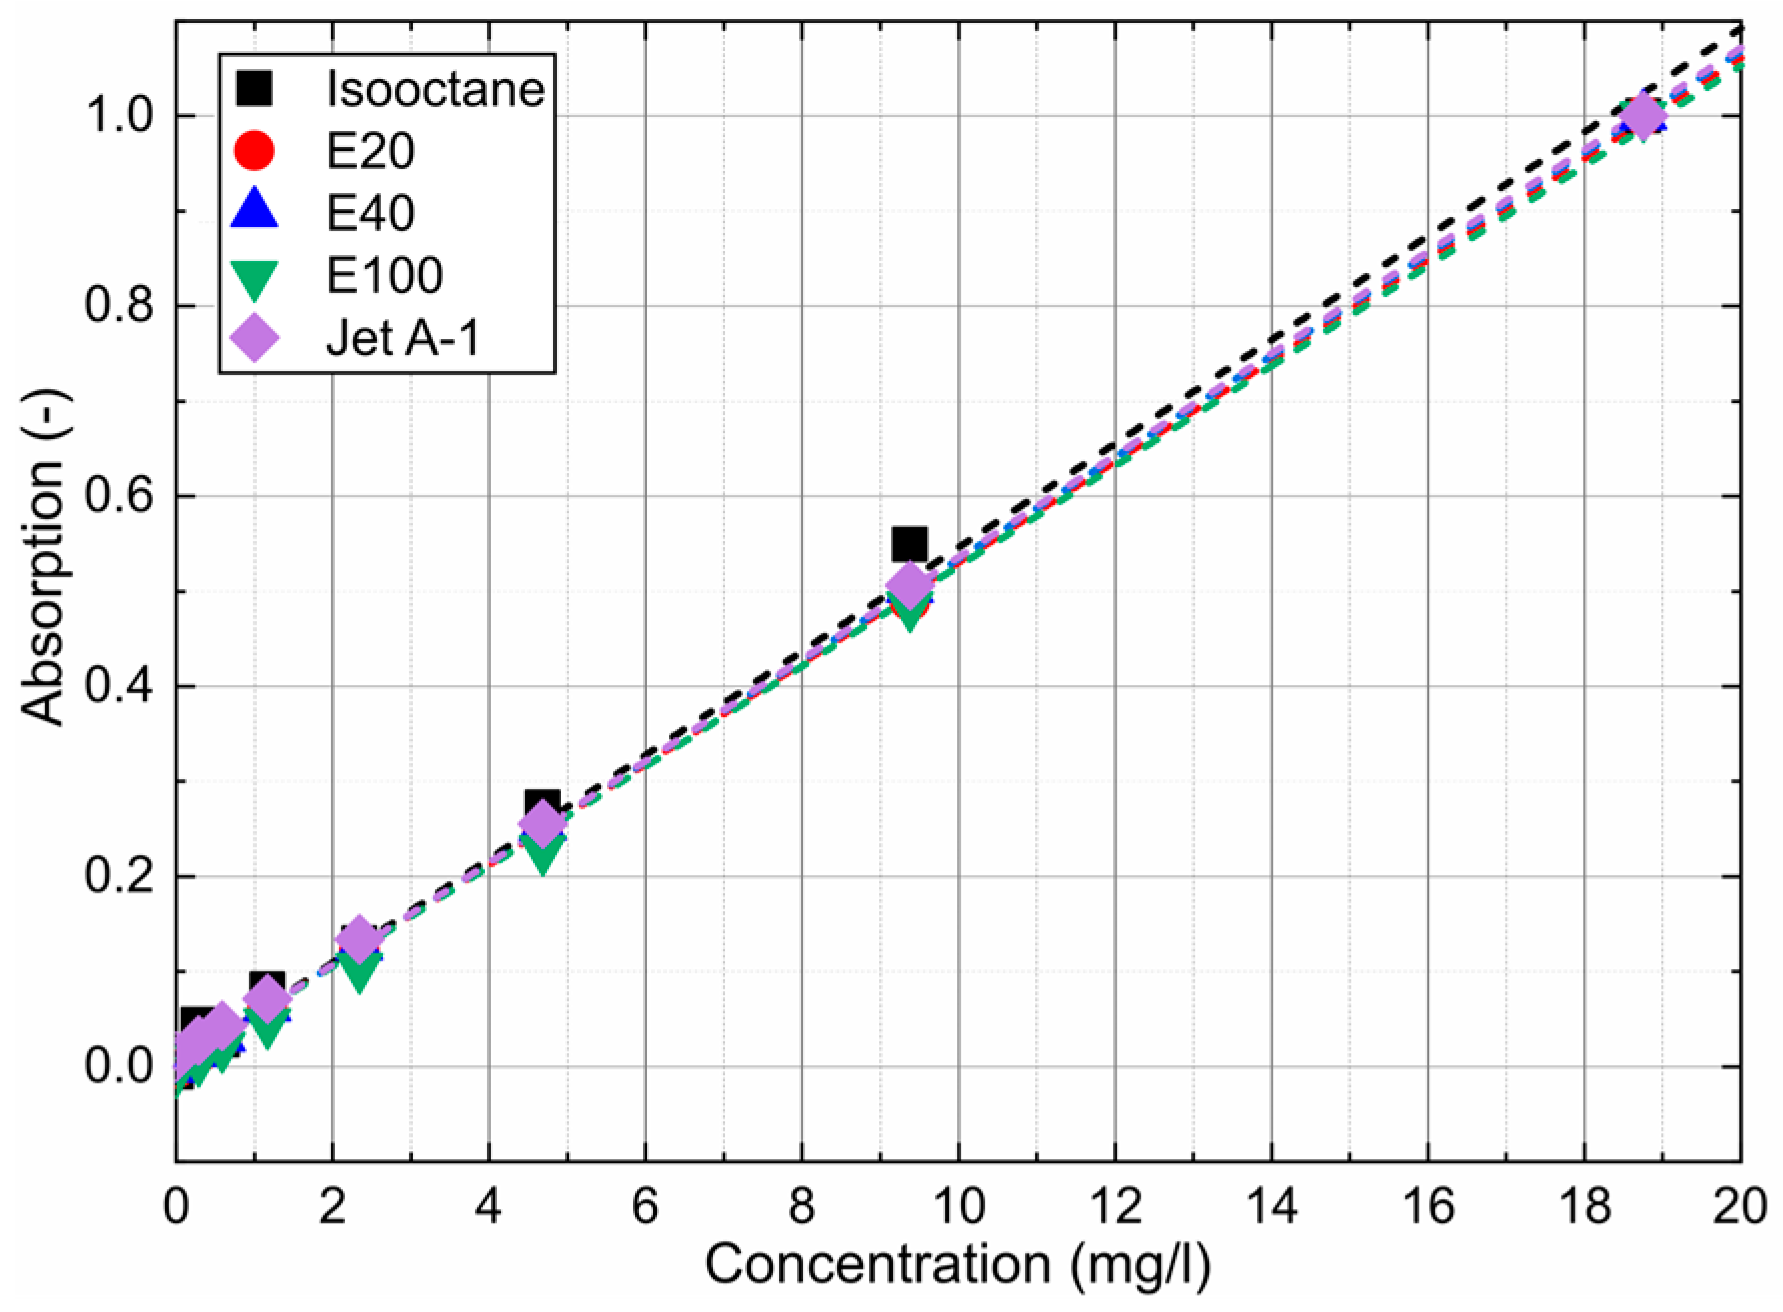
4.1.1. Absorption
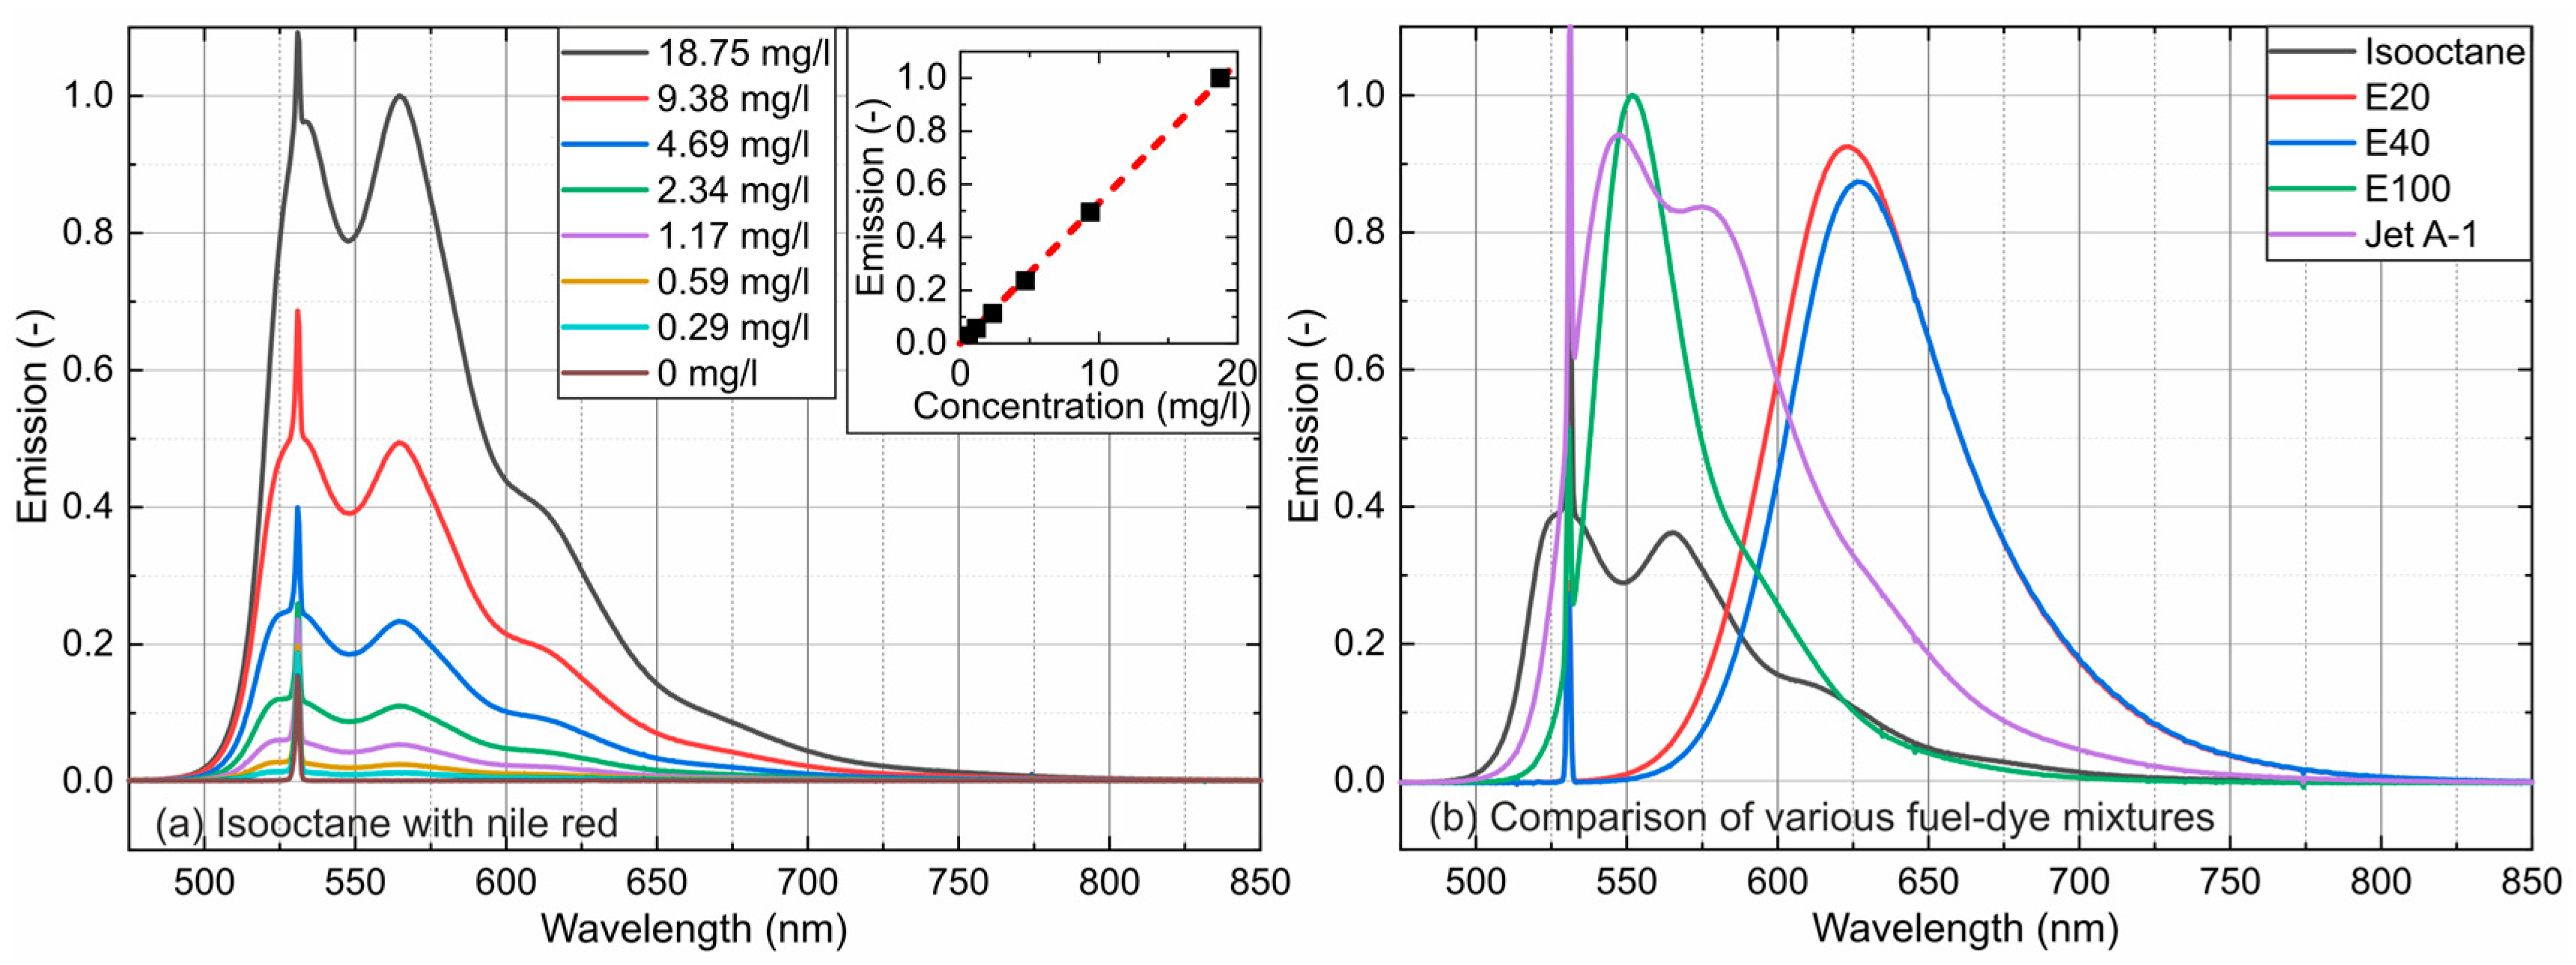
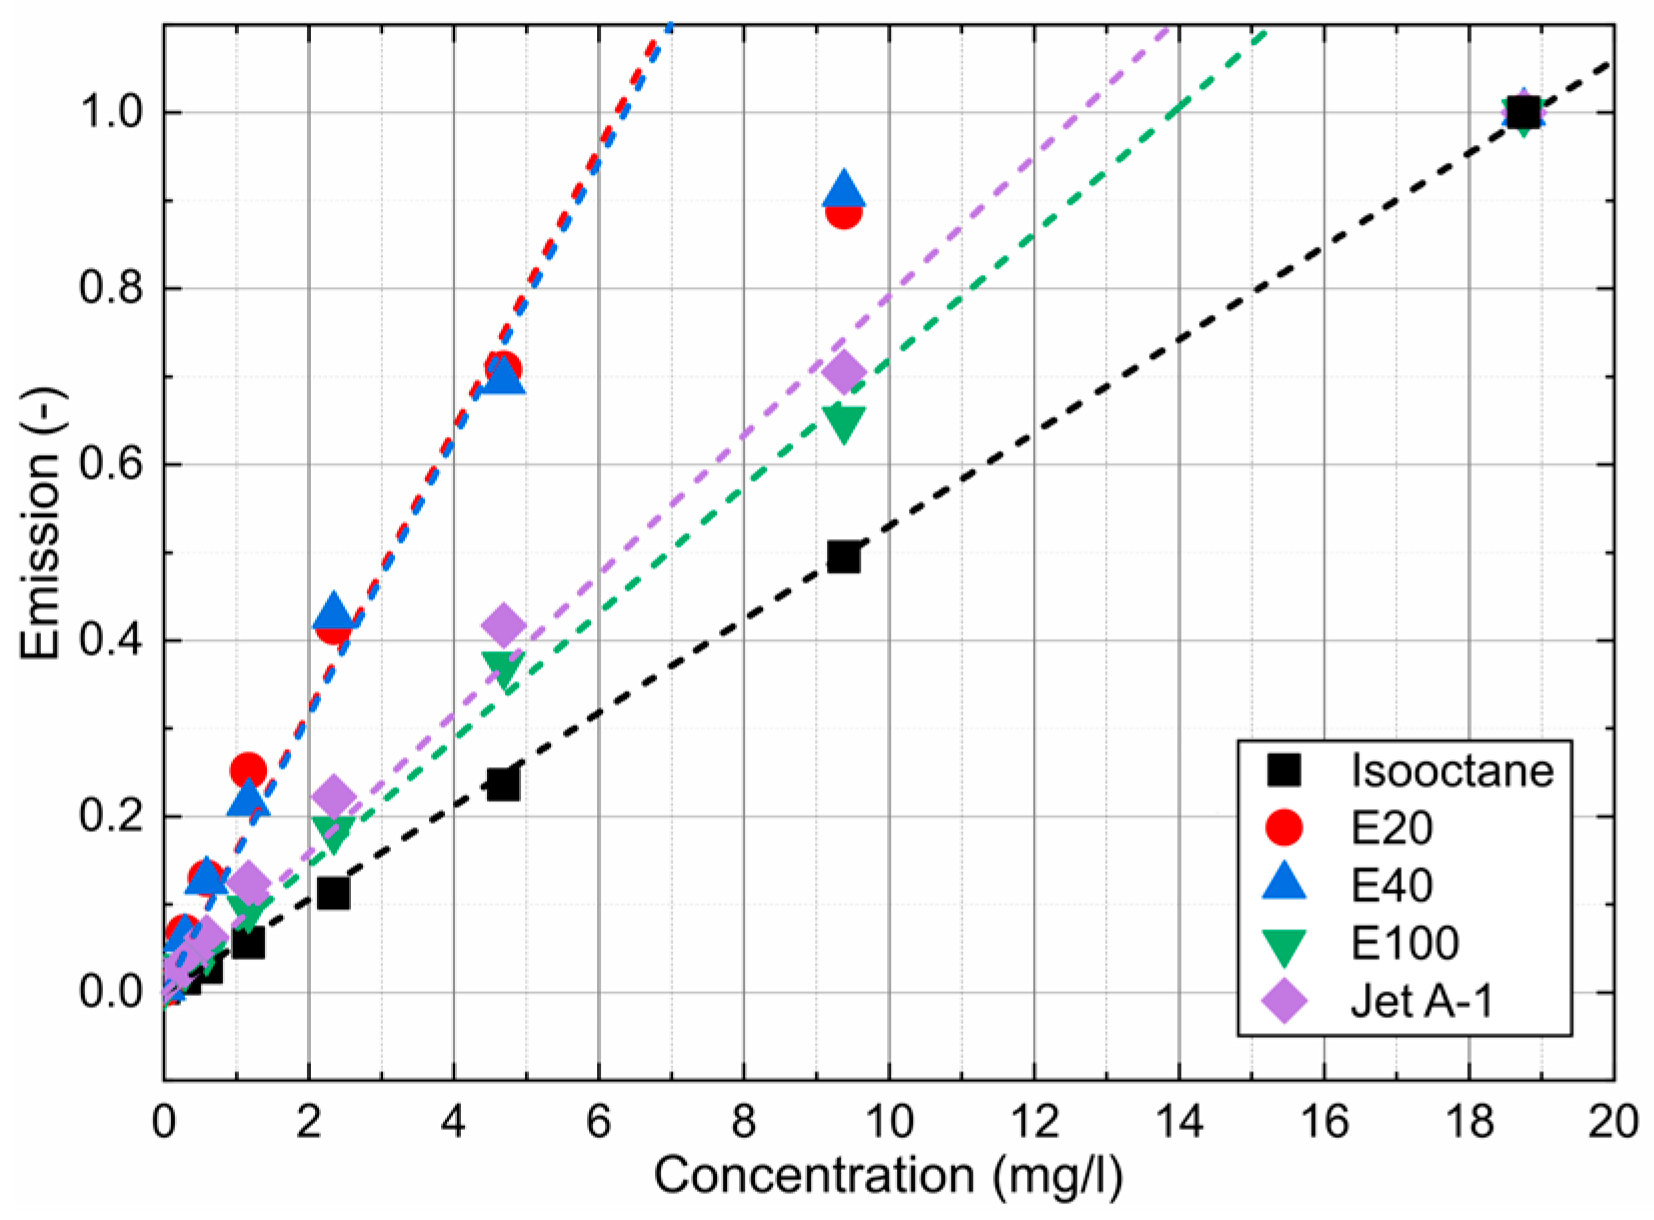
4.1.2. Emission
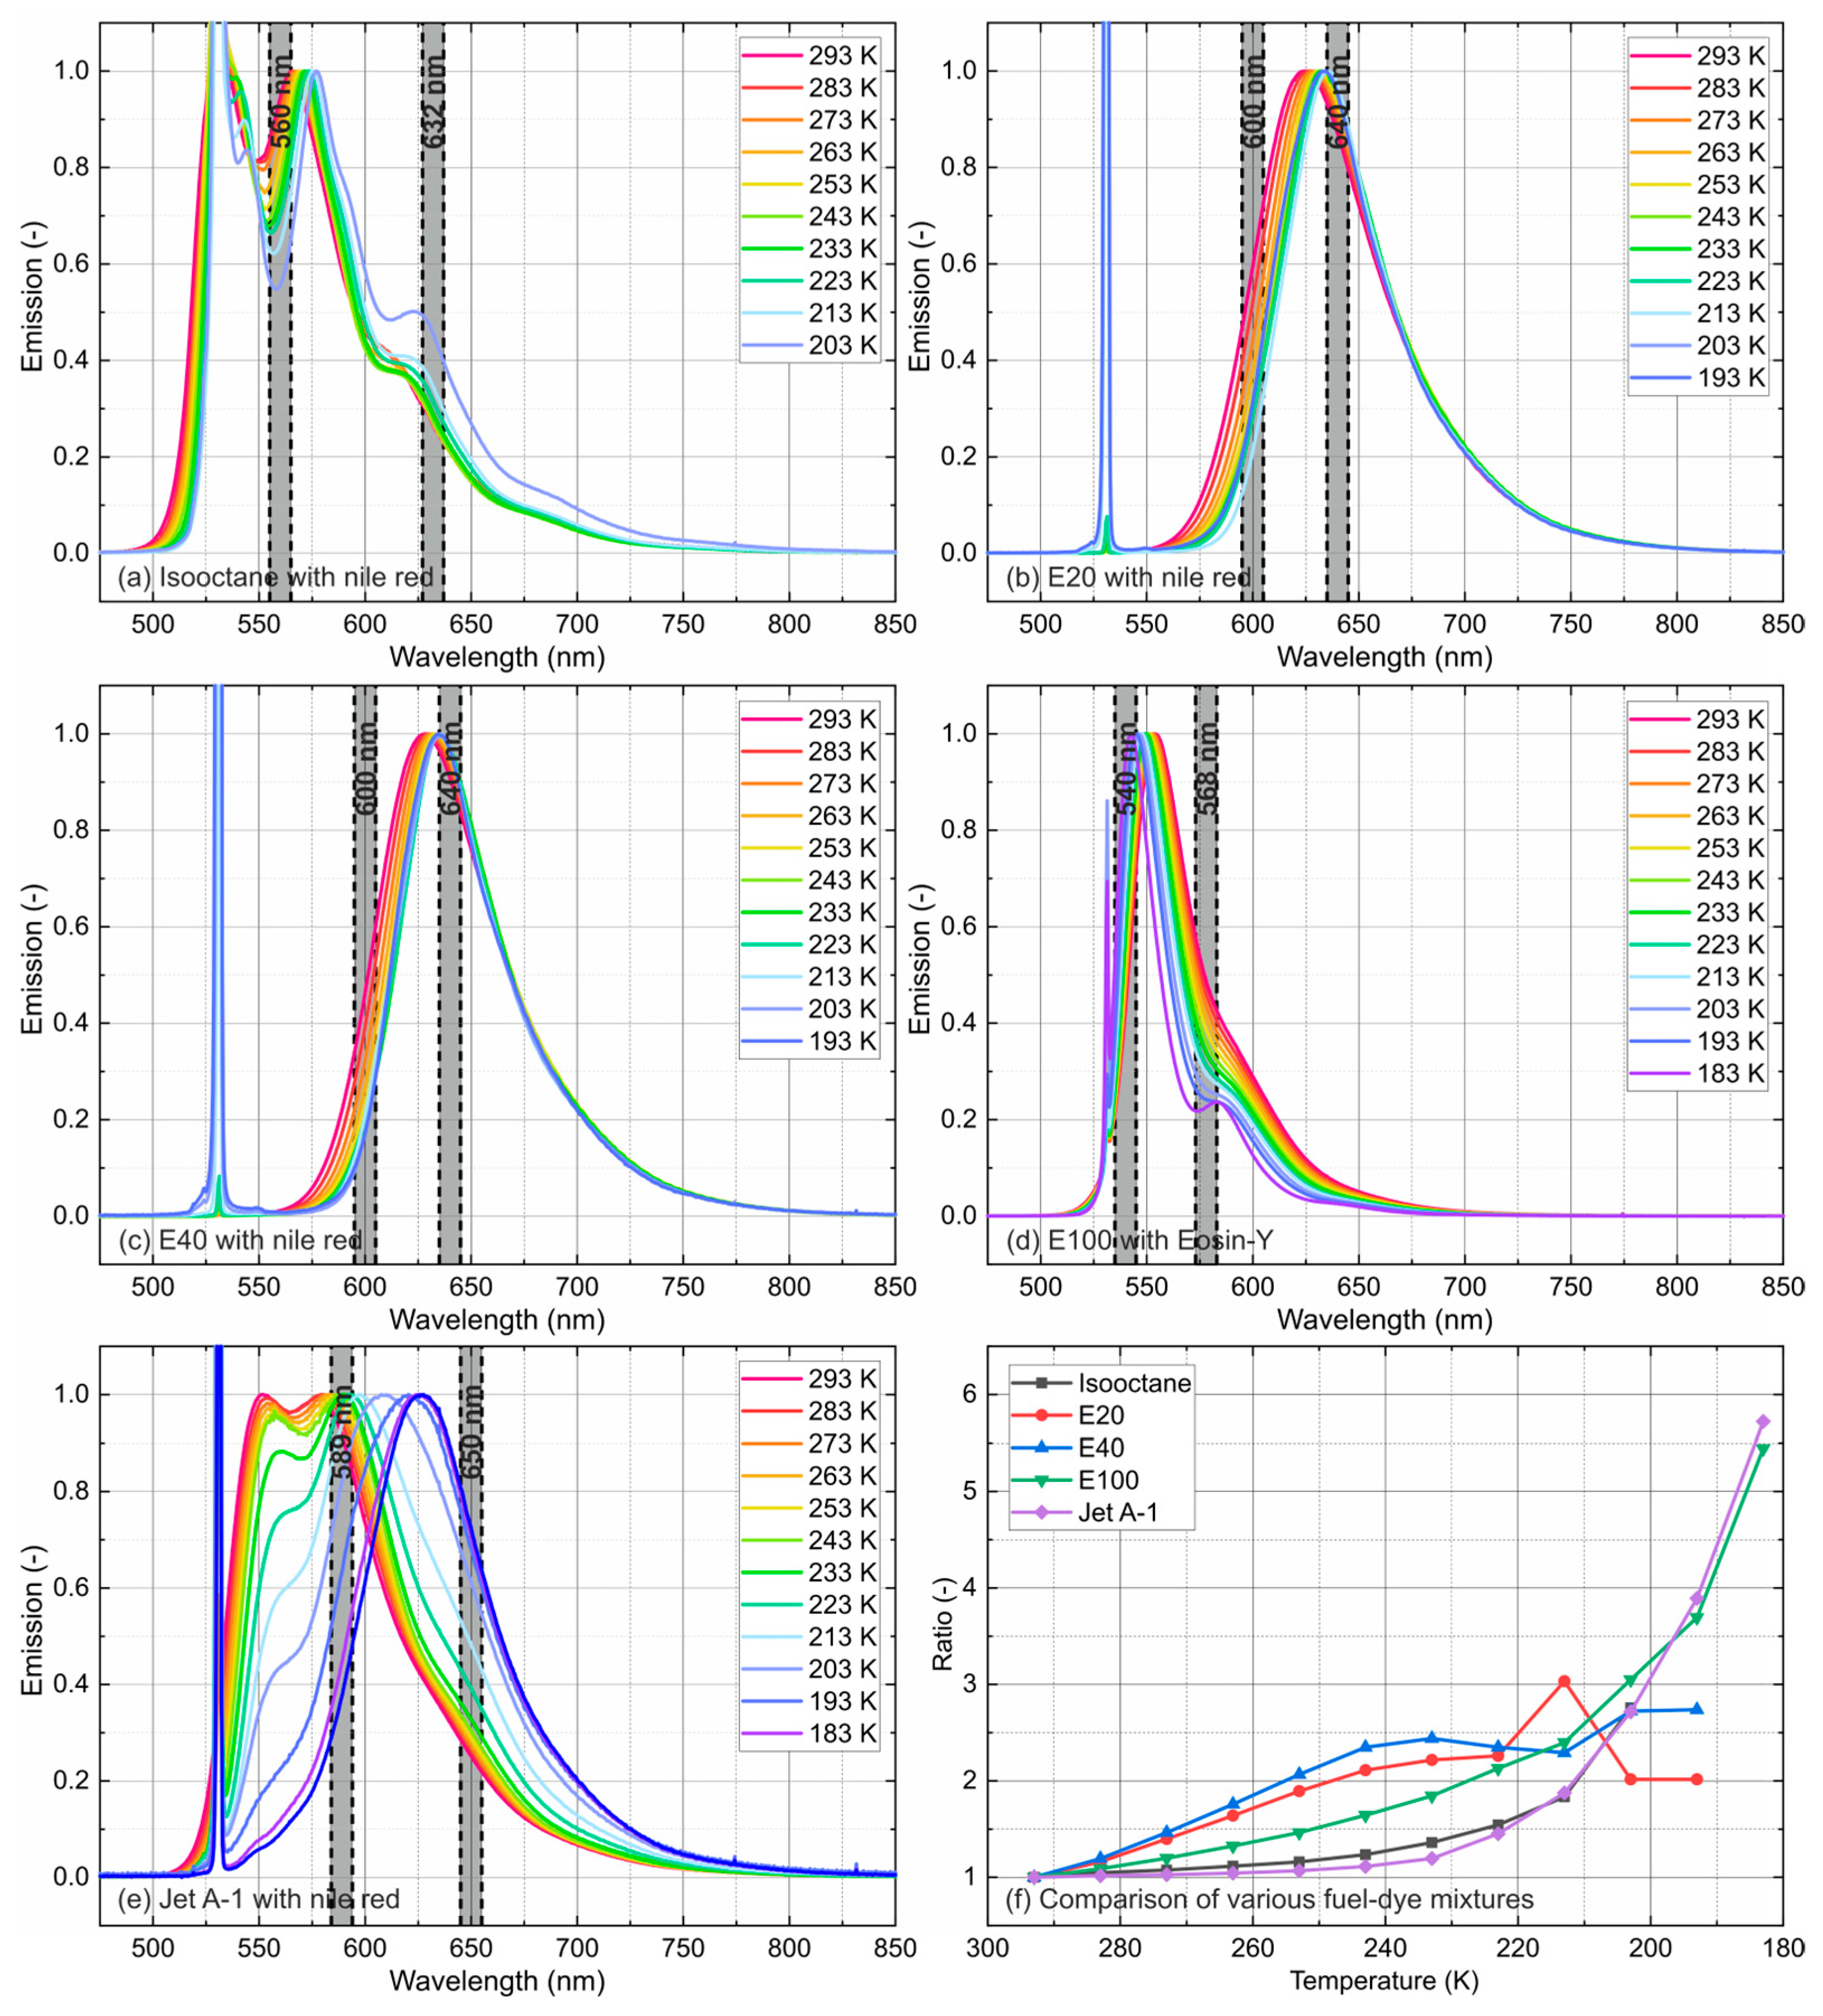
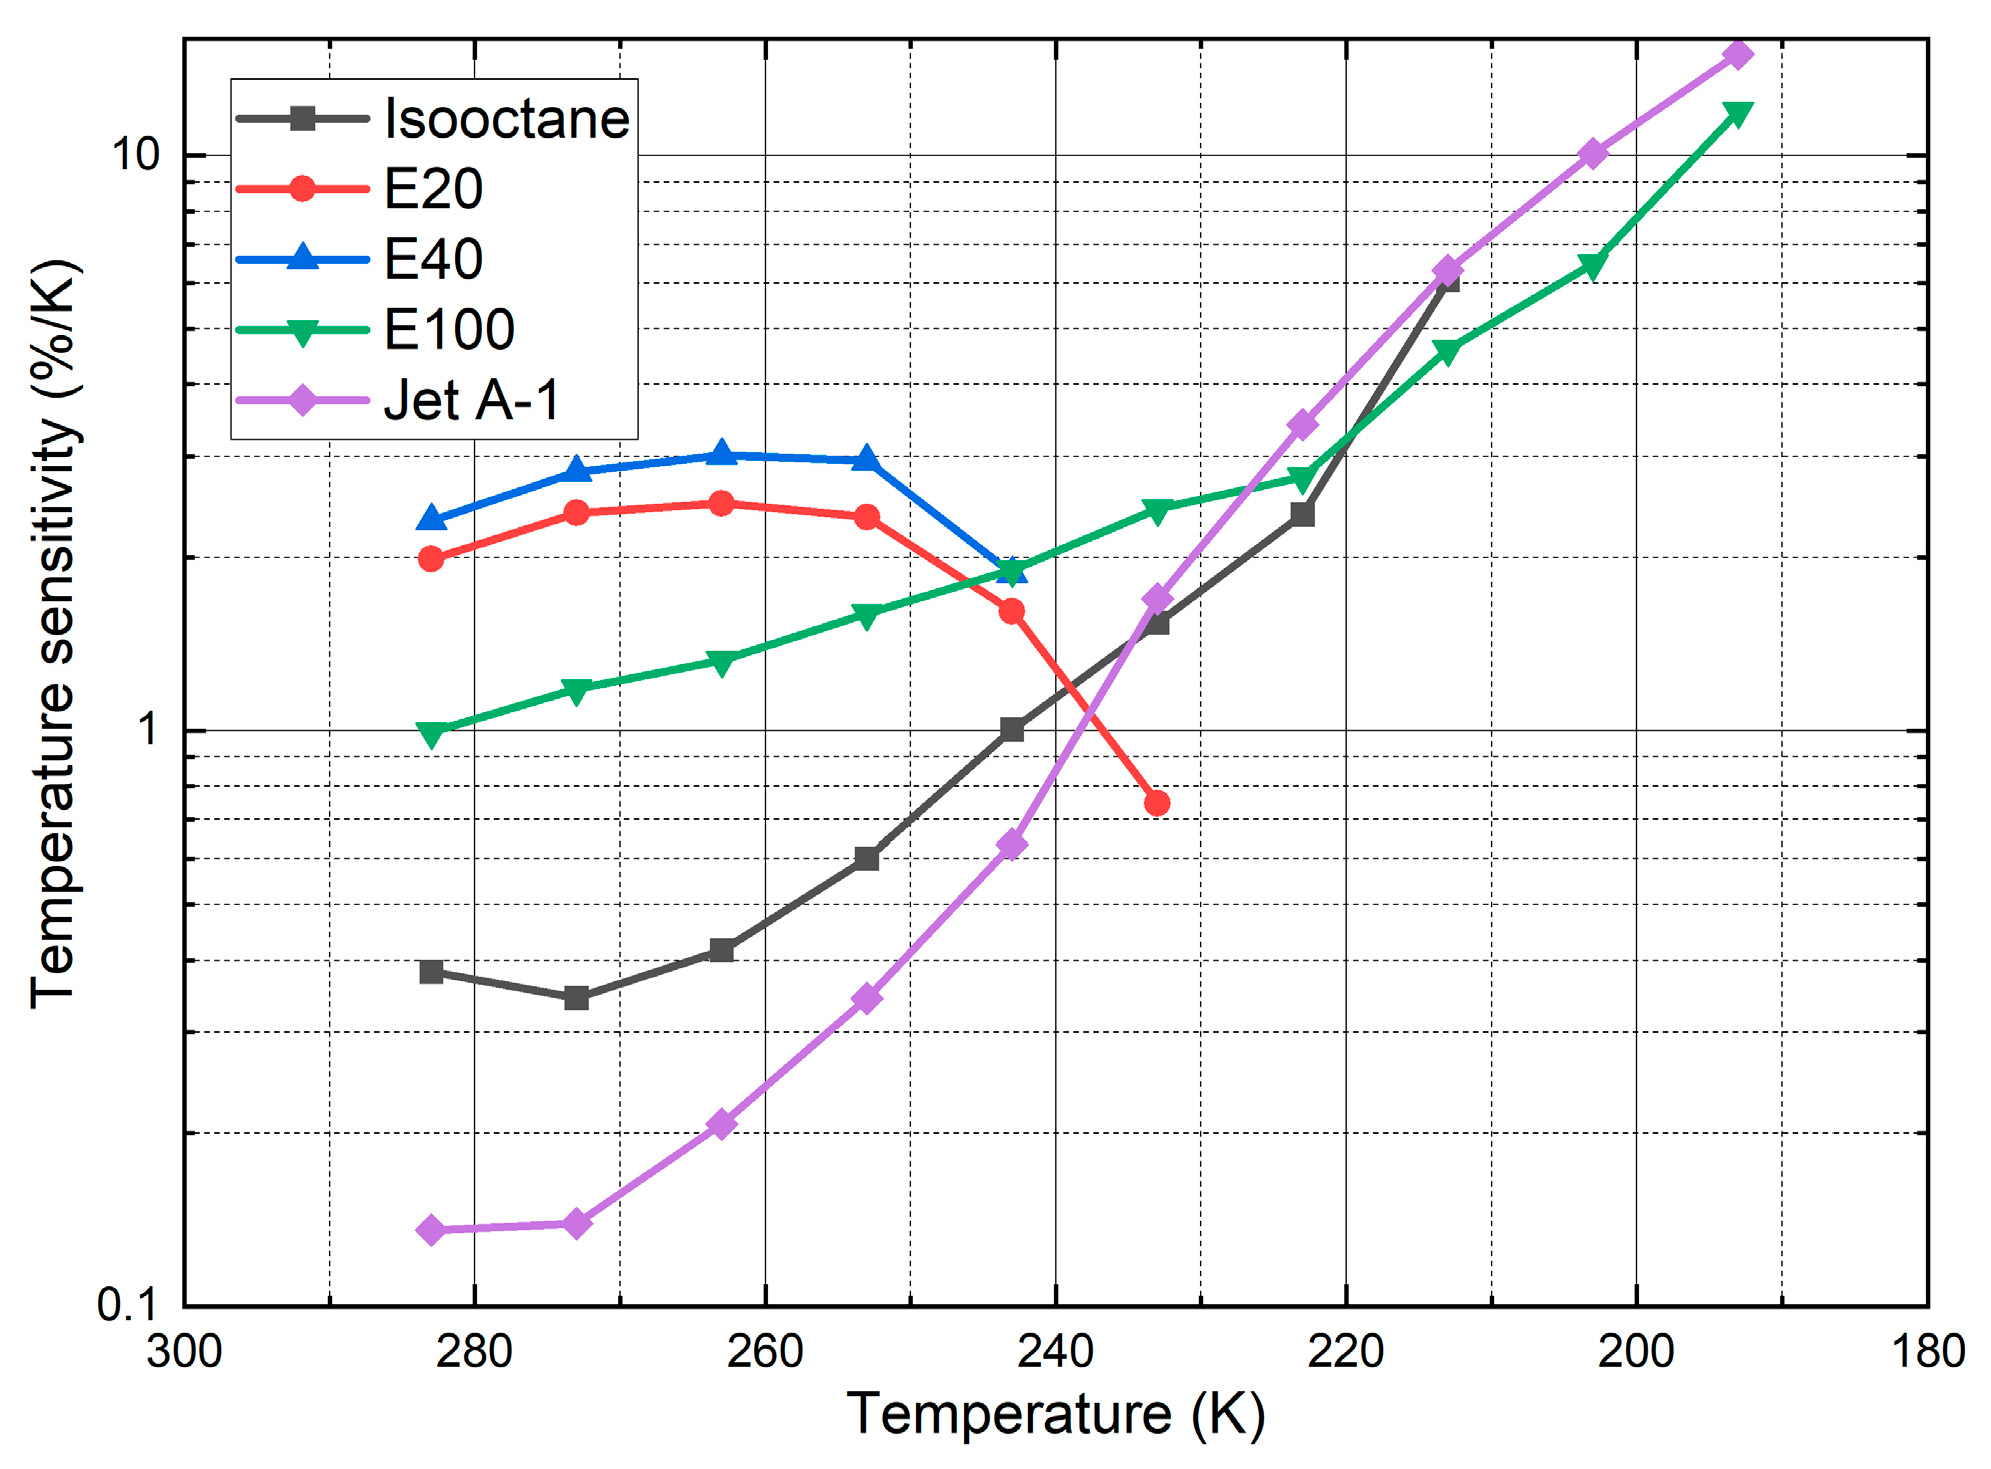
4.2. Temperature-Dependent Emission Spectra
5. Conclusions and Future Work
Author Contributions
Funding
Institutional Review Board Statement
Informed Consent Statement
Data Availability Statement
Conflicts of Interest
References
- Fdida, N.; Blaisot, J.-B.; Floch, A.; Dechaume, D. Drop-size measurement techniques applied to gasoline sprays. At. Sprays 2010, 20, 141–162. [Google Scholar] [CrossRef]
- Welss, R.; Bornschlegel, S.; Wensing, M. Characterizing Spray Propagation of GDI Injectors under Crossflow Conditions; 2018-01-1696; SAE Technical Paper: Warrendale, PA, USA, 2018. [Google Scholar]
- Massoli, P.; Beretta, F.; D’Alessio, A. Single droplet size, velocity, and optical characteristics by the polarization properties of scattered light. Appl. Opt. 1989, 28, 1200–1205. [Google Scholar] [CrossRef] [PubMed]
- Domann, R.; Hardalupas, Y. Quantitative Measurement of Planar Droplet Sauter Mean Diameter in Sprays using Planar Droplet Sizing. Part. Part. Syst. Charact. 2003, 20, 209–218. [Google Scholar] [CrossRef]
- Lemoine, F.; Castanet, G. Temperature and chemical composition of droplets by optical measurement techniques: A state-of-the-art review. Exp. Fluids 2013, 54, 1–34. [Google Scholar] [CrossRef]
- Domann, R.; Hardalupas, Y. Spatial distribution of fluorescence intensity within large droplets and its dependence on dye concentration. Appl. Opt. 2001, 40, 3586–3597. [Google Scholar] [CrossRef] [PubMed]
- Frackowiak, B.; Tropea, C. Numerical analysis of diameter influence on droplet fluorescence. Appl. Opt. 2010, 49, 2363–2370. [Google Scholar] [CrossRef] [PubMed]
- Maligne, D.; Bruneaux, G. Time-Resolved Fuel Film Thickness Measurement for Direct Injection SI Engines Using Refractive Index Matching. In Proceedings of the SAE 2011 World Congress and Exhibition, Detroit, MI, USA, 12–14 April 2011. [Google Scholar]
- Drake, M.C.; Fansler, T.D.; Solomon, A.S.; Szekely, G.A. Piston Fuel Films as a Source of Smoke and Hydrocarbon Emissions from a Wall-Controlled Spark-Ignited Direct-Injection Engine; 2003-01-0547; SAE Technical Paper: Warrendale, PA, USA, 2003. [Google Scholar]
- Fansler, T.D.; Parrish, S.E. Spray measurement technology: A review. Meas. Sci. Technol. 2015, 26, 012002. [Google Scholar] [CrossRef]
- Sick, V.; Stojkovic, B.D. Evolution and impingement of an automotive fuel spray investigated with simultaneous Mie/LIF techniques. Appl. Phys. B 2001, 73, 75–83. [Google Scholar]
- Cho, H.; Min, K. Measurement of liquid fuel film distribution on the cylinder liner of a spark ignition engine using the laser-induced fluorescence technique. Meas. Sci. Technol. 2003, 14, 975. [Google Scholar] [CrossRef]
- Alonso, M.; Kay, P.J.; Bowen, P.J.; Gilchrist, R.; Sapsford, S. A laser induced fluorescence technique for quantifying transient liquid fuel films utilising total internal reflection. Exp. Fluids 2010, 48, 133–142. [Google Scholar] [CrossRef]
- Yang, J.; Melton, L.A. Fluorescence-Based Method Designed for Quantitative Measurement of Fuel Film Thickness during Cold-Start of Engines. Appl. Spectrosc. 2000, 54, 565–574. [Google Scholar] [CrossRef]
- Spathopoulou, M.; Gavaises, M.; Theodorakakos, A.; Yanagihara, H. Formation and development of wall liquid films during impaction of gasoline fuel sprays. At. Sprays 2009, 19, 701–726. [Google Scholar] [CrossRef]
- Huang, C.-Y.; Murthy, T.G.; Chandrasekar, S. Simultaneous Measurements of Thickness and Temperature Profile of the Lubricant Film at Chip-tool Interface during Machining Process Using Luminescent Sensors. Procedia Eng. 2014, 79, 9–16. [Google Scholar] [CrossRef]
- Yang, H.; Wei, W.; Su, M.; Chen, J.; Cai, X. Measurement of liquid water film thickness on opaque surface with diode laser absorption spectroscopy. Flow Meas. Instrum. 2018, 60, 110–114. [Google Scholar] [CrossRef]
- Pan, R.; Jeffries, J.; Dreier, T.; Schulz, C. Measurements of liquid film thickness, concentration, and temperature of aqueous urea solution by NIR absorption spectroscopy. Appl. Phys. B 2016, 122, 1–10. [Google Scholar] [CrossRef]
- Wu, W.; Kong, S.; Xu, X.; Tao, J.; Li, C.; Wang, J.; Su, M.; Yang, H. Simultaneous measurement of liquid film thickness and temperature on metal surface. Spectrochim. Acta Part A Mol. Biomol. Spectrosc. 2021, 257, 119804. [Google Scholar] [CrossRef] [PubMed]
- Mouza, A.; Vlachos, N.A.; Paras, S.; Karabelas, A. Measurement of liquid film thickness using a laser light absorption method. Exp. Fluids 2000, 28, 355–359. [Google Scholar] [CrossRef]
- Mishra, Y.N.; Koegl, M.; Baderschneider, K.; Hofbeck, B.; Berrocal, E.; Conrad, C.; Will, S.; Zigan, L. 3D mapping of droplet Sauter mean diameter in sprays. Appl. Opt. 2019, 58, 3775–3783. [Google Scholar] [CrossRef]
- Park, S.; Cho, H.; Yoon, I.; Min, K. Measurement of droplet size distribution of gasoline direct injection spray by droplet generator and planar image technique. Meas. Sci. Technol. 2002, 13, 859–864. [Google Scholar] [CrossRef]
- Bollmann, J.; Hickl, F.; Preuster, P.; Zigan, L.; Wasserscheid, P.; Will, S. Phosphor thermometry in heat transfer fluids and liquid organic hydrogen carrier systems using (Sr,Ca)SiAlN3:Eu2+. Meas. Sci. Technol. 2023, 34, 035206. [Google Scholar] [CrossRef]
- Ahmadinouri, F.; Parvin, P.; Rabbani, A.R. Assessment of asphaltene and resin fractions in crude oil using laser-induced fluorescence spectroscopy based on modified Beer-Lambert (LIFS-MBL). Spectrochim. Acta Part A Mol. Biomol. Spectrosc. 2024, 304, 123314. [Google Scholar] [CrossRef]
- Brübach, J.; Patt, A.; Dreizler, A. Spray thermometry using thermographic phosphors. Appl. Phys. B 2006, 83, 499–502. [Google Scholar] [CrossRef]
- Mishra, Y.N.; Yoganantham, A.; Koegl, M.; Zigan, L. Investigation of Five Organic Dyes in Ethanol and Butanol for Two-Color Laser-Induced Fluorescence Ratio Thermometry. Optics 2020, 1, 1–17. [Google Scholar] [CrossRef]
- Prenting, M.; Dzulfida, M.; Dreier, T.; Schulz, C. Characterization of tracers for two-color laser-induced fluorescence liquid-phase temperature imaging in sprays. Exp. Fluids 2020, 61, 1–15. [Google Scholar] [CrossRef]
- Koegl, M.; Mull, C.; Baderschneider, K.; Wislicenus, J.; Will, S.; Zigan, L. Characterization of Nile Red as a Tracer for Laser-Induced Fluorescence Spectroscopy of Gasoline and Kerosene and Their Mixture with Biofuels. Sensors 2019, 19, 2822. [Google Scholar] [CrossRef] [PubMed]
- Durst, A.; Wensing, M.; Berrocal, E. Light sheet fluorescence microscopic imaging for the primary breakup of diesel and gasoline sprays with real-world fuels. Appl. Opt. 2018, 57, 2704–2714. [Google Scholar] [CrossRef] [PubMed]
- Lavieille, P.; Lemoine, F.; Lavergne, G.; Lebouché, M. Evaporating and combusting droplet temperature measurements using two-color laser-induced fluorescence. Exp. Fluids 2001, 31, 45–55. [Google Scholar] [CrossRef]
- Castanet, G.; Liénart, T.; Lemoine, F. Dynamics and temperature of droplets impacting onto a heated wall. Int. J. Heat Mass Transf. 2009, 52, 670–679. [Google Scholar] [CrossRef]
- Labergue, A.; Deprédurand, V.; Delconte, A.; Castanet, G.; Lemoine, F. New insight into two-color LIF thermometry applied to temperature measurements of droplets. Exp. Fluids 2010, 49, 547–556. [Google Scholar] [CrossRef]
- Vetrano, M.R.; Simonini, A.; Steelant, J.; Rambaud, P. Thermal characterization of a flashing jet by planar laser-induced fluorescence. Exp. Fluids 2013, 54, 1573. [Google Scholar] [CrossRef]
- Zhou, J.; Yang, W.; Yin, Y.; Chen, S.; Yan, B.; Mu, J.; Qi, X. Nonlinear temperature calibration equation for Rhodamine B in different solutions for wide-temperature-range applications. Appl. Opt. 2019, 58, 1514–1518. [Google Scholar] [CrossRef] [PubMed]
- Estrada-Pérez, C.; Hassan, Y.; Tan, S. Experimental characterization of temperature sensitive dyes for laser induced fluorescence thermometry. Rev. Sci. Instrum. 2011, 82, 074901. [Google Scholar] [CrossRef] [PubMed]
- Chaze, W.; Caballina, O.; Castanet, G.; Lemoine, F. Spatially and temporally resolved measurements of the temperature inside droplets impinging on a hot solid surface. Exp. Fluids 2017, 58, 96. [Google Scholar] [CrossRef]
- Castanet, G.; Chaze, W.; Caballina, O.; Collignon, R.; Lemoine, F. Transient evolution of the heat transfer and the vapor film thickness at the drop impact in the regime of film boiling. Phys. Fluids 2018, 30, 122109. [Google Scholar] [CrossRef]
- Perrin, L.; Castanet, G.; Lemoine, F. Characterization of the evaporation of interacting droplets using combined optical techniques. Exp. Fluids 2015, 56, 1–16. [Google Scholar] [CrossRef]
- Palmer, J.; Reddemann, M.A.; Kirsch, V.; Kneer, R. Temperature measurements of micro-droplets using pulsed 2-color laser-induced fluorescence with MDR-enhanced energy transfer. Exp. Fluids 2016, 57, 177. [Google Scholar] [CrossRef]
- Wolff, M.; Delconte, A.; Schmidt, F.; Gucher, P.; Lemoine, F. High-pressure Diesel spray temperature measurements using two-colour laser-induced fluorescence. Meas. Sci. Technol. 2007, 18, 697–706. [Google Scholar] [CrossRef]
- Depredurand, V.; Miron, P.; Labergue, A.; Wolff, M.; Castanet, G.; Lemoine, F. A temperature-sensitive tracer suitable for two-colour laser-induced fluorescence thermometry applied to evaporating fuel droplets. Meas. Sci. Technol. 2008, 19, 105403. [Google Scholar] [CrossRef]
- Deprédurand, V.; Delconte, A.; Lemoine, F. Combined PDA and LIF applied to size–temperature correlations measurements in a heated spray. Exp. Fluids 2011, 50, 561–571. [Google Scholar] [CrossRef]
- Koegl, M.; Pahlevani, M.; Zigan, L. A Novel Approach for Measurement of Composition and Temperature of N-Decane/Butanol Blends Using Two-Color Laser-Induced Fluorescence of Nile Red. Sensors 2020, 20, 5721. [Google Scholar] [CrossRef]
- Koegl, M.; Dai, H.; Baderschneider, K.; Ulrich, H.; Zigan, L. Polarization-dependent LIF/Mie ratio for sizing of micrometric ethanol droplets doped with Nile red. Appl. Opt. 2022, 61, 4204–4214. [Google Scholar] [CrossRef]
- Park, S.; Ghandhi, J.B. Fuel Film Temperature and Thickness Measurements on the Piston Crown of a Direct-Injection Spark-Ignition Engine; SAE Technical Paper: Warrendale, PA, USA, 2005. [Google Scholar]
- Schulz, C.; Sick, V. Tracer-LIF Diagnostics: Quantitative Measurement of Fuel Concentration, Temperature and Fuel/Air Ratio in Practical Combustion Systems. Prog. Energy Combust. Sci. 2005, 31, 75–121. [Google Scholar] [CrossRef]
- Luong, M.; Koban, W.; Schulz, C. Novel strategies for imaging temperature distribution using Toluene LIF. J. Phys. Conf. Ser. 2006, 45, 133. [Google Scholar] [CrossRef]
- Retzer, U.; Fink, W.; Will, T.; Will, S.; Zigan, L. Fluorescence characteristics of the fuel tracer 1-methylnaphthalene for the investigation of equivalence ratio and temperature in an oxygen-containing environment. Appl. Phys. B 2019, 125, 124. [Google Scholar] [CrossRef]
- Löffler, M.; Beyrau, F.; Leipertz, A. Acetone Laser-Induced Fluorescence Behavior for the Simultaneous Quantification of Temperature and Residual Gas Distribution in Fired Spark-Ignition Engines. Appl. Opt. 2010, 49, 37–49. [Google Scholar] [CrossRef] [PubMed]
- Koegl, M.; Delwig, M.; Zigan, L. Characterization of Fluorescence Tracers for Thermometry and Film Thickness Measurements in Liquid Coolants Relevant for Thermal Management of Electric and Electronic Components. Sensors 2022, 22, 8892. [Google Scholar] [CrossRef]
- Taniguchi, M.; Lindsey, J.S. Database of Absorption and Fluorescence Spectra of >300 Common Compounds for use in PhotochemCAD. Photochem. Photobiol. 2018, 94, 290–327. [Google Scholar] [CrossRef]
- Joos, F. Technische Verbrennung; Springer: Berlin/Heidelberg, Germany, 2006. [Google Scholar]
- Elfasakhany, A. Investigations on the effects of ethanol–methanol–gasoline blends in a spark-ignition engine: Performance and emissions analysis. Eng. Sci. Technol. Int. J. 2015, 18, 713–719. [Google Scholar] [CrossRef]
- Broustail, G.; Seers, P.; Halter, F.; Moreac, G.; Mounaim-Rousselle, C. Experimental determination of laminar burning velocity for butanol and ethanol iso-octane blends. Fuel 2011, 90, 1–6. [Google Scholar] [CrossRef]
- Liu, H.; Lee, C.-F.; Huo, M.; Yao, M. Comparison of Ethanol and Butanol as Additives in Soybean Biodiesel Using a Constant Volume Combustion Chamber. Energy Fuels 2011, 25, 1837–1846. [Google Scholar] [CrossRef]
- Riazi, M.R.; Chiaramonti, D. Biofuels Production and Processing Technology; CRC-Press: Boca Raton, FL, USA, 2017. [Google Scholar]
- Coordinating Research Council. Handbook of Aviation Fuel Properties; Coordinating Research Council: Alpharetta, GA, USA, 1983. [Google Scholar]
- Department of Defense. Detail Specification Turbine Fuel, Aviation, Kerosene Type, JP-8 (NATO F-34), NATO F-35, and JP-8+100 (NATO F-37). 2015. Available online: https://quicksearch.dla.mil/Transient/9FA7EA4F55464FF5AA4D85B2A39A4D7C.pdf (accessed on 2 April 2019).
- Environment Canada. 2019. Available online: http://www.etc-cte.ec.gc.ca/databases/oilproperties/pdf/web_jet_a-jet_a-1.pdf (accessed on 2 April 2019).
- Groendyk, M.; Rothamer, D. Effect of increased fuel volatility on CDC operation in a light-duty CIDI engine. Fuel 2017, 194, 195–210. [Google Scholar] [CrossRef]
- Shamsi, E.; Parvin, P.; Ahmadinouri, F.; Khazai, S. Laser-induced fluorescence spectroscopy of plant-based drugs: Opium and hashish provoking at 405 nm. Spectrochim. Acta Part A Mol. Biomol. Spectrosc. 2023, 302, 123055. [Google Scholar] [CrossRef] [PubMed]
- Denker, C.; Verma, M.; Wiśniewska, A.; Kamlah, R.; Kontogiannis, I.; Dineva, E.; Rendtel, J.; Bauer, S.-M.; Dionies, M.; Önel, H.; et al. Improved High-resolution Fast Imager. J. Astron. Telesc. Instrum. Syst. 2023, 9, 015001. [Google Scholar] [CrossRef]


| Light sources | Halogen/deuterium lamps |
| Wavelength interval | 190 nm–900 nm |
| Bandwidth | 2 nm |
| Scan speed | 200 nm/min |
| Measurement temperature | 293 K |
| Property | Unit | Isooctane | Ethanol | Jet A-1 |
|---|---|---|---|---|
| H/C ratio/O/C ratio | - | 2.25/- | 3/0.5 | 1.92/- |
| Boiling point or range | K | 372 | 351 | 478–573 |
| Density at 293 K and 0.1 MPa | g/cm3 | 0.72 | 0.79 | 0.79 |
| Dynamic viscosity at 0.1 MPa and 298 K | mPa·s | 0.47 | 1.1 | 1.33 (@293 K) |
| Surface tension at 293 K | N/m | 0.019 | 0.022 | 0.027 |
| Heat of vaporization at 293 K | kJ/kg | 297 | 904 | 300–375 |
| Stoichiometric air–fuel ratio | kg/kg | 15.2 | 9 | ~15 |
| Lower heating value | MJ/kg | 44.3 | 26.8 | 43.45 |
| Filter 1 | Filter 2 | |||
|---|---|---|---|---|
| Solvent | CWL (nm) | SN | CWL (nm) | SN |
| Isooctane | 632 | #65-166 | 560 | #88-011 |
| E20 | 640 | #65-168 | 600 | #65-163 |
| E40 | 640 | #65-168 | 600 | #65-163 |
| E100 | 540 | #65-157 | 568 | #65-160 |
| Jet A-1 | 650 | #65-170 | 589 | #65-162 |
| Fuel | y0 | A1 | t1 | A2 | t2 | A3 | t3 | R2 | Valid |
|---|---|---|---|---|---|---|---|---|---|
| Isooctane | 199.73 | −7914.23 | 0.34 | 13,478.36 | 0.25 | 2158.91 | 0.46 | 0.9975 | (203 K–293 K) |
| E20 | 458.26 | −72.23 | −4.48 | 0.00 | −0.06 | −62.26 | −4.49 | 0.9962 | (223 K–293 K) |
| E100 | 176.24 | 160.98 | 0.63 | 69.06 | 0.63 | 118.03 | 1.89 | 0.9996 | (183 K–293 K) |
| Jet A-1 | 177.18 | 3.26 × 10⁷ | 0.07 | 2.75 × 10⁹ | 0.05 | 88.84 | 2.17 | 0.9991 | (183 K–293 K) |
| Fuel | p1 | p2 | p3 | p4 | p5 | R2 | Valid |
|---|---|---|---|---|---|---|---|
| E40 | −27.40 | 164.83 | −350.82 | 273.10 | 232.99 | 0.9974 | (233 K–293 K) |
Disclaimer/Publisher’s Note: The statements, opinions and data contained in all publications are solely those of the individual author(s) and contributor(s) and not of MDPI and/or the editor(s). MDPI and/or the editor(s) disclaim responsibility for any injury to people or property resulting from any ideas, methods, instructions or products referred to in the content. |
© 2024 by the authors. Licensee MDPI, Basel, Switzerland. This article is an open access article distributed under the terms and conditions of the Creative Commons Attribution (CC BY) license (https://creativecommons.org/licenses/by/4.0/).
Share and Cite
Koegl, M.; Vogler, J.; Zigan, L. Spectral Investigations of Fluorescence Tracers in Automotive and Aviation Fuels under Cryogenic Conditions. Sensors 2024, 24, 724. https://doi.org/10.3390/s24030724
Koegl M, Vogler J, Zigan L. Spectral Investigations of Fluorescence Tracers in Automotive and Aviation Fuels under Cryogenic Conditions. Sensors. 2024; 24(3):724. https://doi.org/10.3390/s24030724
Chicago/Turabian StyleKoegl, Matthias, Jonas Vogler, and Lars Zigan. 2024. "Spectral Investigations of Fluorescence Tracers in Automotive and Aviation Fuels under Cryogenic Conditions" Sensors 24, no. 3: 724. https://doi.org/10.3390/s24030724