
Fluorescence-Based Portable Assays for Detection of Biological and Chemical Analytes

Abstract
:1. Introduction
2. Fluorescence-Based Portable Device in Healthcare Applications
2.1. Detection of Bacterial Infection
2.2. Detection of Anions and Cations
2.3. Detection of Biochemical Analytes
3. Devices for Environmental Monitoring
3.1. Detection of Volatile Organic Compounds (VOCs)
3.2. Water Quality Monitoring
4. Typical POC Fluorescence Readout Devices
5. Conclusions
Author Contributions
Funding
Institutional Review Board Statement
Informed Consent Statement
Data Availability Statement
Conflicts of Interest
References
- Nishi, K.; Isobe, S.-I.; Zhu, Y.; Kiyama, R. Fluorescence-based bioassays for the detection and evaluation of food materials. Sensors 2015, 15, 25831–25867. [Google Scholar] [CrossRef] [PubMed]
- Camarca, A.; Varriale, A.; Capo, A.; Pennacchio, A.; Calabrese, A.; Giannattasio, C.; Murillo Almuzara, C.; D’Auria, S.; Staiano, M. Emergent Biosensing Technologies Based on Fluorescence Spectroscopy and Surface Plasmon Resonance. Sensors 2021, 21, 906. [Google Scholar] [CrossRef] [PubMed]
- Nath, P.; Hamadna, S.S.; Karamchand, L.; Foster, J.; Kopelman, R.; Amar, J.G.; Ray, A. Intracellular detection of singlet oxygen using fluorescent nanosensors. Analyst 2021, 146, 3933–3941. [Google Scholar] [CrossRef] [PubMed]
- Ray, A.; Ranieri, P.; Karamchand, L.; Yee, B.; Foster, J.; Raoul, K. Real-Time Monitoring of Intracellular Chemical Changes in Response to Plasma Irradiation. Plasma Med. 2017, 7, 7–26. [Google Scholar] [CrossRef]
- Ray, A.; Kopelman, R. Hydrogel nanosensors for biophotonic imaging of chemical analytes. Nanomedicine 2013, 8, 1829–1838. [Google Scholar] [CrossRef]
- Strianese, M.; Staiano, M.; Ruggiero, G.; Labella, T.; Pellecchia, C.; D’Auria, S. Fluorescence-based biosensors. Methods Mol. Biol. 2012, 875, 193–216. [Google Scholar] [CrossRef]
- Pham, H.; Hoseini Soflaee, M.; Karginov, A.V.; Miller, L.W. Förster resonance energy transfer biosensors for fluorescence and time-gated luminescence analysis of rac1 activity. Sci. Rep. 2022, 12, 5291. [Google Scholar] [CrossRef]
- Komatsu, N.; Terai, K.; Imanishi, A.; Kamioka, Y.; Sumiyama, K.; Jin, T.; Okada, Y.; Nagai, T.; Matsuda, M. A platform of BRET-FRET hybrid biosensors for optogenetics, chemical screening, and in vivo imaging. Sci. Rep. 2018, 8, 8984. [Google Scholar] [CrossRef]
- Liu, L.; He, F.; Yu, Y.; Wang, Y. Application of FRET Biosensors in Mechanobiology and Mechanopharmacological Screening. Front. Bioeng. Biotechnol. 2020, 8, 595497. [Google Scholar] [CrossRef]
- Yu, L.; Lei, Y.; Ma, Y.; Liu, M.; Zheng, J.; Dan, D.; Gao, P. A Comprehensive Review of Fluorescence Correlation Spectroscopy. Front. Phys. 2021, 9, 644450. [Google Scholar] [CrossRef]
- Hendrickson, O.D.; Taranova, N.A.; Zherdev, A.V.; Dzantiev, B.B.; Eremin, S.A. Fluorescence Polarization-Based Bioassays: New Horizons. Sensors 2020, 20, 7132. [Google Scholar] [CrossRef] [PubMed]
- Liu, L.; Zhou, X.; Wilkinson, J.S.; Hua, P.; Song, B.; Shi, H. Integrated optical waveguide-based fluorescent immunosensor for fast and sensitive detection of microcystin-LR in lakes: Optimization and Analysis. Sci. Rep. 2017, 7, 3655. [Google Scholar] [CrossRef] [PubMed]
- Squire, K.; Kong, X.; LeDuff, P.; Rorrer, G.L.; Wang, A.X. Photonic crystal enhanced fluorescence immunoassay on diatom biosilica. J. Biophotonics 2018, 11, e201800009. [Google Scholar] [CrossRef] [PubMed]
- Sharma, A.; Khan, R.; Catanante, G.; Sherazi, T.A.; Bhand, S.; Hayat, A.; Marty, J.L. Designed Strategies for Fluorescence-Based Biosensors for the Detection of Mycotoxins. Toxins 2018, 10, 197. [Google Scholar] [CrossRef]
- Nath, P.; Kopelman, R.; Foster, J.; Amar, J.; Ray, A. Fluorescent nanosensors for detection of intracellular singlet oxygen during plasma therapy. Proc. SPIE 2021, 11658, 116580J. [Google Scholar]
- Ray, A.; Lee, Y.-E.K.; Elbez, R.; Kopelman, R. Targeted nanosensor aided three-dimensional pH mapping in tumor spheroids using two-photon microscopy. Proc. SPIE 2012, 8226, 822613. [Google Scholar] [CrossRef]
- Ray, A.; Koo Lee, Y.-E.; Epstein, T.; Kim, G.; Kopelman, R. Two-photon nano-PEBBLE sensors: Subcellular pH measurements. Analyst 2011, 136, 3616–3622. [Google Scholar] [CrossRef]
- Ray, A.; Kopelman, R.; Rajian, J.R.; Wang, X.; Lee, Y.-E.K. Lifetime-based photoacoustic oxygen sensing in vivo. J. Biomed. Opt. 2012, 17, 057004. [Google Scholar] [CrossRef]
- Mandracchia, B.; Hua, X.; Guo, C.; Son, J.; Urner, T.; Jia, S. Fast and accurate sCMOS noise correction for fluorescence microscopy. Nat. Commun. 2020, 11, 94. [Google Scholar] [CrossRef] [PubMed]
- Ceylan Koydemir, H.; Ray, A. Mobile Diagnostic Devices for Digital Transformation in Personalized Healthcare. Diagnostics 2020, 10, 1008. [Google Scholar] [CrossRef] [PubMed]
- Nath, P.; Kabir, M.A.; Doust, S.K.; Ray, A. Diagnosis of Herpes Simplex Virus: Laboratory and Point-of-Care Techniques. Infect. Dis. Rep. 2021, 13, 518–539. [Google Scholar] [CrossRef] [PubMed]
- Shin, Y.-H.; Teresa Gutierrez-Wing, M.; Choi, J.-W. Review—Recent Progress in Portable Fluorescence Sensors. J. Electrochem. Soc. 2021, 168, 17502. [Google Scholar] [CrossRef]
- Pham, A.T.T.; Tohl, D.; Wallace, A.; Hu, Q.; Li, J.; Reynolds, K.J.; Tang, Y. Developing a fluorescent sensing based portable medical open-platform—A case study for albuminuria measurement in chronic kidney disease screening and monitoring. Sens. Bio-Sens. Res. 2022, 37, 100504. [Google Scholar] [CrossRef]
- Sueker, M.; Stromsodt, K.; Gorji, H.T.; Vasefi, F.; Khan, N.; Schmit, T.; Varma, R.; Mackinnon, N.; Sokolov, S.; Akhbardeh, A.; et al. Handheld Multispectral Fluorescence Imaging System to Detect and Disinfect Surface Contamination. Sensors 2021, 21, 7222. [Google Scholar] [CrossRef] [PubMed]
- Vietz, C.; Schütte, M.L.; Wei, Q.; Richter, L.; Lalkens, B.; Ozcan, A.; Tinnefeld, P.; Acuna, G.P. Benchmarking Smartphone Fluorescence-Based Microscopy with DNA Origami Nanobeads: Reducing the Gap toward Single-Molecule Sensitivity. ACS Omega 2019, 4, 637–642. [Google Scholar] [CrossRef]
- Lee, W.-I.; Park, Y.; Park, J.; Shrivastava, S.; Son, Y.-M.; Choi, H.-J.; Lee, J.; Jeon, B.; Lee, H.; Lee, N.-E. A smartphone fluorescence imaging-based mobile biosensing system integrated with a passive fluidic control cartridge for minimal user intervention and high accuracy. Lab Chip 2019, 19, 1502–1511. [Google Scholar] [CrossRef]
- Arias-Alpízar, K.; Sánchez-Cano, A.; Prat-Trunas, J.; de la Serna Serna, E.; Alonso, O.; Sulleiro, E.; Sánchez-Montalvá, A.; Diéguez, A.; Baldrich, E. Malaria quantitative POC testing using magnetic particles, a paper microfluidic device and a hand-held fluorescence reader. Biosens. Bioelectron. 2022, 215, 114513. [Google Scholar] [CrossRef]
- Ruiz-Vega, G.; Arias-Alpízar, K.; de la Serna, E.; Borgheti-Cardoso, L.N.; Sulleiro, E.; Molina, I.; Fernàndez-Busquets, X.; Sánchez-Montalvá, A.; Del Campo, F.J.; Baldrich, E. Electrochemical POC device for fast malaria quantitative diagnosis in whole blood by using magnetic beads, Poly-HRP and microfluidic paper electrodes. Biosens. Bioelectron. 2020, 150, 111925. [Google Scholar] [CrossRef]
- Loeffelholz, M.J.; Tang, Y.-W. Detection of SARS-CoV-2 at the point of care. Bioanalysis 2021, 13, 1213–1223. [Google Scholar] [CrossRef]
- Song, Q.; Sun, X.; Dai, Z.; Gao, Y.; Gong, X.; Zhou, B.; Wu, J.; Wen, W. Point-of-care testing detection methods for COVID-19. Lab Chip 2021, 21, 1634–1660. [Google Scholar] [CrossRef]
- Greenwood, D.A.; Grady, M. Healthcare Professional Perceptions of Blood Glucose Meter Features That Support Achievement of Self-Management Goals Recommended by Clinical Practice Guidelines. J. Diabetes Sci. Technol. 2020, 15, 1142–1152. [Google Scholar] [CrossRef] [PubMed]
- Nath, P.; Arun, R.K.; Chanda, N. Smart gold nanosensor for easy sensing of lead and copper ions in solution and using paper strips. RSC Adv. 2015, 5, 69024–69031. [Google Scholar] [CrossRef]
- Nath, P.; Arun, R.K.; Chanda, N. A paper based microfluidic device for the detection of arsenic using a gold nanosensor. RSC Adv. 2014, 4, 59558–59561. [Google Scholar] [CrossRef]
- McMullin, T.S.; Bamber, A.M.; Bon, D.; Vigil, D.I.; Van Dyke, M. Exposures and Health Risks from Volatile Organic Compounds in Communities Located near Oil and Gas Exploration and Production Activities in Colorado (U.S.A.). Int. J. Environ. Res. Public Health 2018, 15, 1500. [Google Scholar] [CrossRef] [PubMed]
- Leonard, J.; Koydemir, H.C.; Koutnik, V.S.; Tseng, D.; Ozcan, A.; Mohanty, S.K. Smartphone-enabled rapid quantification of microplastics. J. Hazard. Mater. Lett. 2022, 3, 100052. [Google Scholar] [CrossRef]
- Mudanyali, O.; Oztoprak, C.; Tseng, D.; Erlinger, A.; Ozcan, A. Detection of waterborne parasites using field-portable and cost-effective lensfree microscopy. Lab Chip 2010, 10, 2419–2423. [Google Scholar] [CrossRef]
- Kriss, R.; Pieper, K.J.; Parks, J.; Edwards, M.A. Challenges of Detecting Lead in Drinking Water Using at-Home Test Kits. Environ. Sci. Technol. 2021, 55, 1964–1972. [Google Scholar] [CrossRef]
- Reddy, R.R.; Rodriguez, G.D.; Webster, T.M.; Abedin, M.J.; Karim, M.R.; Raskin, L.; Hayes, K.F. Evaluation of arsenic field test kits for drinking water: Recommendations for improvement and implications for arsenic affected regions such as Bangladesh. Water Res. 2020, 170, 115325. [Google Scholar] [CrossRef]
- Kost, G.J.; Tran, N.K.; Louie, R.F. Point-of-Care Testing: Principles, Practice, and Critical-Emergency-Disaster Medicine. In Encyclopedia of Analytical Chemistry; John Wiley & Sons: Hoboken, NJ, USA, 2008; ISBN 9780470027318. [Google Scholar]
- Kruk, M.E.; Gage, A.D.; Arsenault, C.; Jordan, K.; Leslie, H.H.; Roder-DeWan, S.; Adeyi, O.; Barker, P.; Daelmans, B.; Doubova, S.V.; et al. High-quality health systems in the Sustainable Development Goals era: Time for a revolution. Lancet Glob. Health 2018, 6, e1196–e1252. [Google Scholar] [CrossRef]
- Vashist, S.K. Point-of-Care Diagnostics: Recent Advances and Trends. Biosensors 2017, 7, 62. [Google Scholar] [CrossRef]
- St John, A.; Price, C.P. Economic Evidence and Point-of-Care Testing. Clin. Biochem. Rev. 2013, 34, 61–74. [Google Scholar] [PubMed]
- Ventola, C.L. The antibiotic resistance crisis: Part 1: Causes and threats. P T 2015, 40, 277–283. [Google Scholar] [PubMed]
- Prestinaci, F.; Pezzotti, P.; Pantosti, A. Antimicrobial resistance: A global multifaceted phenomenon. Pathog. Glob. Health 2015, 109, 309–318. [Google Scholar] [CrossRef] [PubMed]
- Kadri, S.S. Key Takeaways From the U.S. CDC’s 2019 Antibiotic Resistance Threats Report for Frontline Providers. Crit. Care Med. 2020, 48, 939–945. [Google Scholar] [CrossRef]
- Nath, P.; Kabir, A.; Khoubafarin Doust, S.; Kreais, Z.J.; Ray, A. Detection of Bacterial and Viral Pathogens Using Photonic Point-of-Care Devices. Diagnostics 2020, 10, 841. [Google Scholar] [CrossRef]
- Peri, A.M.; Stewart, A.; Hume, A.; Irwin, A.; Harris, P.N.A. New Microbiological Techniques for the Diagnosis of Bacterial Infections and Sepsis in ICU Including Point of Care. Curr. Infect. Dis. Rep. 2021, 23, 12. [Google Scholar] [CrossRef]
- Tsalik, E.L.; Bonomo, R.A.; Fowler, V.G., Jr. New Molecular Diagnostic Approaches to Bacterial Infections and Antibacterial Resistance. Annu. Rev. Med. 2018, 69, 379–394. [Google Scholar] [CrossRef]
- Kim, J.; Park, J.-Y.; Park, Y.-J.; Park, S.-Y.; Lee, M.-S.; Koo, C. A portable and high-sensitivity optical sensing system for detecting fluorescently labeled enterohaemorrhagic Escherichia coli Shiga toxin 2B-subunit. PLoS ONE 2020, 15, e0236043. [Google Scholar] [CrossRef]
- Zhou, Q.; Pan, J.; Mo, L.; Luo, Z.; Qin, Z.; Dai, Z.; Yi, C. Fluorescent on-site detection of multiple pathogens using smartphone-based portable device with paper-based isothermal amplification chip. Mikrochim. Acta 2022, 189, 333. [Google Scholar] [CrossRef]
- Papadakis, G.; Pantazis, A.K.; Fikas, N.; Chatziioannidou, S.; Tsiakalou, V.; Michaelidou, K.; Pogka, V.; Megariti, M.; Vardaki, M.; Giarentis, K.; et al. Portable real-time colorimetric LAMP-device for rapid quantitative detection of nucleic acids in crude samples. Sci. Rep. 2022, 12, 3775. [Google Scholar] [CrossRef]
- Huang, J.; Zhong, Y.; Li, W.; Wang, W.; Li, C.; Wang, A.; Yan, H.; Wan, Y.; Li, J. Fluorescent and Opt-Electric Recording Bacterial Identification Device for Ultrasensitive and Specific Detection of Microbials. ACS Sens. 2021, 6, 443–449. [Google Scholar] [CrossRef] [PubMed]
- Shin, J.; Yoon, T.; Park, J.; Park, K.S. Sensitive and simultaneous detection of hygiene indicator bacteria using an enhanced CRISPR/Cas system in combination with a portable fluorescence detector. Sens. Actuators B Chem. 2022, 365, 131871. [Google Scholar] [CrossRef]
- Sheini, A. A point-of-care testing sensor based on fluorescent nanoclusters for rapid detection of septicemia in children. Sens. Actuators B Chem. 2021, 328, 129029. [Google Scholar] [CrossRef]
- Xie, H.; Mire, J.; Kong, Y.; Chang, M.; Hassounah, H.A.; Thornton, C.N.; Sacchettini, J.C.; Cirillo, J.D.; Rao, J. Rapid point-of-care detection of the tuberculosis pathogen using a BlaC-specific fluorogenic probe. Nat. Chem. 2012, 4, 802–809. [Google Scholar] [CrossRef] [PubMed]
- Moustakas, M. The Role of Metal Ions in Biology, Biochemistry and Medicine. Materials 2021, 14, 549. [Google Scholar] [CrossRef]
- Lakatos, B.; Szentmihályi, K.; Vinkler, P.; Balla, J.; Balla, G. The role of essential metal ions in the human organism and their oral supplementation to the human body in deficiency states. Orv. Hetil. 2004, 145, 1315–1319. [Google Scholar]
- Martínez-Mier, E.A. Fluoride: Its Metabolism, Toxicity, and Role in Dental Health. J. Evid. Based. Complement. Altern. Med. 2011, 17, 28–32. [Google Scholar] [CrossRef]
- Duffin, S.; Duffin, M.; Grootveld, M. Revisiting Fluoride in the Twenty-First Century: Safety and Efficacy Considerations. Front. Oral Health 2022, 3, 873157. [Google Scholar] [CrossRef]
- Zheng, X.; Cheng, W.; Ji, C.; Zhang, J.; Yin, M. Detection of metal ions in biological systems: A review. Rev. Anal. Chem. 2020, 39, 231–246. [Google Scholar] [CrossRef]
- Dean, K.M.; Qin, Y.; Palmer, A.E. Visualizing metal ions in cells: An overview of analytical techniques, approaches, and probes. Biochim. Biophys. Acta 2012, 1823, 1406–1415. [Google Scholar] [CrossRef]
- Zhang, L.; Gao, X.; Chen, X.; Zhao, M.; Wu, H.; Liu, Y. A smartphone integrated ratiometric fluorescent sensor for point-of-care testing of fluoride ions. Anal. Bioanal. Chem. 2022, 414, 3999–4009. [Google Scholar] [CrossRef] [PubMed]
- Yang, Q.; Jia, C.; Chen, Q.; Du, W.; Wang, Y.; Zhang, Q. A NIR fluorescent probe for the detection of fluoride ions and its application in in vivo bioimaging. J. Mater. Chem. B 2017, 5, 2002–2009. [Google Scholar] [CrossRef] [PubMed]
- Dey, S.; Kumar, A.; Mondal, P.K.; Chopra, D.; Roy, R.; Jindani, S.; Ganguly, B.; Mayya, C.; Bhatia, D.; Jain, V.K. Ultrasensitive colorimetric detection of fluoride and arsenate in water and mammalian cells using recyclable metal oxacalixarene probe: A lateral flow assay. Sci. Rep. 2022, 12, 17119. [Google Scholar] [CrossRef] [PubMed]
- Zhang, S.; Sun, M.; Yan, Y.; Yu, H.; Yu, T.; Jiang, H.; Zhang, K.; Wang, S. A turn-on fluorescence probe for the selective and sensitive detection of fluoride ions. Anal. Bioanal. Chem. 2017, 409, 2075–2081. [Google Scholar] [CrossRef]
- Liu, X.; Liu, X.; Shen, Y.; Gu, B. A Simple Water-Soluble ESIPT Fluorescent Probe for Fluoride Ion with Large Stokes Shift in Living Cells. ACS Omega 2020, 5, 21684–21688. [Google Scholar] [CrossRef]
- Yan, L.; Li, D.; Le, Y.; Dong, P.; Liu, L. Phenothiazine-based fluorescent probe for fluoride ions and its applications in rapid detection of endemic disease. Dye. Pigment. 2022, 201, 110200. [Google Scholar] [CrossRef]
- Ma, Y.; Mou, Q.; Yan, P.; Yang, Z.; Xiong, Y.; Yan, D.; Zhang, C.; Zhu, X.; Lu, Y. A highly sensitive and selective fluoride sensor based on a riboswitch-regulated transcription coupled with CRISPR-Cas13a tandem reaction. Chem. Sci. 2021, 12, 11740–11747. [Google Scholar] [CrossRef]
- Nakata, E.; Nazumi, Y.; Yukimachi, Y.; Uto, Y.; Hori, H.; Morii, T. Self-Assembled Fluorescent Nanoprobe for the Detection of Fluoride Ions in Aqueous Solutions. Bull. Chem. Soc. Jpn. 2014, 88, 327–329. [Google Scholar] [CrossRef]
- Wu, X.; Wang, H.; Yang, S.; Tian, H.; Liu, Y.; Sun, B. Highly Sensitive Ratiometric Fluorescent Paper Sensors for the Detection of Fluoride Ions. ACS Omega 2019, 4, 4918–4926. [Google Scholar] [CrossRef]
- Ke, B.; Chen, W.; Ni, N.; Cheng, Y.; Dai, C.; Dinh, H.; Wang, B. A fluorescent probe for rapid aqueous fluoride detection and cell imaging. Chem. Commun. (Camb) 2013, 49, 2494–2496. [Google Scholar] [CrossRef]
- Chansaenpak, K.; Kamkaew, A.; Weeranantanapan, O.; Suttisintong, K.; Tumcharern, G. Coumarin Probe for Selective Detection of Fluoride Ions in Aqueous Solution and Its Bioimaging in Live Cells. Sensors 2018, 18, 2042. [Google Scholar] [CrossRef]
- Yu, X.; Yang, L.; Zhao, T.; Zhang, R.; Yang, L.; Jiang, C.; Zhao, J.; Liu, B.; Zhang, Z. Multicolorful ratiometric-fluorescent test paper for determination of fluoride ions in environmental water. RSC Adv. 2017, 7, 53379–53384. [Google Scholar] [CrossRef]
- Zhang, C.; Kim, J.P.; Creer, M.; Yang, J.; Liu, Z. A smartphone-based chloridometer for point-of-care diagnostics of cystic fibrosis. Biosens. Bioelectron. 2017, 97, 164–168. [Google Scholar] [CrossRef] [PubMed]
- Zhang, J.; Li, Y.; Chai, F.; Li, Q.; Wang, D.; Liu, L.; Tang, B.Z.; Jiang, X. Ultrasensitive point-of-care biochemical sensor based on metal-AIEgen frameworks. Sci. Adv. 2022, 8, eabo1874. [Google Scholar] [CrossRef]
- Rinschen, M.M.; Ivanisevic, J.; Giera, M.; Siuzdak, G. Identification of bioactive metabolites using activity metabolomics. Nat. Rev. Mol. Cell Biol. 2019, 20, 353–367. [Google Scholar] [CrossRef] [PubMed]
- Shine, B.; Guha, N. The use of biochemical analysis for diagnosis and management. Oxford Textb. Med. 2020, 6577–C29.1.T11. [Google Scholar] [CrossRef]
- Treacy, O.; Brown, N.N.; Dimeski, G. Biochemical evaluation of kidney disease. Transl. Androl. Urol. 2019, 8, S214–S223. [Google Scholar] [CrossRef]
- Zadhoush, F.; Sadeghi, M.; Pourfarzam, M. Biochemical changes in blood of type 2 diabetes with and without metabolic syndrome and their association with metabolic syndrome components. J. Res. Med. Sci. 2015, 20, 763–770. [Google Scholar] [CrossRef]
- Guo, L.; Chen, S.; Yu, Y.-L.; Wang, J.-H. A Smartphone Optical Device for Point-of-Care Testing of Glucose and Cholesterol Using Ag NPs/UiO-66-NH2-Based Ratiometric Fluorescent Probe. Anal. Chem. 2021, 93, 16240–16247. [Google Scholar] [CrossRef]
- Wang, B.; Zhou, X.-Q.; Li, L.; Li, Y.-X.; Yu, L.-P.; Chen, Y. Ratiometric fluorescence sensor for point-of-care testing of bilirubin based on tetraphenylethylene functionalized polymer nanoaggregate and rhodamine B. Sens. Actuators B Chem. 2022, 369, 132392. [Google Scholar] [CrossRef]
- Johnson, S.E.; Sherding, R.G. Diseases of the Liver and Biliary Tract. Saunders Man. Small Anim. Pract. 2006, 747–809. [Google Scholar] [CrossRef]
- VanWagner, L.B.; Green, R.M. Evaluating elevated bilirubin levels in asymptomatic adults. JAMA 2015, 313, 516–517. [Google Scholar] [CrossRef] [PubMed]
- Meher, S.; Mishra, T.S.; Sasmal, P.K.; Rath, S.; Sharma, R.; Rout, B.; Sahu, M.K. Role of Biomarkers in Diagnosis and Prognostic Evaluation of Acute Pancreatitis. J. Biomark. 2015, 2015, 519534. [Google Scholar] [CrossRef]
- Kylänpää-Bäck, M.L.; Kemppainen, E.; Puolakkainen, P. Trypsin-based laboratory methods and carboxypeptidase activation peptide in acute pancreatitis. JOP 2002, 3, 34–48. [Google Scholar]
- Heinrich, H.C.; Gabbe, E.E.; Icagić, F. Immunoreactive serum trypsin in diseases of the pancreas. Klin. Wochenschr. 1979, 57, 1237–1238. [Google Scholar] [CrossRef]
- Li, H.; Yang, M.; Kong, D.; Jin, R.; Zhao, X.; Liu, F.; Yan, X.; Lin, Y.; Lu, G. Sensitive fluorescence sensor for point-of-care detection of trypsin using glutathione-stabilized gold nanoclusters. Sens. Actuators B Chem. 2019, 282, 366–372. [Google Scholar] [CrossRef]
- Melman, Y.; Wells, P.K.; Katz, E.; Smutok, O. A universal nanostructured bioanalytical platform for NAD+-dependent enzymes based on the fluorescent output reading with a smartphone. Talanta 2022, 243, 123325. [Google Scholar] [CrossRef] [PubMed]
- Wells, P.K.; Smutok, O.; Guo, Z.; Alexandrov, K.; Katz, E. Fluorometric biosensing of α-amylase using an artificial allosteric biosensor immobilized on nanostructured interface. Talanta 2023, 255, 124215. [Google Scholar] [CrossRef]
- Wells, P.K.; Smutok, O.; Guo, Z.; Alexandrov, K.; Katz, E. Nanostructured Interface Loaded with Chimeric Enzymes for Fluorimetric Quantification of Cyclosporine A and FK506. Anal. Chem. 2022, 94, 7303–7310. [Google Scholar] [CrossRef]
- Ninomiya, T.; Perkovic, V.; de Galan, B.E.; Zoungas, S.; Pillai, A.; Jardine, M.; Patel, A.; Cass, A.; Neal, B.; Poulter, N.; et al. Albuminuria and kidney function independently predict cardiovascular and renal outcomes in diabetes. J. Am. Soc. Nephrol. 2009, 20, 1813–1821. [Google Scholar] [CrossRef]
- Butt, L.; Unnersjö-Jess, D.; Höhne, M.; Edwards, A.; Binz-Lotter, J.; Reilly, D.; Hahnfeldt, R.; Ziegler, V.; Fremter, K.; Rinschen, M.M.; et al. A molecular mechanism explaining albuminuria in kidney disease. Nat. Metab. 2020, 2, 461–474. [Google Scholar] [CrossRef] [PubMed]
- Shibata, K. Urine 3-hydroxykynurenine is higher during the postovulatory phase than in the preovulatory phase indicating a higher vitamin B6 requirement. Biosci. Biotechnol. Biochem. 2014, 78, 1757–1760. [Google Scholar] [CrossRef] [PubMed]
- Birková, A.; Valko-Rokytovská, M.; Hubková, B.; Zábavníková, M.; Mareková, M. Strong Dependence between Tryptophan-Related Fluorescence of Urine and Malignant Melanoma. Int. J. Mol. Sci. 2021, 22, 1884. [Google Scholar] [CrossRef] [PubMed]
- Zhao, X.; Zheng, W.; Qin, T.; Du, X.; Lei, Y.; Lv, T.; Zhou, M.; Xu, Z.; Wang, L.; Liu, B.; et al. An anti-interference fluorescent probe for point-of-care diagnosis of albuminuria. Sens. Actuators B Chem. 2022, 351, 130980. [Google Scholar] [CrossRef]
- Gray, W.B.; Shimshack, J.P. The Effectiveness of Environmental Monitoring and Enforcement: A Review of the Empirical Evidence. Rev. Environ. Econ. Policy 2011, 5, 3–24. [Google Scholar] [CrossRef]
- Gałuszka, A.; Migaszewski, Z.M.; Namieśnik, J. Moving your laboratories to the field—Advantages and limitations of the use of field portable instruments in environmental sample analysis. Environ. Res. 2015, 140, 593–603. [Google Scholar] [CrossRef]
- Donaire-Gonzalez, D.; Valentín, A.; de Nazelle, A.; Ambros, A.; Carrasco-Turigas, G.; Seto, E.; Jerrett, M.; Nieuwenhuijsen, M.J. Benefits of Mobile Phone Technology for Personal Environmental Monitoring. JMIR Mhealth Uhealth 2016, 4, e126. [Google Scholar] [CrossRef]
- Tiele, A.; Esfahani, S.; Covington, J. Design and Development of a Low-Cost, Portable Monitoring Device for Indoor Environment Quality. J. Sens. 2018, 2018, 5353816. [Google Scholar] [CrossRef]
- Galstyan, V.; D’Arco, A.; Di Fabrizio, M.; Poli, N.; Lupi, S.; Comini, E. Detection of volatile organic compounds: From chemical gas sensors to terahertz spectroscopy. Rev. Anal. Chem. 2021, 40, 33–57. [Google Scholar] [CrossRef]
- Zhang, M.; Gao, L.; Zhao, X.; Duan, Y.; Liao, Y.; Han, T. Fabricating a hydroxynaphthalene benzophenone Schiff base into a wearable fluorescent sensor for point-of-care sensing of volatile organic compounds. Dye. Pigment. 2022, 205, 110561. [Google Scholar] [CrossRef]
- Kim, H.; Choi, S.-K.; Ahn, J.; Yu, H.; Min, K.; Hong, C.; Shin, I.-S.; Lee, S.; Lee, H.; Im, H.; et al. Kaleidoscopic fluorescent arrays for machine-learning-based point-of-care chemical sensing. Sens. Actuators B Chem. 2021, 329, 129248. [Google Scholar] [CrossRef] [PubMed]
- Stillo, F.; MacDonald Gibson, J. Exposure to Contaminated Drinking Water and Health Disparities in North Carolina. Am. J. Public Health 2017, 107, 180–185. [Google Scholar] [CrossRef] [PubMed]
- Allaire, M.; Wu, H.; Lall, U. National trends in drinking water quality violations. Proc. Natl. Acad. Sci. USA 2018, 115, 2078–2083. [Google Scholar] [CrossRef] [PubMed]
- Mueller, J.T.; Gasteyer, S. The widespread and unjust drinking water and clean water crisis in the United States. Nat. Commun. 2021, 12, 3544. [Google Scholar] [CrossRef] [PubMed]
- Koydemir, H.C.; Gorocs, Z.; Tseng, D.; Cortazar, B.; Feng, S.; Chan, R.Y.L.; Burbano, J.; McLeod, E.; Ozcan, A. Rapid imaging, detection and quantification of Giardia lamblia cysts using mobile-phone based fluorescent microscopy and machine learning. Lab Chip 2015, 15, 1284–1293. [Google Scholar] [CrossRef] [PubMed]
- Tok, S.; de Haan, K.; Tseng, D.; Usanmaz, C.F.; Ceylan Koydemir, H.; Ozcan, A. Early detection of E. coli and total coliform using an automated, colorimetric and fluorometric fiber optics-based device. Lab Chip 2019, 19, 2925–2935. [Google Scholar] [CrossRef]
- Göröcs, Z.; Tamamitsu, M.; Bianco, V.; Wolf, P.; Roy, S.; Shindo, K.; Yanny, K.; Wu, Y.; Koydemir, H.C.; Rivenson, Y.; et al. A deep learning-enabled portable imaging flow cytometer for cost-effective, high-throughput, and label-free analysis of natural water samples. Light Sci. Appl. 2018, 7, 66. [Google Scholar] [CrossRef]
- Ceylan Koydemir, H.; Feng, S.; Liang, K.; Nadkarni, R.; Benien, P.; Ozcan, A. Comparison of supervised machine learning algorithms for waterborne pathogen detection using mobile phone fluorescence microscopy. Nanophotonics 2017, 6, 731–741. [Google Scholar] [CrossRef]
- Koydemir, H.C.; Gorocs, Z.; McLeod, E.; Tseng, D.; Ozcan, A. Field portable mobile phone based fluorescence microscopy for detection of Giardia lamblia cysts in water samples. Proc. SPIE 2015, 9314, 93140S. [Google Scholar]
- Müller, V.; Sousa, J.M.; Ceylan Koydemir, H.; Veli, M.; Tseng, D.; Cerqueira, L.; Ozcan, A.; Azevedo, N.F.; Westerlund, F. Identification of pathogenic bacteria in complex samples using a smartphone based fluorescence microscope. RSC Adv. 2018, 8, 36493–36502. [Google Scholar] [CrossRef]
- Lin, L.; Yang, H.; Xu, X. Effects of Water Pollution on Human Health and Disease Heterogeneity: A Review. Front. Environ. Sci. 2022, 10, 975. [Google Scholar] [CrossRef]
- Igboama, W.N.; Hammed, O.S.; Fatoba, J.O.; Aroyehun, M.T.; Ehiabhili, J.C. Review article on impact of groundwater contamination due to dumpsites using geophysical and physiochemical methods. Appl. Water Sci. 2022, 12, 130. [Google Scholar] [CrossRef]
- Ahmad, F.; Zhu, D.; Sun, J. Environmental fate of tetracycline antibiotics: Degradation pathway mechanisms, challenges, and perspectives. Environ. Sci. Eur. 2021, 33, 64. [Google Scholar] [CrossRef]
- Dai, Y.; Liu, M.; Li, J.; Yang, S.; Sun, Y.; Sun, Q.; Wang, W.; Lu, L.; Zhang, K.; Xu, J.; et al. A review on pollution situation and treatment methods of tetracycline in groundwater. Sep. Sci. Technol. 2020, 55, 1005–1021. [Google Scholar] [CrossRef]
- Zhang, J.; Shi, G. Rational design of MoS(2) QDs and Eu(3+) as a ratiometric fluorescent probe for point-of-care visual quantitative detection of tetracycline via smartphone-based portable platform. Anal. Chim. Acta 2022, 1198, 339572. [Google Scholar] [CrossRef]
- Guo, Y.; Zhao, W. Nanomaterials for luminescent detection of water and humidity. Analyst 2019, 144, 388–395. [Google Scholar] [CrossRef]
- Deng, Q.; Li, Y.; Wu, J.; Liu, Y.; Fang, G.; Wang, S.; Zhang, Y. Highly sensitive fluorescent sensing for water based on poly(m-aminobenzoic acid). Chem. Commun. 2012, 48, 3009–3011. [Google Scholar] [CrossRef]
- Ye, C.; Qin, Y.; Huang, P.; Chen, A.; Wu, F.-Y. Facile synthesis of carbon nanodots with surface state-modulated fluorescence for highly sensitive and real-time detection of water in organic solvents. Anal. Chim. Acta 2018, 1034, 144–152. [Google Scholar] [CrossRef]
- Wei, J.; Li, H.; Yuan, Y.; Sun, C.; Hao, D.; Zheng, G.; Wang, R. A sensitive fluorescent sensor for the detection of trace water in organic solvents based on carbon quantum dots with yellow fluorescence. RSC Adv. 2018, 8, 37028–37034. [Google Scholar] [CrossRef]
- Liang, H.; Li, Y.; Lin, B.; Yu, Y.; Wang, Y.; Zhang, L.; Cao, Y.; Guo, M. Multicolor fluorescent probe for visual point-of-care detection of water via a smartphone. Microchem. J. 2022, 175, 107221. [Google Scholar] [CrossRef]
- Alam, M.W.; Wahid, K.A.; Goel, R.K.; Lukong, K.E. Development of a low-cost and portable smart fluorometer for detecting breast cancer cells. Biomed. Opt. Express 2019, 10, 399–410. [Google Scholar] [CrossRef] [PubMed]
- Shin, Y.H.O.; Gutierrez-Wing, M.T.; Choi, J.-W. A Portable Fluorometer with Multiple Excitation LEDs. ECS Meet. Abstr. 2021, MA2021-01, 1577. [Google Scholar] [CrossRef]
- Ozcan, A. Mobile phones democratize and cultivate next-generation imaging, diagnostics and measurement tools. Lab Chip 2014, 14, 3187–3194. [Google Scholar] [CrossRef] [PubMed]
- Skolrood, L.; Wang, Y.; Zhang, S.; Wei, Q. Single-molecule and particle detection on true portable microscopy platforms. Sens. Actuators Rep. 2022, 4, 100063. [Google Scholar] [CrossRef]
- Trofymchuk, K.; Glembockyte, V.; Grabenhorst, L.; Steiner, F.; Vietz, C.; Close, C.; Pfeiffer, M.; Richter, L.; Schütte, M.L.; Selbach, F.; et al. Addressable nanoantennas with cleared hotspots for single-molecule detection on a portable smartphone microscope. Nat. Commun. 2021, 12, 950. [Google Scholar] [CrossRef]
- You, L. Superconducting nanowire single-photon detectors for quantum information. Nanophotonics 2020, 9, 2673–2692. [Google Scholar] [CrossRef]
- Yokogawa, S.; Oshiyama, I.; Ikeda, H.; Ebiko, Y.; Hirano, T.; Saito, S.; Oinoue, T.; Hagimoto, Y.; Iwamoto, H. IR sensitivity enhancement of CMOS Image Sensor with diffractive light trapping pixels. Sci. Rep. 2017, 7, 3832. [Google Scholar] [CrossRef]
- Ray, A.; Esparza, S.; Wu, D.; Hanudel, M.R.; Joung, H.-A.; Gales, B.; Tseng, D.; Salusky, I.B.; Ozcan, A. Measurement of serum phosphate levels using a mobile sensor. Analyst 2020, 145, 1841–1848. [Google Scholar] [CrossRef]
- Wang, H.; Heintzmann, R.; Diederich, B. The power in your pocket—Uncover smartphones for use as cutting-edge microscopic instruments in science and research. Adv. Opt. Technol. 2021, 10, 89–108. [Google Scholar] [CrossRef]
- Kabir, M.A.; Kharel, A.; Malla, S.; Kreis, Z.J.; Nath, P.; Wolfe, J.N.; Hassan, M.; Kaur, D.; Sari-Sarraf, H.; Tiwari, A.K.; et al. Automated detection of apoptotic versus nonapoptotic cell death using label-free computational microscopy. J. Biophotonics 2022, 15, e202100310. [Google Scholar] [CrossRef]
- Ray, A.; Lee, Y.-E.K.; Kim, G.; Kopelman, R. Two-photon fluorescence imaging super-enhanced by multishell nanophotonic particles, with application to subcellular pH. Small 2012, 8, 2213–2221. [Google Scholar] [CrossRef] [PubMed]
- Wei, Q.; Acuna, G.; Kim, S.; Vietz, C.; Tseng, D.; Chae, J.; Shir, D.; Luo, W.; Tinnefeld, P.; Ozcan, A. Plasmonics Enhanced Smartphone Fluorescence Microscopy. Sci. Rep. 2017, 7, 2124. [Google Scholar] [CrossRef] [PubMed]
- Mei, Z.; Tang, L. Surface-Plasmon-Coupled Fluorescence Enhancement Based on Ordered Gold Nanorod Array Biochip for Ultrasensitive DNA Analysis. Anal. Chem. 2017, 89, 633–639. [Google Scholar] [CrossRef] [PubMed]
- Semeniak, D.; Cruz, D.F.; Chilkoti, A.; Mikkelsen, M.H. Plasmonic Fluorescence Enhancement in Diagnostics for Clinical Tests at Point-of-Care: A Review of Recent Technologies. Adv. Mater. 2022, 2107986. [Google Scholar] [CrossRef] [PubMed]
- Bauch, M.; Toma, K.; Toma, M.; Zhang, Q.; Dostalek, J. Plasmon-Enhanced Fluorescence Biosensors: A Review. Plasmonics 2014, 9, 781–799. [Google Scholar] [CrossRef]
- Jeong, Y.; Kook, Y.-M.; Lee, K.; Koh, W.-G. Metal enhanced fluorescence (MEF) for biosensors: General approaches and a review of recent developments. Biosens. Bioelectron. 2018, 111, 102–116. [Google Scholar] [CrossRef]
- Hoang, T.X.; Phan, L.M.; Vo, T.A.; Cho, S. Advanced Signal-Amplification Strategies for Paper-Based Analytical Devices: A Comprehensive Review. Biomedicines 2021, 9, 540. [Google Scholar] [CrossRef]
- Ding, X.; Ge, D.; Yang, K.-L. Colorimetric protease assay by using gold nanoparticles and oligopeptides. Sens. Actuators B Chem. 2014, 201, 234–239. [Google Scholar] [CrossRef]
- Xiao, W.; Xiong, Y.; Li, Y.; Chen, Z.; Li, H. Non-Enzymatically Colorimetric Bilirubin Sensing Based on the Catalytic Structure Disruption of Gold Nanocages. Sensors 2023, 23, 2969. [Google Scholar] [CrossRef]
- Khlebtsov, B.N.; Tumskiy, R.S.; Burov, A.M.; Pylaev, T.E.; Khlebtsov, N.G. Quantifying the Numbers of Gold Nanoparticles in the Test Zone of Lateral Flow Immunoassay Strips. ACS Appl. Nano Mater. 2019, 2, 5020–5028. [Google Scholar] [CrossRef]
- Miller, B.S.; Thomas, M.R.; Banner, M.; Kim, J.; Chen, Y.; Wei, Q.; Tseng, D.K.; Göröcs, Z.S.; Ozcan, A.; Stevens, M.M.; et al. Sub-picomolar lateral flow antigen detection with two-wavelength imaging of composite nanoparticles. Biosens. Bioelectron. 2022, 207, 114133. [Google Scholar] [CrossRef] [PubMed]
- Anker, J.N.; Kopelman, R. Magnetically modulated optical nanoprobes. Appl. Phys. Lett. 2003, 82, 1102–1104. [Google Scholar] [CrossRef]
- Zhang, Y.; Ouyang, M.; Ray, A.; Liu, T.; Kong, J.; Bai, B.; Kim, D.; Guziak, A.; Luo, Y.; Feizi, A.; et al. Computational cytometer based on magnetically modulated coherent imaging and deep learning. Light Sci. Appl. 2019, 8, 91. [Google Scholar] [CrossRef] [PubMed]
- Xiao, Z.; Darwish, G.H.; Susumu, K.; Medintz, I.L.; Algar, W.R. Prototype Smartphone-Based Device for Flow Cytometry with Immunolabeling via Supra-nanoparticle Assemblies of Quantum Dots. ACS Meas. Sci. Au 2022, 2, 57–66. [Google Scholar] [CrossRef] [PubMed]
- Xue, Y.; Liu, C.; Andrews, G.; Wang, J.; Ge, Y. Recent advances in carbon quantum dots for virus detection, as well as inhibition and treatment of viral infection. Nano Converg. 2022, 9, 15. [Google Scholar] [CrossRef]
- Zoghi, S.; Rahmandoust, M. A novel technique to overcome fluid flow influence in carbon quantum dots/paper-based analytical devices. Sci. Rep. 2022, 12, 17861. [Google Scholar] [CrossRef]
- Manivannan, S.; Ponnuchamy, K. Quantum dots as a promising agent to combat COVID-19. Appl. Organomet. Chem. 2020, 34, 5887. [Google Scholar] [CrossRef]
- Rabiee, N.; Ahmadi, S.; Soufi, G.J.; Hekmatnia, A.; Khatami, M.; Fatahi, Y.; Iravani, S.; Varma, R.S. Quantum dots against SARS-CoV-2: Diagnostic and therapeutic potentials. J. Chem. Technol. Biotechnol. 2022, 97, 1640–1654. [Google Scholar] [CrossRef]
- Mousavi, S.M.; Hashemi, S.A.; Yari Kalashgrani, M.; Omidifar, N.; Lai, C.W.; Vijayakameswara Rao, N.; Gholami, A.; Chiang, W.-H. The Pivotal Role of Quantum Dots-Based Biomarkers Integrated with Ultra-Sensitive Probes for Multiplex Detection of Human Viral Infections. Pharmaceuticals 2022, 15, 880. [Google Scholar] [CrossRef]
- Azam, N.; Najabat Ali, M.; Javaid Khan, T. Carbon Quantum Dots for Biomedical Applications: Review and Analysis. Front. Mater. 2021, 8, 700403. [Google Scholar] [CrossRef]
- Sun, K.; Yang, Y.; Zhou, H.; Yin, S.; Qin, W.; Yu, J.; Chiu, D.T.; Yuan, Z.; Zhang, X.; Wu, C. Ultrabright Polymer-Dot Transducer Enabled Wireless Glucose Monitoring via a Smartphone. ACS Nano 2018, 12, 5176–5184. [Google Scholar] [CrossRef] [PubMed]
- Gupta, R.; Peveler, W.J.; Lix, K.; Algar, W.R. Comparison of Semiconducting Polymer Dots and Semiconductor Quantum Dots for Smartphone-Based Fluorescence Assays. Anal. Chem. 2019, 91, 10955–10960. [Google Scholar] [CrossRef] [PubMed]
- Ferrero, F.J.; Valledor, M.; Campo, J.C.; López, A.; Llano-Suárez, P.; Fernández-Arguelles, M.T.; Costa-Fernández, J.M.; Soldado, A. Portable Instrument for Monitoring Environmental Toxins Using Immobilized Quantum Dots as the Sensing Material. Appl. Sci. 2020, 10, 3246. [Google Scholar] [CrossRef]
- Zhao, Q.; Zhang, C.; Liu, S.; Liu, Y.; Zhang, K.Y.; Zhou, X.; Jiang, J.; Xu, W.; Yang, T.; Huang, W. Dual-emissive Polymer Dots for Rapid Detection of Fluoride in Pure Water and Biological Systems with Improved Reliability and Accuracy. Sci. Rep. 2015, 5, 16420. [Google Scholar] [CrossRef]
- Manmana, Y.; Kubo, T.; Otsuka, K. Recent developments of point-of-care (POC) testing platform for biomolecules. TrAC Trends Anal. Chem. 2021, 135, 116160. [Google Scholar] [CrossRef]
- Foudeh, A.M.; Fatanat Didar, T.; Veres, T.; Tabrizian, M. Microfluidic designs and techniques using lab-on-a-chip devices for pathogen detection for point-of-care diagnostics. Lab Chip 2012, 12, 3249–3266. [Google Scholar] [CrossRef]
- Arshavsky-Graham, S.; Segal, E. Lab-on-a-Chip Devices for Point-of-Care Medical Diagnostics BT—Microfluidics in Biotechnology; Bahnemann, J., Grünberger, A., Eds.; Springer International Publishing: Cham, Switzerland, 2022; pp. 247–265. ISBN 978-3-031-04188-4. [Google Scholar]
- Wu, J.; Dong, M.; Rigatto, C.; Liu, Y.; Lin, F. Lab-on-chip technology for chronic disease diagnosis. Npj Digit. Med. 2018, 1, 7. [Google Scholar] [CrossRef]
- Sachdeva, S.; Davis, R.W.; Saha, A.K. Microfluidic Point-of-Care Testing: Commercial Landscape and Future Directions. Front. Bioeng. Biotechnol. 2021, 8, 1537. [Google Scholar] [CrossRef]
- Al-Aqbi, Z.T.; Albukhaty, S.; Zarzoor, A.M.; Sulaiman, G.M.; Khalil, K.A.A.; Belali, T.; Soliman, M.T.A. A Novel Microfluidic Device for Blood Plasma Filtration. Micromachines 2021, 12, 336. [Google Scholar] [CrossRef]
- Asawakarn, S.; Pimpin, A.; Jeamsaksiri, W.; Sripumkhai, W.; Jitsamai, W.; Taweethavonsawat, P.; Piyaviriyakul, P. Application of a novel rectangular filtering microfluidic device for microfilarial detection. Front. Vet. Sci. 2023, 9, 2038. [Google Scholar] [CrossRef]
- Lo, S.-J.; Kuan, C.-M.; Hung, M.-W.; Fu, Y.; Yeh, J.A.; Yao, D.-J.; Cheng, C.-M. A Simple Imaging Device for Fluorescence-Relevant Applications. Micromachines 2018, 9, 418. [Google Scholar] [CrossRef]
- Chalam, K.V.; Chamchikh, J.; Gasparian, S. Optics and Utility of Low-Cost Smartphone-Based Portable Digital Fundus Camera System for Screening of Retinal Diseases. Diagnostics 2022, 12, 1499. [Google Scholar] [CrossRef] [PubMed]
- Ji, Y.; Kim, J.; Kim, J.; Lee, M.; Noh, J.; Jeong, T.; Shin, J.; Kim, J.; Heo, Y.; Cho, U.; et al. Reliability characterization of advanced CMOS image sensor (CIS) with 3D stack and in-pixel DTI. In Proceedings of the 2018 IEEE International Reliability Physics Symposium (IRPS), Burlingame, CA, USA, 11–15 March 2018; pp. 3D.3-1–3D.3-4. [Google Scholar]
- Filipovic, L.; Lahlalia, A. (Invited) System-on-Chip Sensor Integration in Advanced CMOS Technology. ECS Trans. 2018, 85, 151. [Google Scholar] [CrossRef]
- Smuck, M.; Odonkor, C.A.; Wilt, J.K.; Schmidt, N.; Swiernik, M.A. The emerging clinical role of wearables: Factors for successful implementation in healthcare. Npj Digit. Med. 2021, 4, 45. [Google Scholar] [CrossRef]
- Lee, S.M.; Lee, D. Healthcare wearable devices: An analysis of key factors for continuous use intention. Serv. Bus. 2020, 14, 503–531. [Google Scholar] [CrossRef]
- Vijayan, V.; Connolly, J.P.; Condell, J.; McKelvey, N.; Gardiner, P. Review of Wearable Devices and Data Collection Considerations for Connected Health. Sensors 2021, 21, 5589. [Google Scholar] [CrossRef]
- Sood, R.; Kaur, P.; Sharma, S.; Mehmuda, A.; Kumar, A. IoT Enabled Smart Wearable Device—Sukoon. In Proceedings of the 2018 Fourteenth International Conference on Information Processing (ICINPRO), Bangalore, India, 21–23 December 2018; pp. 1–4. [Google Scholar]
- Gv, D.R.; Eshwar, S.; Dhanamjayulu, C.; Ragul, M.; Senkathir, M. IoT Enabled Predicting Wearables for the Pandemic. In Proceedings of the 2021 Innovations in Power and Advanced Computing Technologies (i-PACT), Kuala Lumpur, Malaysia, 27–29 November 2021; pp. 1–7. [Google Scholar]
- Rao, S. IoT Enabled Wearable Device for COVID Safety and Emergencies. Int. J. Interact. Mob. Technol. 2021, 15, 146–154. [Google Scholar] [CrossRef]
- Wan, J.; Al-Awlaqi, M.A.A.H.; Li, M.; O’Grady, M.; Gu, X.; Wang, J.; Cao, N. Wearable IoT enabled real-time health monitoring system. EURASIP J. Wirel. Commun. Netw. 2018, 2018, 298. [Google Scholar] [CrossRef]
- Alonso, O.; Franch, N.; Canals, J.; Arias-Alpízar, K.; de la Serna, E.; Baldrich, E.; Diéguez, A. An internet of things-based intensity and time-resolved fluorescence reader for point-of-care testing. Biosens. Bioelectron. 2020, 154, 112074. [Google Scholar] [CrossRef]


| Analyte | Detection Platform | Detection Device | LOD | References |
|---|---|---|---|---|
| Bacteria S. aureus, S. pyogenes, E. coli, P. aeruginosa | Paper-based | Smartphone | <50 Cfu/mL | Sheini et al. [54] |
| Mycobacterium tuberculosis (Mtb) | Solution | Smartphone | 10 c.f.u | Xie et al. [55] |
| Fluoride ions | Paper-based | Naked eye | 0.285 μM | Yu et al. [73] |
| Chloride ions | Solution | Smartphone | 0.8 mM | Zhang et al. [74] |
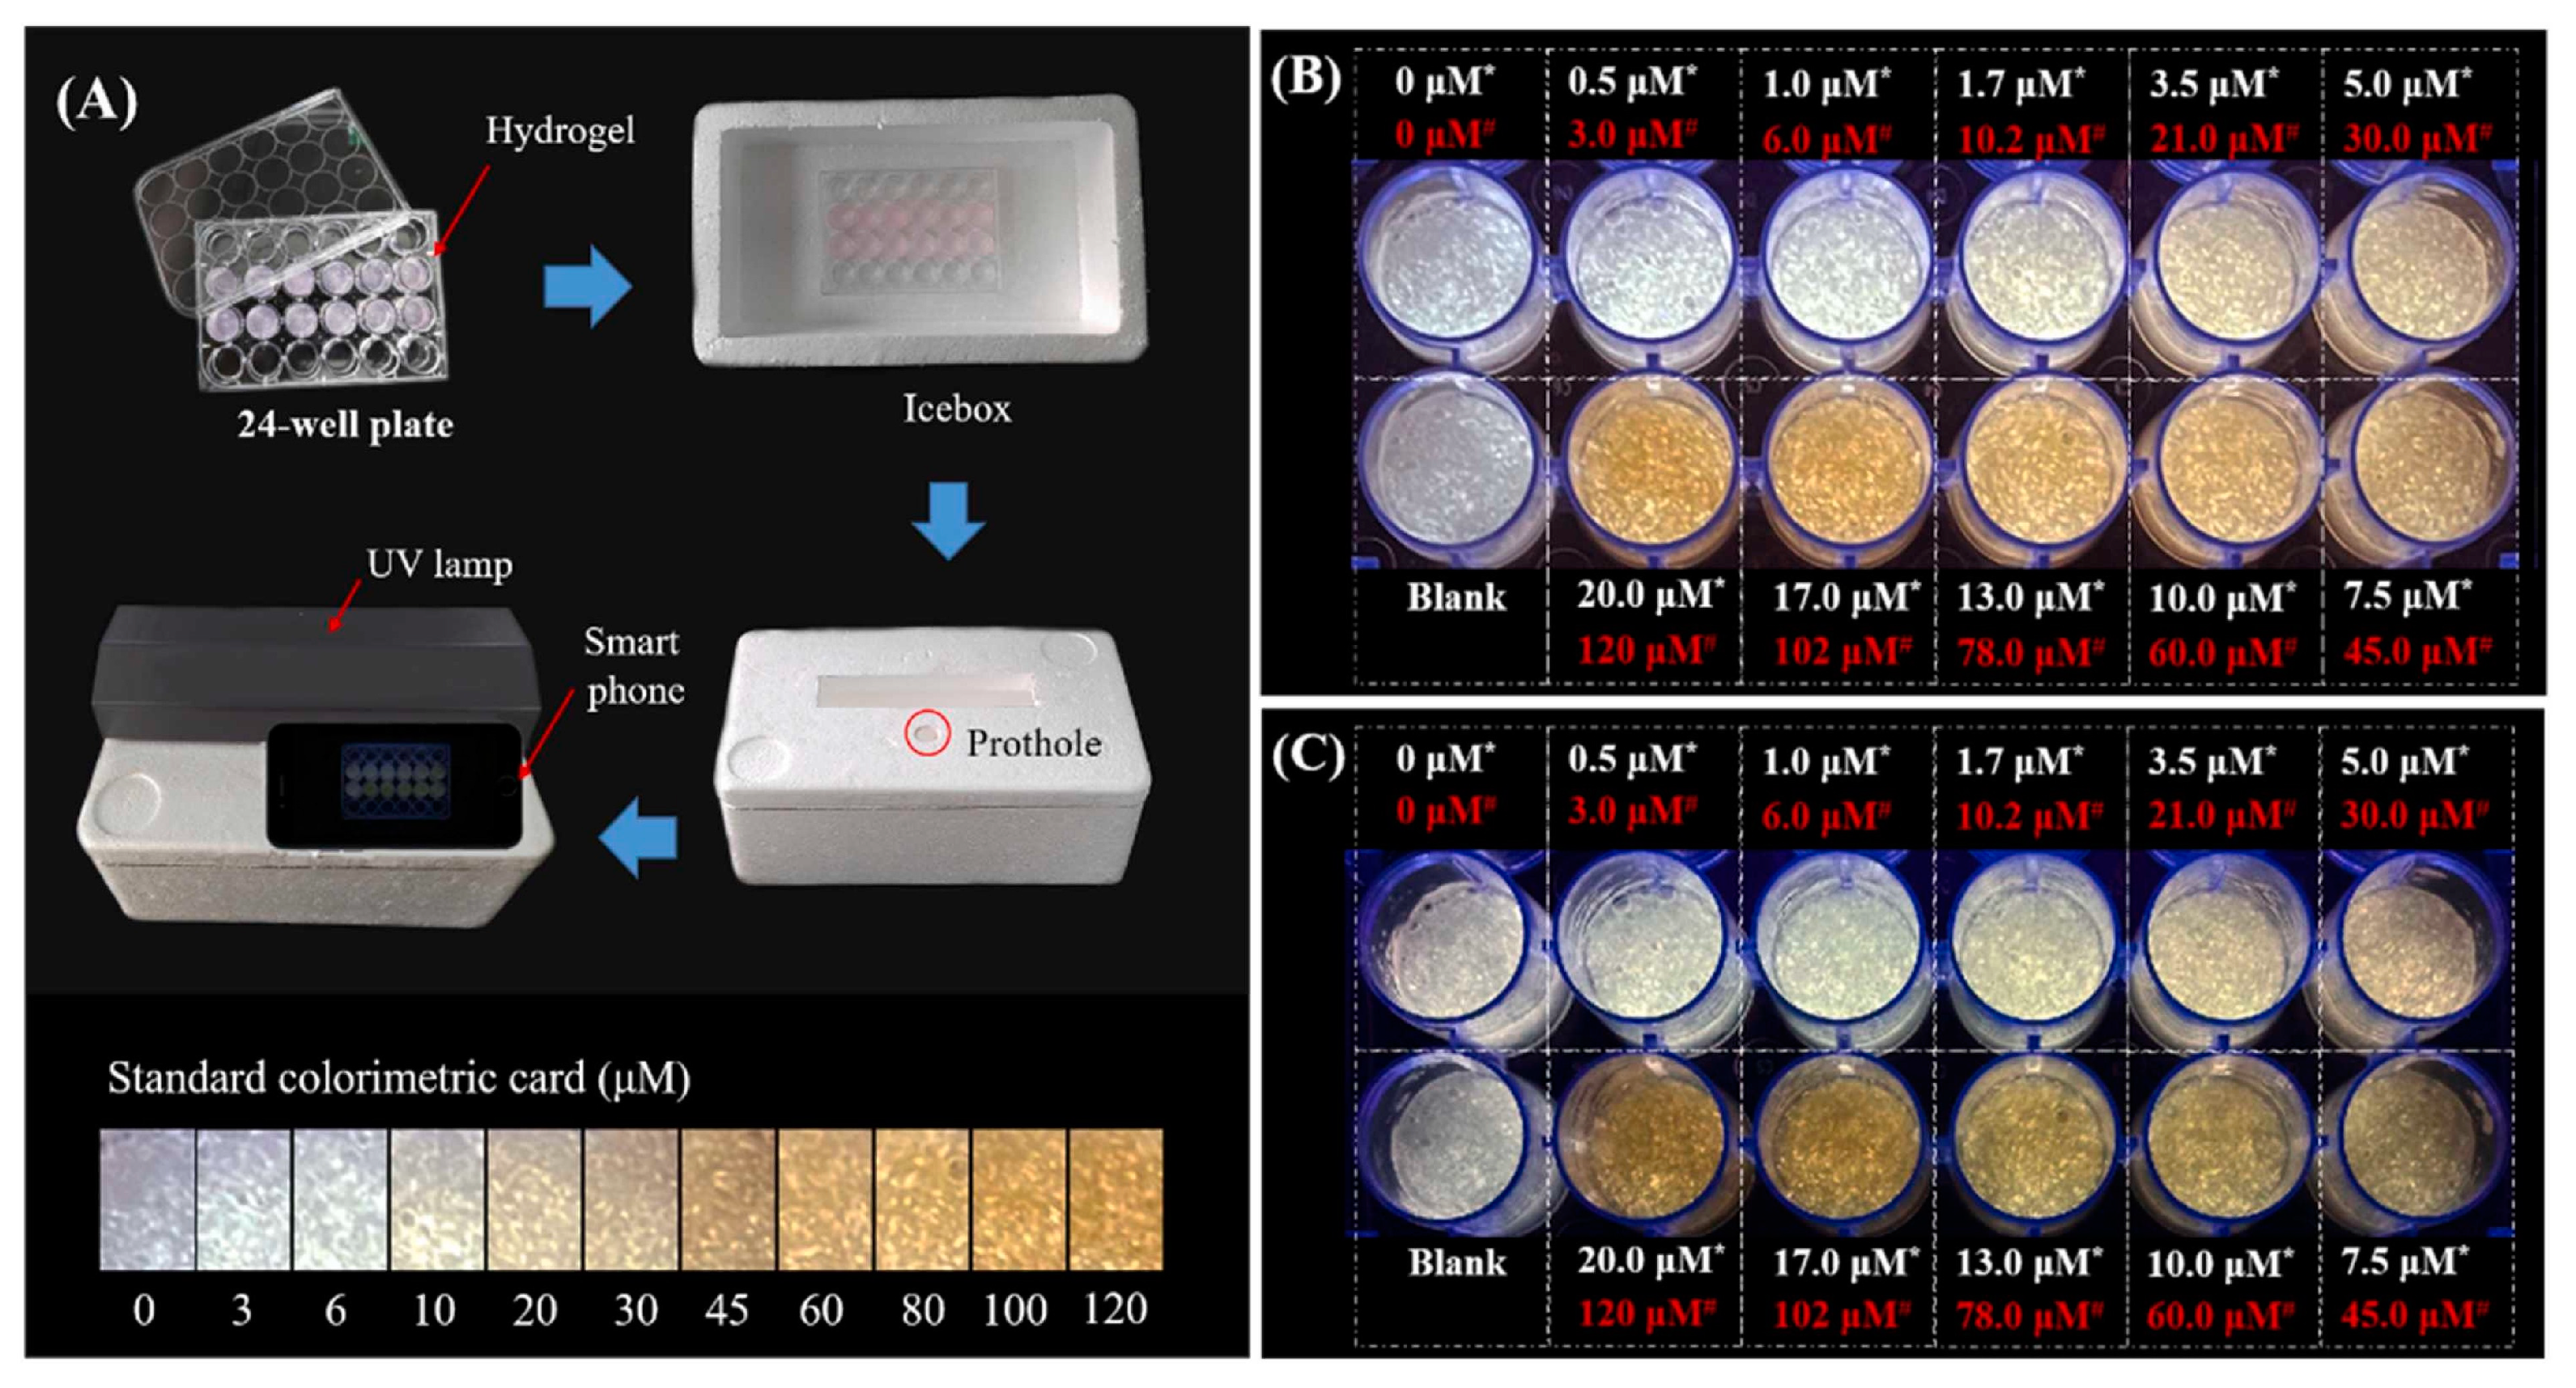
| Chromium ion | Hydrogel | Smartphone | 0.6 pg/mL. | Zhang et al. [75] |
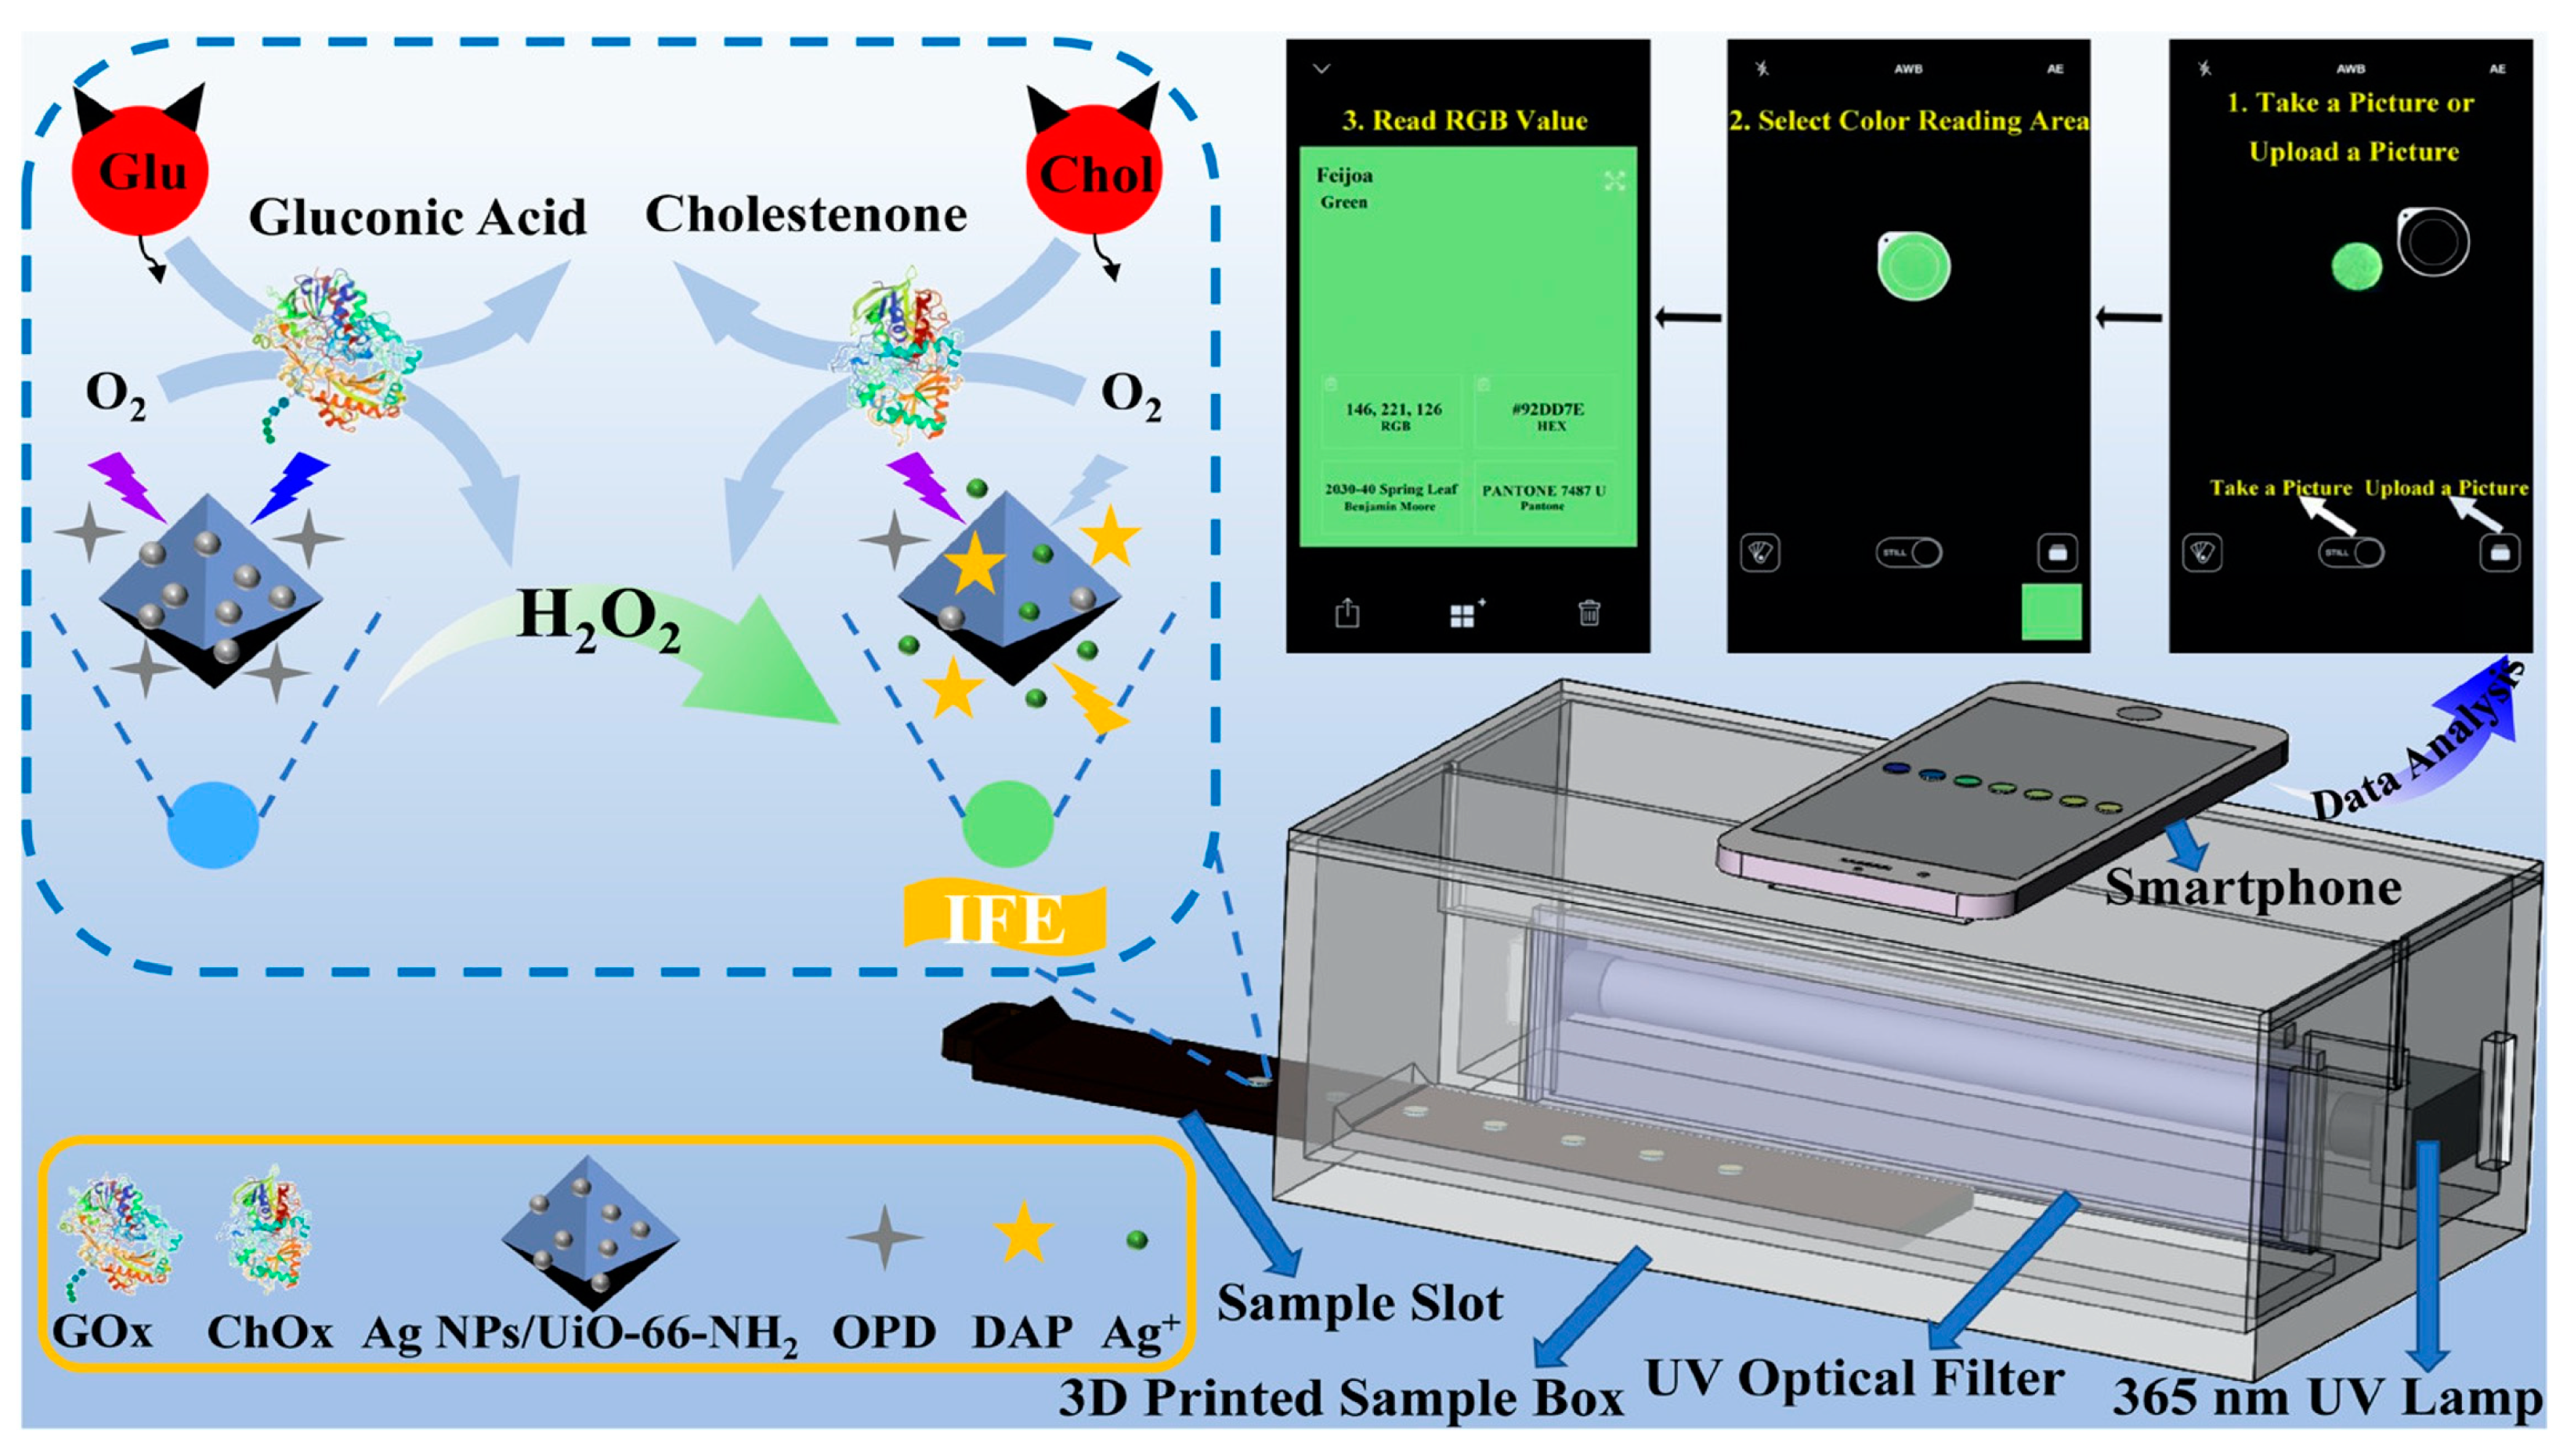
| Glucose and Cholesterol | Paper-based | Smartphone | 0.2 mmol/L (H2O2) 0.5 mmol/L (Glu) 0.7 mmol/L (Cho) | Guo et al. [80] |
| Bilirubin | Hydrogel | Smartphone | 25 nM | Wang et al. [81] |
| Trypsin | Paper-based | Smartphone | 0.08 μg/mL | Li et al. [87] |
| Albuminuria | Solution | Smartphone | ~61 nM. | Zhao et al. [95] |
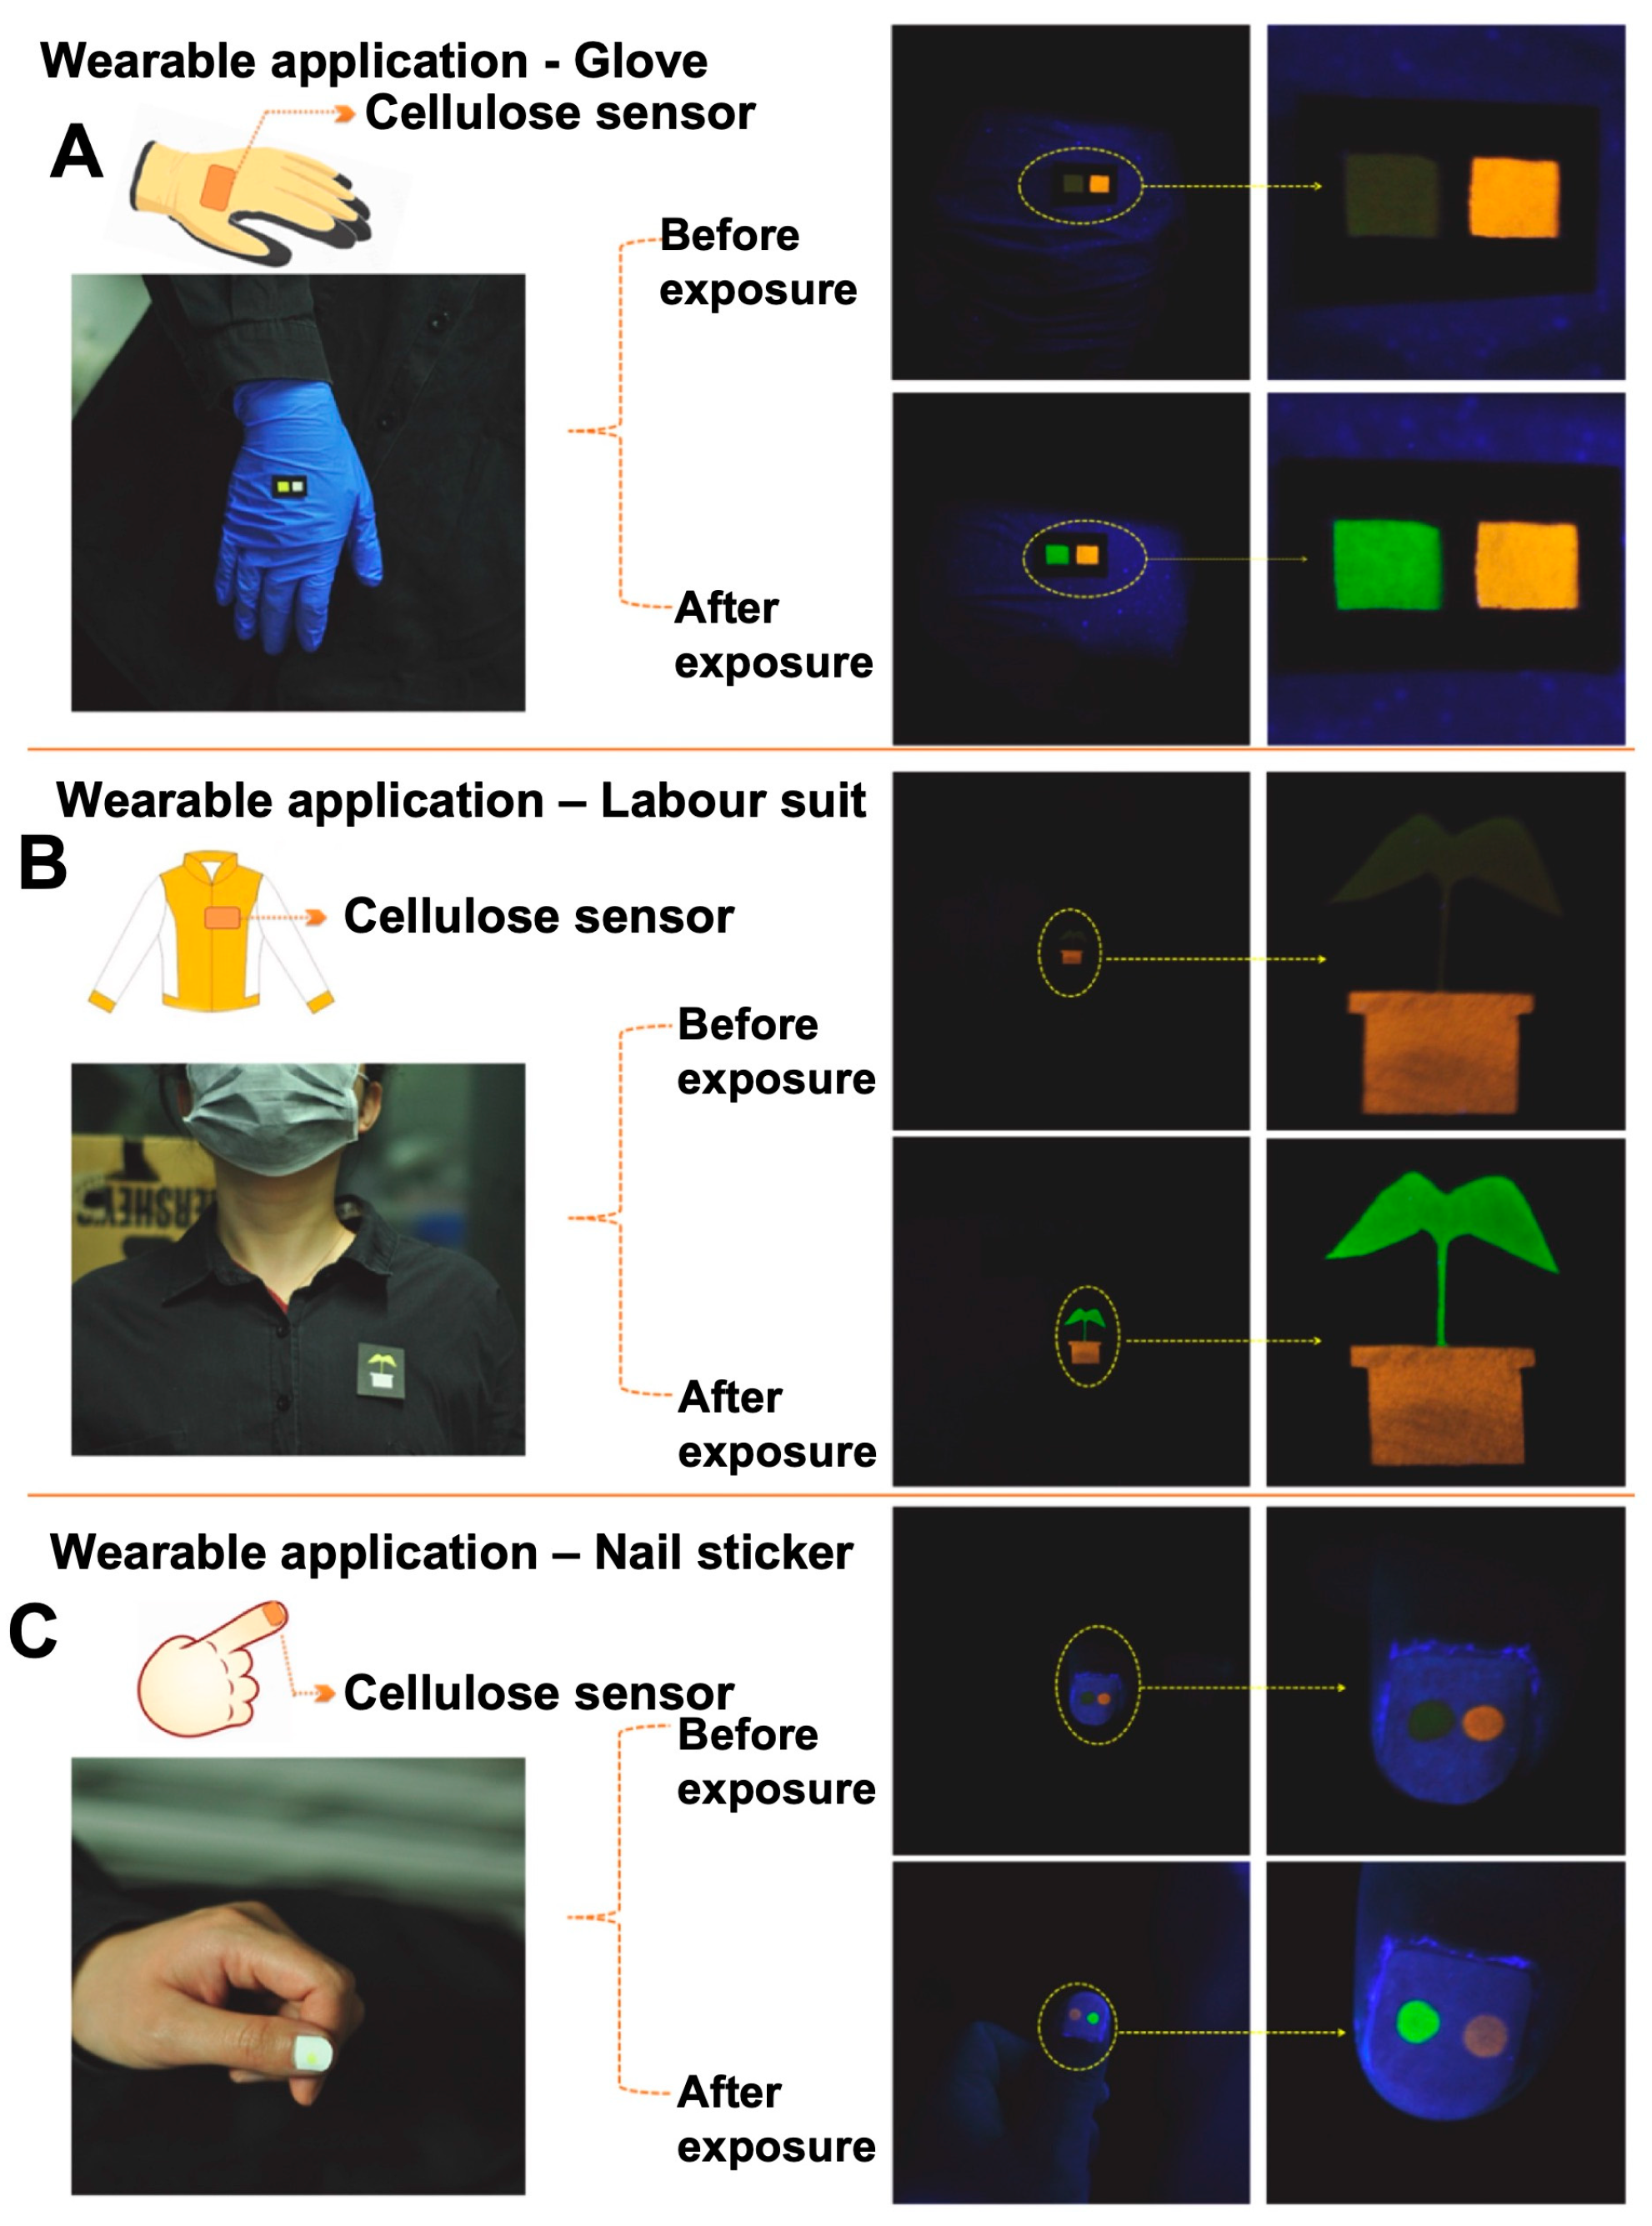
| VOCs | Paper-based | Wearable sensor, naked eye | 7.04 mg/m3 (1.8 ppm) | Mengyao et al. [101] |
| VOCs | Paper-based | Smartphone | - | Hyungi et al. [102] |
| Giardia lamblia cyst | Cellulose membrane | Smartphone | 12 cysts/10 mL | Koydemir et al. [106] |
| Tetracycline (TC) | Paper strips | Smartphone | 50 nM | Zhang et al. [116] |
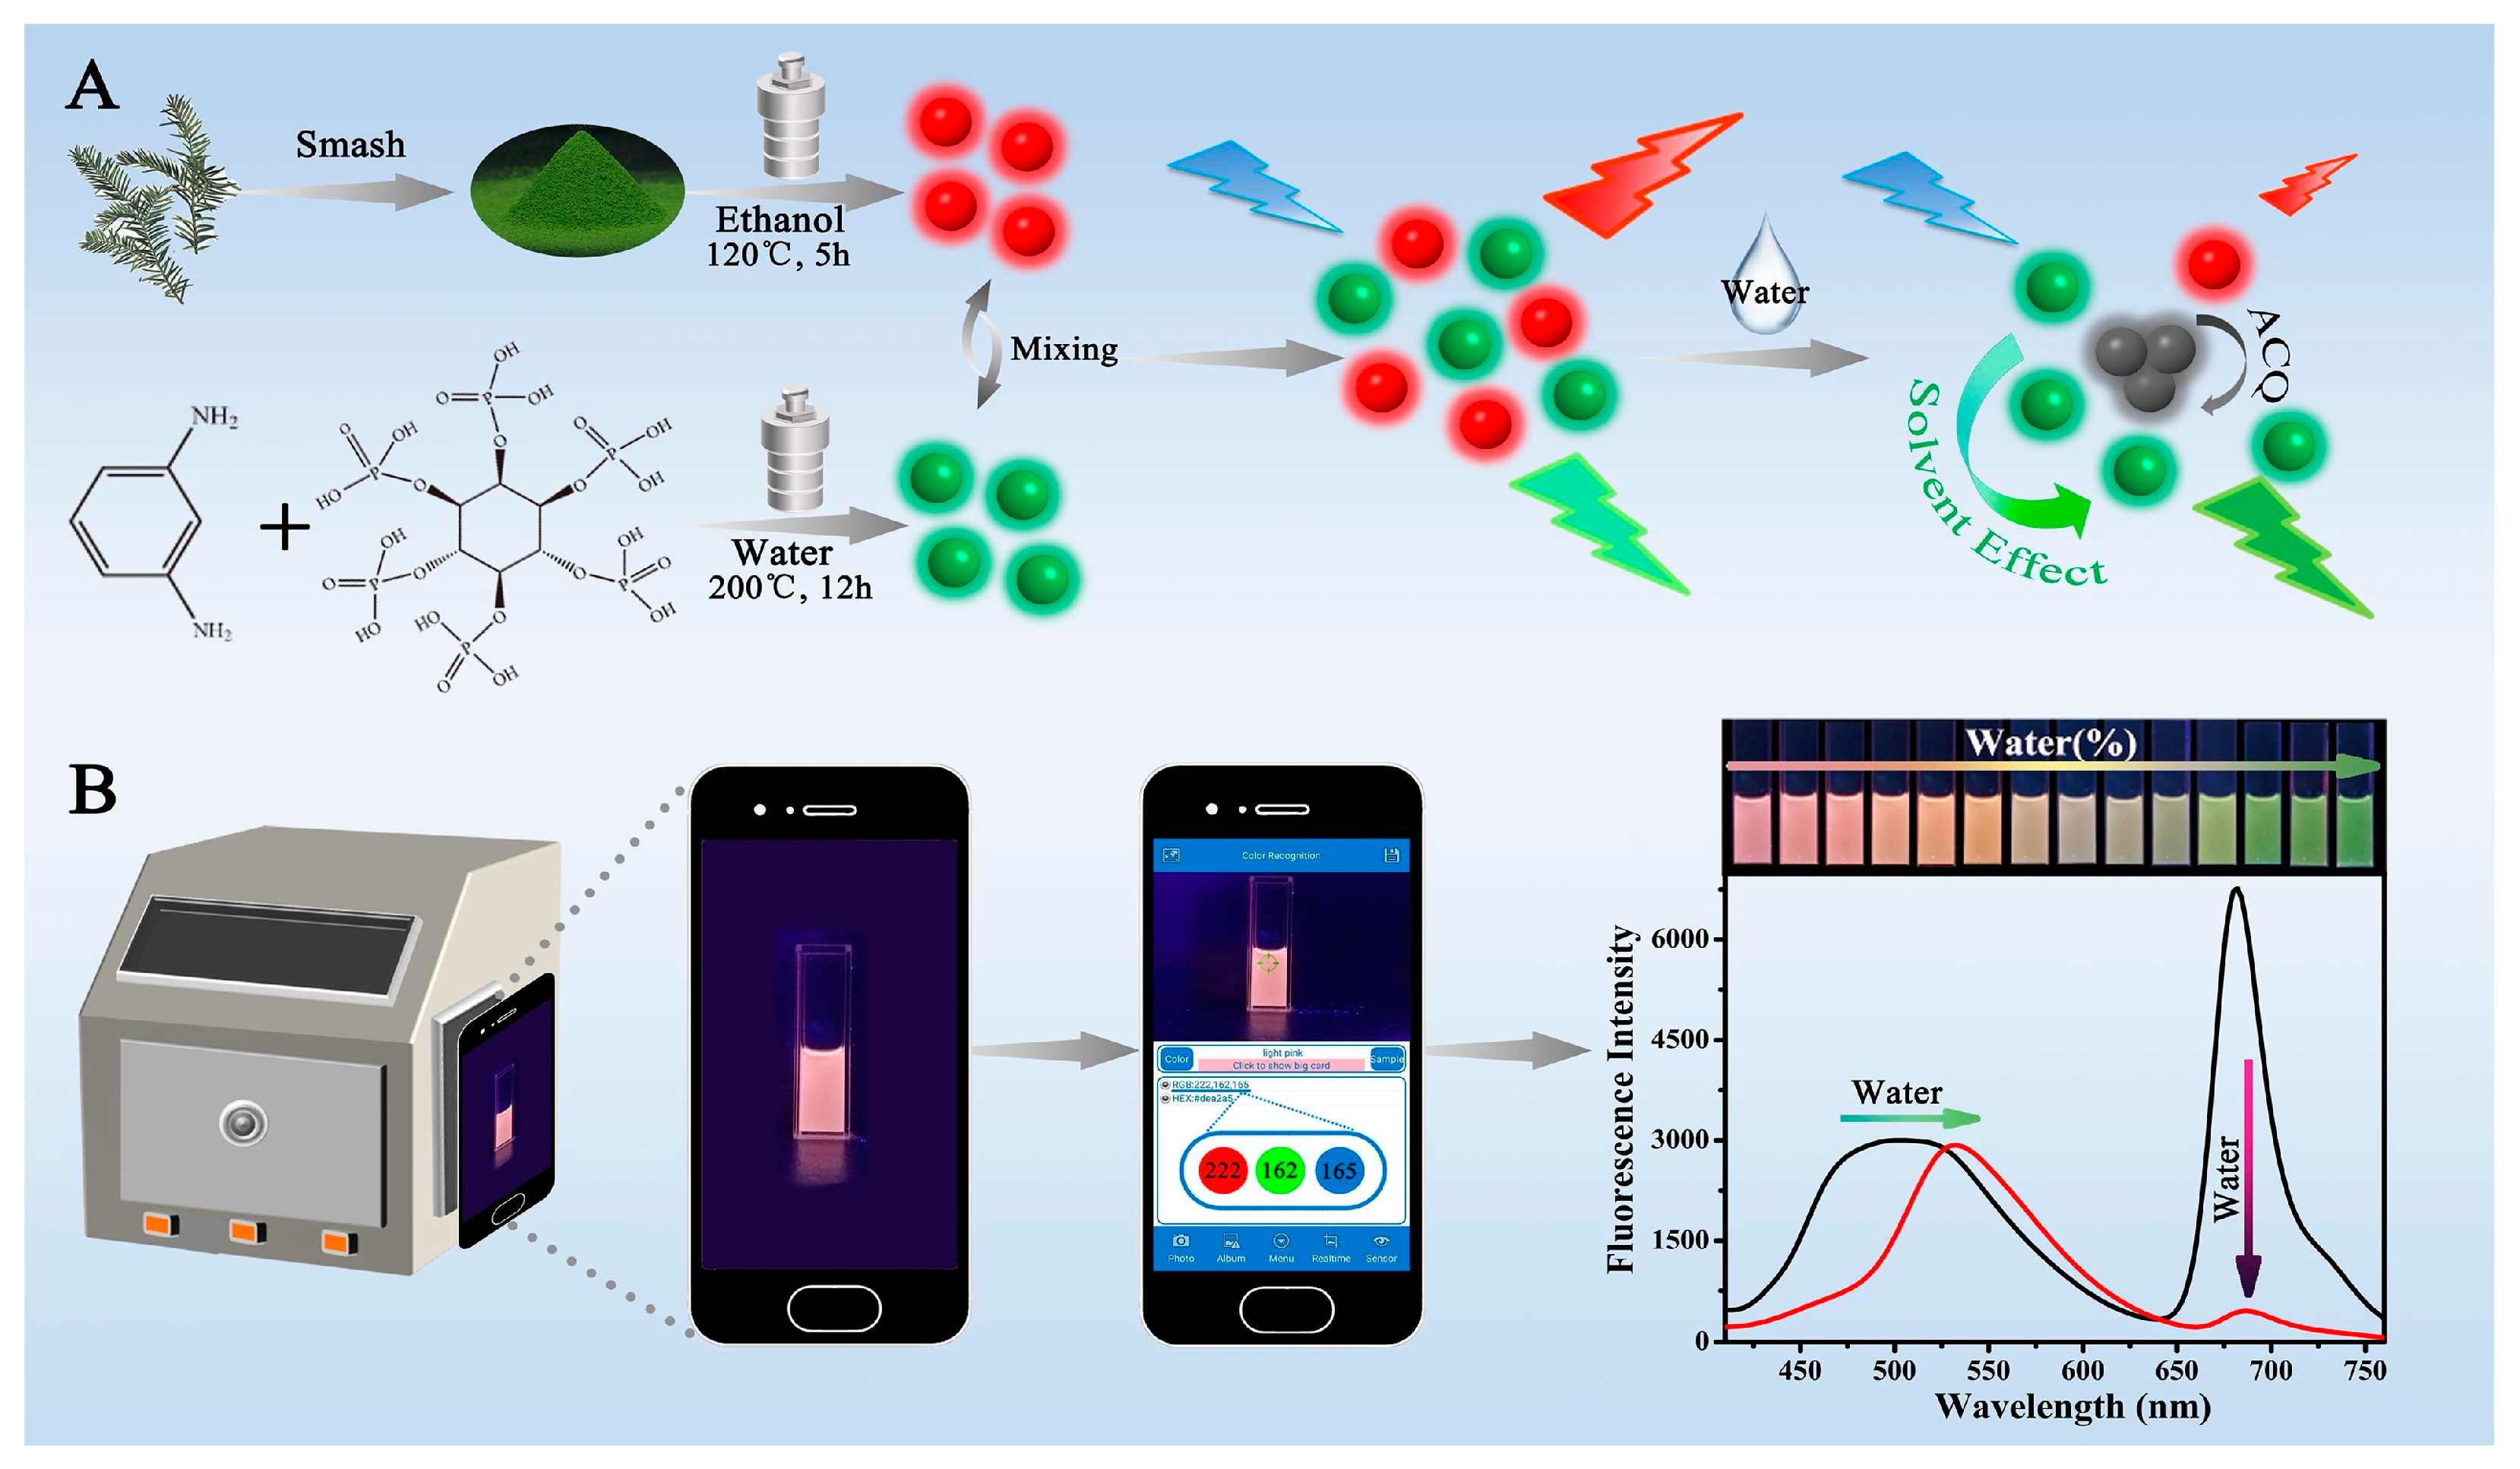
| Water | Solution | Smartphone | 1.2% | Liang et al. [121] |
Disclaimer/Publisher’s Note: The statements, opinions and data contained in all publications are solely those of the individual author(s) and contributor(s) and not of MDPI and/or the editor(s). MDPI and/or the editor(s) disclaim responsibility for any injury to people or property resulting from any ideas, methods, instructions or products referred to in the content. |
© 2023 by the authors. Licensee MDPI, Basel, Switzerland. This article is an open access article distributed under the terms and conditions of the Creative Commons Attribution (CC BY) license (https://creativecommons.org/licenses/by/4.0/).
Share and Cite
Nath, P.; Mahtaba, K.R.; Ray, A. Fluorescence-Based Portable Assays for Detection of Biological and Chemical Analytes. Sensors 2023, 23, 5053. https://doi.org/10.3390/s23115053
Nath P, Mahtaba KR, Ray A. Fluorescence-Based Portable Assays for Detection of Biological and Chemical Analytes. Sensors. 2023; 23(11):5053. https://doi.org/10.3390/s23115053
Chicago/Turabian StyleNath, Peuli, Kazi Ridita Mahtaba, and Aniruddha Ray. 2023. "Fluorescence-Based Portable Assays for Detection of Biological and Chemical Analytes" Sensors 23, no. 11: 5053. https://doi.org/10.3390/s23115053