Article

Vertical Farming Monitoring: How Does It Work and How Much Does It Cost?

1
TECNALIA, Member of BRTA (Basque Research Technology Alliance), 50018 Zaragoza, Spain
2
Department of Design and Manufacturing Engineering, University of Zaragoza, 50018 Zaragoza, Spain
*
Author to whom correspondence should be addressed.
Sensors 2023, 23(7), 3502; https://doi.org/10.3390/s23073502
Submission received: 24 January 2023 / Revised: 14 March 2023 / Accepted: 26 March 2023 / Published: 27 March 2023

Abstract

:
Climate change, resource scarcity, and a growing world population are some of the problems facing traditional agriculture. For this reason, new cultivation systems are emerging, such as vertical farming. This is based on indoor cultivation, which is not affected by climatic conditions. However, vertical farming requires higher consumption of water and light, since in traditional agriculture those resources are free. Vertical cultivation requires the use of new technologies and sensors to reduce water and energy consumption and increase its efficiency. The sensorization of these systems makes it possible to monitor and evaluate their performance in real time. In addition, vertical farming faces economic uncertainty since its profitability has not been studied in depth. This article studies the most important variables when monitoring a vertical farming system and proposes the sensors to be used in the data acquisition system. In addition, this study presents a cost model for the installation of this type of system. This cost model is applied to a case study to evaluate the profitability of installing this type of infrastructure. The results obtained suggest that the investment made in VF installations could be profitable in a period of three to five years.

1. Introduction

The rapid increase in the world’s population poses a challenge for agricultural production. More and more people need to be supplied, with greater problems. These include resource scarcity, climate change, and a shrinking rural population. The agricultural sector is currently facing these challenges (growing population, resource scarcity, and climate change) with the help of precision agriculture and new technologies, such as Artificial Intelligence (AI), business intelligence, or Internet of Things (IoT).
The acquisition of data through these technologies and their subsequent analysis and evaluation makes it possible to increase production and optimize the resources consumed [1]. However, there is still a lack of adequate skills among farmers to apply precision agriculture [2]. In this sense, the acquisition of variables for production control could improve the understanding of precision agriculture, enhancing systems control (temperature, light, nutrition, etc.) through a friendly interface, as identified by Morella et al. (2022) in their literature review [3].
Regarding the acquisition of data, IoT (Internet of things) technology is considered as a key for optimizing production in agriculture [4]. IoT can be defined as a System of Systems (SoS) whose elements are independent, situated, and temporarily networked to synergically provide advanced cyber–physical functionalities [5]. As an example, Namani et al. (2020) introduced a smart drone for crop management. The smart drone used IoT and Cloud Computing technologies to develop a sustainable agriculture by controlling the cost, and monitoring performance and maintenance. In this work it is shown that real time acquisition of data by IoT and its processing and visualization through Cloud Computing help reduce costs, increase efficiency, and make smarter decisions [6].
Due to the possibilities offered by new technologies, new business models have emerged in the sector. Particularly, this paper is focused on Vertical Farming (VF). VF tries to overcome the horizontal agriculture to achieve more efficiency. VF was defined by Sharath Kumar et al. (2020) as “a multilayer indoor plant production system in which all growth factors, such as light, temperature, humidity, carbon dioxide concentration ([CO2]), water, and nutrients, are precisely controlled to produce high quantities of high-quality fresh produce year-round, completely independent of solar light and other outdoor conditions. This control can be fully automated by using sensors and imaging techniques in combination with crop simulation models and artificial intelligence” [7].
Currently, VF is expanding rapidly thanks to the increasement of consumer demand for sustainable, local, and fresh products, and the development of affordable lighting technologies [8]. Specific soil and climate conditions are not necessary for VF, so it enables the cultivation in disadvantaged climatic areas and reduces the soil pollution. In addition, the yield per area is higher than traditional agriculture. However, there are some disadvantages in comparison with traditional agriculture. Outside, in traditional agriculture, light, CO2 and water are free. Whereas in VF they must be assumed as cost [9]. Therefore, the use of new technologies in VF are crucial to minimize these costs and their environmental implication.
VF is introducing new technologies to face these challenges. For example, AI is being used for monitoring crop growth in VF increasing production, for example, color images are used to monitor crop growth [10]. In addition, AI can predict plant behavior [11]. Regarding the use of sensors and IoT technologies, they can be used for controlling and increasing the efficiency of water use, as can be seen in Ref. [12]. Moreover, Sivamani et al. (2013) proposed a combination of sensors and technologies for monitoring and automatically controlling VF [13]. However, as it is suggested in Saad et al. (2021), it is necessary for the combination of IoT, big data, and cloud computing technologies to develop a decision-making tool to improve, among others, productivity, quality, and costs [14]. Moreover, the financial uncertainty of VF is another challenge around this new agriculture [15]. There is not a specific cost model where all the costs, including sensors and IoT architecture, are considered.
Our research proposes a methodology to acquire the real-time data by sensors and IoT devices to show relevant information for VF farmers. Furthermore, we provide a detailed cost analysis of VF infrastructure and estimate the viability of VF implementation in a case study. Once the terminology has been conceptualized in this section, Section 2 proposes the methodology for acquiring data in real time and for estimating costs. After that, we present and discuss the results of the estimation. The paper ends with the conclusions and proposals for future studies.

2. Materials and Methods

Our methodology is divided into three steps. First, we analyzed what are the relevant variables for measuring VF production and what sensors can acquire those variables. After that, we describe the monitorization platform using IoT technology. Finally, the cost structure for VF infrastructure is presented.

2.1. Identifying Relevant Variables and Sensors for VF Monitoring

Analyzing previous studies about IoT implementation in VF [16,17], we have identified a common trend regarding used variables. Thus, the variables and Key Performance Indicators (KPIs) that can provide important information about the process are described below. Regarding carbon footprint calculation, a CO2 sensor and a network analyzer are required. Both variables, CO2 emissions and electricity consumption, will be used to calculate the carbon footprint.
Water footprint requires monitoring water consumption through a flowmeter. Humidity (both soil and ambient) inform us about the evaporation process, which must be included in water footprint calculation, and the water intake of the plants. When the humidity level is high, the stomata are open and absorb CO2, whereas if the humidity is low, the stomata tend to close. By measuring this variable, optimal water conditions for plant growth can be controlled. For example, an excess of humidity could lead to the presence of fungi in the plants, a fact that is very detrimental to the process, so it should be kept within the appropriate limits for crop growth [18]. Another necessary variable for measuring water footprint is ambient temperature. Each type of crop requires different temperature conditions for the different phases of its growth. Excessive temperature can damage the leaves of the crop and, therefore, the development of the plant. Therefore, a humidity and temperature sensor is required for measuring both variables in VF installations. In addition, we need a soil humidity sensor for specifically measuring the soil humidity.
Furthermore, there are three eco-physiological properties that are measured:
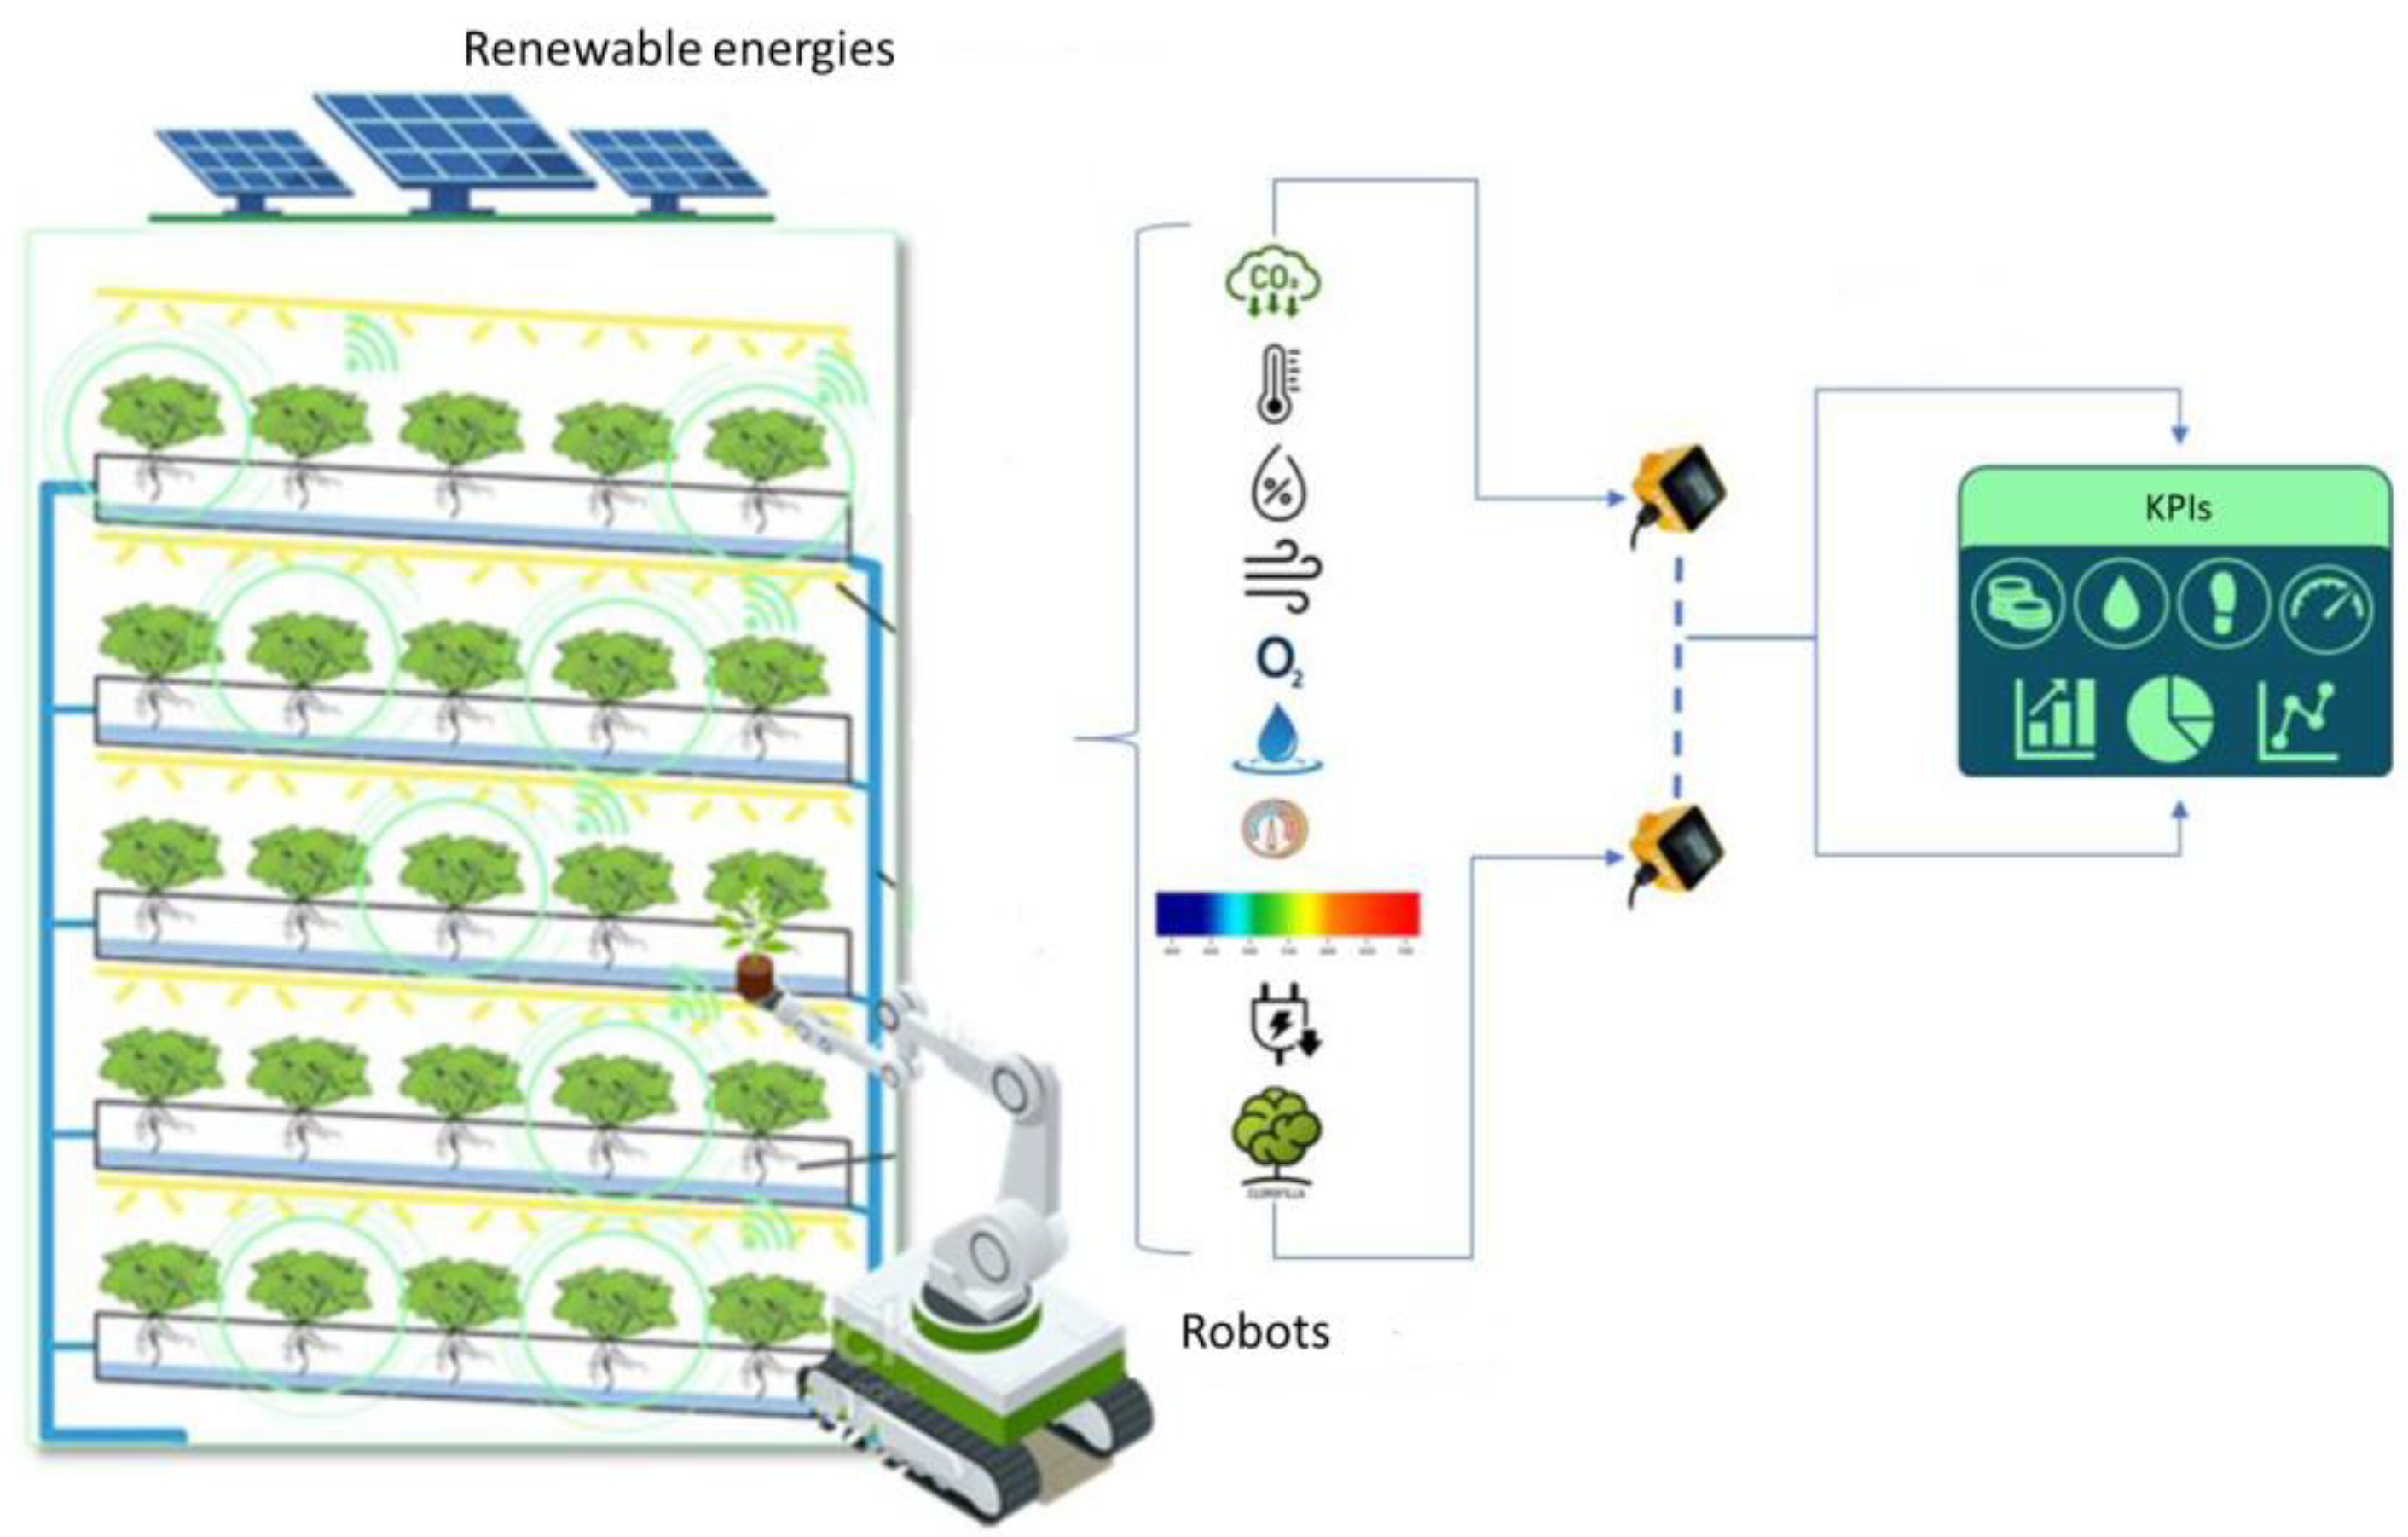
  • Crop growth: measured by the CO2 and O2 levels. The CO2 level is essential for plant photosynthesis to occur and for the correct development of the crop [19]. The O2 level is very relevant during the growth process of crops, because, if it is not in the right range, the plants receive neither enough oxygen nor water and therefore, they can no longer absorb nutrients properly, ending in crop death due to the lack of nutrition [19];
  • Evapotranspiration: crop water requirements decrease and therefore, water management is more efficient since water is only supplied when the plant requires it [18]. Evapotranspiration is measured by air flow and vapor pressure. Air flow can affect crop development (it can damage leaves, break branches, soil erosion, etc.) and hinder the application of agrochemicals. Wind has two important variables: direction and speed, and it can be dry, cold, wet, etc. [20]. In addition, it is directly related to the pressure and, therefore, to the admission of CO2 by the leaves [18]. Regarding vapor pressure, air vapor pressure must be lower than vapor pressure inside the stomatal cavity of the plant to drive transpiration. This fact is crucial for photosynthesis to develop properly; therefore, this variable must be within the appropriate range to ensure good CO2 uptake. A wind speed sensor and a steam pressure sensor are necessary;
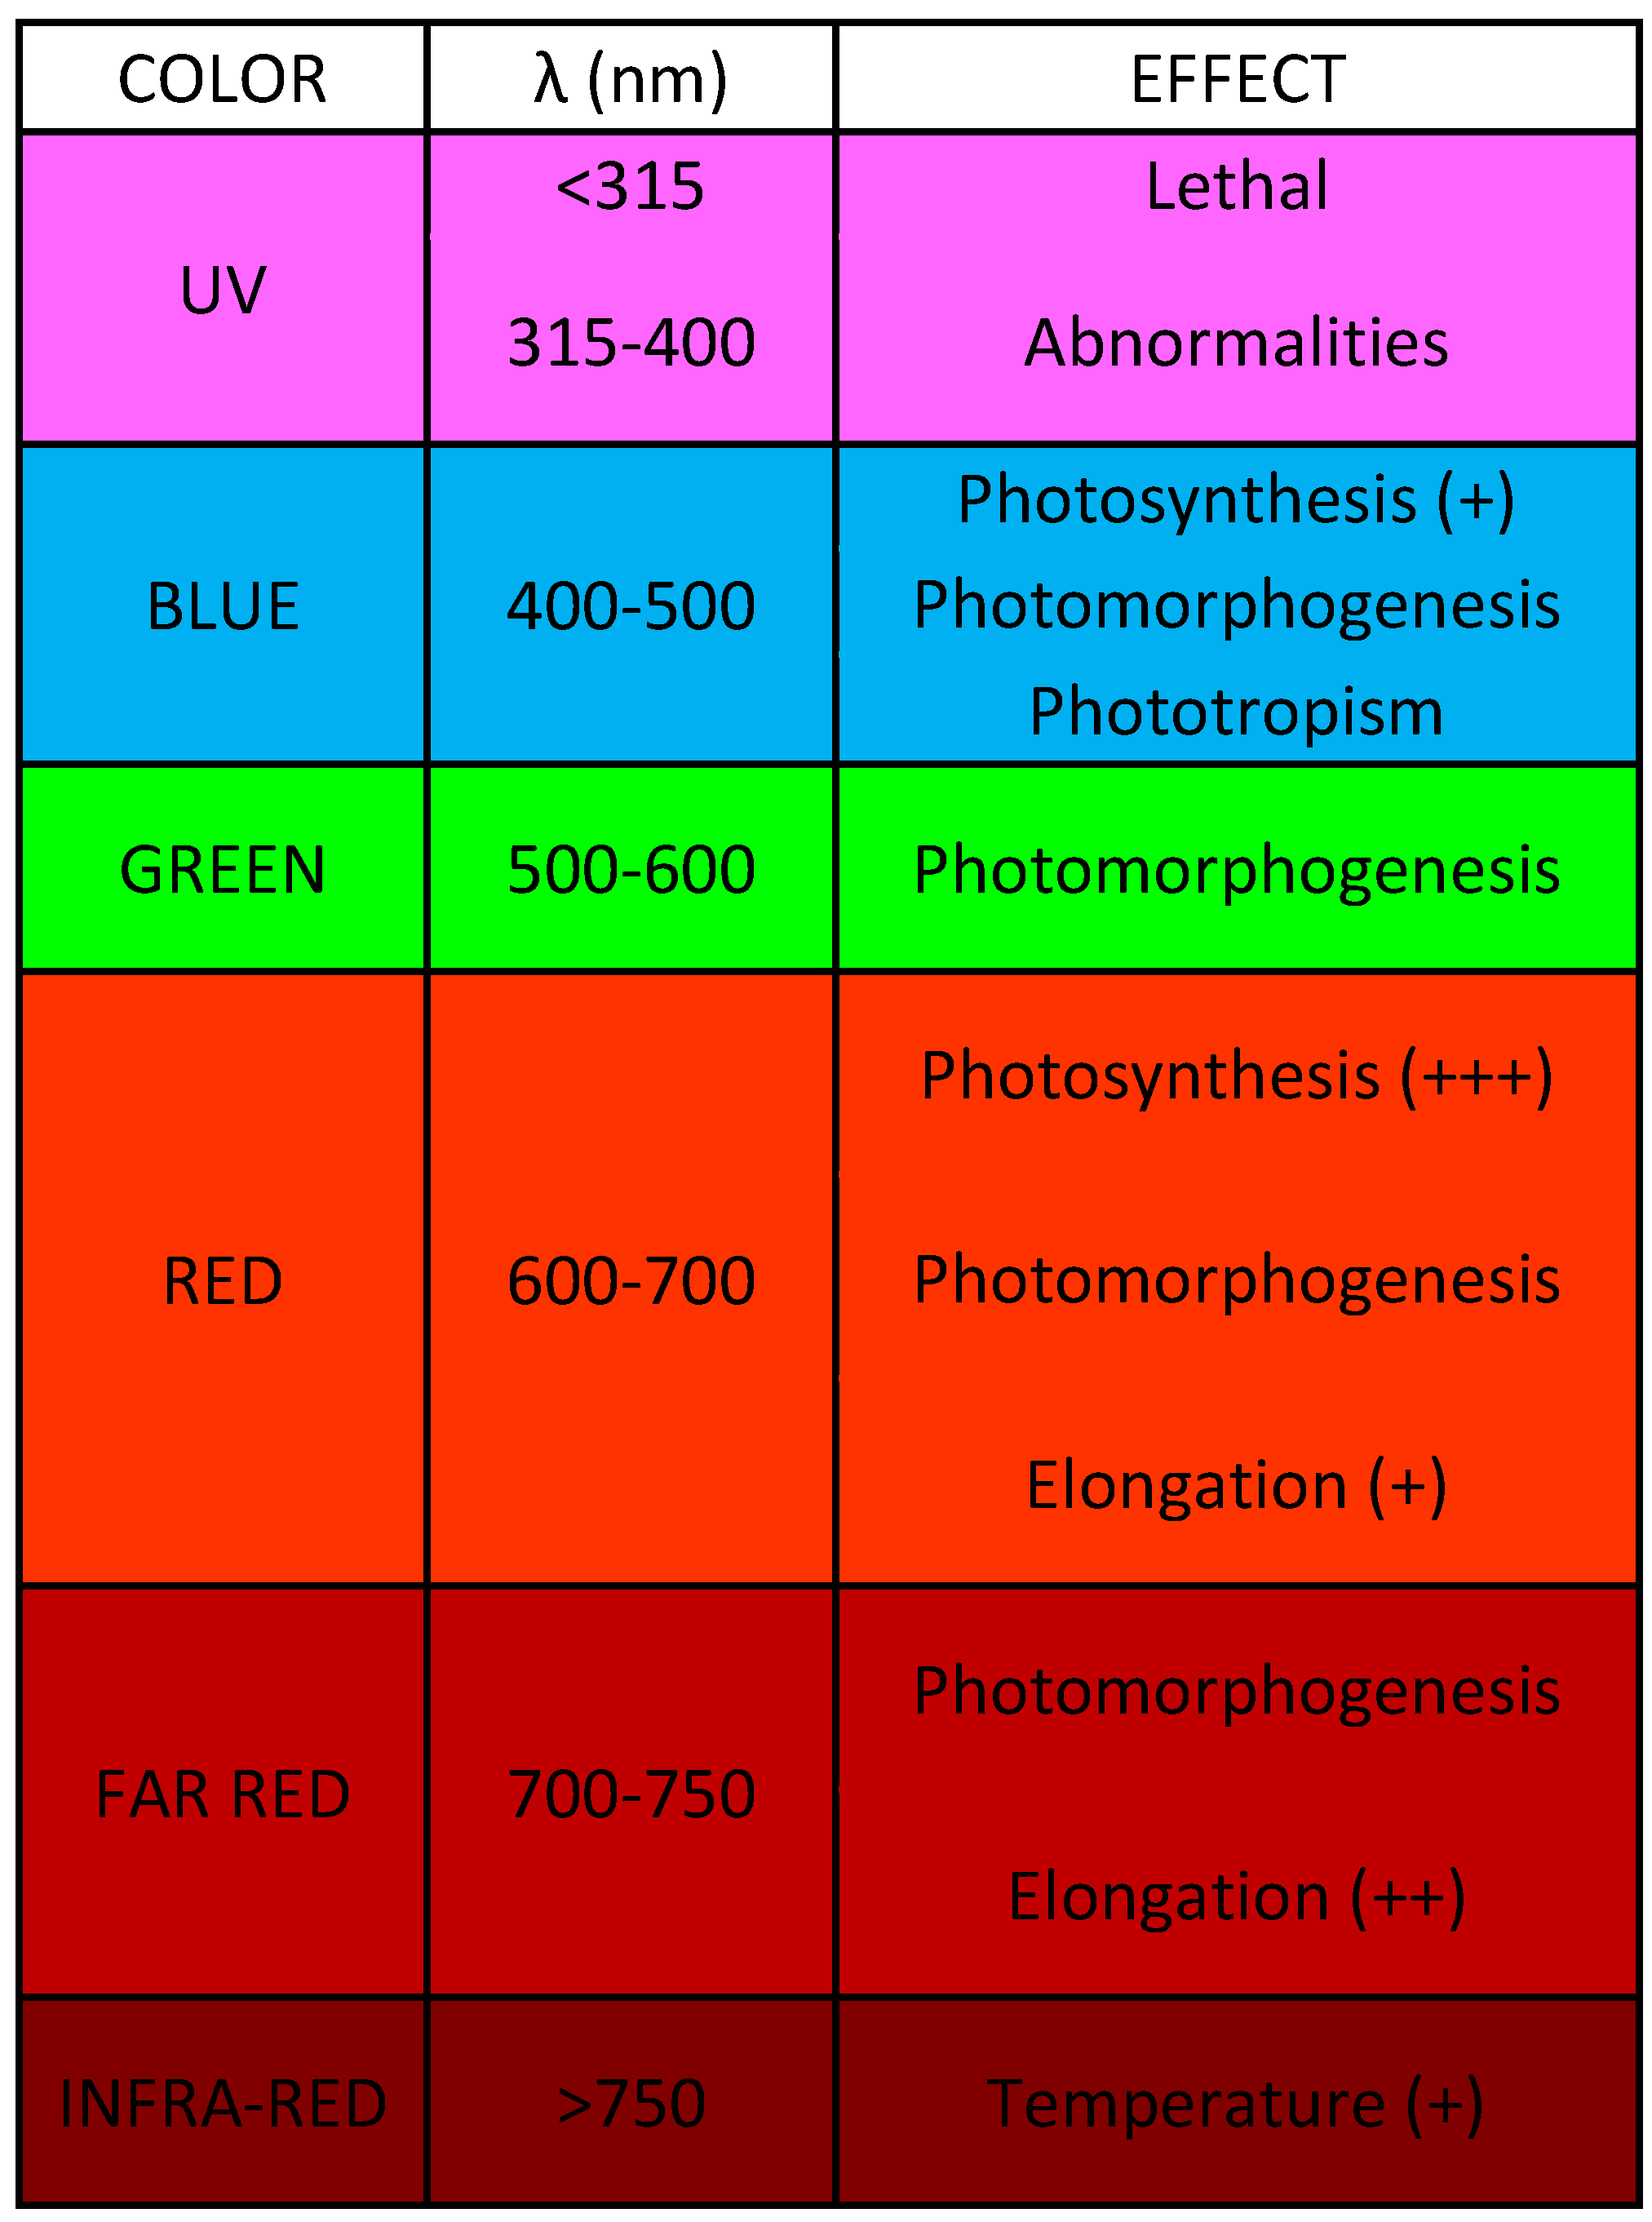
  • Light characteristics: monitoring the light characteristics is crucial for the process because the use of light-emitting diodes (LEDs) as light sources can initiate and maintain photosynthesis reactions—just as sunlight does [21]. The measured light variables to improve crop growth are optical wavelength, illuminance (lux), and irradiance intervals. Illuminance is the amount of luminous flux that a surface receives per unit area, assumed to be uniformly illuminated. Regarding wavelength range, due to the eco-physiological aspects of crops, light in the blue range is usually needed in the initial phase of the growth process, while red light is required in the final phase [22]. In Figure 1 one can see in more detail the effect of wavelength on the growth process of the plant. This radiation is expressed as synthetic photon flux density, i.e., the total number of photons between 400 and 700 nm per surface area and time (μmol/m2/s). Finally, the intensity of photosynthetically active radiation (PAR), that is, the fraction of light in the radiation, ranges from 400 to 700 nm, which drives plant photosynthesis. These characteristics are measured by a silicon pyranometer smart sensor.
  • Chlorophyll content: chlorophyll is a green pigment found in plant leaves. It is a photoreceptor, i.e., it captures light and uses it to perform photosynthesis and create both sugars and nutrients that feed the plant. Therefore, chlorophyll content is directly related to nutrients (nitrogen) and therefore it is important to know its content for proper crop growth [21]. So, a chlorophyll content sensor is crucial to know if the crops are growing well.
All the KPIs and variables are summarized in Table 1.

2.2. IoT and Data Acquisition Arquitecture
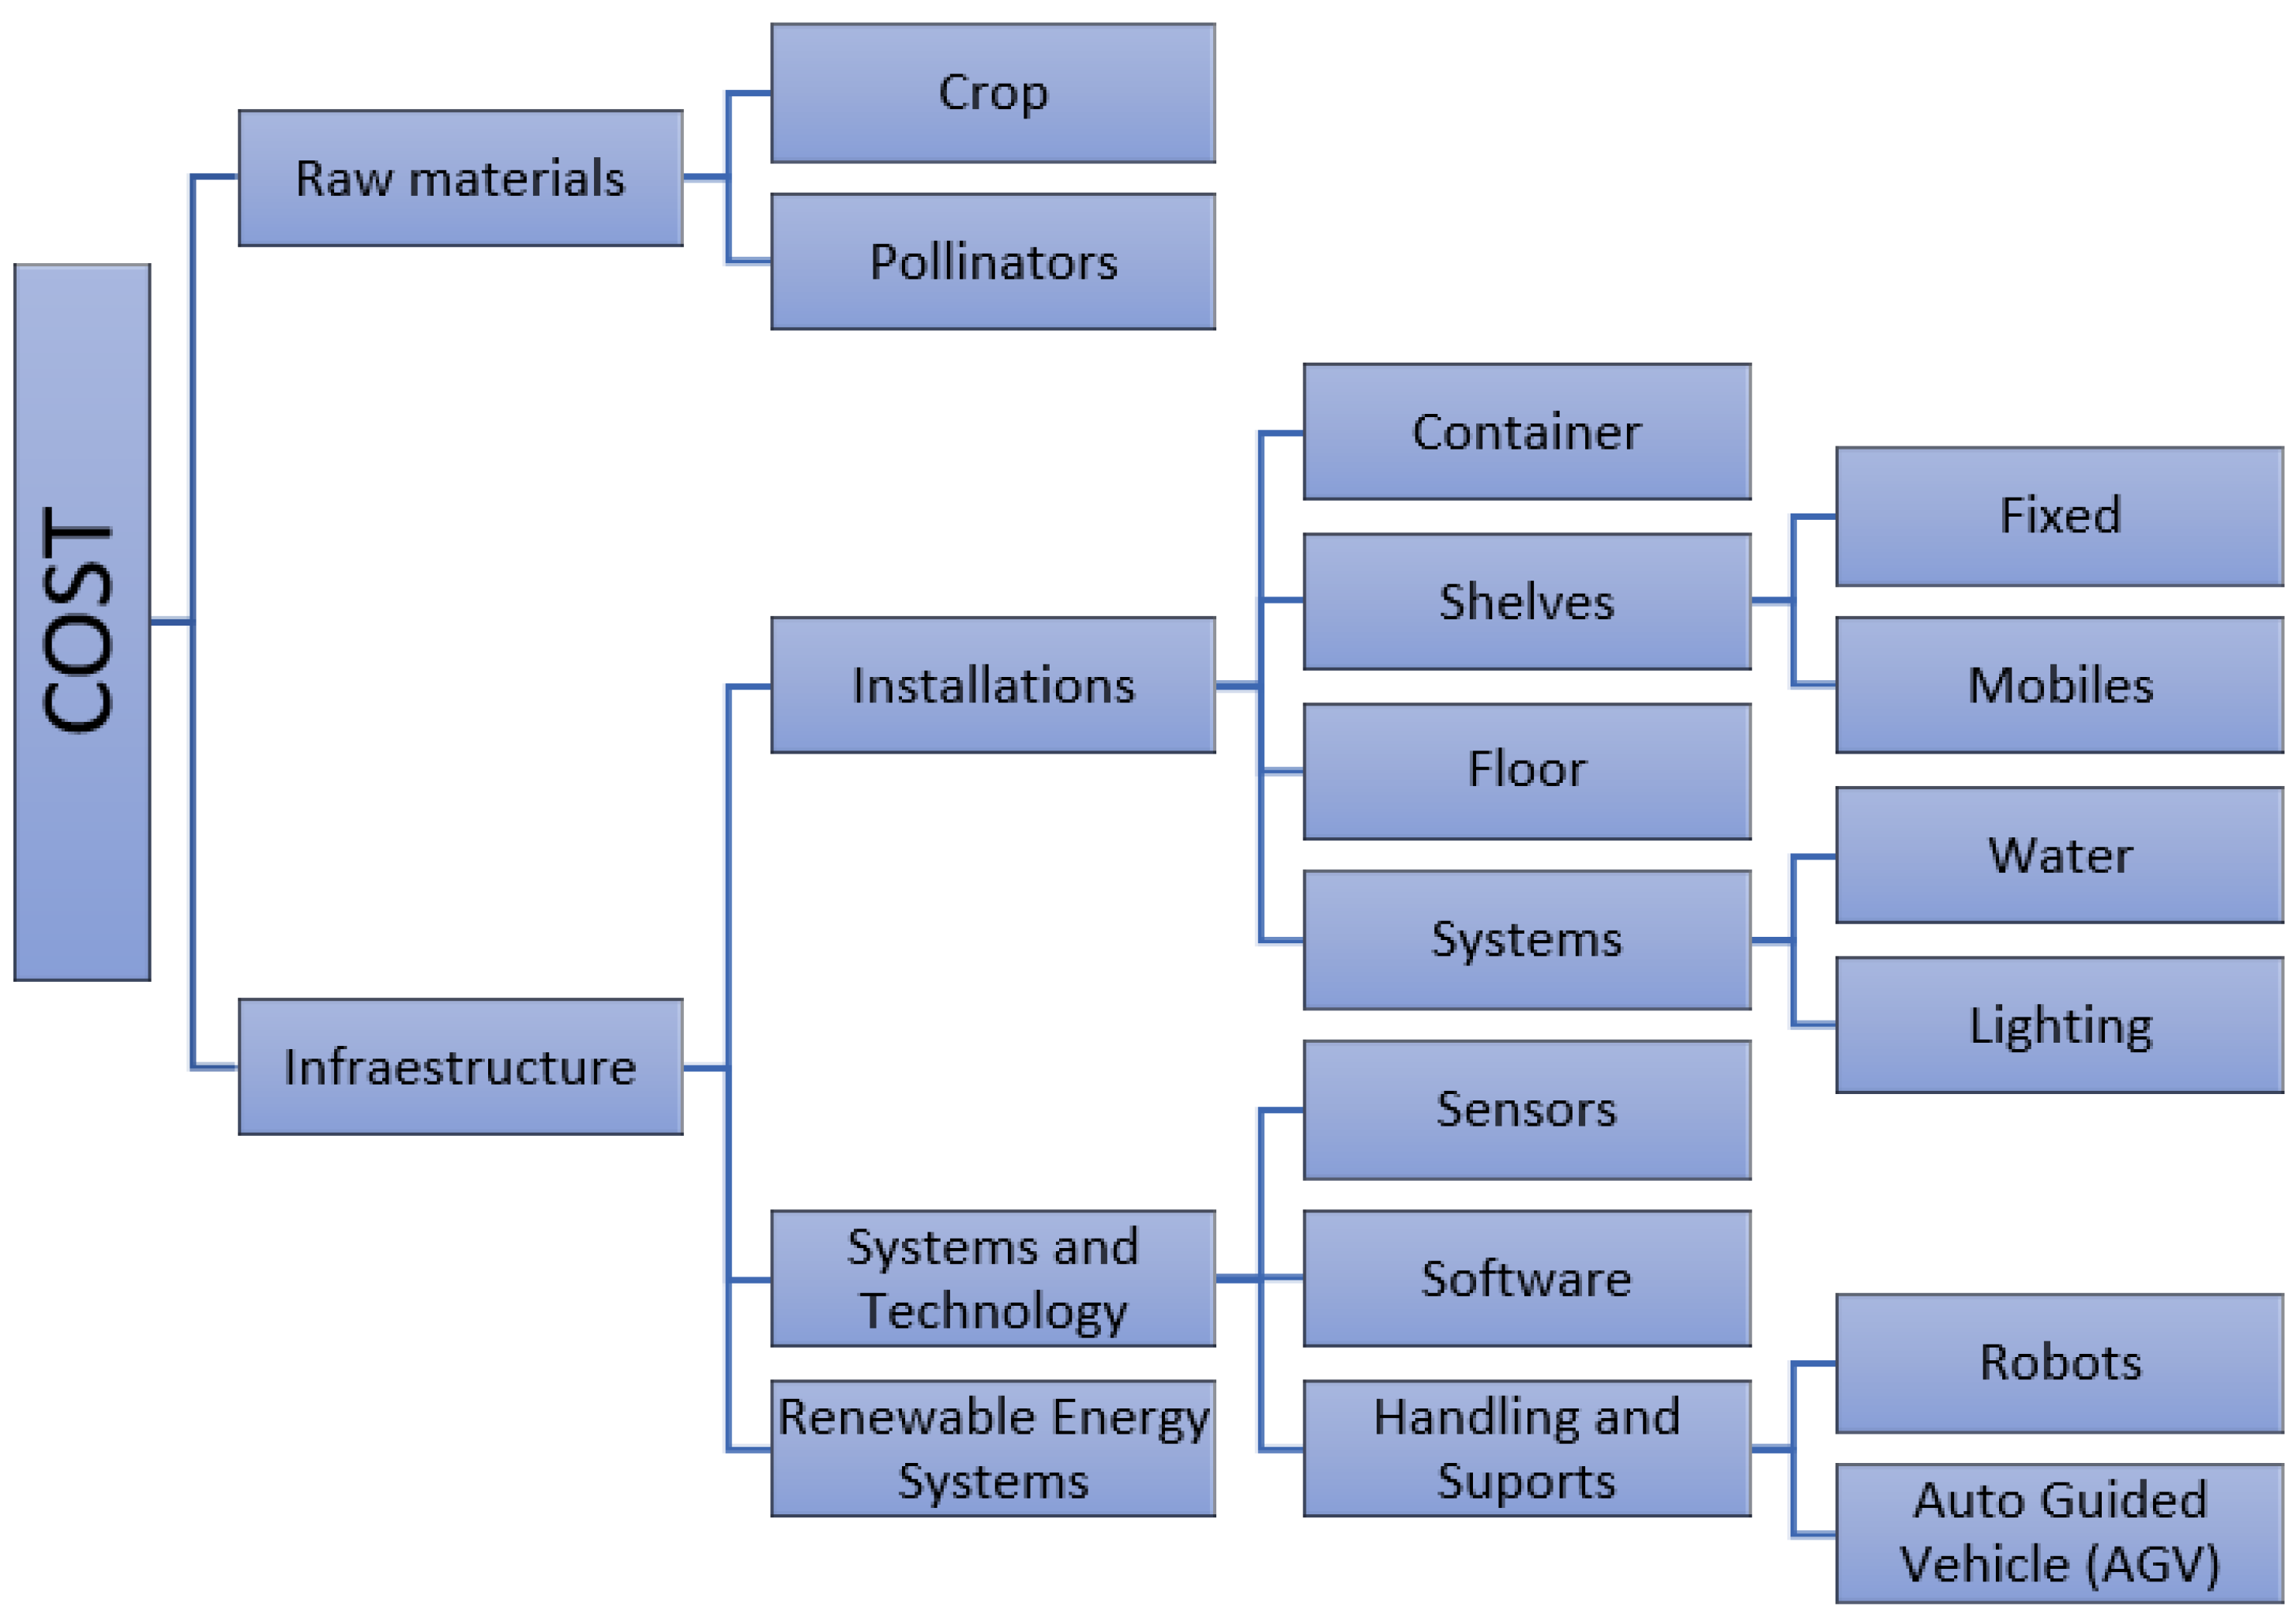
It is necessary to develop a data acquisition system based on IoT because the key to VF is monitoring and controlling the cultivation from the outside. This system can be used in agricultural environments to collect data on the variables presented in Section 2.1.
This system will be distributed, wireless, and based on measurement nodes. In addition, it will be able to connect remotely, in case there is a network connection, and to operate with a local server.
The data obtained from the sensors presented in the previous section are captured through an IoT device. This device is a microcontroller with WIFI capability and is prepared for hostile environments. Additionally, it is reprogrammable according to the requirements of the process and has the possibility of integrating long distance communications through specific modules. Sensors acquire the data in a period time of 15 min and the IoT device sends the information to the cloud in a period time of 30 min. Therefore, the visualized information is refreshed every 30 min.
As a result, the IoT architecture in VF is presented as follow (see Figure 2).

2.3. Cost Structure

Regarding the costs associated with the VF infrastructure, no approach has been detected in the literature review that shows how to calculate the cost of production in this new VF system.
After reviewing and investigating these new VF systems, studying the operations, needs, and requirements of the production process, this work proposes a model for calculating the cost of implementing this type of farming (see Figure 3).
As shown in the diagram above, the total cost of the infrastructure (CVF) is calculated by adding the following terms (Equation (1)):
CVF = Craw material + Cinfrastructure
The calculation of each block is detailed below.
Cost of raw materials (Craw material) refers to the acquisition cost of those elements from which the consumer products are obtained; in this case they will be (Equation (2)):
Craw material = Ccrop + Cpollinators
The cost of the infrastructure (Cinfrastructure) includes all those facilities, systems, and technologies that are used and are necessary in the VF cultivation process.
The cost of all the infrastructure involved in the process can be defined by the following expression (Equation (3)):
Cinfrastructure = Cinstallations + Csist&tech + Crenewable energy systems
The cost of installations includes all those physical facilities that are necessary for production (water, artificial lighting, etc.) and the furniture necessary to house the crops. Thus, the cost of the facilities will be (Equation (4)):
Cinstallations = Ccontainer + Cshelves + Cfloor + Csystems water & lighting
The cost of systems and technologies (Csist&tech) includes those technologies necessary for the measurement processes of the variables, their control, handling, and transport of the crops within the production process, etc.
Therefore, the expression for the calculation of this block is (see Equation (5)):
Csist&tech = Csensors + Csoftware + Chandling/support
The cost of the sensors will consider the cost associated with their installation and the unit cost per number of sensors, as shown in the following Equation (6):
C sensors = 0 n ( C installation + C software ) sensor   i
As for the cost of the software (Equation (7)) to carry out all these control tasks during the production process, it must include the acquisition of the program, the cost of the installation contract, the cost of possible employee training for its proper use, the cost of possible improvements that could be introduced in the software, etc.
Csoftware = Cprogram + Cinstallation + Cformation + Cimprovements
Finally, the cost of the handling and support block, which includes the robots and AGVs inside the container, is calculated as a material resource belonging to the company, as in the case of the container.
For its calculation, the acquisition cost, the corresponding amortization cost for the use of the resource and the possible installments of financing payments made for the payment of the resource at the time of acquisition must be considered.
Regarding the cost of renewable energy systems, this cost must include everything related to the installation (modules, supports, storage, etc.) and amortization. Thus, the expression for the calculation of the renewable energy system is (see Equation 8):
Crenewable energy systems = Cinstallation + Camortization + Cmaintenance
To sum up, this cost model provides farmers an accurate estimation of the infrastructure costs, including the implementation of new technologies. Thus, they can evaluate the investment viability.

3. Results

This section presents the results of applying the VF system in a particular case study. First, we present and characterize the case study. Then, we calculate the cost model. Finally, we discuss the results obtained using investment viability indicators.

3.1. Case Study Definition

The proposed case study aims to grow cherries in a VF system, so that cherries can be obtained outside of their usual growing date. The VF system is located in Zaragoza, Spain.
To do so, it employs a 40-ft container (67.7 m3 volume) to house the VF system. Inside the container there are fixed racks (model RADIX from SANANBIO [23]) for the placement of the trees. Considering the usable area of the container and the dimensions of the racks, it is possible to install 16 racks distributed in 2 rows of 8. As for the floor, it is assumed that the container is installed on land already purchased by the company.
We will discuss some important features regarding the water and lighting systems necessary for irrigation and crop growth. The design proposes the installation of 17 valves (HUNTER PGV 24 V), installing a general valve for opening and closing the irrigation, and one on each rack in case it is necessary to intervene in any of them due to maintenance problems. In addition, drippers will be installed to supply water to each rack. As for the cost associated with the lighting fixtures needed to grow the crops, a total of 48 fixtures are needed (one LED strip for each tray).
Regarding IoT architecture, below is a table (Table 2) showing the number of sensors of each type to be installed. It should be noted that the measurement of soil moisture, illumination, and chlorophyll content will be carried out only in one tray of each shelf at different heights to observe if there are any possible variations in the trays.
To conclude with the systems and technologies block, it is proposed that the handling and support systems will be robots and AGVs inside the container.
Regarding the installation of renewable energy systems, it is necessary to know the energy consumption of the container, the available surface to install the panels, and the orientation and inclination.
In terms of energy consumption, two situations will be differentiated: winter and summer. It is important to note that the average consumption of a 40-ft container is 7.8 kWh working in steady state, i.e., when the container reaches the desired temperature, it stops automatically. Thus, its consumption will depend largely on the ambient temperature outside, so some factors will be included to calculate the consumption in the different situations [34]. Adding to these calculations, the consumption of LED luminaires is 3749.76 kWh in summer and 3548.16 kWh in winter, and the total consumption is 28,273.68 kWh. Therefore, based on this consumption and the peak power of the panels, the number of modules required for the energy supply is calculated.
The panel model chosen is the KuMax CS3U-360P from Canadian Solar. Thus, using the RetScreen program for sizing photovoltaic installations, it is concluded that with 62 panels of 360 Wp with an inclination of 35° and facing south, it is sufficient to cover the consumption of the study container. The annual electricity generation of the installation will be almost 29 MWh per year, i.e., higher than the consumption, and it would occupy about 100 m2 of land.

3.2. Cost Model Calculation

The table below (Table 3) shows the cost of each part of the VF system that has been applied into the equations defined in Section 2.
As can be seen in Table 3, the total cost of implementing a VF infrastructure for growing cherries is estimated to be almost EUR 140,000. The viability of this inversion is evaluated in the following section.

4. Discussion

Crops of stone fruit in VF are not a widespread production process. For this reason, the price at which the fruit, in this case cherries, could be sold out of season is unknown, although it is estimated that it could be double its usual price.
As the real profit that can be obtained from this process is still unknown, ROI (Return of Investment) can be not calculated. Therefore, to analyze the results of our case study, we have used PAYBACK, reformulating the equation (see Equation (9)). Thus, we can analyze the income that a company would require to recover the investment between 1 and 10 years (see Figure 4).
Income = Investment/number of months
As can be seen in Figure 4, the necessary income decreases rapidly from year 1 to year 2 and it can be considered stable from year 5. Since a new infrastructure is a large investment, it can be considered as valid to recover the investment between three and five years. This seems possible with the estimated income.

5. Conclusions

This study proposes a set of sensors and an IoT architecture to collect variables in real time. In addition, a cost model of the infrastructure required to make a vertical farming implementing new technologies is presented.
This is intended to provide an answer to the problems that farmers may have when adapting to new technologies. A data acquisition architecture is offered, which allows them to collect information in a simple way and in real time on the state of the crop. In addition, the cost model and the case study presented provide an estimate of the cost of installing a new VF infrastructure with new technologies implemented in it. This case study shows that the payback of the investment in these systems can be between three and five years. In this way, it is intended to eliminate the barriers and prejudices that may exist towards this new type of crop.
As future research, actions are proposed to help the farmer improve the vertical cultivation process and to eliminate the barriers to the implementation of these systems; for example, by the development of more complex indicators based on the variables presented in this article. Regarding costs, the aim is to continue developing the cost model until the cost of growing stone fruit in FV can be calculated. Finally, we will identify and propose actions to improve the sustainability of this process, such as the development of renewable energy systems and the reuse and control of water consumption, among others.

Author Contributions

Conceptualization, P.M. and M.P.L.; methodology, P.M. and M.P.L.; validation, P.M. and M.P.L.; writing—original draft preparation, P.M.; writing—review and editing, M.P.L.; supervision, M.P.L., J.R. and J.C.S.; project administration, J.R. and J.C.S. All authors have read and agreed to the published version of the manuscript.

Funding

This research received no external funding.

Institutional Review Board Statement

Not applicable.

Informed Consent Statement

Not applicable.

Data Availability Statement

Not applicable.

Conflicts of Interest

The authors declare no conflict of interest.

References

  1. Trivelli, L.; Apicella, A.; Chiarello, F.; Rana, R.; Fantoni, G.; Tarabella, A. From precision agriculture to Industry 4.0 Unveiling technological connections in the agrifood sector. Br. Food J. 2019, 121, 1730–1743. [Google Scholar] [CrossRef]
  2. Robert, P.C. Precision agriculture: A challenge for crop nutrition management. Plant Soil 2002, 247, 143–149. [Google Scholar] [CrossRef]
  3. Morella, P.; Lambán, M.P.; Royo, J.; Sánchez, J.C. Study and analysis of the implementation of 4.0 technologies in the agri-food supply chain: A state of the art. Agronomy 2021, 11, 2526. [Google Scholar] [CrossRef]
  4. Friha, O.; Ferrag, M.A.; Shu, L.; Maglaras, L.; Wang, X. Internet of Things for the Future of Smart Agriculture: A Comprehensive Survey of Emerging Technologies. IEEE/CAA J. Autom. Sin. 2021, 8, 718–752. [Google Scholar] [CrossRef]
  5. Fortino, G.; Savaglio, C.; Spezzano, G.; Zhou, M. Internet of Things as System of Systems: A Review of Methodologies, Frameworks, Platforms, and Tools. IEEE Trans. Syst. Man Cybern. -Syst. 2021, 51, 223–236. [Google Scholar] [CrossRef]
  6. SharathKumar, M.; Heuvelink, E.; Marcelis, L.F.M. Vertical Farming: Moving from Genetic to Environmental Modification. Trends Plant Sci. 2020, 25, 724–727. [Google Scholar] [CrossRef] [PubMed]
  7. van Gerrewey, T.; Boon, N.; Geelen, D. Vertical Farming: The Only Way Is Up? Agronomy 2022, 12, 2. [Google Scholar] [CrossRef]
  8. Jürkenbeck, K.; Heumann, A.; Spiller, A. Sustainability Matters: Consumer Acceptance of Different Vertical Farming Systems. Sustainability 2019, 11, 4052. [Google Scholar] [CrossRef] [Green Version]
  9. Hwang, Y.; Lee, S.; Kim, T.; Baik, K.; Choi, Y. Crop Growth Monitoring System in Vertical Farms Based on Region-of-Interest Prediction. Agriculture 2022, 12, 656. [Google Scholar] [CrossRef]
  10. Franchetti, B.; Ntouskos, V.; Giuliani, P.; Herman, T.; Barnes, L.; Pirri, F. Vision Based Modeling of Plants Phenotyping in Vertical Farming under Artificial Lighting. Sensors 2019, 19, 4378. [Google Scholar] [CrossRef] [PubMed] [Green Version]
  11. Tavan, M.; Wee, B.; Brodie, G.; Fuentes, S.; Pang, A.; Gupta, D. Optimizing Sensor-Based Irrigation Management in a Soilless Vertical Farm for Growing Microgreens. Front. Sustain. Food Syst. 2021, 4, 313. [Google Scholar] [CrossRef]
  12. Sivamani, S.; Bae, N.; Cho, Y. A Smart Service Model Based on Ubiquitous Sensor Networks Using Vertical Farm Ontology. Int. J. Distrib. Sens. Netw. 2013, 9, 161495. [Google Scholar] [CrossRef] [Green Version]
  13. Saad, M.H.M.; Hamdan, N.M.; Sarker, M.R. State of the Art of Urban Smart Vertical Farming Automation System: Advanced Topologies, Issues and Recommendations. Electronics 2021, 10, 1422. [Google Scholar] [CrossRef]
  14. Shao, Y.; Heath, T.; Zhu, Y. Developing an Economic Estimation System for Vertical Farms. Agric. Environ. Inf. Syst. 2016, 7, 26–51. [Google Scholar] [CrossRef]
  15. Chuah, Y.D.; Lee, J.V.; Tan, S.S.; Ng, C.K. Implementation of smart monitoring system in vertical farming. IOP Conf. Ser. Earth Environ. Sci. 2019, 268, 012083. [Google Scholar] [CrossRef]
  16. Ismail, M.I.H.B.; Thamrin, N.M. IoT implementation for indoor vertical farming watering system. In Proceedings of the 2017 International Conference on Electrical, Electronics and System Engineering, ICEESE, Kanazawa, Japan, 9–10 November 2017; pp. 89–94. [Google Scholar] [CrossRef]
  17. Oliete, A.A. Influencia de Mallas Antigranizo en Producción de Manzana Ecológica [Online]; Universidad de Zaragoza: Zaragoza, Spain, 2015; Available online: http://hdl.handle.net/10261/111924 (accessed on 30 November 2022).
  18. Mortensen, L.M.; Moe, R. Growth responses of some greenhouse plants to environment. V. Effect of CO2, O2 and light on net photosynthetic rate in Chrysanthemum morifolium Ramat. Sci. Hortic. 1983, 19, 133–140. [Google Scholar] [CrossRef]
  19. Wang, C.; Bian, C.; Xing, H.; Zhang, X.; Shen, Y. Effect of measure units on estimating crop LEAF chlorophyll content with remote sensing. J. Eng. 2019, 2019, 8627–8631. [Google Scholar] [CrossRef]
  20. Naranjani, B.; Najafianashrafi, Z.; Pascual, C.; Agulto, I.; Chuang, P.Y.A. Computational analysis of the environment in an indoor vertical farming system. Int. J. Heat Mass. Transf. 2022, 186, 122460. [Google Scholar] [CrossRef]
  21. Martin Ramos, P.; Navas Gracia, L.M.; Hernández-Navarro, S.; Correa-Guimaraes, A.; Martin Gil, J.; Martin Bravo, E.; Chamorro Posada, P.; Duran Altisent, J.M. Diodos emisores de luz para la irradiación de plantas. Physics 2010, 7044. [Google Scholar]
  22. Bartzanas, T.; Kacira, M.; Zhu, H.; Karmakar, S.; Tamimi, E.; Katsoulas, N.; Lee, I.B.; Kittas, C. Computational fluid dynamics applications to improve crop production systems. Comput. Electron. Agric. 2013, 93, 151–167. [Google Scholar] [CrossRef]
  23. Modularized Vertical Hydroponic Brochure [Online]. Available online: https://img.waimaoniu.net/2934/V2020-SANANBIO%20RADIX%20%20Brochure.pdf (accessed on 30 November 2022).
  24. K010-AWS M5Stack | Mouser España. Available online: https://www.mouser.es/ProductDetail/M5Stack/K010-AWS?qs=pUKx8fyJudDCzqLmZY12tw%3D%3D&mgh=1&vip=1&gclid=Cj0KCQjwuaiXBhCCARIsAKZLt3k3S1kVG8RIZjgViy1pkS6PgOnrcM1GGGA_sDSCUXIVYFjUVpytdzsaAodiEALw_wcB%5D (accessed on 30 November 2022).
  25. 5182 Adafruit Industries LLC | Sensores y transductores | DigiKey. Available online: https://www.digikey.es/es/products/detail/adafruit-industries-llc/5182/15204091?utm_adgroup=Humidity%2C%20Moisture%20Sensors&utm_source=google&utm_medium=cpc&utm_campaign=Shopping_Product_Sensors%2C%20Trans66ducers&utm_term=&productid=15204091&gclid=Cj0KCQjwuaiXBhCCARIsAKZLt3mZZBA3Z0U_Mlg9mC_3mU54GqwxoT0gsi-2GcMpCBmXpTmsAzzxPDIaAj3aEALw_wcB] (accessed on 30 November 2022).
  26. Sensor de Humedad del Suelo FC-28. Available online: https://naylampmechatronics.com/sensores-temperatura-y-humedad/47-sensor-de-humedad-de-suelo-fc-28.html (accessed on 30 November 2022).
  27. Winsen Sensor Infrarrojo de CO2 NDIR, Alta Sensibilidad y Resolución, UART, Señal de Voltaje Analógica, Larga Vida Útil, 2 Piezas, MH 410D|Sensores|—AliExpress. Available online: https://es.aliexpress.com/item/1005002050711861.html?spm=a2g0o.search0304.0.0.cc3c2d9asMbaMD&algo_pvid=39a43810-f698-41b9-b7c5-1e04580896e1&aem_p4p_detail=20220803233424641387326068400019570563&algo_exp_id=39a43810-f698-41b9-b7c5-1e04580896e1-7&pdp_ext_f=%7B%22sku_id%22%3A%2212000019429974929%22%7D&pdp_npi=2%40dis%21EUR%21%21239.2%21%21%21%21%21%400b0a050116595948639565285e669c%2112000019429974929%21sea (accessed on 30 November 2022).
  28. Controlador de CO2 Infrarrojo, Dispositivo con WIFI, TUYA, RS485 y MODBUS, Para Cultivo de Setas, Invernaderos Agrícolas, Cultivo de Flores | Analizadores de gas |—AliExpress. Available online: https://es.aliexpress.com/item/1005002084767162.html (accessed on 30 November 2022).
  29. Sensor de Flujo de Agua 1/2″ YF-S201. Available online: https://naylampmechatronics.com/sensores-liquido/108-sensor-de-flujo-de-agua-12-yf-s201.html (accessed on 30 November 2022).
  30. Wireless Light Sensor—PS-3213—Products | PASCO. Available online: https://www.pasco.com/products/sensors/wireless/ps-3213#specs-panel] (accessed on 30 November 2022).
  31. Sensor de Humedad Relativa y Presión de Vapor ATMOS 14. Available online: https://www.lab-ferrer.com/sensor-de-humedad-relativa-y-presion-de-vapor-atmos-14/ (accessed on 30 November 2022).
  32. Sensores Archivos—INNOVA Oceanografía Litoral. Available online: https://www.oceanografialitoral.com/producto/sensor-de-clorofila-scf/ (accessed on 30 November 2022).
  33. CIRCUTOR CVM—Mini—Analizador de Redes. Available online: http://arquitecsolar.com/monitorizacion/331-circutor-cvm-mini-analizador-de-redes.html (accessed on 30 November 2022).
  34. TROM CONTAINERS – Preguntas frecuentes. Available online: https://tromcontainers.com/preguntas-frecuentes-de-contenedor-frigorifico/ (accessed on 1 September 2022).
  35. Container Price. Available online: https://www.container-xchange.com/blog/shipping-container-price/ (accessed on 30 November 2022).
  36. ALIBABA- Sistema de estantería vertical móvil para cultivo. Available online: https://spanish.alibaba.com/product-detail/Direct-factory-sell-vertical-farming-2-1600473839107.html (accessed on 29 August 2022).
  37. Generador de Precios. España. CYPE Ingenieros. Available online: http://www.generadordeprecios.info/obra_nueva/ (accessed on 30 November 2022).
  38. Electroválvula Para Riego HUNTER PGV 24V Rosca Macho 1 | Leroy Merlin. Available online: https://www.leroymerlin.es/productos/jardin-y-terraza/riego/electrovalvulas/electrovalvula-para-riego-hunter-pgv-24v-rosca-macho-1-14096964.html?keyword=&ds_kid=92700068915563258&ds_ag=Todas+Categorias&ds_c=LM_Empoderar_AO_SmartShopping_Todas_Categoria/final_Google_Conversion_OMD&source=google&adtype=&gclid=CjwKCAjw3qGYBhBSEiwAcnTRLspbd3Gk2BYsWBVVOSqs0KAjxWJZ7ZbJfPpJMwQq-ujLmXG1-gDE1xoCv5QQAvD_BwE&gclsrc=aw.ds (accessed on 30 November 2022).
  39. Gotero Autocompensante Netafin. Available online: https://iberogarden.com/goteros-microaspersion/145-gotero-netafin-autocompensante-4-litros-hora.html (accessed on 30 November 2022).
  40. Robot De Transporte Inteligente, Compatible Con Desarrollo Secundario, Chasis De Robot Agv, Venta Directa De Fábrica, Almacén—Buy Robot Chassis, Agv Robot, Warehouse Carrying Carrying Product on Alibaba.com. Available online: https://spanish.alibaba.com/p-detail/Factory-1600522537738.html?spm=a2700.7724857.topad_classic.d_title.7d05658195jyu9 (accessed on 30 November 2022).
  41. Brazo Robot Industrial De 6 Ejes, Máquina Automática, Directa De Fábrica, Con Ce Iso, 2022—Buy Arm Robot, Robotic Arm Industrial, Robotic Arm 6 Axis Product on Alibaba.com. Available online: https://spanish.alibaba.com/p-detail/2021-1600206176140.html?spm=a2700.7724857.0.0.7d05658195jyu9&s=p (accessed on 30 November 2022).
  42. Canadian Solar KuMax CS3U-360P | Panel solar | 360W, Policrista. Available online: https://www.batna24.com/es/p/canadian-solar-kumax-cs3u360p-panel-solar-rmmmo (accessed on 30 November 2022).
Figure 1. Effect of wavelength on the growth process of the plants. The colors of the figure represents the wavelength colors. Furthermore +, ++ and +++ means positive effect, very positive effect and excellent effect, respectively.
Sensors 23 03502 g001
Figure 2. The IoT architecture.
Sensors 23 03502 g002
Figure 3. The cost structure.
Sensors 23 03502 g003
Figure 4. Income vs. year.
Sensors 23 03502 g004
Table 1. Relation between the variables and indicators.
Key Performance IndicatorVariable
Water footprintHumidity
Temperature
Water consumption
Carbon footprintCO2
Energy consumption
Eco-physiological propertiesCrop growthO2
CO2
Chlorophyll contentChlorophyll
Light characteristicsOptical wavelength
Illuminance
Irradiance
PAR
EvapotranspirationVapor pressure
Wind speed and direction
Table 2. Cost of the sensors. €—EUR.
SensorNº of SensorsUnit CostTotal
IoT device [24]161.17 €61.17 €
Temperature and humidity sensor [25]231.96 €63.92 €
Soil humidity sensor [26]168.00 €128.00 €
Wind speed sensor250.00 €100.00 €
CO2 sensor [27]2434.95 €869.90 €
O2 sensor [28]2356.95 €713.90 €
Flowmeter [29]1155.00 €155.00 €
PASCO Wireless Light [30]16421.45 €6743.20 €
Steam pressure sensor [31]2430.76 €861.52 €
Chlorophyll content sensor [32]162257.86 €36,125.76 €
Network analyzer [33]1281.94 €281.94 €
Network and connection system11960.00 €1960.00 €
Total Cacquisition sensors48,064.31 €
Table 3. Values applied in the cost model structure. €—EUR.
Cost Model Structure
CinstallationsCcontainerAcquisition [35]8000 €8270.00 €
InstallationTime3 h
Labor cost
(four operators)
10 €/h
Crane rent150 €
CshelvesAcquisition + installation
(16 shelves) [36]
218 €3488.00 €
Cfloor0 €0 €
CsystemswaterInstallationTime32 h1294.00 €
Labor cost
(four operators)
10 €/h
Conducts [37]15 €15 €
Valves [38]19 €17 valves323.00 €
Drippers [39]0.39 €16 drippers6.24 €
CsystemslightingInstallationTime80 h4044.00 €
Labor cost
(five operators)
10 €/h
Materials 27.00 €
Conducts [37] 16.00 €
Lighting124.90 €48 lighting fixtures5995.00 €
Csist&techCSensorsInstallationTime32 h1294.00 €
Labor cost
(four operators)
10 €/h
AcquisitionSee Table 248,064.31 €
CSoftware32,000.00 €
CHandling and supports [40,41]12,400.00 €
Crenewable energy systems [42]21,215.48
Ctotal138,452.00 €
Disclaimer/Publisher’s Note: The statements, opinions and data contained in all publications are solely those of the individual author(s) and contributor(s) and not of MDPI and/or the editor(s). MDPI and/or the editor(s) disclaim responsibility for any injury to people or property resulting from any ideas, methods, instructions or products referred to in the content.

