
Camera- and Viewpoint-Agnostic Evaluation of Axial Postural Abnormalities in People with Parkinson’s Disease through Augmented Human Pose Estimation
 , ,
, ,  , , , , and
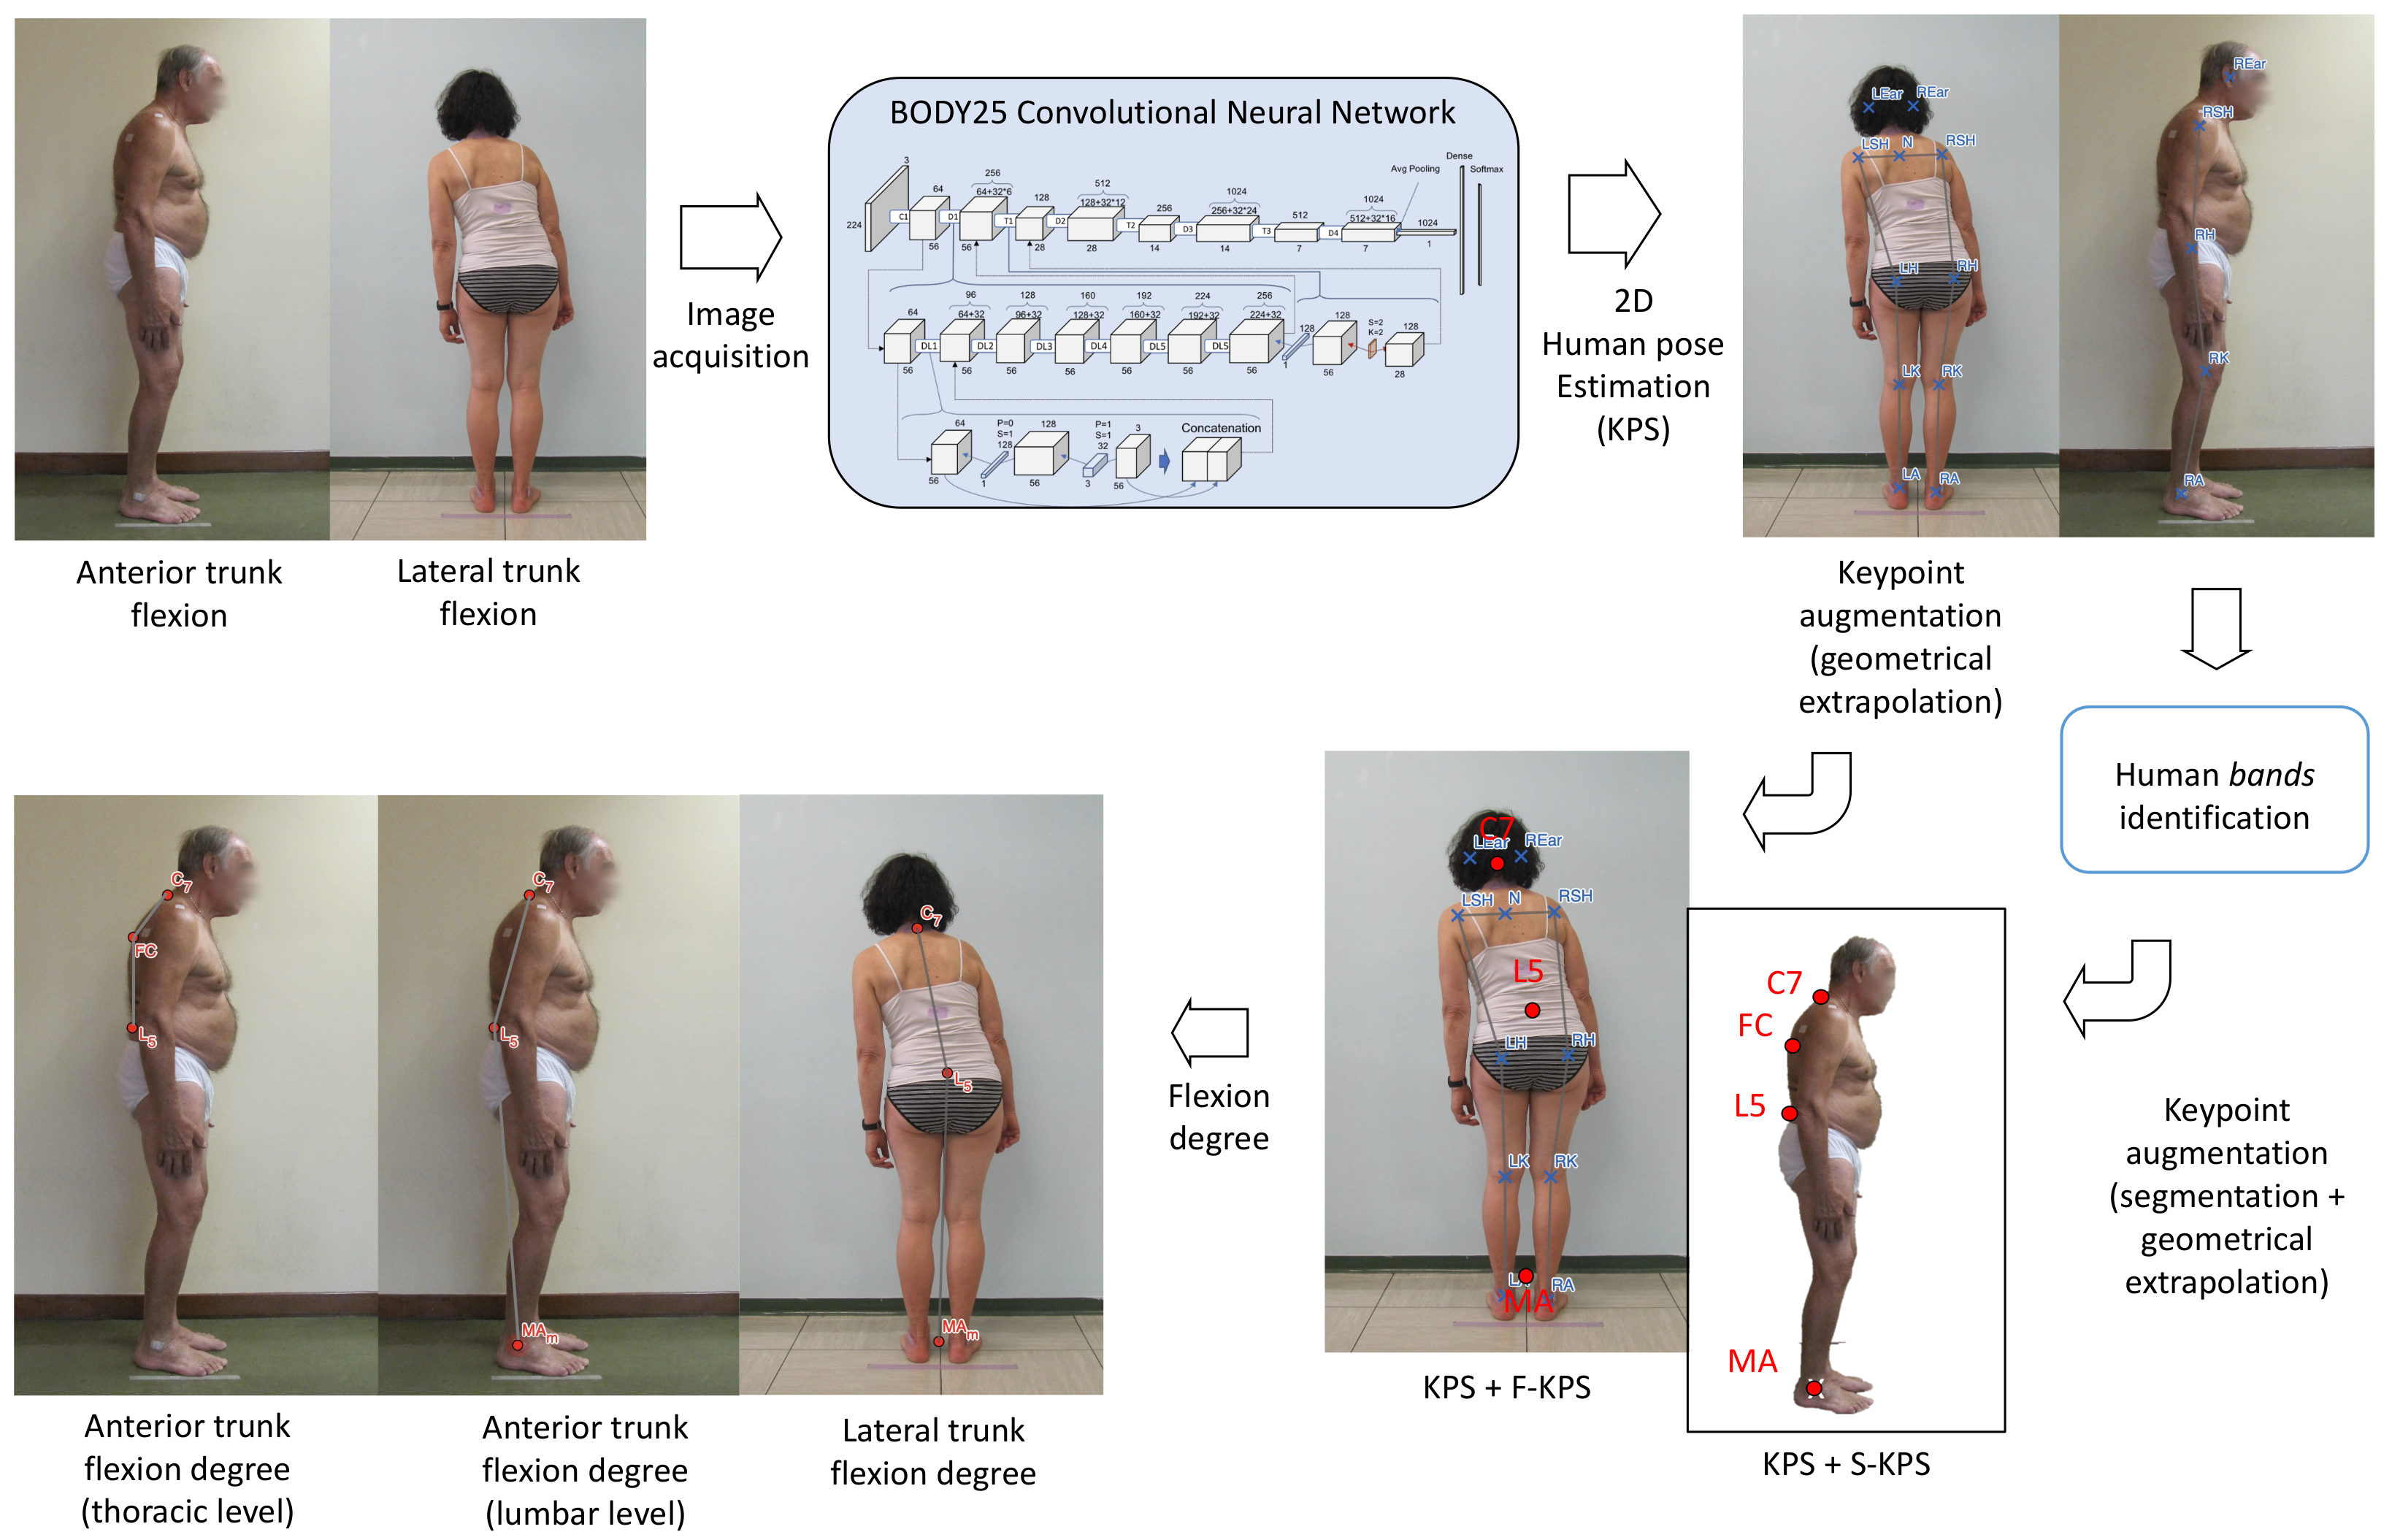
Abstract
:1. Introduction
2. Materials and Methods
2.1. The AutoPosturePD Software
2.1.1. for Frontal View Analysis—PS Assessment
2.1.2. for Sagittal View Analysis—lCC and tCC assessment
- Red—background: pixels outside the box () created around the subject, where . is defined by the user. These pixels are not considered for the edge extrapolation to reduce false positive pixels.
- Green—foreground: pixels inside the bands connecting adjacent joints: ear with shoulder (), shoulder with hip (), hip with knee (), knee with ankle (); likely representing the subject’s limbs.
- Yellow—probable background: pixels are neither of the previous classes.
- the segment joining two keypoints and , ;
- the segment thickness , which is upper bounded by the radius of the body segment, obtained geometrically through distances between the HPE keypoints;
- the band , defined as the area covered by when isotropically expanded by .
2.2. Participants and Ethics Statement
2.3. Procedure
2.4. Statistical Analysis
3. Results
4. Discussion
5. Conclusions
Author Contributions
Funding
Institutional Review Board Statement
Informed Consent Statement
Data Availability Statement
Acknowledgments
Conflicts of Interest
Abbreviations
| aPA | Axial postural abnormalities |
| C7 | Seventh cervical vertebra |
| CC | Camptocormia |
| CNN | Convolutional neural networks |
| HPE | Human pose estimation |
| KPS | Keypoints |
| L5 | Fifth lumbar vertebra |
| LA | Left ankle joint centre |
| lCC | Lumbar camptocormia |
| LE | Left elbow joint centre |
| LH | Left hip joint centre |
| LK | Left knee joint centre |
| LSH | Left shoulder joint centre |
| LW | Left wrist joint centre |
| MA | Mid-point of the two ankles |
| PD | Parkinson’s disease |
| PS | Pisa syndrome |
| RA | Right ankle joint centre |
| RE | Right elbow joint centre |
| RH | Right hip joint centre |
| RK | Right knee joint centre |
| RSH | Right shoulder joint centre |
| RW | Right wrist joint centre |
| tCC | Thoracic camptocormia |
| VF | Video-frames |
References
- Horak, F.B.; Mancini, M. Objective Biomarkers of Balance and Gait for Parkinson’s Disease Using Body-worn Sensors. Mov. Disord. 2013, 28, 1544–1551. [Google Scholar] [CrossRef] [Green Version]
- Latt, M.D.; Lord, S.R.; Morris, J.G.; Fung, V.S. Clinical and physiological assessments for elucidating falls risk in Parkinson’s disease. Mov. Disord. 2009, 24, 1280–1289. [Google Scholar] [CrossRef]
- Nutt, J.G.; Wooten, G.F. Diagnosis and initial management of Parkinon’s disease. N. Engl. J. Med. 2005, 353, 1021–1027. [Google Scholar] [CrossRef] [Green Version]
- Jankovic, J. Parkinson’s disease: Clinical features and diagnosis. J. Neurol. Neurosurg. Psychiatry 2008, 79, 368–376. [Google Scholar] [CrossRef] [Green Version]
- Peterson, D.S.; King, L.A.; Cohen, R.G.; Horak, F.B. Cognitive Contributions to Freezing of Gait in Parkinson Disease: Implications for Physical Rehabilitation. Phys. Ther. 2016, 96, 659–670. [Google Scholar] [CrossRef]
- Mancini, M.; Curtze, C.; Stuart, S.; El-Gohary, M.; McNames, J.; Nutt, J.G.; Horak, F.B. The impact of freezing of gait on balance perception and mobility in community-living with Parkinson’S disease. In Proceedings of the 40th Annual International Conference of the IEEE Engineering in Medicine and Biology Society (EMBC), Honolulu, HI, USA, 18–21 July 2018; pp. 3040–3043. [Google Scholar]
- Doherty, K.M.; van de Warrenburg, B.P.; Peralta, M.C.; Silveira-Moriyama, L.; Azulay, J.P.; Gershanik, O.S.; Bloem, B.R. Postural deformities in Parkinson’s disease. Lancet Neurol. 2011, 10, 538–549. [Google Scholar] [CrossRef]
- Margraf, N.G.; Granert, O.; Hampel, J.; Wrede, A.; Schulz-Schaeffer, W.J.; Deuschl, G. Clinical definition of camptocormia in Parkinson’s disease. Mov. Disord. Clin. Pract. 2017, 4, 349–357. [Google Scholar] [CrossRef] [Green Version]
- Tinazzi, M.; Gandolfi, M.; Ceravolo, R.; Capecci, M.; Andrenelli, E.; Ceravolo, M.G.; Bonanni, L.; Onofrj, M.; Vitale, M.; Catalan, M.; et al. Postural abnormalities in Parkinson’s disease: An epidemiological and clinical multicenter study. Mov. Disord. Clin. Pract. 2019, 6, 576–585. [Google Scholar] [CrossRef]
- Tinazzi, M.; Geroin, C.; Bhidayasiri, R.; Bloem, B.R.; Capato, T.; Djaldetti, R.; Doherty, K.; Fasano, A.; Tibar, H.; Lopiano, L.; et al. Task Force Consensus on Nosology and Cut-Off Values for Axial Postural Abnormalities in Parkinsonism. Mov. Disord. Clin. Pract. 2022, 9, 594–603. [Google Scholar] [CrossRef]
- Artusi, C.A.; Bortolani, S.; Merola, A.; Zibetti, M.; Busso, M.; De Mercanti, S.; Arnoffi, P.; Martinetto, S.; Gaidolfi, E.; Veltri, A.; et al. Botulinum toxin for Pisa syndrome: An MRI-, ultrasound-and electromyography-guided pilot study. Park. Relat. Disord. 2019, 62, 231–235. [Google Scholar] [CrossRef]
- Gandolfi, M.; Tinazzi, M.; Magrinelli, F.; Busselli, G.; Dimitrova, E.; Polo, N.; Manganotti, P.; Fasano, A.; Smania, N.; Geroin, C. Four-week trunk-specific exercise program decreases forward trunk flexion in Parkinson’s disease: A single-blinded, randomized controlled trial. Park. Relat. Disord. 2019, 64, 268–274. [Google Scholar] [CrossRef] [PubMed]
- Tinazzi, M.; Geroin, C.; Gandolfi, M.; Smania, N.; Tamburin, S.; Morgante, F.; Fasano, A. Pisa syndrome in Parkinson’s disease: An integrated approach from pathophysiology to management. Mov. Disord. 2016, 31, 1785–1795. [Google Scholar] [CrossRef]
- Buckley, C.; Alcock, L.; McArdle, R.; Rehman, R.Z.U.; Del Din, S.; Mazzà, C.; Yarnall, A.J.; Rochester, L. The role of movement analysis in diagnosing and monitoring neurodegenerative conditions: Insights from gait and postural control. Brain Sci. 2019, 9, 34. [Google Scholar] [CrossRef] [Green Version]
- Quijoux, F.; Vienne-Jumeau, A.; Bertin-Hugault, F.; Zawieja, P.; Lefevre, M.; Vidal, P.P.; Ricard, D. Center of pressure displacement characteristics differentiate fall risk in older people: A systematic review with meta-analysis. Ageing Res. Rev. 2020, 62, 101117. [Google Scholar] [CrossRef] [PubMed]
- Simpson, L.; Maharaj, M.M.; Mobbs, R.J. The role of wearables in spinal posture analysis: A systematic review. BMC Musculoskelet. Disord. 2019, 20, 55. [Google Scholar] [CrossRef] [PubMed]
- Panero, E.; Dimanico, U.; Artusi, C.A.; Gastaldi, L. Standardized biomechanical investigation of posture and gait in pisa syndrome disease. Symmetry 2021, 13, 2237. [Google Scholar] [CrossRef]
- Fabbri, M.; Pongmala, C.; Artusi, C.A.; Imbalzano, G.; Romagnolo, A.; Lopiano, L.; Zibetti, M. Video analysis of long-term effects of levodopa-carbidopa intestinal gel on gait and posture in advanced Parkinson’s disease. Neurol. Sci. 2020, 41, 1927–1930. [Google Scholar] [CrossRef]
- Margraf, N.G.; Wolke, R.; Granert, O.; Berardelli, A.; Bloem, B.R.; Djaldetti, R.; Espay, A.J.; Fasano, A.; Furusawa, Y.; Giladi, N.; et al. Consensus for the measurement of the camptocormia angle in the standing patient. Park. Relat. Disord. 2018, 52, 1–5. [Google Scholar] [CrossRef]
- Tinazzi, M.; Gandolfi, M.; Artusi, C.A.; Lanzafame, R.; Zanolin, E.; Ceravolo, R.; Capecci, M.; Andrenelli, E.; Ceravolo, M.G.; Bonanni, L.; et al. Validity of the wall goniometer as a screening tool to detect postural abnormalities in Parkinson’s disease. Park. Relat. Disord. 2019, 69, 159–165. [Google Scholar] [CrossRef] [Green Version]
- Schlenstedt, C.; Boße, K.; Gavriliuc, O.; Wolke, R.; Granert, O.; Deuschl, G.; Margraf, N.G. Quantitative assessment of posture in healthy controls and patients with Parkinson’s disease. Park. Relat. Disord. 2020, 76, 85–90. [Google Scholar] [CrossRef]
- Hammadi, Y.; Grondin, F.; Ferland, F.; Lebel, L. Evaluation of Various State of the Art Head Pose Estimation Algorithms for Clinical Scenarios. Sensors 2022, 22, 6850. [Google Scholar] [CrossRef] [PubMed]
- Cao, Z.; Simon, T.; Wei, S.E.; Sheikh, Y. Realtime multi-person 2d pose estimation using part affinity fields. In Proceedings of the IEEE Conference on Computer Vision and Pattern Recognition, Honolulu, HI, USA, 21–26 July 2017; pp. 7291–7299. [Google Scholar]
- Moro, M.; Marchesi, G.; Hesse, F.; Odone, F.; Casadio, M. Markerless vs. Marker-Based Gait Analysis: A Proof of Concept Study. Sensors 2022, 22, 2011. [Google Scholar] [CrossRef] [PubMed]
- Lam, W.W.; Fong, K.N. The application of markerless motion capture (MMC) technology in rehabilitation programs: A systematic review and meta-analysis. Virtual Real. 2022, 1–16. [Google Scholar] [CrossRef]
- Scott, B.; Seyres, M.; Philp, F.; Chadwick, E.K.; Blana, D. Healthcare applications of single camera markerless motion capture: A scoping review. Sport. Med. Rehabil. 2022, 10, e13517. [Google Scholar] [CrossRef] [PubMed]
- Shin, J.H.; Woo, K.A.; Lee, C.Y.; Jeon, S.H.; Kim, H.J.; Jeon, B. Automatic Measurement of Postural Abnormalities with a Pose Estimation Algorithm in Parkinson’s Disease. J. Mov. Disord. 2022, 15, 140–145. [Google Scholar] [CrossRef]
- Zhang, Z.; Hong, R.; Lin, A.; Su, X.; Jin, Y.; Gao, Y.; Peng, K.; Li, Y.; Zhang, T.; Zhi, H.; et al. Automated and accurate assessment for postural abnormalities in patients with Parkinson’s disease based on Kinect and machine learning. J. Neuroeng. Rehabil. 2021, 18, 169. [Google Scholar] [CrossRef]
- Kanko, R.M.; Laende, E.K.; Strutzenberger, G.; Brown, M.; Selbie, W.S.; DePaul, V.; Scott, S.H.; Deluzio, K.J. Assessment of spatiotemporal gait parameters using a deep learning algorithm-based markerless motion capture system. J. Biomech. 2021, 122, 110414. [Google Scholar] [CrossRef]
- Artusi, C.A.; Geroin, C.; Imbalzano, G.; Camozzi, S.; Aldegheri, S.; Lopiano, L.; Tinazzi, M.; Bombieri, N. Assessment of Axial Postural Abnormalities in Parkinsonism: Automatic Picture Analysis Software. Mov. Disord. Clin. Pract. 2023; early view. [Google Scholar] [CrossRef]
- Cao, Z.; Hidalgo, G.; Simon, T.; Wei, S.E.; Sheikh, Y. OpenPose: Realtime Multi-Person 2D Pose Estimation Using Part Affinity Fields. IEEE Trans. Pattern Anal. Mach. Intell. 2021, 43, 172–186. [Google Scholar] [CrossRef] [Green Version]
- Mehdizadeh, S.; Nabavi, H.; Sabo, A.; Arora, T.; Iaboni, A.; Taati, B. Concurrent validity of human pose tracking in video for measuring gait parameters in older adults: A preliminary analysis with multiple trackers, viewing angles, and walking directions. J. Neuroeng. Rehabil. 2021, 18, 139. [Google Scholar] [CrossRef]
- Lin, T.Y.; Maire, M.; Belongie, S.; Hays, J.; Perona, P.; Ramanan, D.; Dollár, P.; Zitnick, C.L. Microsoft COCO: Common Objects in Context. In Computer Vision—ECCV 2014, Zurich, Switzerland, 6–12 September 2014; Springer International Publishing: New York, NY, USA, 2014; pp. 740–755. [Google Scholar]
- Andriluka, M.; Pishchulin, L.; Gehler, P.; Schiele, B. 2D Human Pose Estimation: New Benchmark and State of the Art Analysis. In Proceedings of the IEEE Conference on Computer Vision and Pattern Recognition (CVPR), Columbus, OH, USA, 23–28 June 2014. [Google Scholar]
- Robinson, R.; Robinson, H.S.; Bjørke, G.; Kvale, A. Reliability and validity of a palpation technique for identifying the spinous processes of C7 and L5. Man. Ther. 2009, 14, 409–414. [Google Scholar] [CrossRef] [PubMed]
- Boykov, Y.; Veksler, O.; Zabih, R. Fast approximate energy minimization via graph cuts. IEEE Trans. Pattern Anal. Mach. Intell. 2001, 23, 1222–1239. [Google Scholar] [CrossRef] [Green Version]
- Etoom, M.; Alwardat, M.; Ala’S, A.; Lena, F.; Fabbrizo, R.; Modugno, N.; Centonze, D. Therapeutic interventions for Pisa syndrome in idiopathic Parkinson’s disease. A Scoping Systematic Review. Clin. Neurol. Neurosurg. 2020, 198, 106242. [Google Scholar] [CrossRef] [PubMed]
- Nair, P.; Bohannon, R.W.; Devaney, L.; Maloney, C.; Romano, A. Reliability and validity of nonradiologic measures of forward flexed posture in Parkinson disease. Arch. Phys. Med. Rehabil. 2017, 98, 508–516. [Google Scholar] [CrossRef] [PubMed]
- BIPM; IEC; IFCC; ILAC; ISO; IUPAC; IUPAP; OIML. International Vocabulary of Metrology—Basic and General Concepts and Associated Terms (VIM), 3rd. ed.; JCGM 200:2012; Joint Committee for Guides in Metrology: Paris, France, 2012. [Google Scholar]


Disclaimer/Publisher’s Note: The statements, opinions and data contained in all publications are solely those of the individual author(s) and contributor(s) and not of MDPI and/or the editor(s). MDPI and/or the editor(s) disclaim responsibility for any injury to people or property resulting from any ideas, methods, instructions or products referred to in the content. |
© 2023 by the authors. Licensee MDPI, Basel, Switzerland. This article is an open access article distributed under the terms and conditions of the Creative Commons Attribution (CC BY) license (https://creativecommons.org/licenses/by/4.0/).
Share and Cite
Aldegheri, S.; Artusi, C.A.; Camozzi, S.; Di Marco, R.; Geroin, C.; Imbalzano, G.; Lopiano, L.; Tinazzi, M.; Bombieri, N. Camera- and Viewpoint-Agnostic Evaluation of Axial Postural Abnormalities in People with Parkinson’s Disease through Augmented Human Pose Estimation. Sensors 2023, 23, 3193. https://doi.org/10.3390/s23063193
Aldegheri S, Artusi CA, Camozzi S, Di Marco R, Geroin C, Imbalzano G, Lopiano L, Tinazzi M, Bombieri N. Camera- and Viewpoint-Agnostic Evaluation of Axial Postural Abnormalities in People with Parkinson’s Disease through Augmented Human Pose Estimation. Sensors. 2023; 23(6):3193. https://doi.org/10.3390/s23063193
Chicago/Turabian StyleAldegheri, Stefano, Carlo Alberto Artusi, Serena Camozzi, Roberto Di Marco, Christian Geroin, Gabriele Imbalzano, Leonardo Lopiano, Michele Tinazzi, and Nicola Bombieri. 2023. "Camera- and Viewpoint-Agnostic Evaluation of Axial Postural Abnormalities in People with Parkinson’s Disease through Augmented Human Pose Estimation" Sensors 23, no. 6: 3193. https://doi.org/10.3390/s23063193