

Object Detection for UAV Aerial Scenarios Based on Vectorized IOU

Abstract
:1. Introduction
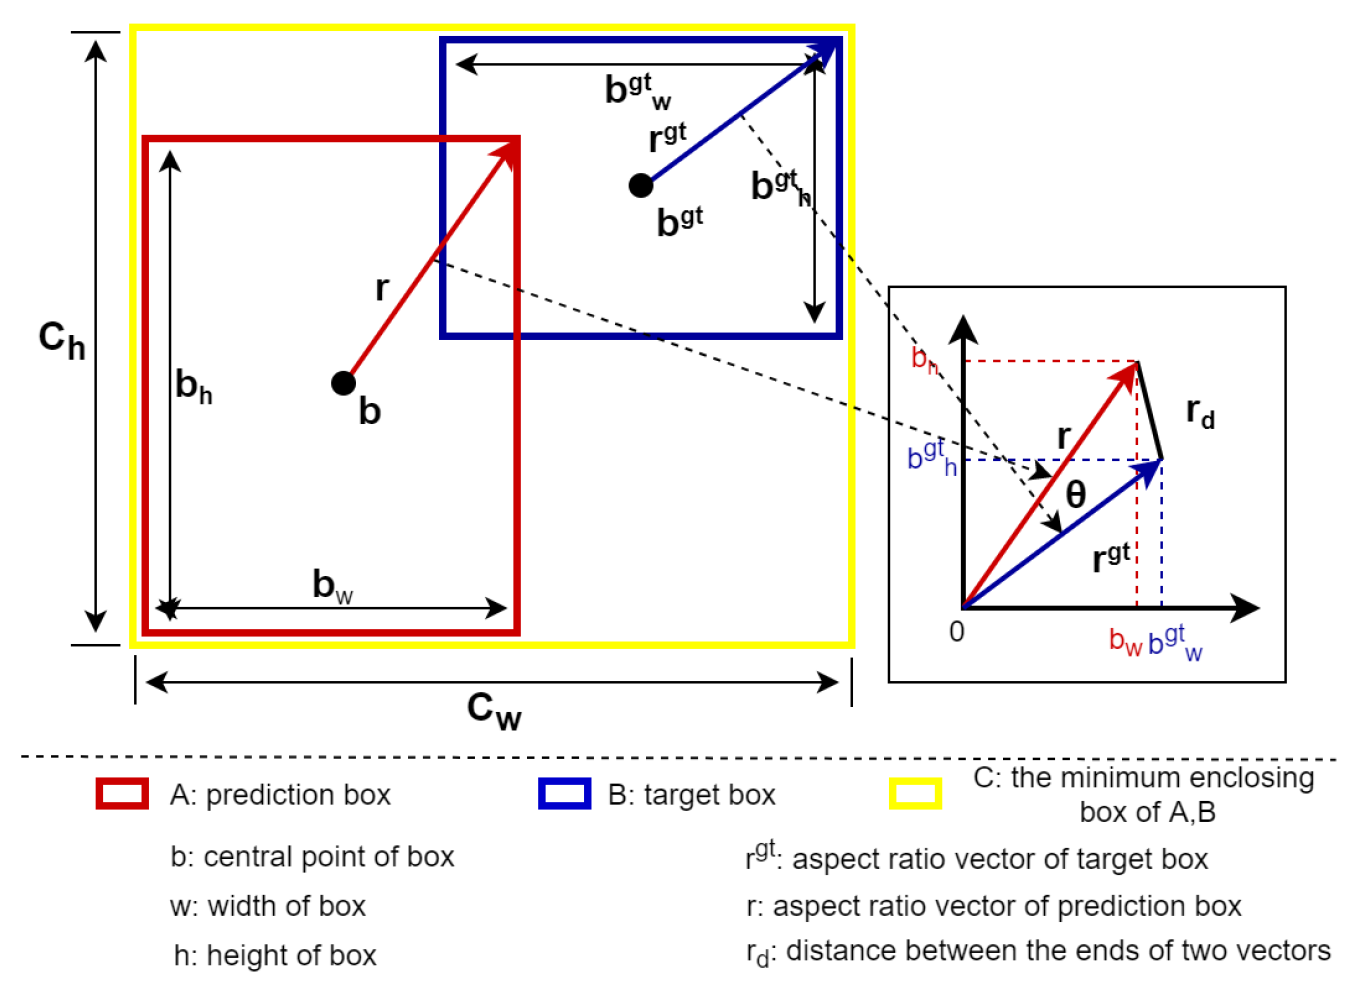
- We propose the VIOU Loss, which simplifies the calculation and improves the regression accuracy of the bounding box.
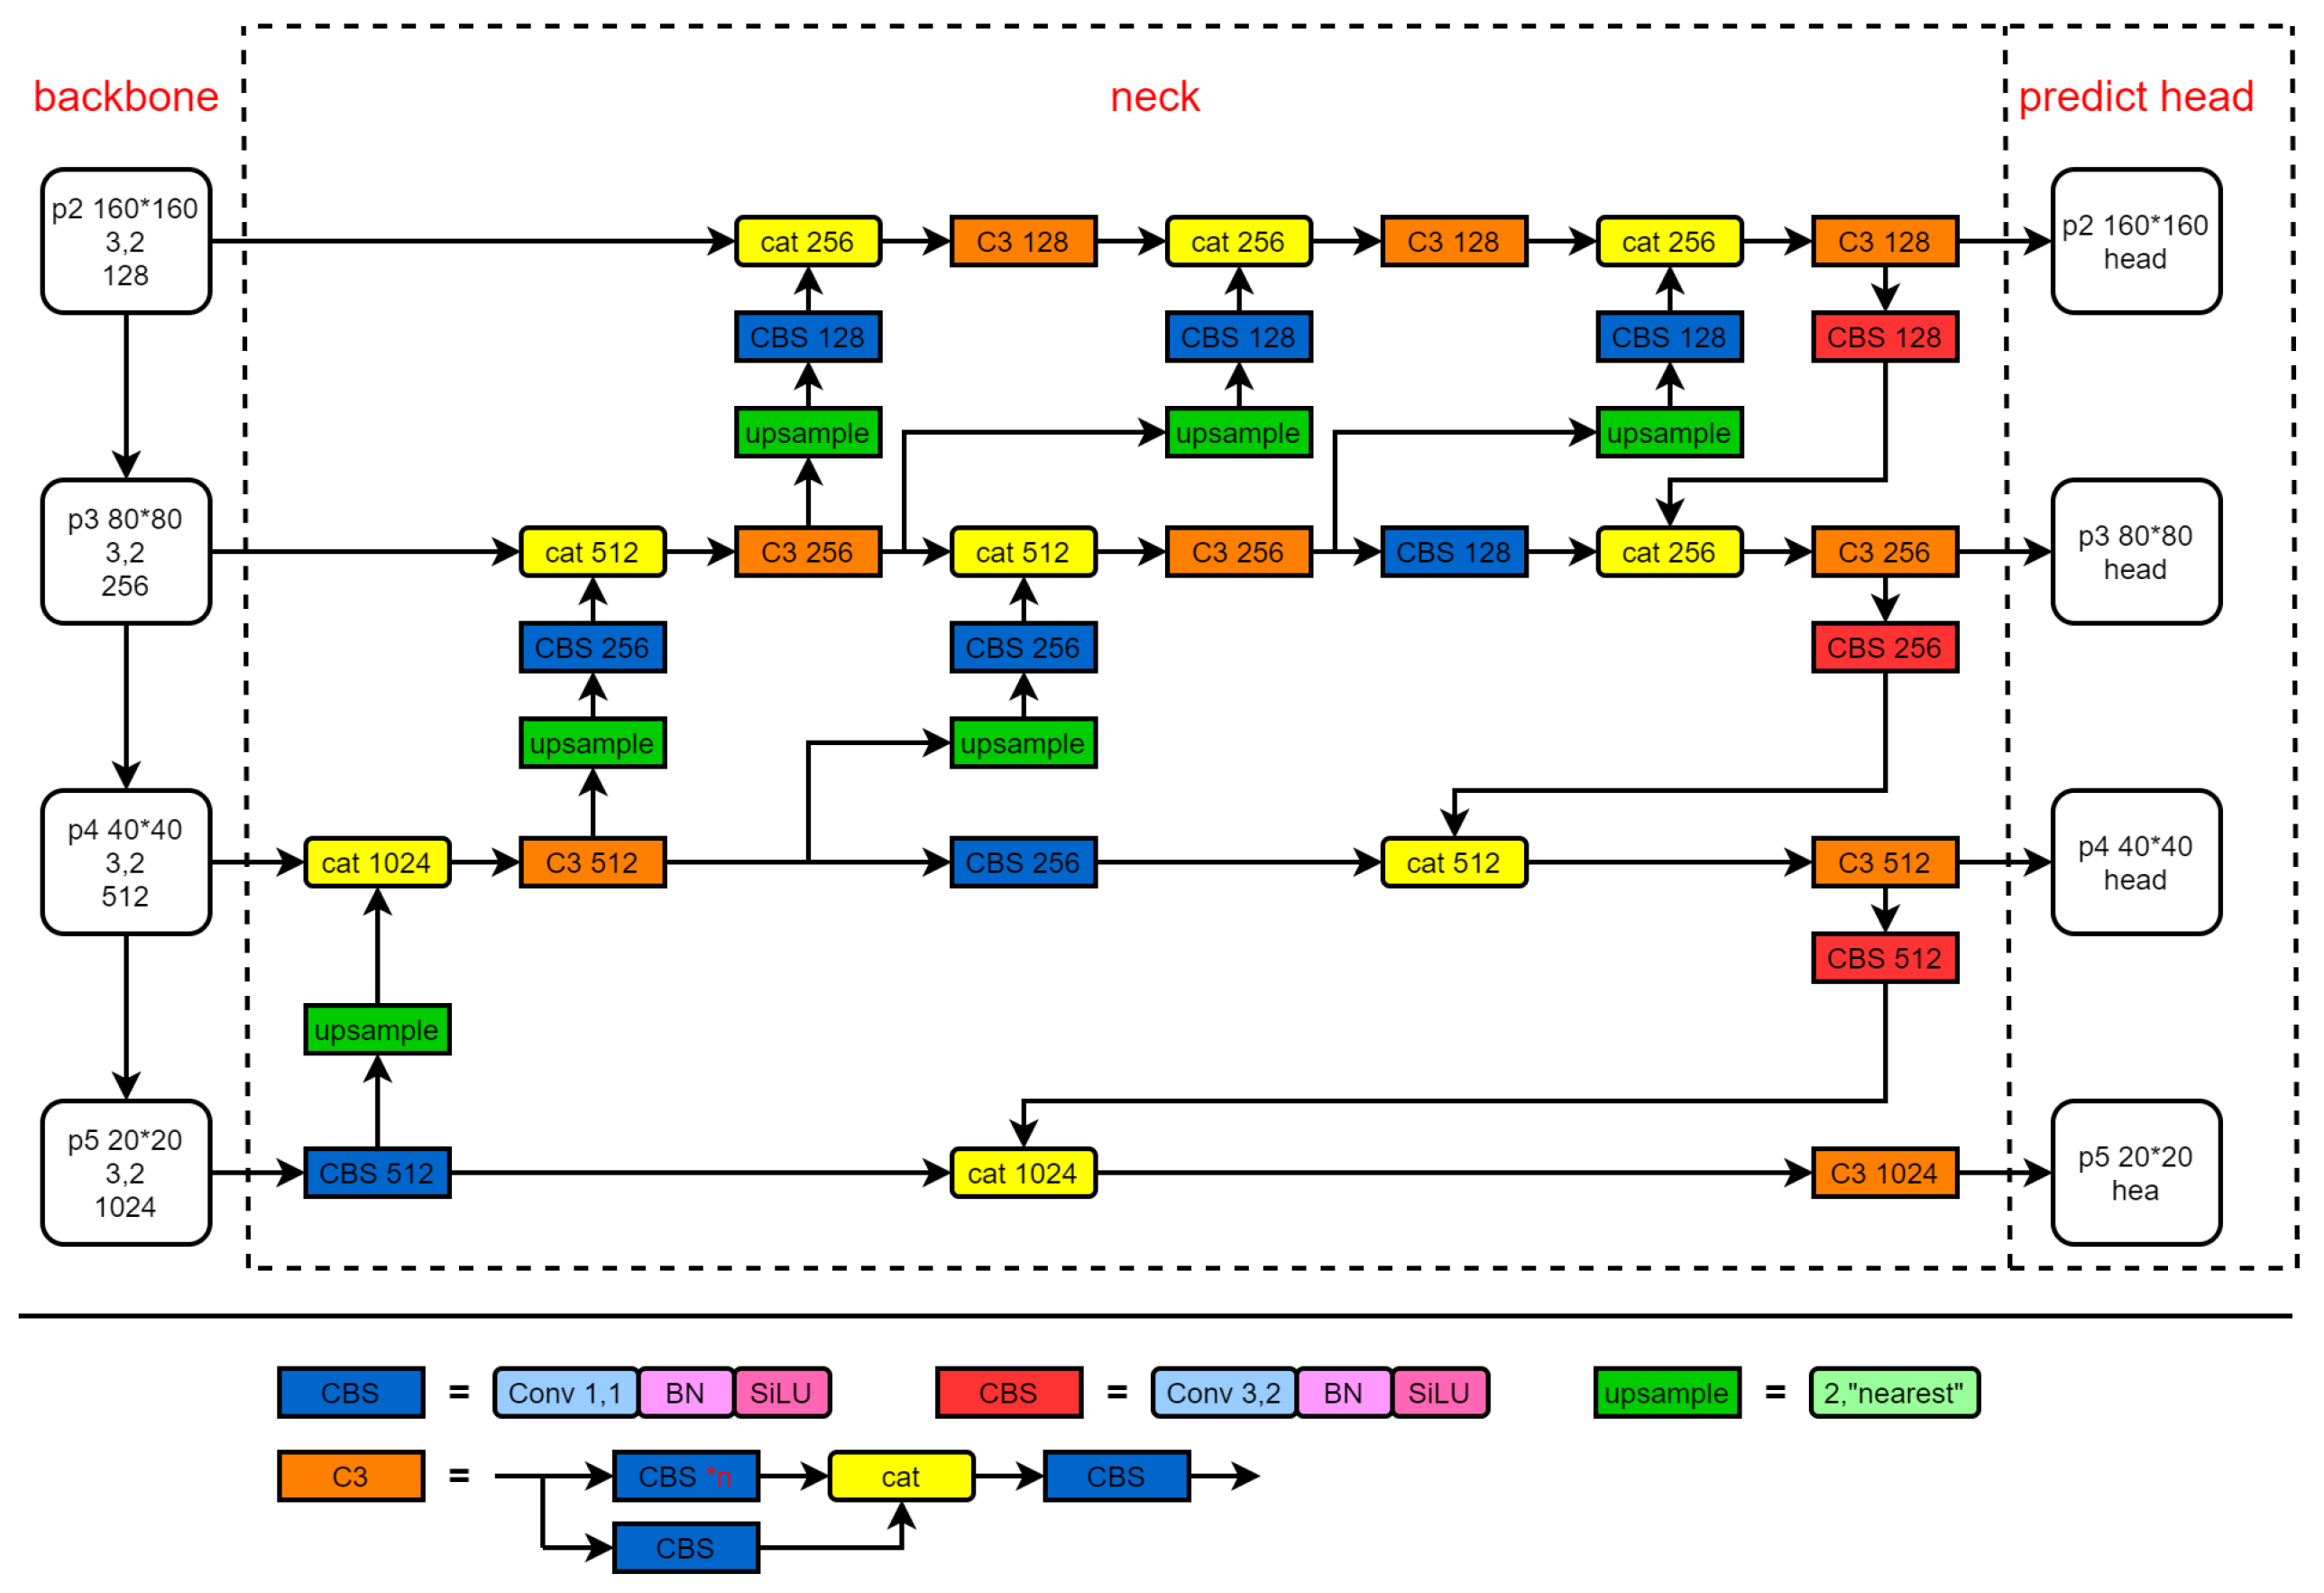
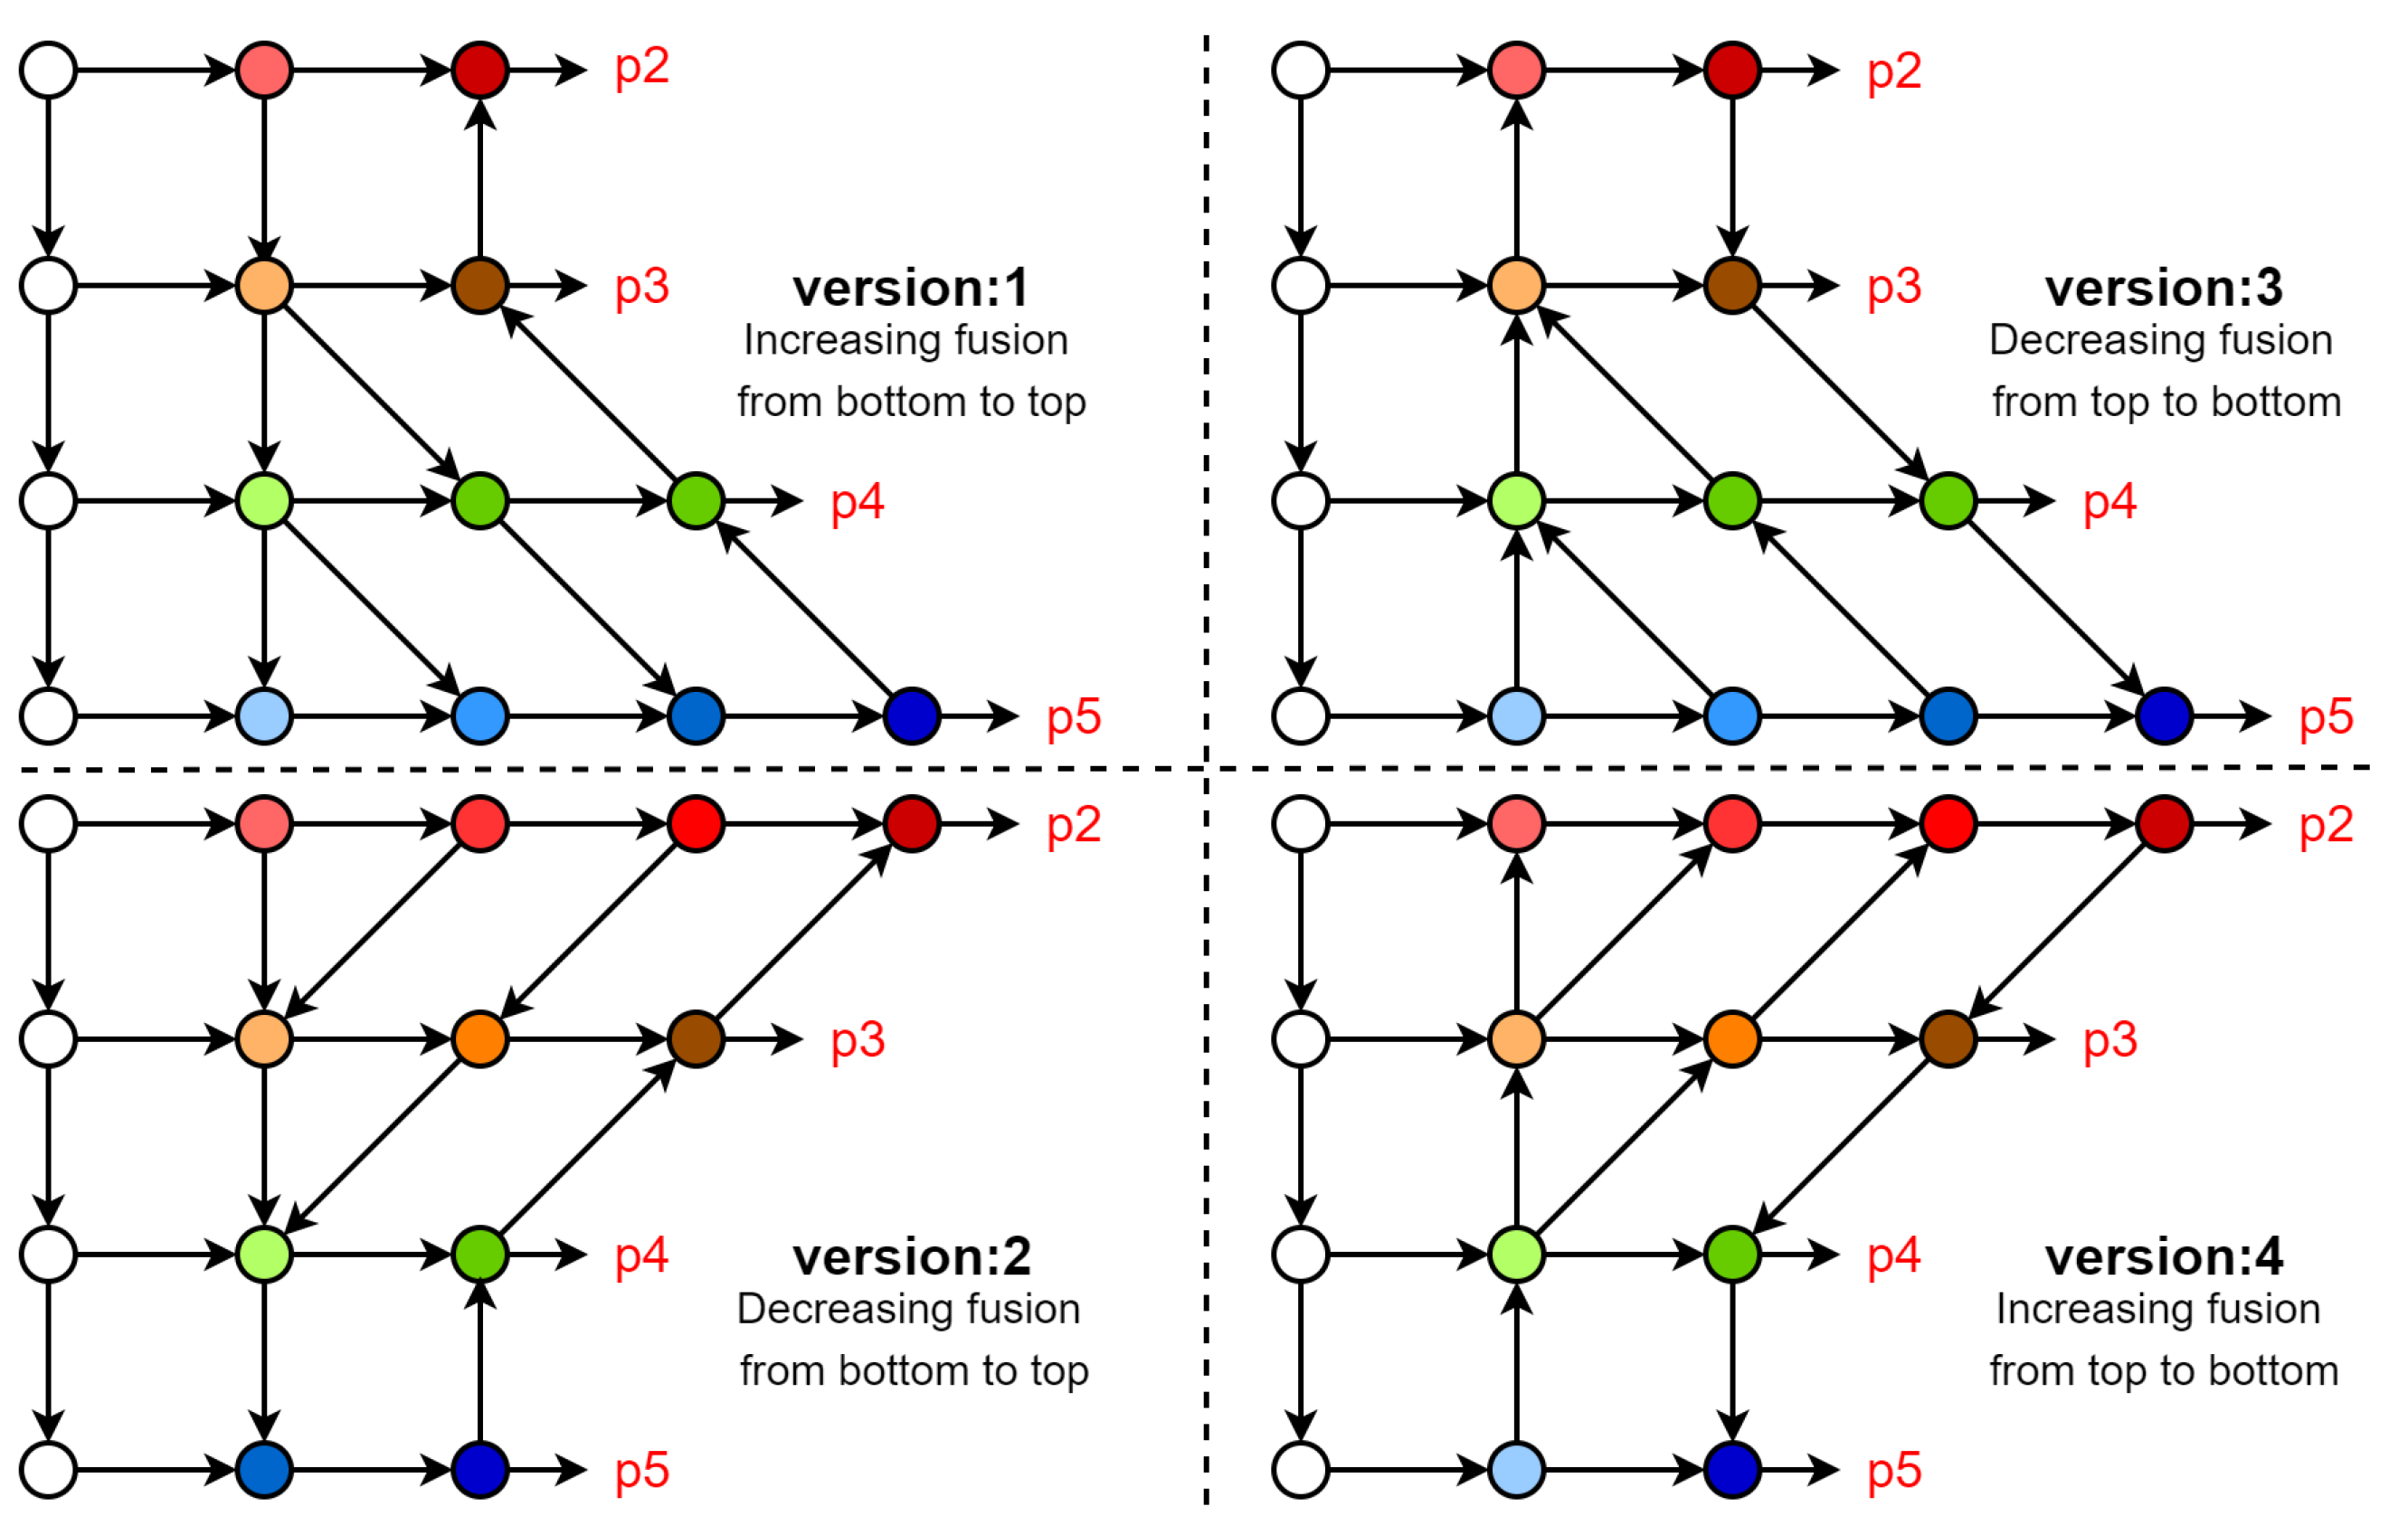
- We propose a new feature fusion network (PFFN), which fully integrates shallow features and deep features, addresses the issue of multi-scale objects, and improves the detection ability of small objects.
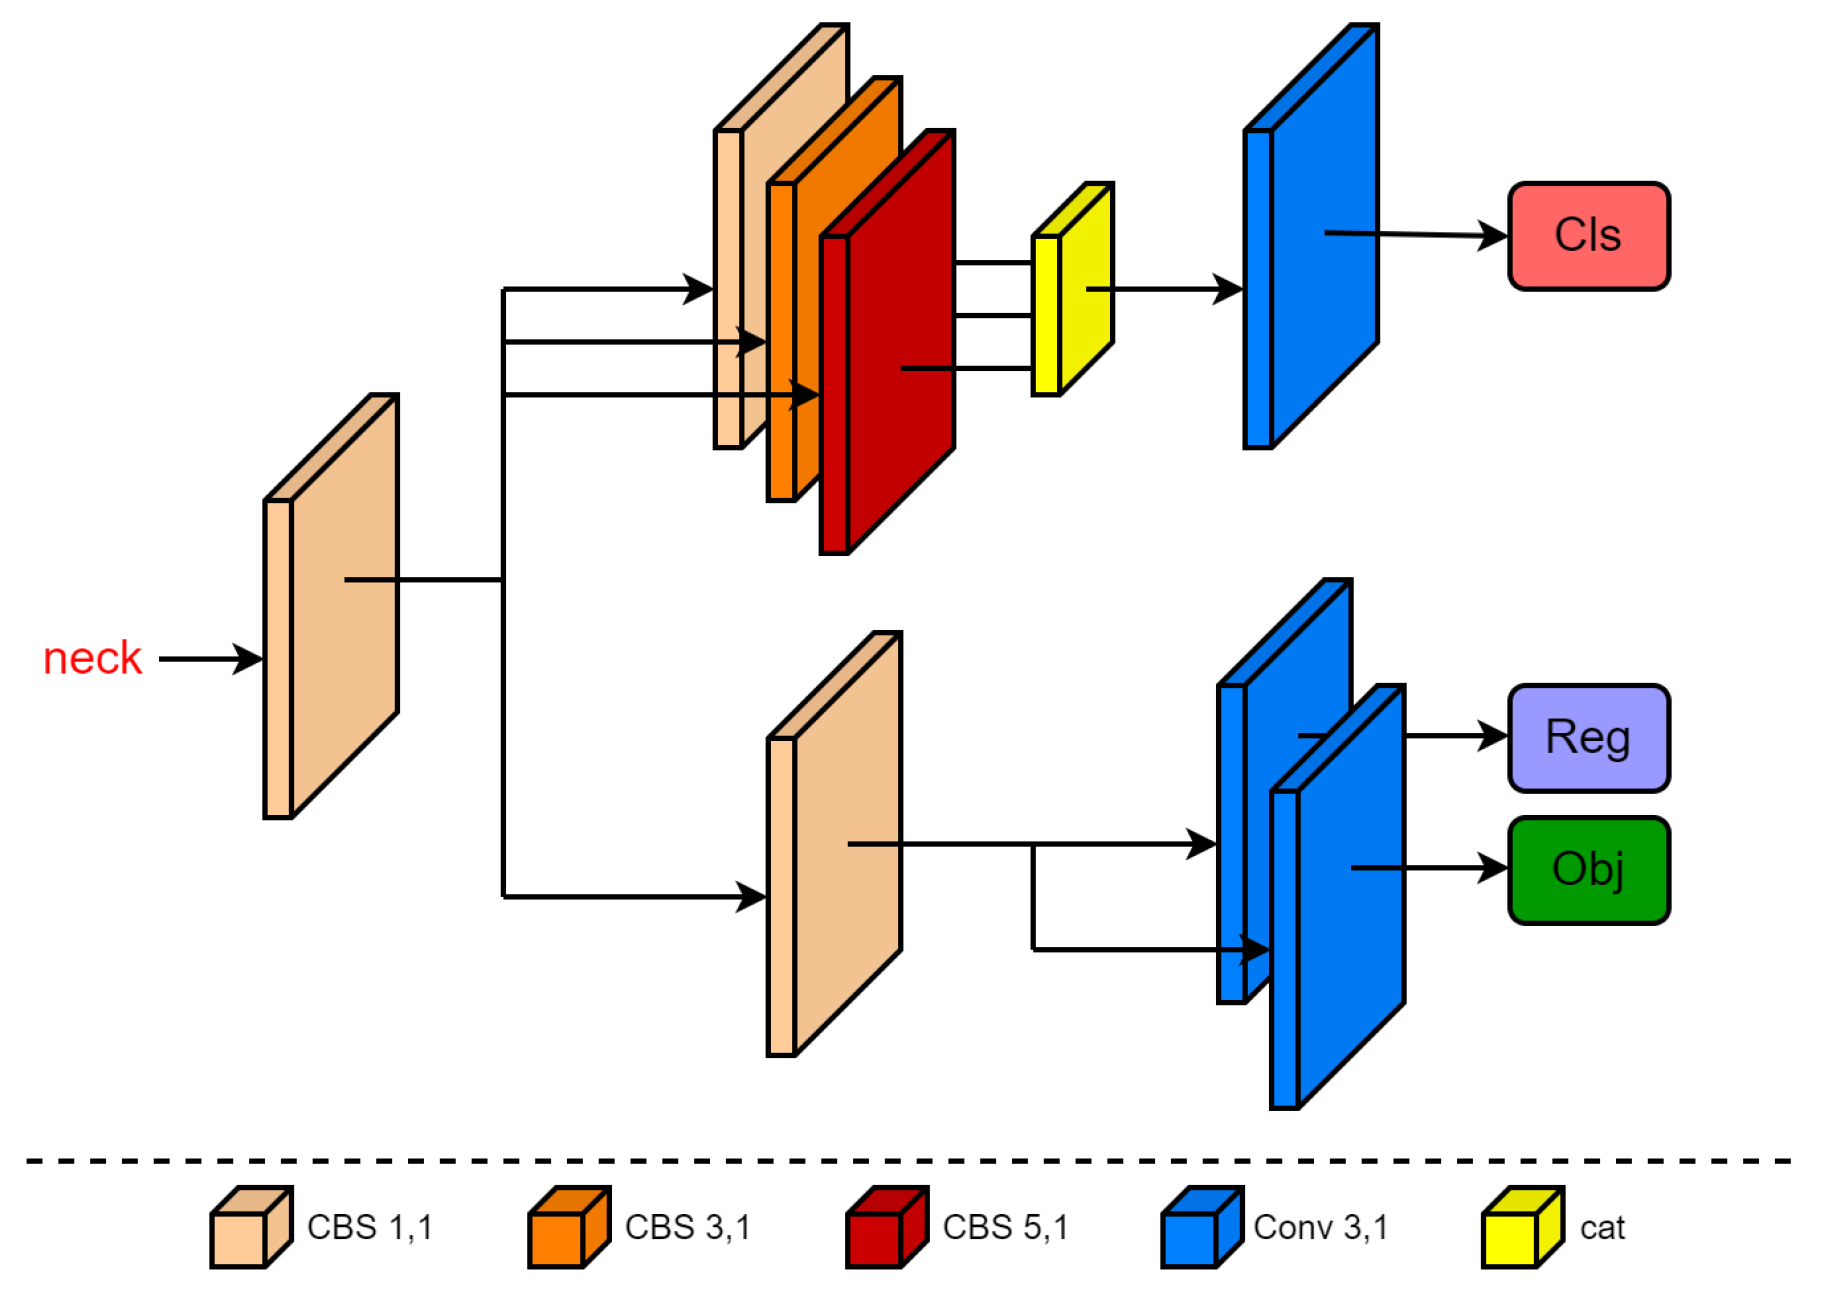
- We propose an asymmetric decoupled head, which improves the network’s ability to classify and locate similar and overlapping objects.
2. Related Work
2.1. Regression Loss Function
2.2. Neck
2.3. Detection Head
3. Methodology
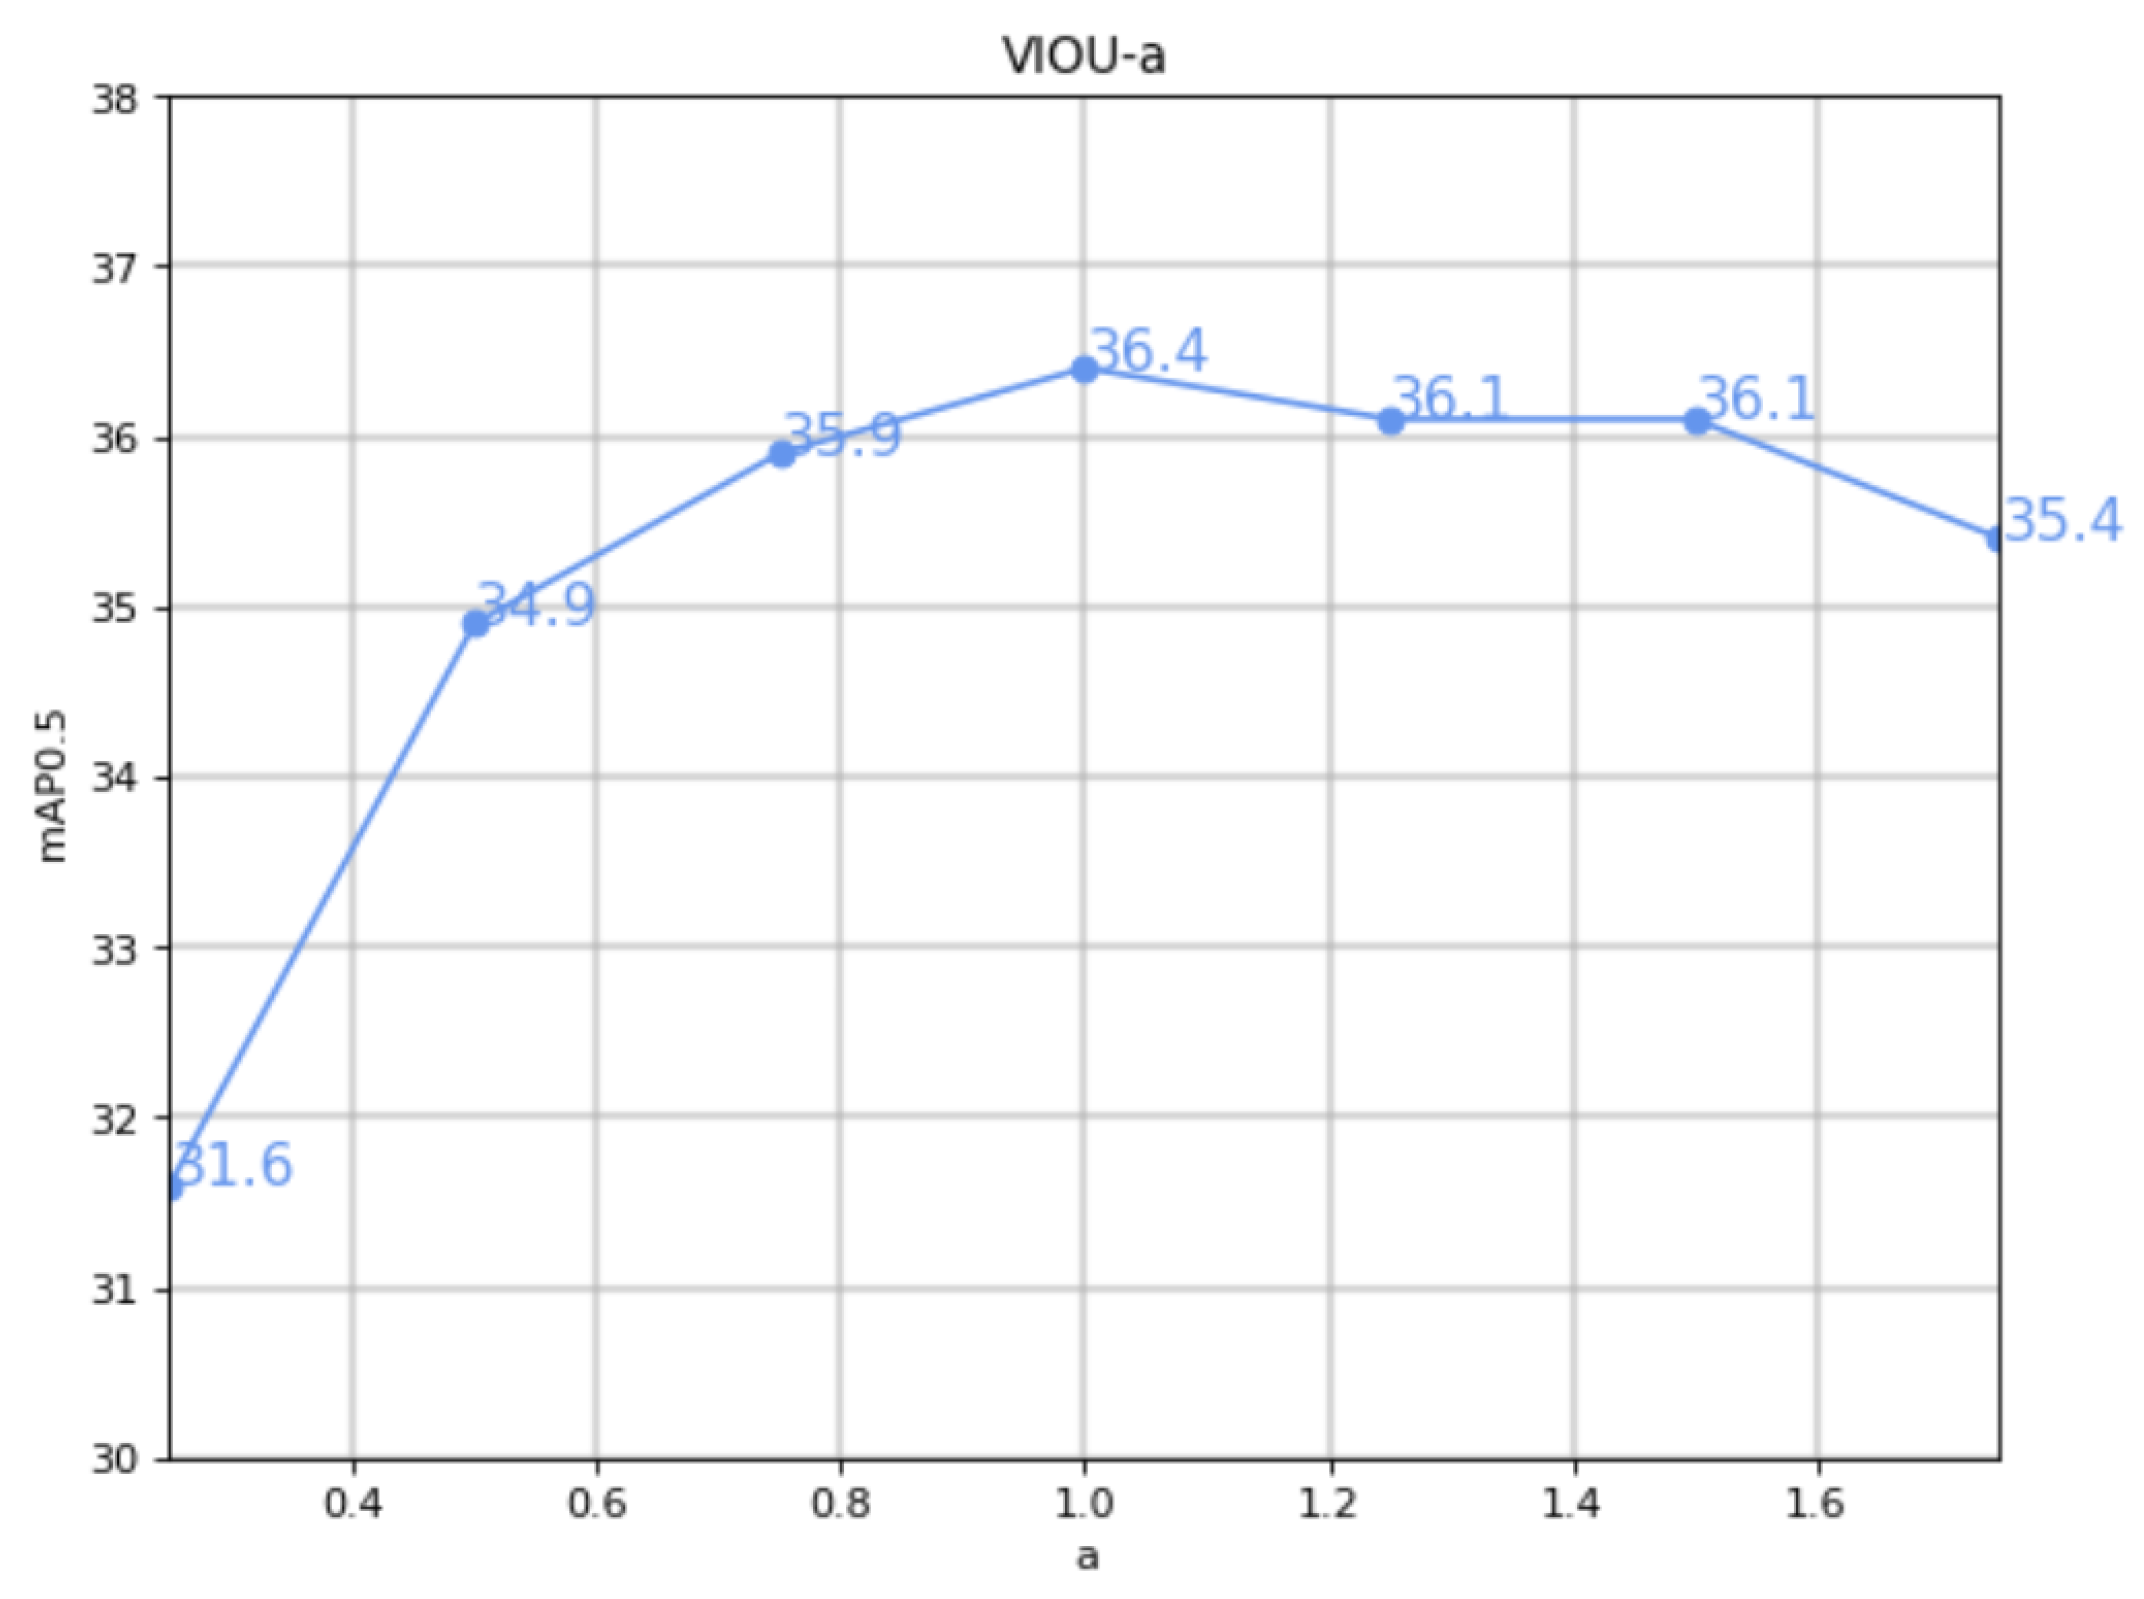
3.1. VIOU Loss
3.2. Progressive Feature Fusion Network
3.3. Asymmetric Decoupled Head
4. Experiment
4.1. VIOU Property Comparison Experiment
4.2. Comparison Experiment of Feature Fusion Characteristics of Neck Network
4.3. Ablation Experiment
4.4. Comparison of Different Detectors
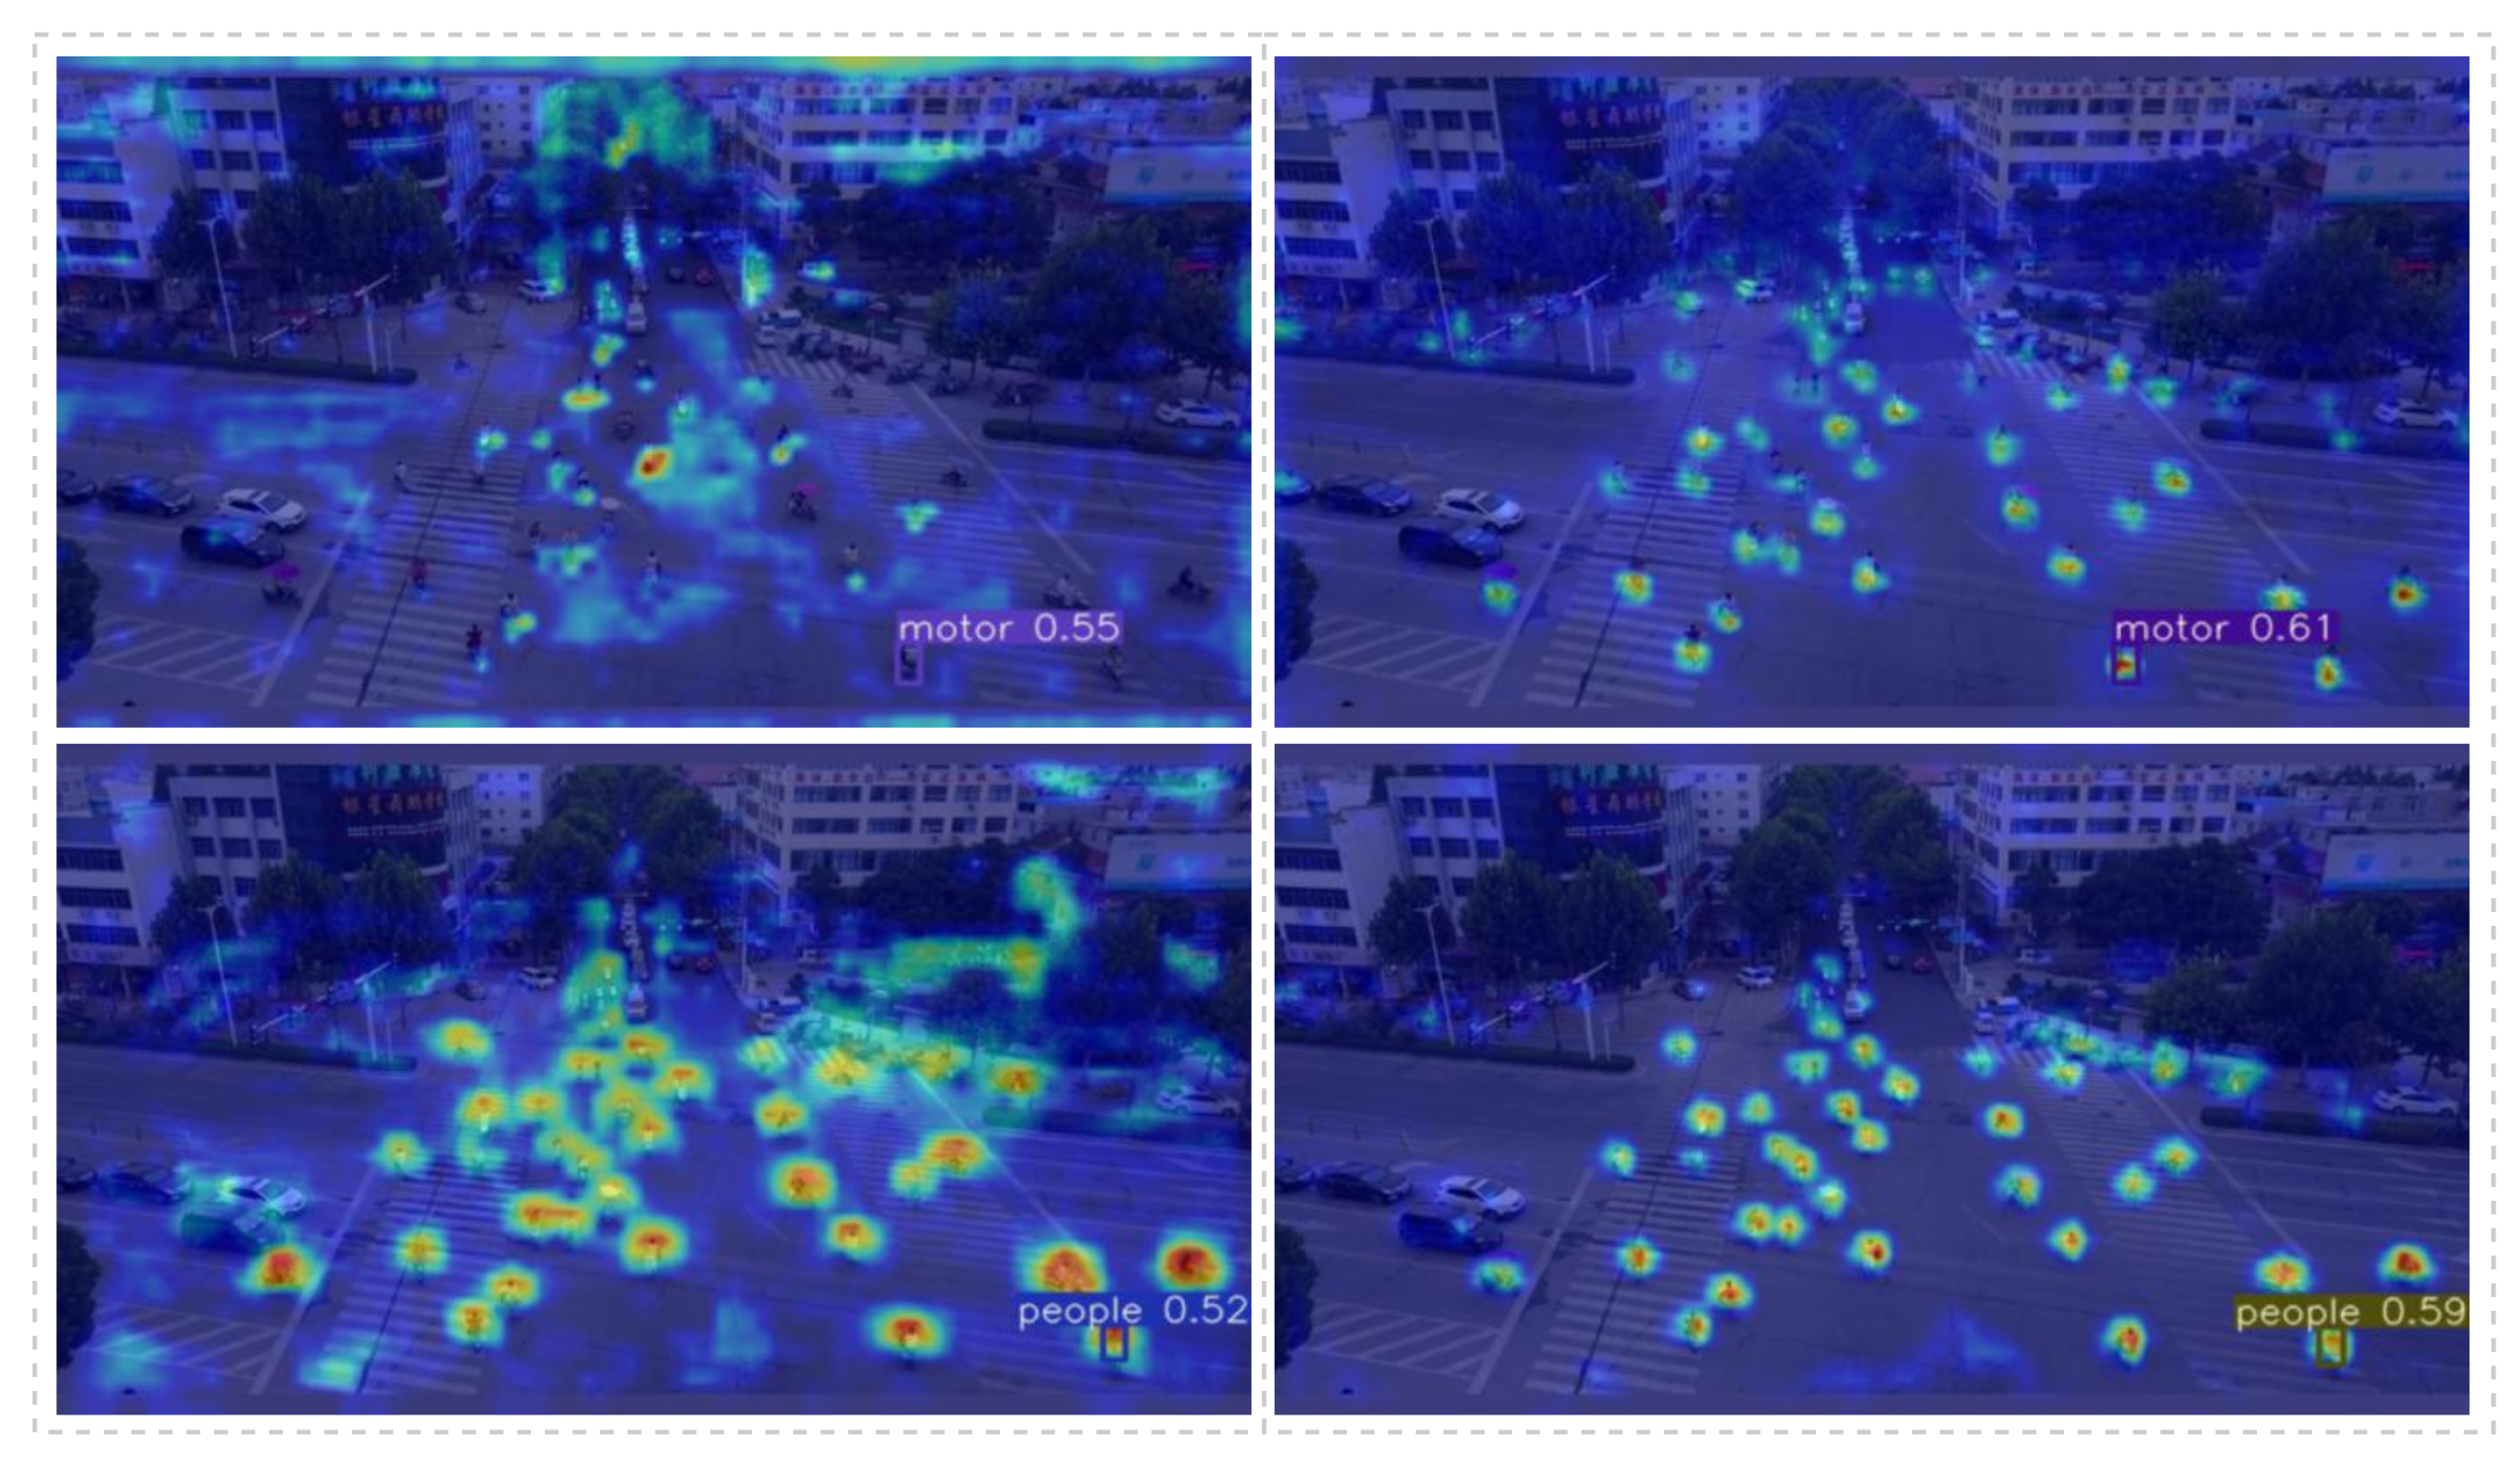
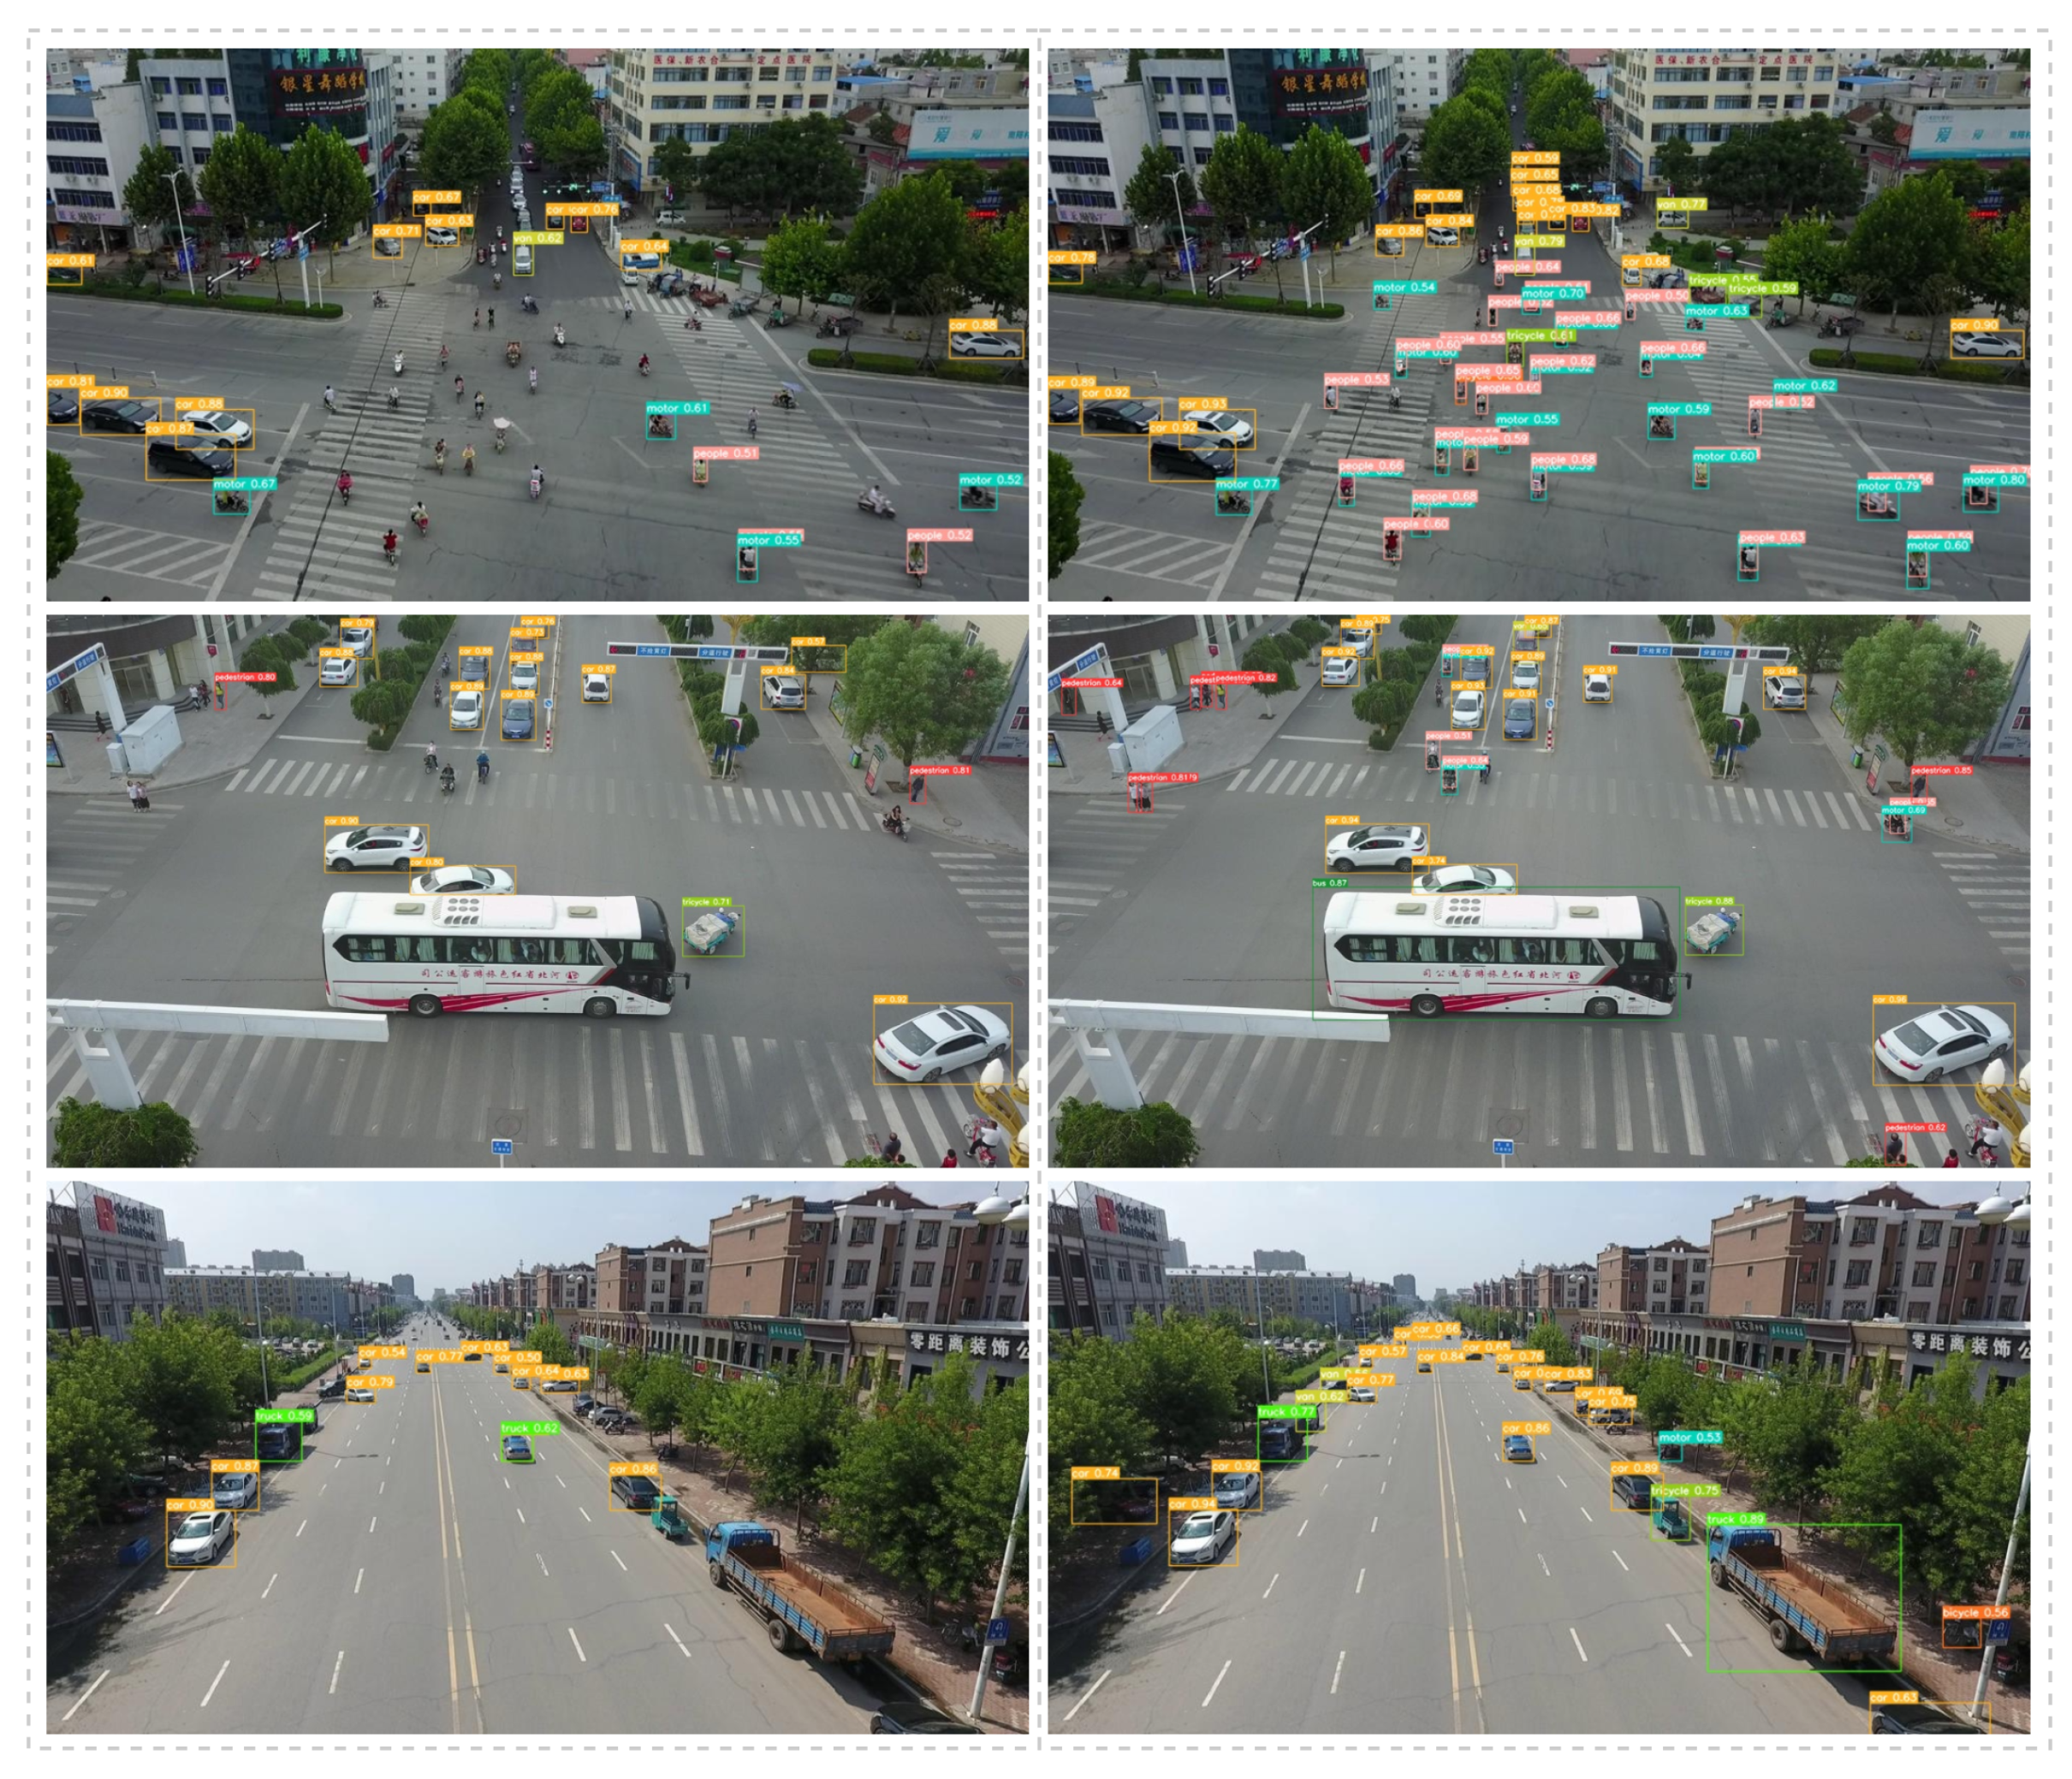
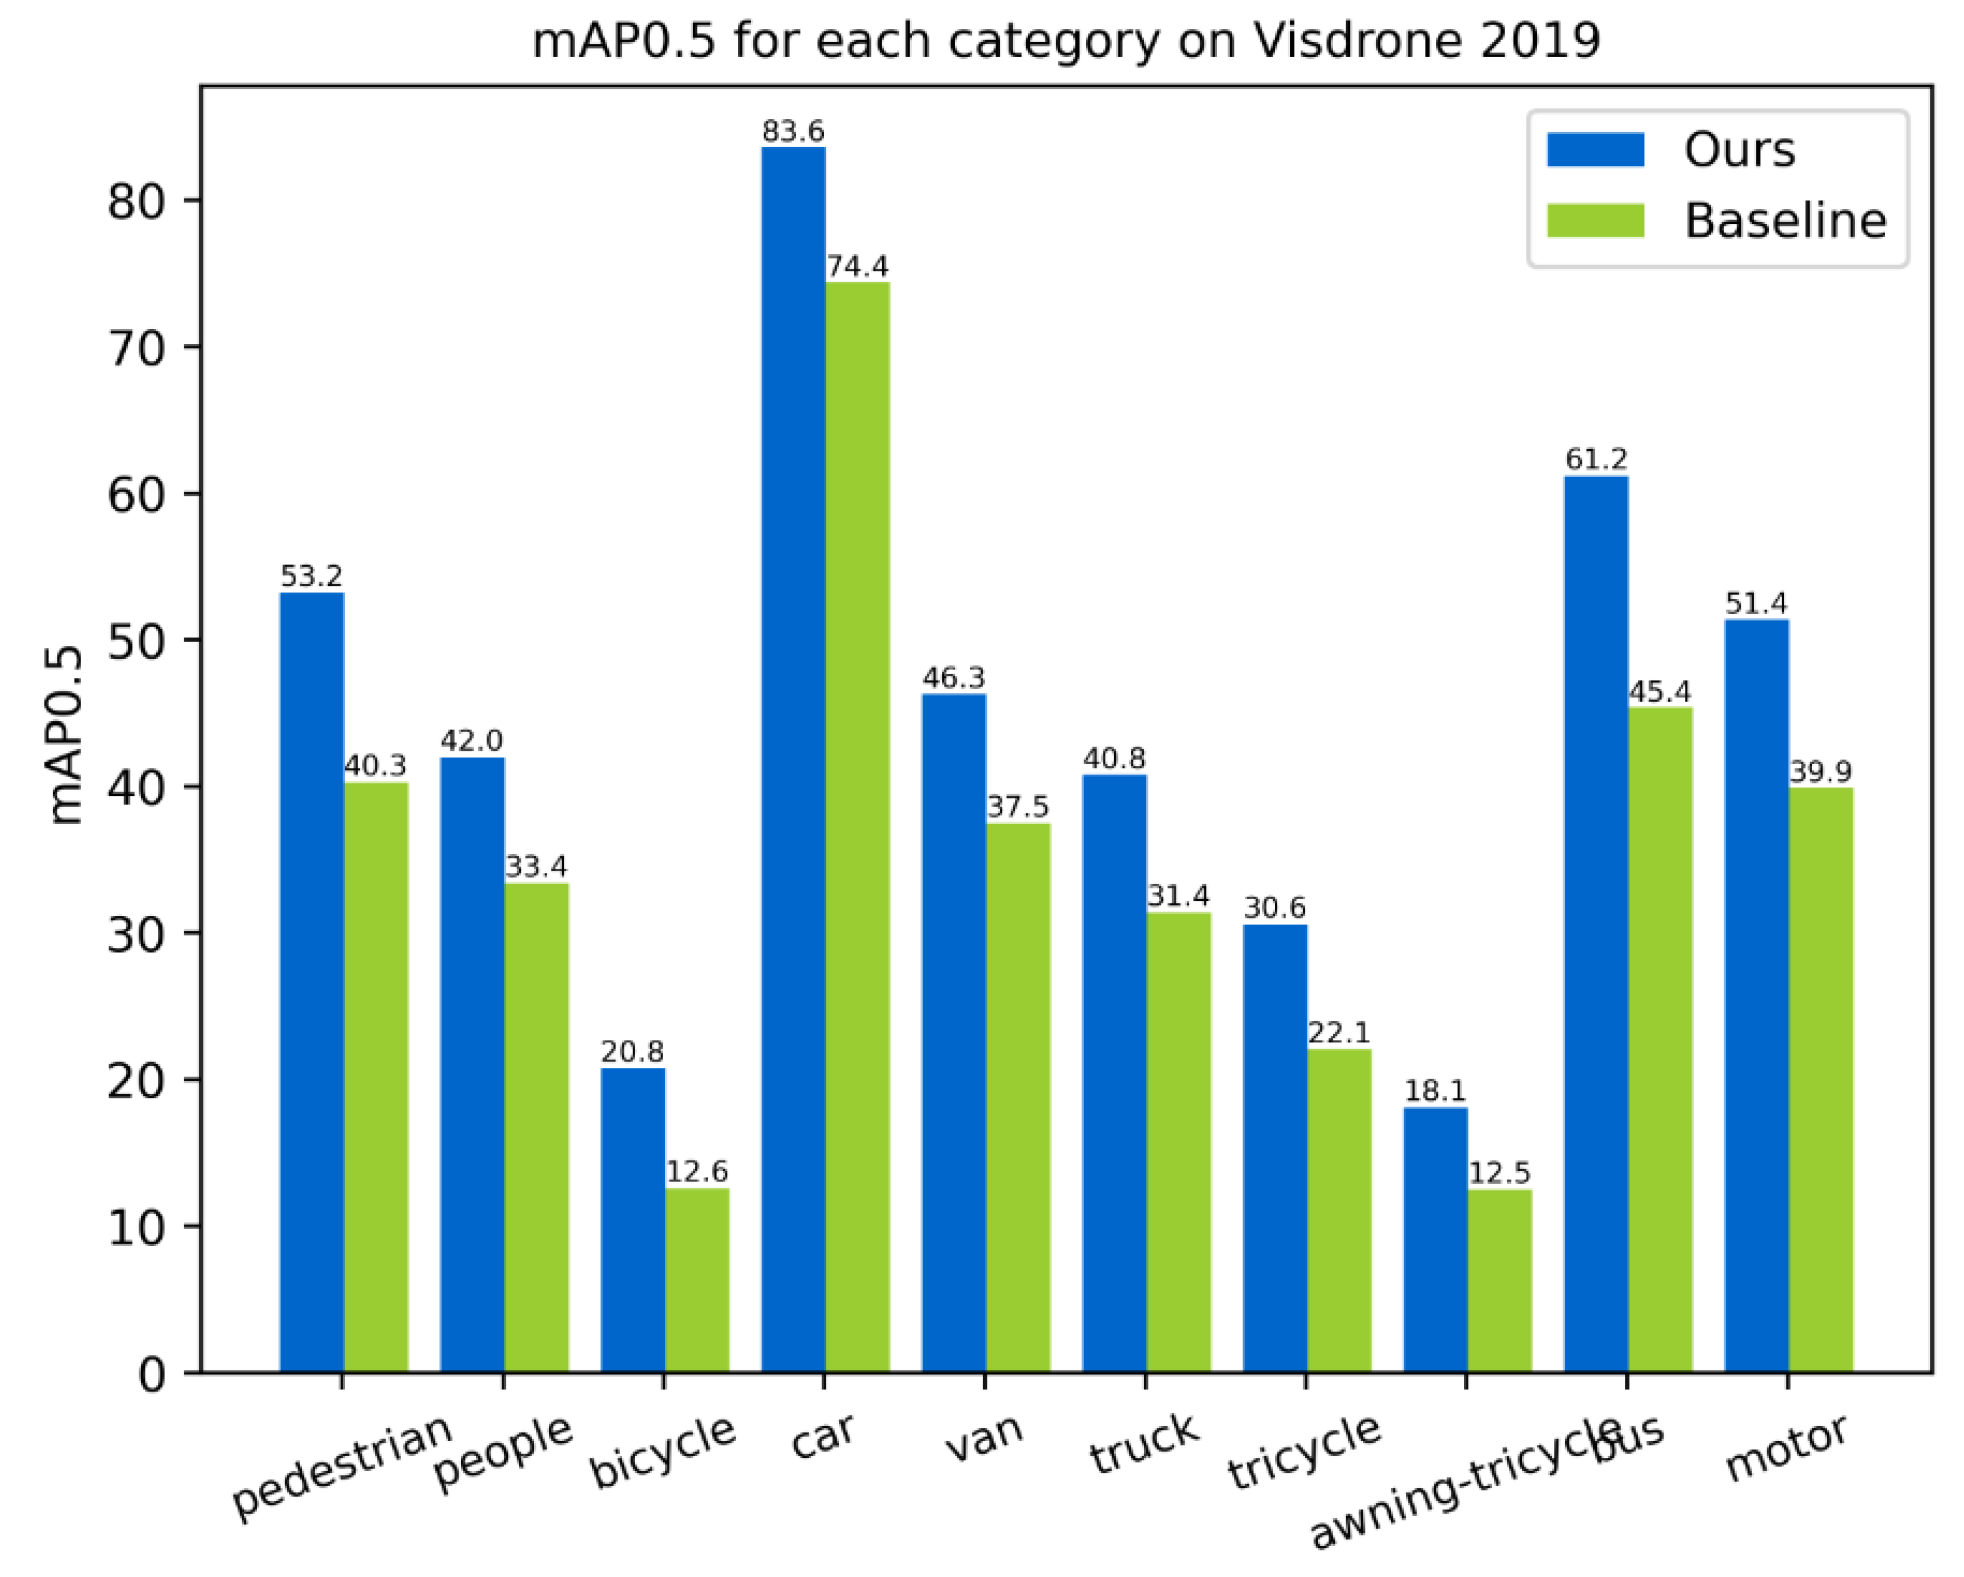
4.5. Visual Analysis
5. Conclusions
Author Contributions
Funding
Institutional Review Board Statement
Informed Consent Statement
Data Availability Statement
Conflicts of Interest
References
- Girshick, R.; Donahue, J.; Darrell, T.; Malik, J. Rich feature hierarchies for accurate object detection and semantic segmentation. arXiv 2013, arXiv:1311.2524. [Google Scholar] [CrossRef]
- Girshick, R. Fast R-CNN. In Proceedings of the IEEE International Conference on Computer Vision (ICCV), Santiago, Chile, 7–13 December 2015. [Google Scholar]
- Ren, S.; He, K.; Girshick, R.; Sun, J. Faster R-CNN: Towards Real-Time Object Detection with Region Proposal Networks. arXiv 2015, arXiv:1506.01497. [Google Scholar] [CrossRef] [Green Version]
- Redmon, J.; Divvala, S.; Girshick, R.; Farhadi, A. You Only Look Once: Unified, Real-Time Object Detection. In Proceedings of the 2016 IEEE Conference on Computer Vision and Pattern Recognition (CVPR), Las Vegas, NV, USA, 27–30 June 2016; pp. 779–788. [Google Scholar] [CrossRef] [Green Version]
- Redmon, J.; Farhadi, A. YOLOv3: An Incremental Improvement. arXiv 2018, arXiv:1804.02767. [Google Scholar]
- Bochkovskiy, A.; Wang, C.Y.; Liao, H.Y.M. YOLOv4: Optimal Speed and Accuracy of Object Detection. arXiv 2020, arXiv:2004.10934. [Google Scholar]
- Jocher, G. Stoken Yolo v5. Available online: https://github.com/ultralytics/yolov5/releases/tag/v6.0 (accessed on 12 October 2021).
- Li, C.; Li, L.; Jiang, H.; Weng, K.; Geng, Y.; Li, L.; Ke, Z.; Li, Q.; Cheng, M.; Nie, W.; et al. YOLOv6: A Single-Stage Object Detection Framework for Industrial Applications. arXiv 2022, arXiv:2209.02976. [Google Scholar]
- Redmon, J.; Farhadi, A. YOLO9000: Better, Faster, Stronger. In Proceedings of the 2017 IEEE Conference on Computer Vision and Pattern Recognition (CVPR), Honolulu, HI, USA, 21–26 July 2017; pp. 6517–6525. [Google Scholar] [CrossRef] [Green Version]
- Wang, C.Y.; Bochkovskiy, A.; Liao, H.Y.M. YOLOv7: Trainable bag-of-freebies sets new state-of-the-art for real-time object detectors. arXiv 2022, arXiv:2207.02696. [Google Scholar]
- Ultralytics, G.J. Yolo v8. Available online: https://github.com/ultralytics/ultralytics.git (accessed on 9 January 2023).
- Liu, W.; Anguelov, D.; Erhan, D.; Szegedy, C.; Reed, S.; Fu, C.Y.; Berg, A.C. Ssd: Single shot multibox detector. In Proceedings of the European Conference on Computer Vision, Amsterdam, The Netherlands, 11–14 October 2016; pp. 21–37. [Google Scholar]
- Lin, T.; Goyal, P.; Girshick, R.; He, K.; Dollár, P. Focal Loss for Dense Object Detection. In Proceedings of the 2017 IEEE International Conference on Computer Vision (ICCV), Venice, Italy, 22–29 October 2017; pp. 2999–3007. [Google Scholar] [CrossRef] [Green Version]
- Duan, K.; Bai, S.; Xie, L.; Qi, H.; Huang, Q.; Tian, Q. Centernet: Keypoint triplets for object detection. In Proceedings of the IEEE/CVF International Conference on Computer Vision, Seoul, Republic of Korea, 27 October–2 November 2019; pp. 6569–6578. [Google Scholar]
- Ding, J.; Xue, N.; Xia, G.S.; Bai, X.; Yang, W.; Yang, M.Y.; Belongie, S.; Luo, J.; Datcu, M.; Pelillo, M.; et al. Object Detection in Aerial Images: A Large-Scale Benchmark and Challenges. arXiv 2021, arXiv:2102.12219. [Google Scholar] [CrossRef]
- Shadab Malik, H.; Sobirov, I.; Mohamed, A. Object Detection in Aerial Images: What Improves the Accuracy? arXiv 2022, arXiv:2201.08763. [Google Scholar]
- Koyun, O.C.; Keser, R.K.; Akkaya, İ.B.; Töreyin, B.U. Focus-and-Detect: A small object detection framework for aerial images. Signal Process. Image Commun. 2022, 104, 116675. [Google Scholar] [CrossRef]
- Li, C.; Yang, T.; Zhu, S.; Chen, C.; Guan, S. Density map guided object detection in aerial images. In Proceedings of the IEEE/CVF Conference on Computer Vision and Pattern Recognition Workshops, Seattle, WA, USA, 14–19 June 2020; pp. 190–191. [Google Scholar]
- Duan, C.; Wei, Z.; Zhang, C.; Qu, S.; Wang, H. Coarse-grained Density Map Guided Object Detection in Aerial Images. In Proceedings of the IEEE/CVF International Conference on Computer Vision, Montreal, BC, Canada, 11–17 October 2021; pp. 2789–2798. [Google Scholar]
- Zhu, X.; Lyu, S.; Wang, X.; Zhao, Q. TPH-YOLOv5: Improved YOLOv5 Based on Transformer Prediction Head for Object Detection on Drone-captured Scenarios. arXiv 2021, arXiv:2108.11539. [Google Scholar]
- Luo, X.; Wu, Y.; Zhao, L. YOLOD: A Target Detection Method for UAV Aerial Imagery. Remote Sens. 2022, 14, 3240. [Google Scholar] [CrossRef]
- Liu, H.; Mu, C.; Yang, R.; He, Y.; Wu, N. Research on Object Detection Algorithm Based on UVA Aerial Image. In Proceedings of the 2021 7th IEEE International Conference on Network Intelligence and Digital Content (IC-NIDC), Beijing, China, 17–19 November 2021; pp. 122–127. [Google Scholar] [CrossRef]
- Li, Z.; Sun, S.; Li, Y.; Sun, B.; Tian, K.; Qiao, L.; Lu, X. Aerial Image Object Detection Method Based on Adaptive ClusDet Network. In Proceedings of the 2021 IEEE 21st International Conference on Communication Technology (ICCT), Tianjin, China, 13–16 October 2021; pp. 1091–1096. [Google Scholar] [CrossRef]
- Cao, C.; Wu, J.; Zeng, X.; Feng, Z.; Wang, T.; Yan, X.; Wu, Z.; Wu, Q.; Huang, Z. Research on Airplane and Ship Detection of Aerial Remote Sensing Images Based on Convolutional Neural Network. Sensors 2020, 20, 4696. [Google Scholar] [CrossRef] [PubMed]
- Zheng, Z.; Wang, P.; Liu, W.; Li, J.; Ye, R.; Ren, D. Distance-IoU loss: Faster and better learning for bounding box regression. In Proceedings of the AAAI Conference on Artificial Intelligence, New York, NY, USA, 7–12 February 2020; Volume 34, pp. 12993–13000. [Google Scholar]
- Ge, Z.; Liu, S.; Wang, F.; Li, Z.; Sun, J. YOLOX: Exceeding YOLO Series in 2021. arXiv 2021, arXiv:2107.08430. [Google Scholar]
- Zhu, P.; Wen, L.; Du, D.; Bian, X.; Fan, H.; Hu, Q.; Ling, H. Detection and Tracking Meet Drones Challenge. IEEE Trans. Pattern Anal. Mach. Intell. 2021, 44, 7380–7399. [Google Scholar] [CrossRef]
- Xia, G.S.; Bai, X.; Ding, J.; Zhu, Z.; Belongie, S.; Luo, J.; Datcu, M.; Pelillo, M.; Zhang, L. DOTA: A Large-Scale Dataset for Object Detection in Aerial Images. In Proceedings of the IEEE Conference on Computer Vision and Pattern Recognition (CVPR), Salt Lake City, UT, USA, 18–22 June 2018. [Google Scholar]
- Ding, J.; Xue, N.; Long, Y.; Xia, G.S.; Lu, Q. Learning RoI Transformer for Detecting Oriented Objects in Aerial Images. In Proceedings of the IEEE Conference on Computer Vision and Pattern Recognition (CVPR), Long Beach, CA, USA, 16–20 June 2019. [Google Scholar]
- Zhou, D.; Fang, J.; Song, X.; Guan, C.; Yin, J.; Dai, Y.; Yang, R. IoU Loss for 2D/3D Object Detection. In Proceedings of the 2019 International Conference on 3D Vision (3DV), Quebec City, QC, Canada, 16–19 September 2019; pp. 85–94. [Google Scholar]
- Rezatofighi, H.; Tsoi, N.; Gwak, J.; Sadeghian, A.; Reid, I.; Savarese, S. Generalized intersection over union: A metric and a loss for bounding box regression. In Proceedings of the IEEE/CVF Conference on Computer Vision and Pattern Recognition, Long Beach, CA, USA, 15–20 June 2019; pp. 658–666. [Google Scholar]
- Xu, C.; Wang, J.; Yang, W.; Yu, L. Dot Distance for Tiny Object Detection in Aerial Images. In Proceedings of the IEEE/CVF Conference on Computer Vision and Pattern Recognition, Virtual, 19–25 June 2021; pp. 1192–1201. [Google Scholar]
- Yang, Z.; Wang, X.; Li, J. EIoU: An Improved Vehicle Detection Algorithm Based on VehicleNet Neural Network. J. Phys. Conf. Ser. 2021, 1924, 012001. [Google Scholar] [CrossRef]
- Gevorgyan, Z. SIoU Loss: More Powerful Learning for Bounding Box Regression. arXiv 2022, arXiv:2205.12740. [Google Scholar]
- He, J.; Erfani, S.; Ma, X.; Bailey, J.; Chi, Y.; Hua, X.S. Alpha-IoU: A Family of Power Intersection over Union Losses for Bounding Box Regression. arXiv 2021, arXiv:2110.13675. [Google Scholar]
- He, K.; Gkioxari, G.; Dollar, P.; Girshick, R. Mask R-CNN. In Proceedings of the IEEE International Conference on Computer Vision (ICCV), Venice, Italy, 22–29 October 2017. [Google Scholar]
- Cai, Z.; Vasconcelos, N. Cascade R-CNN: Delving Into High Quality Object Detection. In Proceedings of the 2018 IEEE/CVF Conference on Computer Vision and Pattern Recognition, Salt Lake City, UT, USA, 18–22 June 2018; pp. 6154–6162. [Google Scholar] [CrossRef] [Green Version]
- Lin, T.; Dollár, P.; Girshick, R.; He, K.; Hariharan, B.; Belongie, S. Feature Pyramid Networks for Object Detection. In Proceedings of the 2017 IEEE Conference on Computer Vision and Pattern Recognition (CVPR), Honolulu, HI, USA, 21–26 July 2017; pp. 936–944. [Google Scholar] [CrossRef] [Green Version]
- Wang, K.; Liew, J.H.; Zou, Y.; Zhou, D.; Feng, J. PANet: Few-Shot Image Semantic Segmentation With Prototype Alignment. In Proceedings of the IEEE/CVF International Conference on Computer Vision (ICCV), Seoul, Republic of Korea, 27 October–2 November 2019. [Google Scholar]
- Huang, W.; Li, G.; Chen, Q.; Ju, M.; Qu, J. CF2PN: A Cross-Scale Feature Fusion Pyramid Network Based Remote Sensing Target Detection. Remote. Sens. 2021, 13, 847. [Google Scholar] [CrossRef]
- Zhou, L.; Rao, X.; Li, Y.; Zuo, X.; Qiao, B.; Lin, Y. A Lightweight Object Detection Method in Aerial Images Based on Dense Feature Fusion Path Aggregation Network. Isprs Int. J. Geo-Inf. 2022, 11, 189. [Google Scholar] [CrossRef]
- Tayara, H.; Chong, K.T. Object Detection in Very High-Resolution Aerial Images Using One-Stage Densely Connected Feature Pyramid Network. Sensors 2018, 18, 3341. [Google Scholar] [CrossRef] [Green Version]
- Tian, H.; Zheng, Y.; Jin, Z. Improved RetinaNet model for the application of small target detection in the aerial images. In Proceedings of the IOP Conference Series: Earth and Environmental Science, Changsha, China, 18–20 September 2020. [Google Scholar]
- Hamoda, M. Kinetic analysis of aerated submerged fixed-film (ASFF) bioreactors. Water Res. 1989, 23, 1147–1154. [Google Scholar] [CrossRef]
- Ghiasi, G.; Lin, T.Y.; Le, Q.V. NAS-FPN: Learning Scalable Feature Pyramid Architecture for Object Detection. In Proceedings of the IEEE/CVF Conference on Computer Vision and Pattern Recognition (CVPR), Long Beach, CA, USA, 15–20 June 2019. [Google Scholar]
- Tan, M.; Pang, R.; Le, Q.V. Efficientdet: Scalable and efficient object detection. In Proceedings of the IEEE/CVF Conference on Computer Vision and Pattern Recognition, Seattle, WA, USA, 13–19 June 2020; pp. 10781–10790. [Google Scholar]
- Qiao, S.; Chen, L.C.; Yuille, A. Detectors: Detecting objects with recursive feature pyramid and switchable atrous convolution. In Proceedings of the IEEE/CVF Conference on Computer Vision and Pattern Recognition, Nashville, TN, USA, 20–25 June 2021; pp. 10213–10224. [Google Scholar]
- Jiang, B.; Luo, R.; Mao, J.; Xiao, T.; Jiang, Y. Acquisition of Localization Confidence for Accurate Object Detection. In Proceedings of the European Conference on Computer Vision (ECCV), Munich, Germany, 8–14 September 2018. [Google Scholar]
- Song, G.; Liu, Y.; Wang, X. Revisiting the Sibling Head in Object Detector. In Proceedings of the IEEE/CVF Conference on Computer Vision and Pattern Recognition (CVPR), Seattle, WA, USA, 13–19 June 2020. [Google Scholar]
- Wang, C.Y.; Bochkovskiy, A.; Liao, H.Y.M. Scaled-YOLOv4: Scaling Cross Stage Partial Network. In Proceedings of the IEEE/CVF Conference on Computer Vision and Pattern Recognition (CVPR), Nashville, TN, USA, 20–25 June 2021; pp. 13029–13038. [Google Scholar]
- Wu, Y.; Chen, Y.; Yuan, L.; Liu, Z.; Wang, L.; Li, H.; Fu, Y. Rethinking Classification and Localization for Object Detection. In Proceedings of the IEEE/CVF Conference on Computer Vision and Pattern Recognition (CVPR), Seattle, WA, USA, 13–19 June 2020. [Google Scholar]
- Wang, J.; Song, L.; Li, Z.; Sun, H.; Sun, J.; Zheng, N. End-to-End Object Detection With Fully Convolutional Network. In Proceedings of the IEEE/CVF Conference on Computer Vision and Pattern Recognition (CVPR), Nashville, TN, USA, 20–25 June 2021; pp. 15849–15858. [Google Scholar]
- Chen, Q.; Wang, Y.; Yang, T.; Zhang, X.; Cheng, J.; Sun, J. You Only Look One-Level Feature. In Proceedings of the IEEE/CVF Conference on Computer Vision and Pattern Recognition (CVPR), Nashville, TN, USA, 20–25 June 2021; pp. 13039–13048. [Google Scholar]


| Metrics | ||||
|---|---|---|---|---|
| IOU [30] | 48.2 | 34.6 | 35.0 | 19.3 |
| GIOU [31] | 46.4 | 34.4 | 34.3 | 19.1 |
| DIOU [25] | 47.1 | 34.0 | 34.6 | 19.2 |
| CIOU [25] | 48.4 | 34.6 | 34.9 | 20.5 |
| SIOU [34] | 46.9 | 34.4 | 34.5 | 19.0 |
| EIOU [33] | 46.7 | 35.5 | 35.5 | 19.5 |
| alpha-IOU | 48.1 | 35.8 | 35.7 | 20.5 |
| VIOU(Ours) | 50.9 | 34.9 | 36.4 | 20.7 |
| Neck | |||||||
|---|---|---|---|---|---|---|---|
| Panet [39] | 46.0 | 26.9 | 34.9 | 20.5 | 1.5 | 2387 | 7,037,095 |
| Version 1 | 48.6 | 38.3 | 38.8 | 22.2 | 2.1 | 2693 | 9,751,892 |
| Version 2 | 50.5 | 39.3 | 40.0 | 23.1 | 2.4 | 2727 | 7,681,236 |
| Version 3 | 52.1 | 40.0 | 40.5 | 22.9 | 2.0 | 2743 | 8,603,028 |
| Version 4 | 53.9 | 40.7 | 42.3 | 24.6 | 2.2 | 2679 | 7,408,532 |
| Version | |||||||
|---|---|---|---|---|---|---|---|
| baseline | 48.1 | 34.6 | 34.9 | 19.1 | 1.5 | 2387 | 7,037,095 |
| +VIOU | 50.7 | 34.6 | 36.4 | 20.7 | 1.5 | 2387 | 7,037,095 |
| +VIOU + PFFN | 55.2 | 41.1 | 43.2 | 25.2 | 2.5 | 2657 | 7,408,532 |
| +VIOU + PFFN + AD head | 55.8 | 42.7 | 44.6 | 26.6 | 7.1 | 3805 | 19,258,068 |
| Method | Backbone | ||
|---|---|---|---|
| SSD [12] | ResNet-50 | 10.6 | 5.0 |
| EfficientDet [46] | EfficientDet-D1 | 21.2 | 12.9 |
| RetinaNet [13] | ResNet-50-FPN | 25.5 | 15.1 |
| CenterNet [14] | ResNet-50 | 29.0 | 14.0 |
| Faster R-CNN [3] | ResNet-50-FPN | 35.8 | 19.7 |
| YOLOv3-SPP [5] | DarkNet53 | 18.9 | 10.6 |
| YOLOv5 | CSPDarkNet | 34.9 | 19.1 |
| YOLOv6 [8] | EfficientRep | 28.8 | 19.0 |
| YOLOv7 [10] | ELAN | 37.5 | 23.8 |
| YOLOv8 [11] | CSPDarkNet(C2f) | 41.4 | 24.9 |
| Ours | CSPDarkNet | 44.6 | 26.6 |
| Method | Backbone | ||
|---|---|---|---|
| SDD | VGG | 42.7 | 23.1 |
| EfficientDet | EfficientDet-D1 | 58.9 | 33.7 |
| CenterNet | ResNet-50 | 56.7 | 30.8 |
| Faster R-CNN | ResNet-50-FPN | 62.9 | 30.4 |
| YOLOv5 | CSPDarkNet | 71.4 | 45.9 |
| YOLOv8 | CSPDarkNet(C2f) | 72.2 | 49.0 |
| Ours | CSPDarkNet | 73.5 | 49.2 |
Disclaimer/Publisher’s Note: The statements, opinions and data contained in all publications are solely those of the individual author(s) and contributor(s) and not of MDPI and/or the editor(s). MDPI and/or the editor(s) disclaim responsibility for any injury to people or property resulting from any ideas, methods, instructions or products referred to in the content. |
© 2023 by the authors. Licensee MDPI, Basel, Switzerland. This article is an open access article distributed under the terms and conditions of the Creative Commons Attribution (CC BY) license (https://creativecommons.org/licenses/by/4.0/).
Share and Cite
Lu, S.; Lu, H.; Dong, J.; Wu, S. Object Detection for UAV Aerial Scenarios Based on Vectorized IOU. Sensors 2023, 23, 3061. https://doi.org/10.3390/s23063061
Lu S, Lu H, Dong J, Wu S. Object Detection for UAV Aerial Scenarios Based on Vectorized IOU. Sensors. 2023; 23(6):3061. https://doi.org/10.3390/s23063061
Chicago/Turabian StyleLu, Shun, Hanyu Lu, Jun Dong, and Shuang Wu. 2023. "Object Detection for UAV Aerial Scenarios Based on Vectorized IOU" Sensors 23, no. 6: 3061. https://doi.org/10.3390/s23063061