

CNN–RNN Network Integration for the Diagnosis of COVID-19 Using Chest X-ray and CT Images


Abstract
:1. Introduction
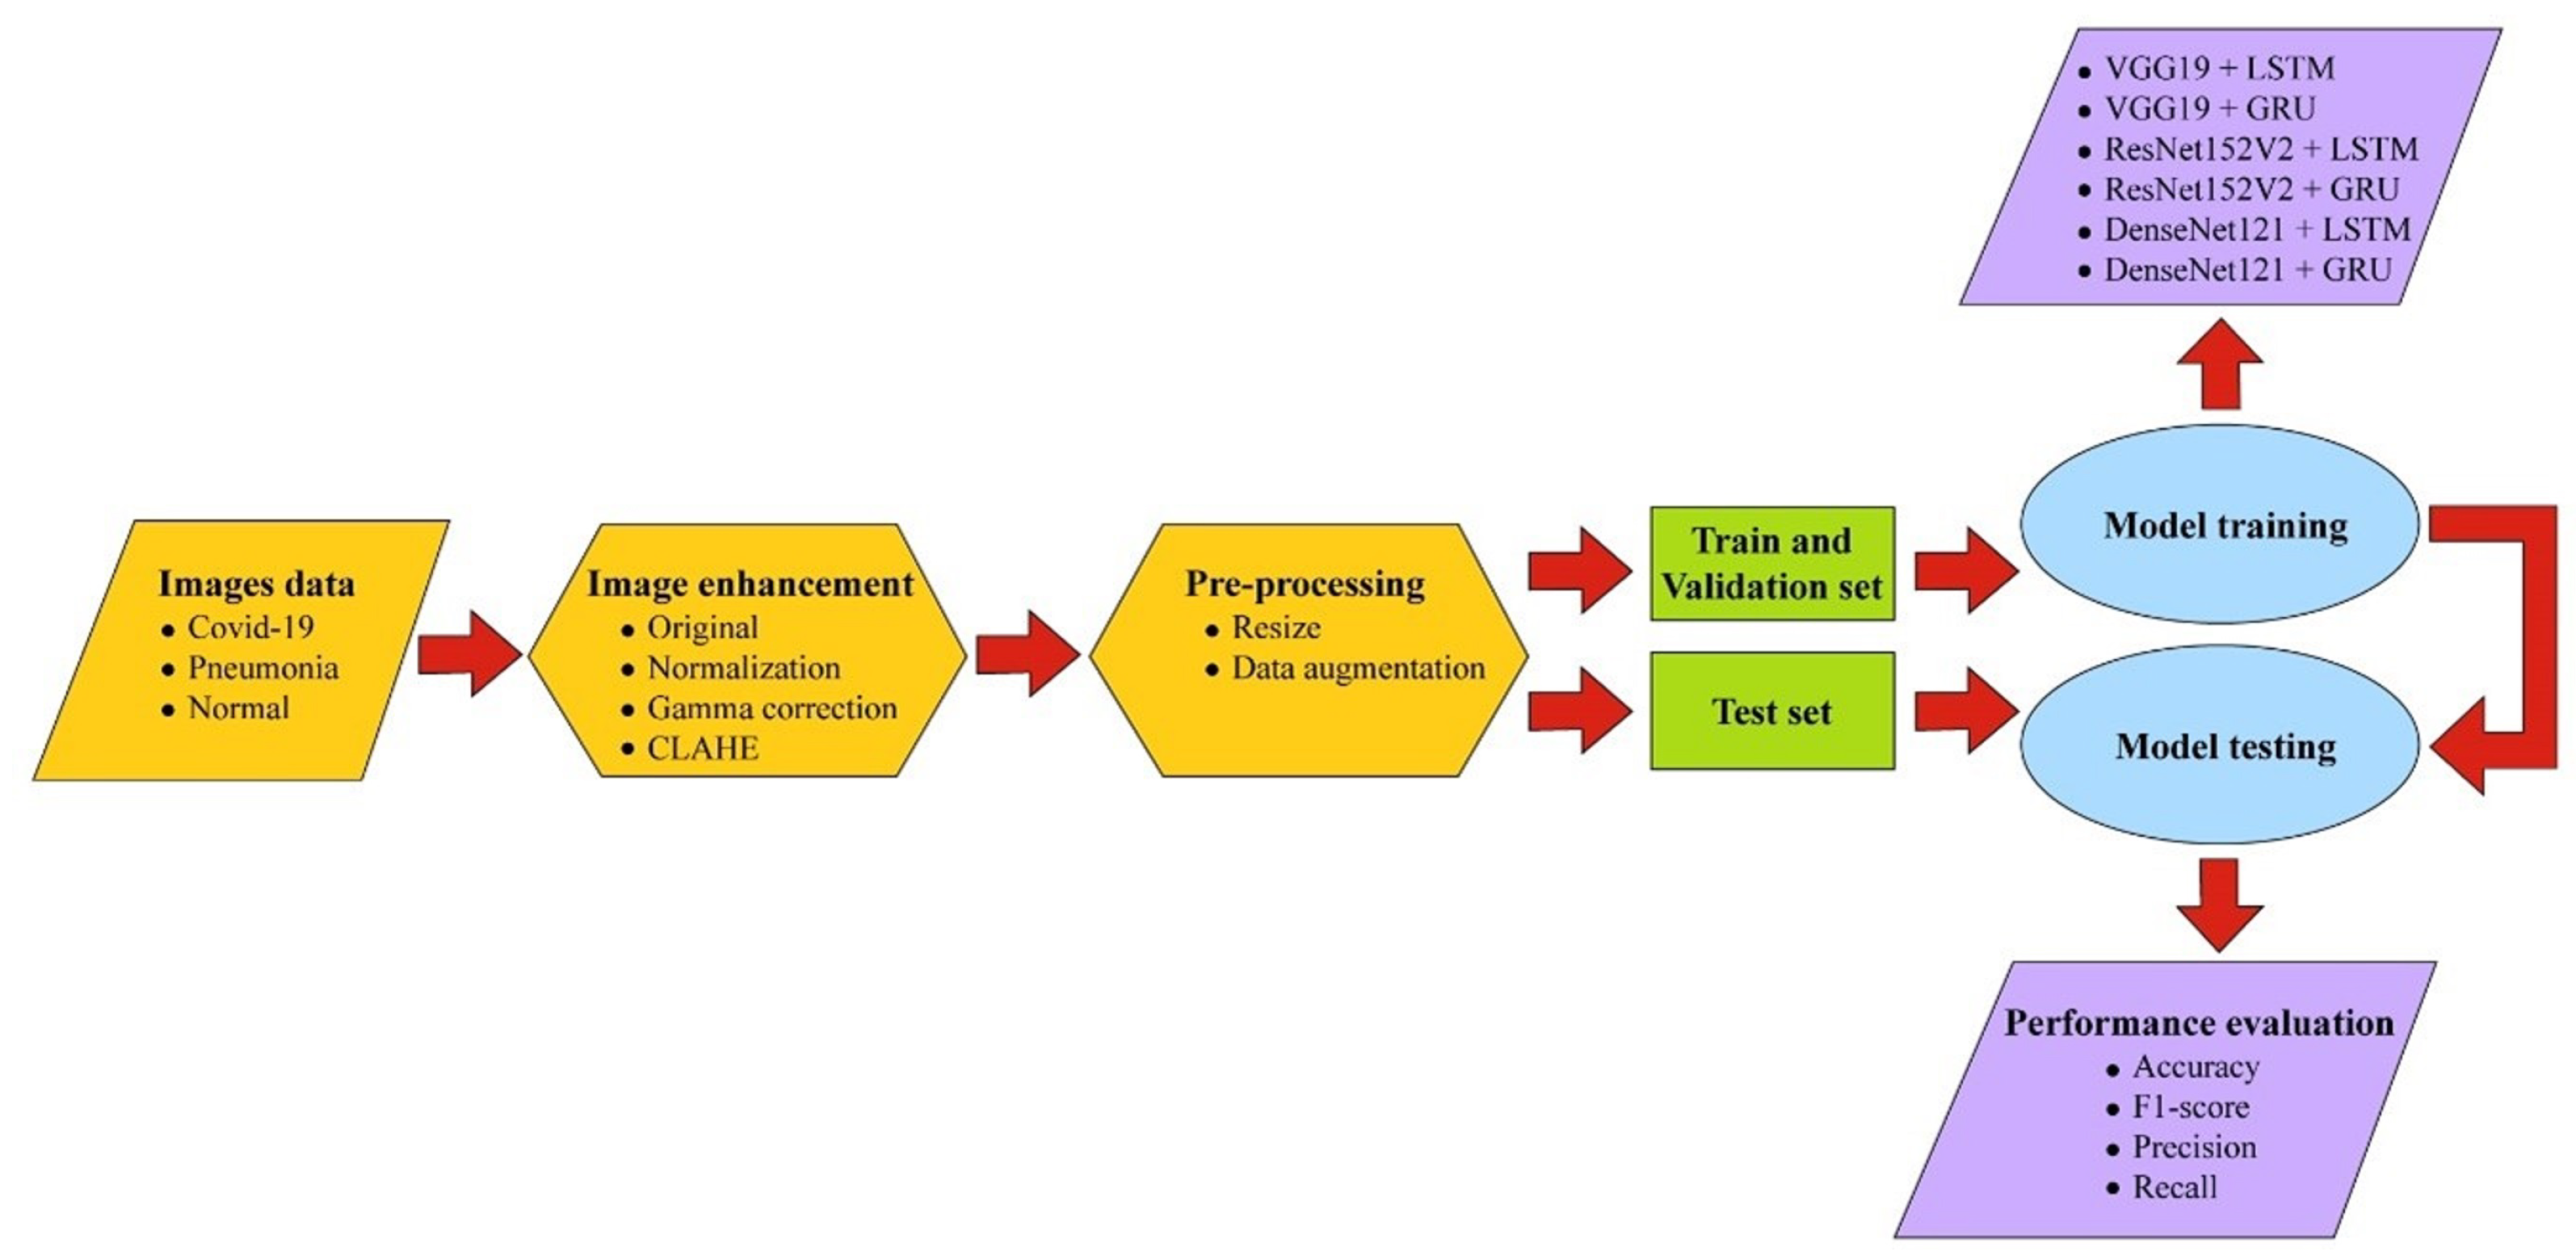
2. Materials and Methods
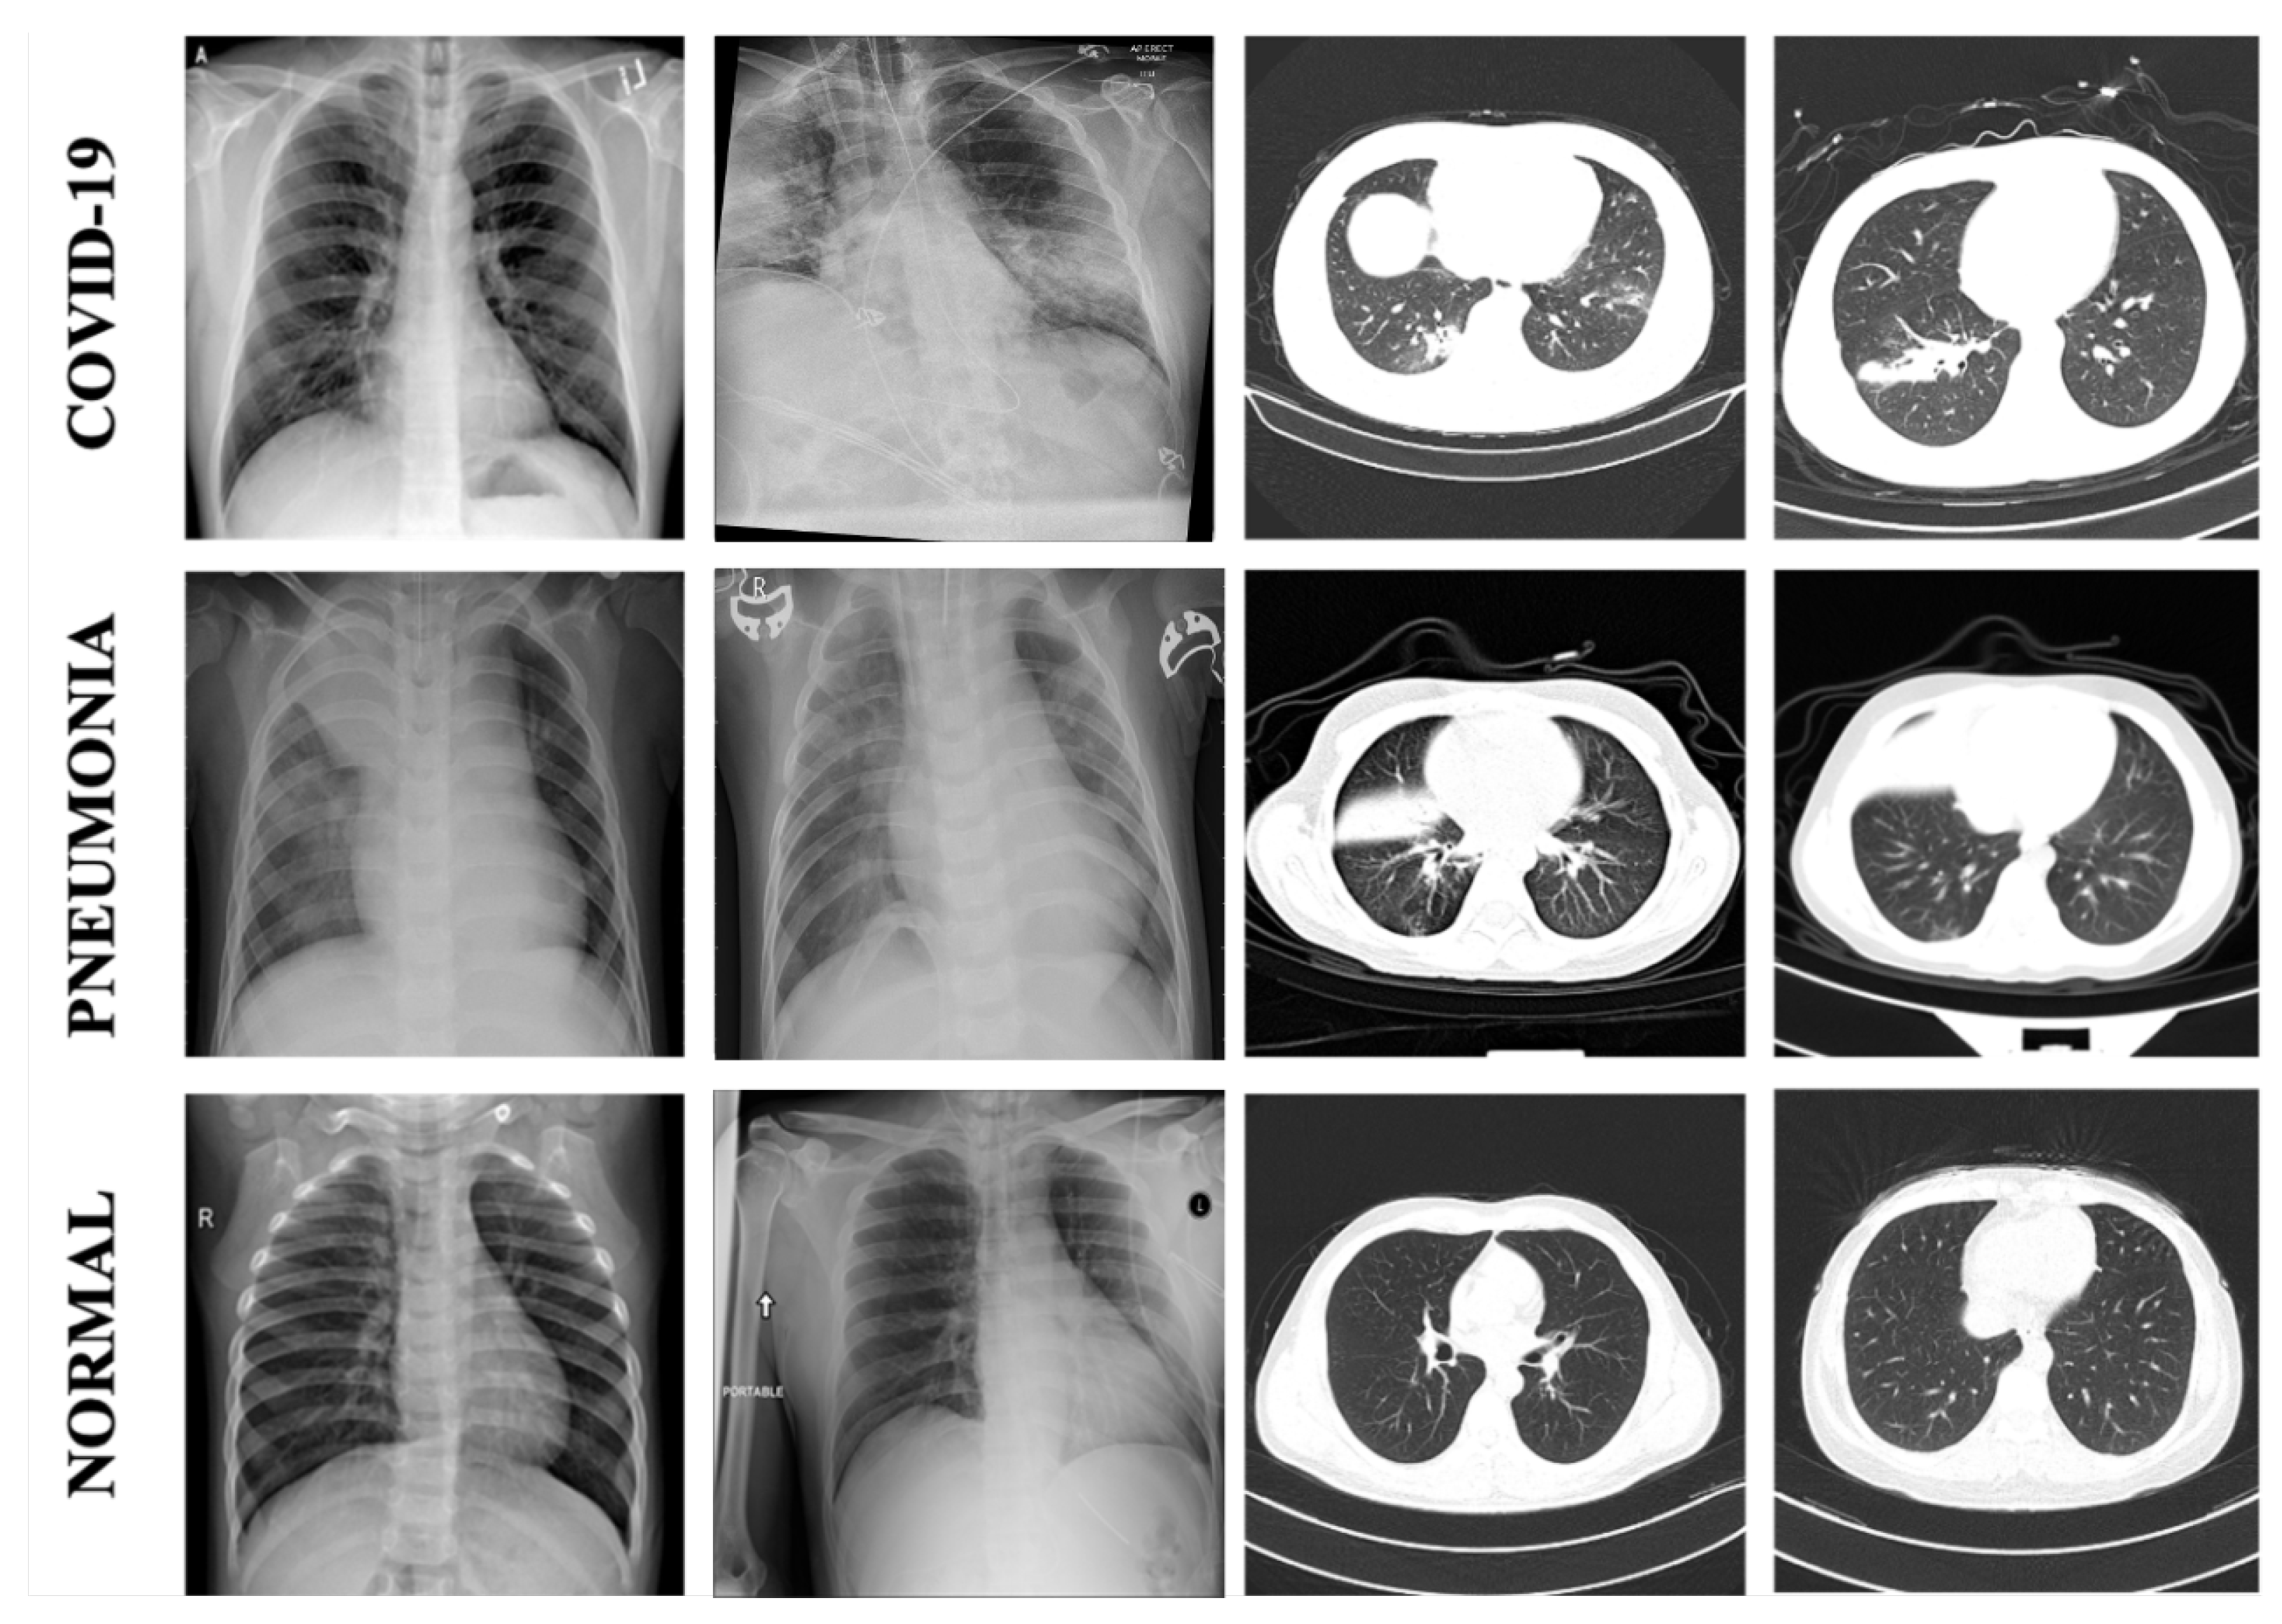
2.1. Data Sets
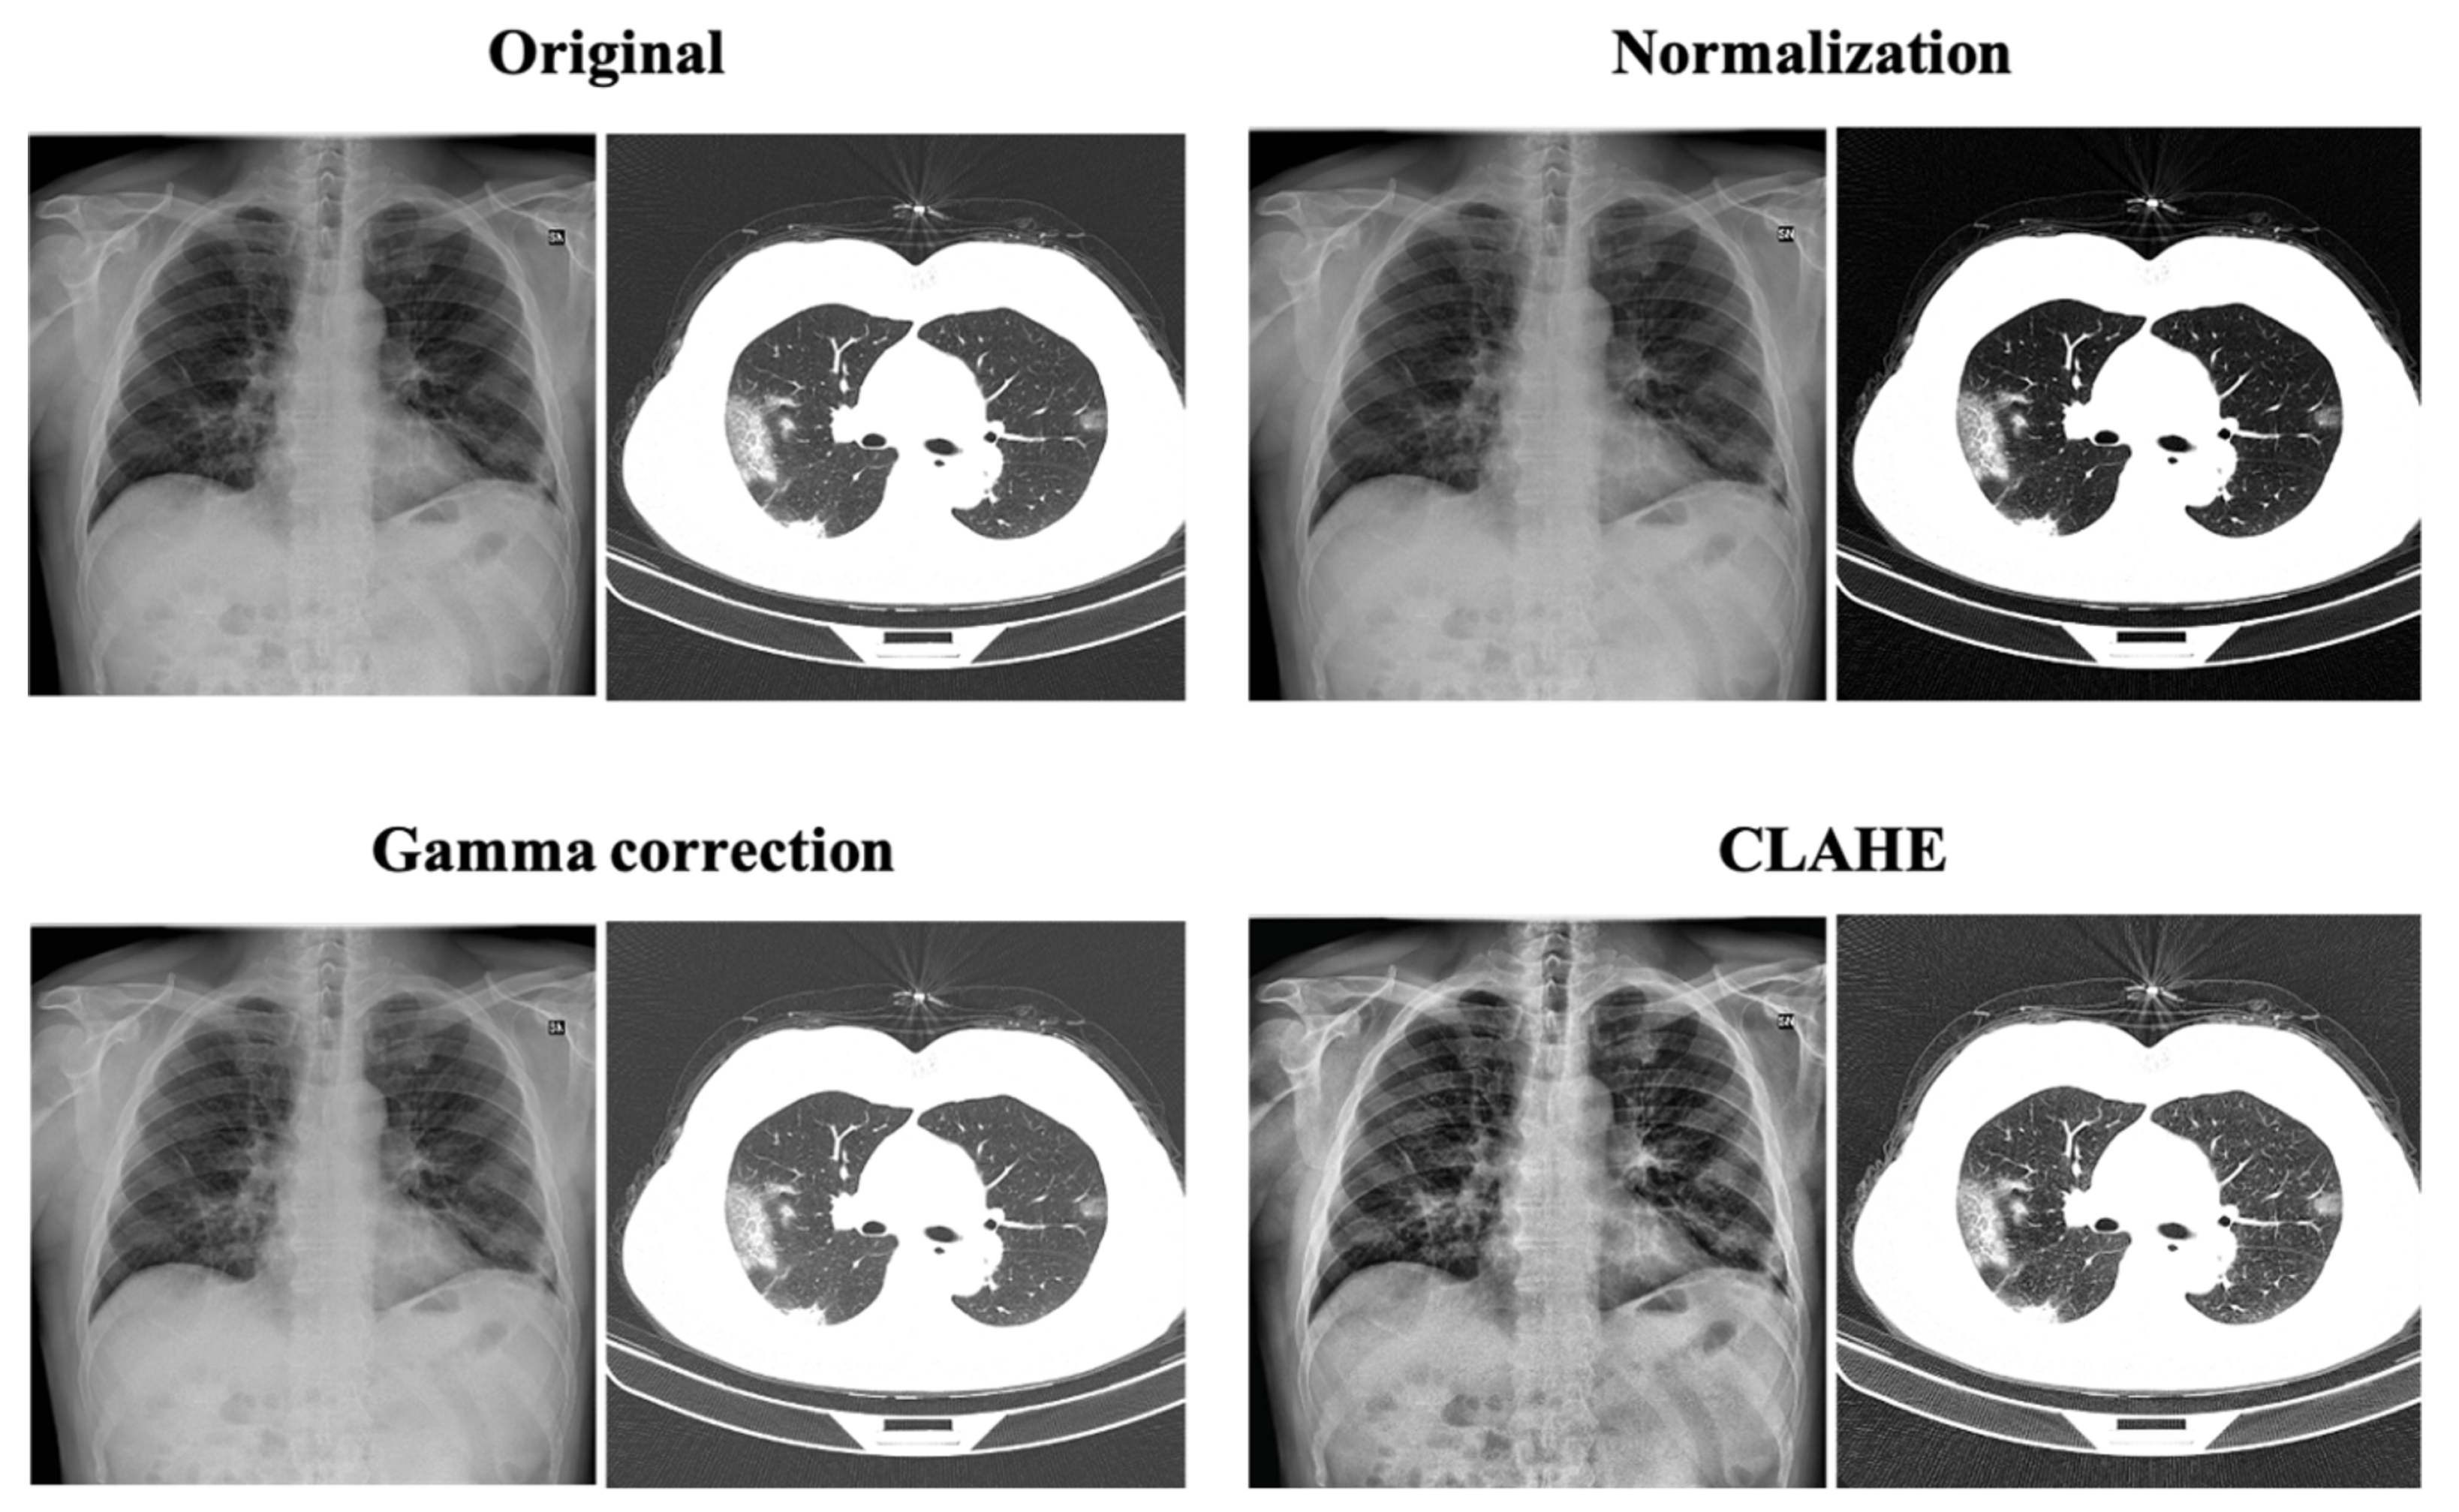
2.2. Image Enhancement Techniques
2.2.1. Normalization
2.2.2. Gamma Correction
2.2.3. Contrast-Limited Adaptive Histogram Equalization
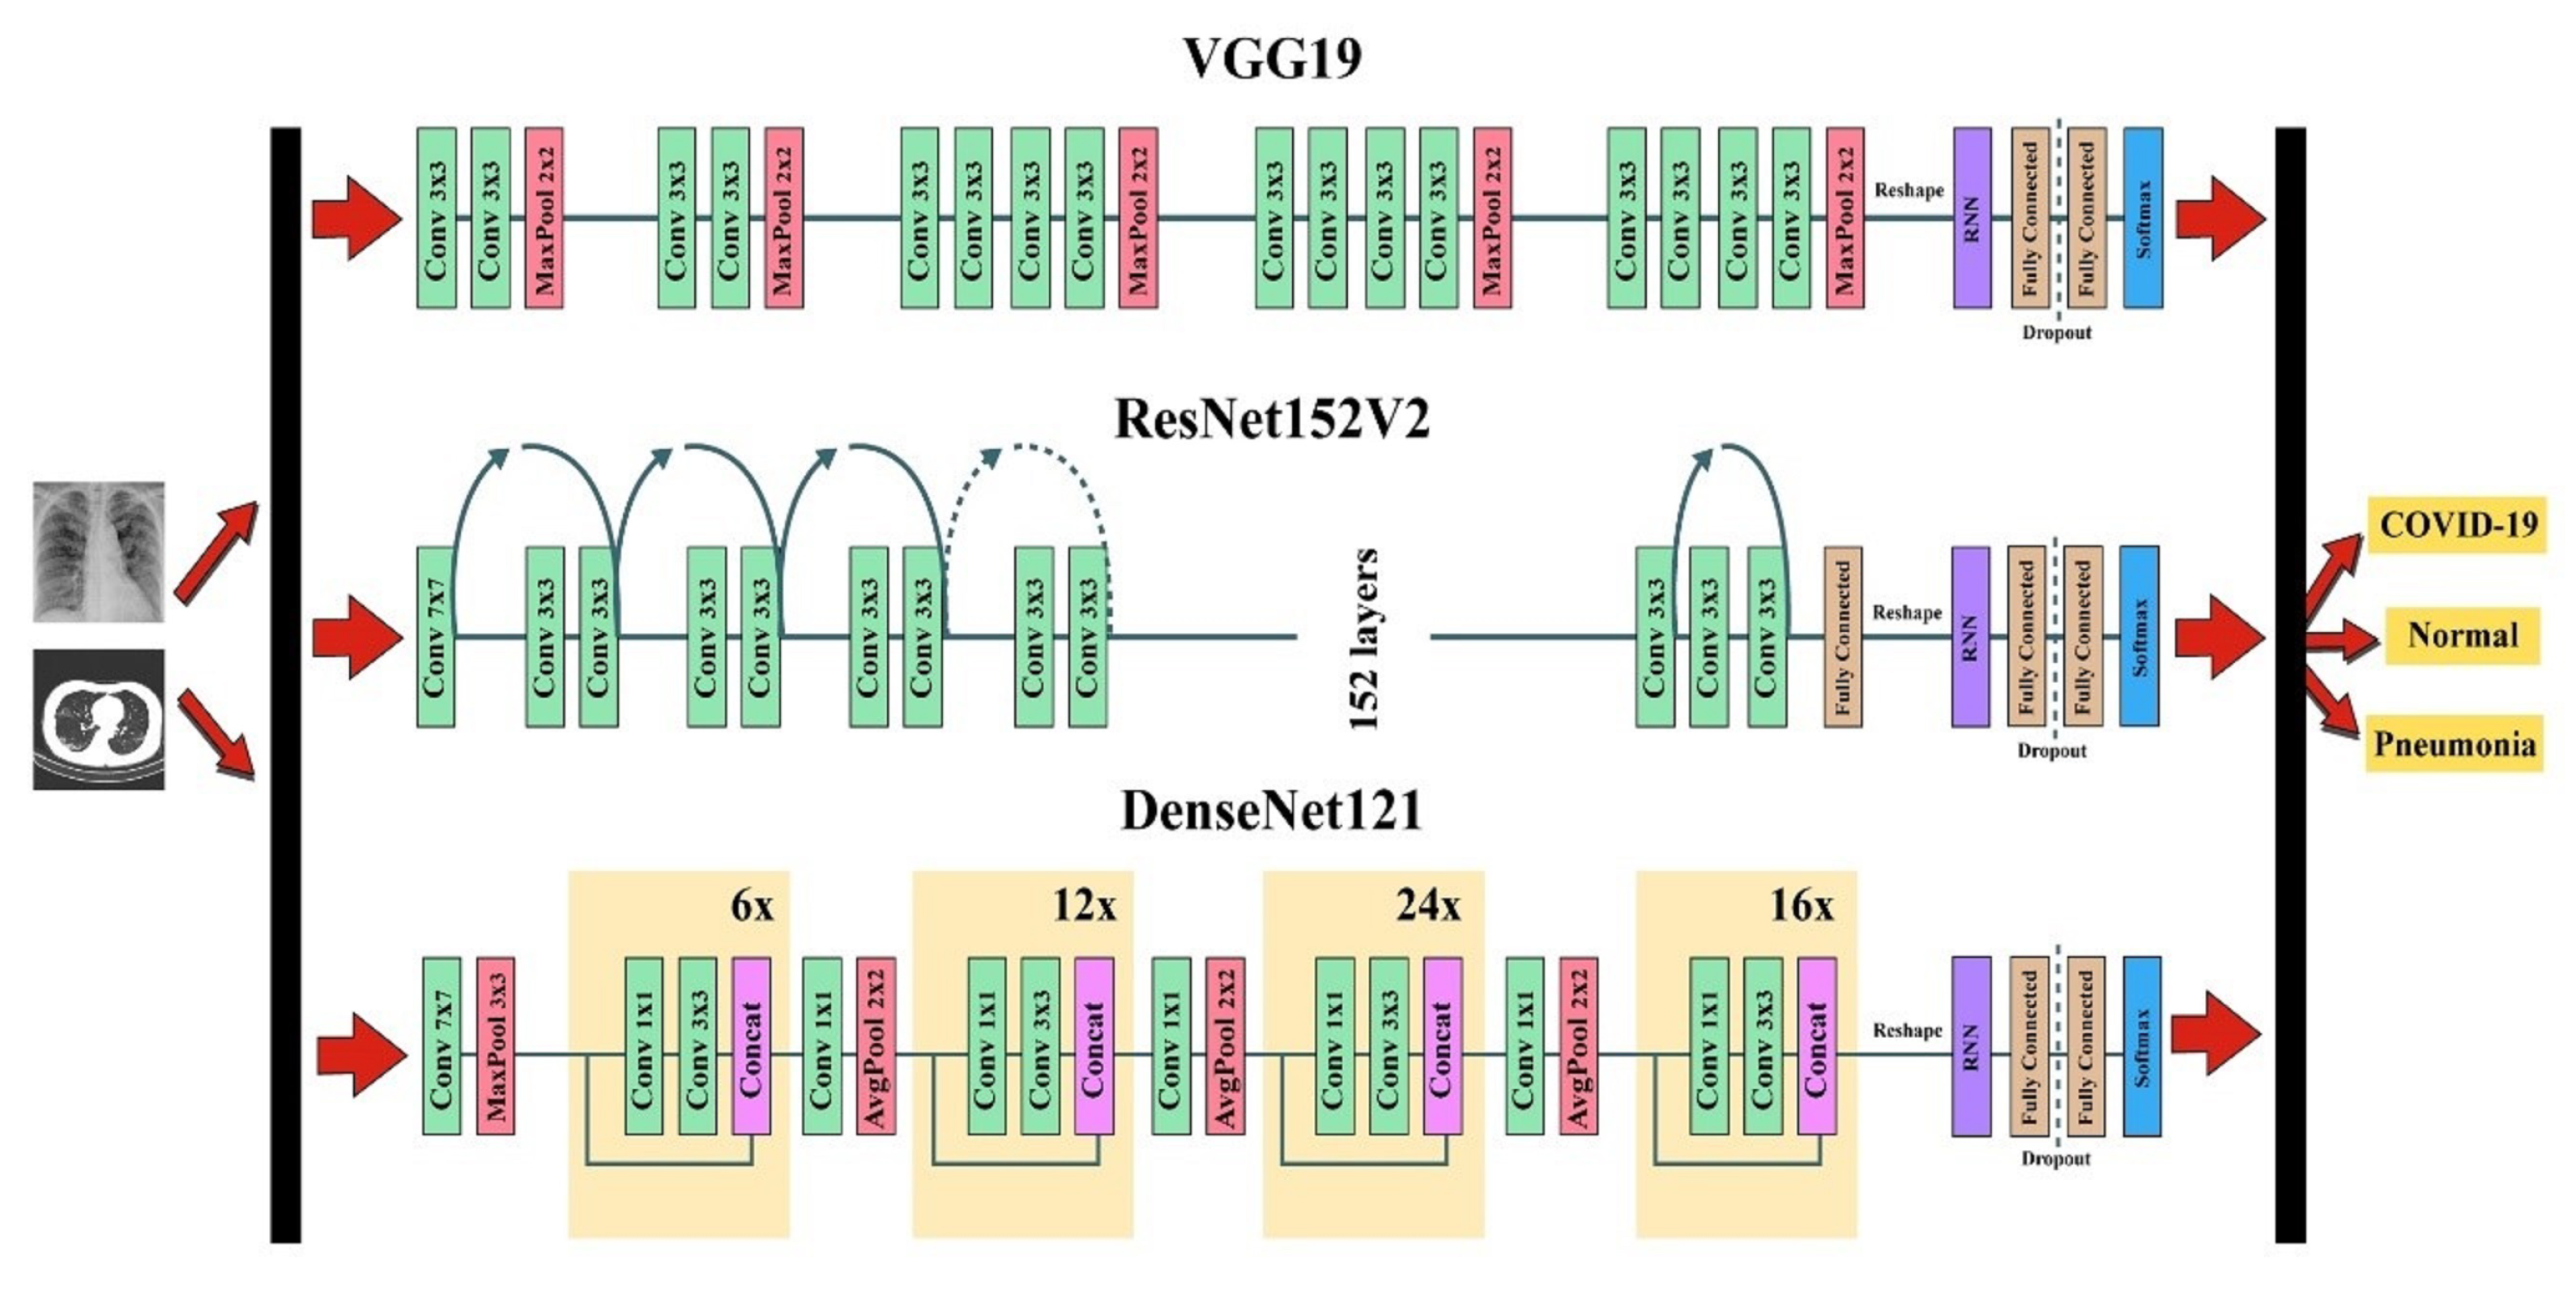
2.3. Development of Combined Network
2.3.1. Convolution Neural Network
2.3.2. Recurrent Neural Network
2.3.3. Combined CNN-RNN Framework
3. Experiments and Results
3.1. Data Pre-Processing
3.2. Experimental Setup
3.3. Evaluation
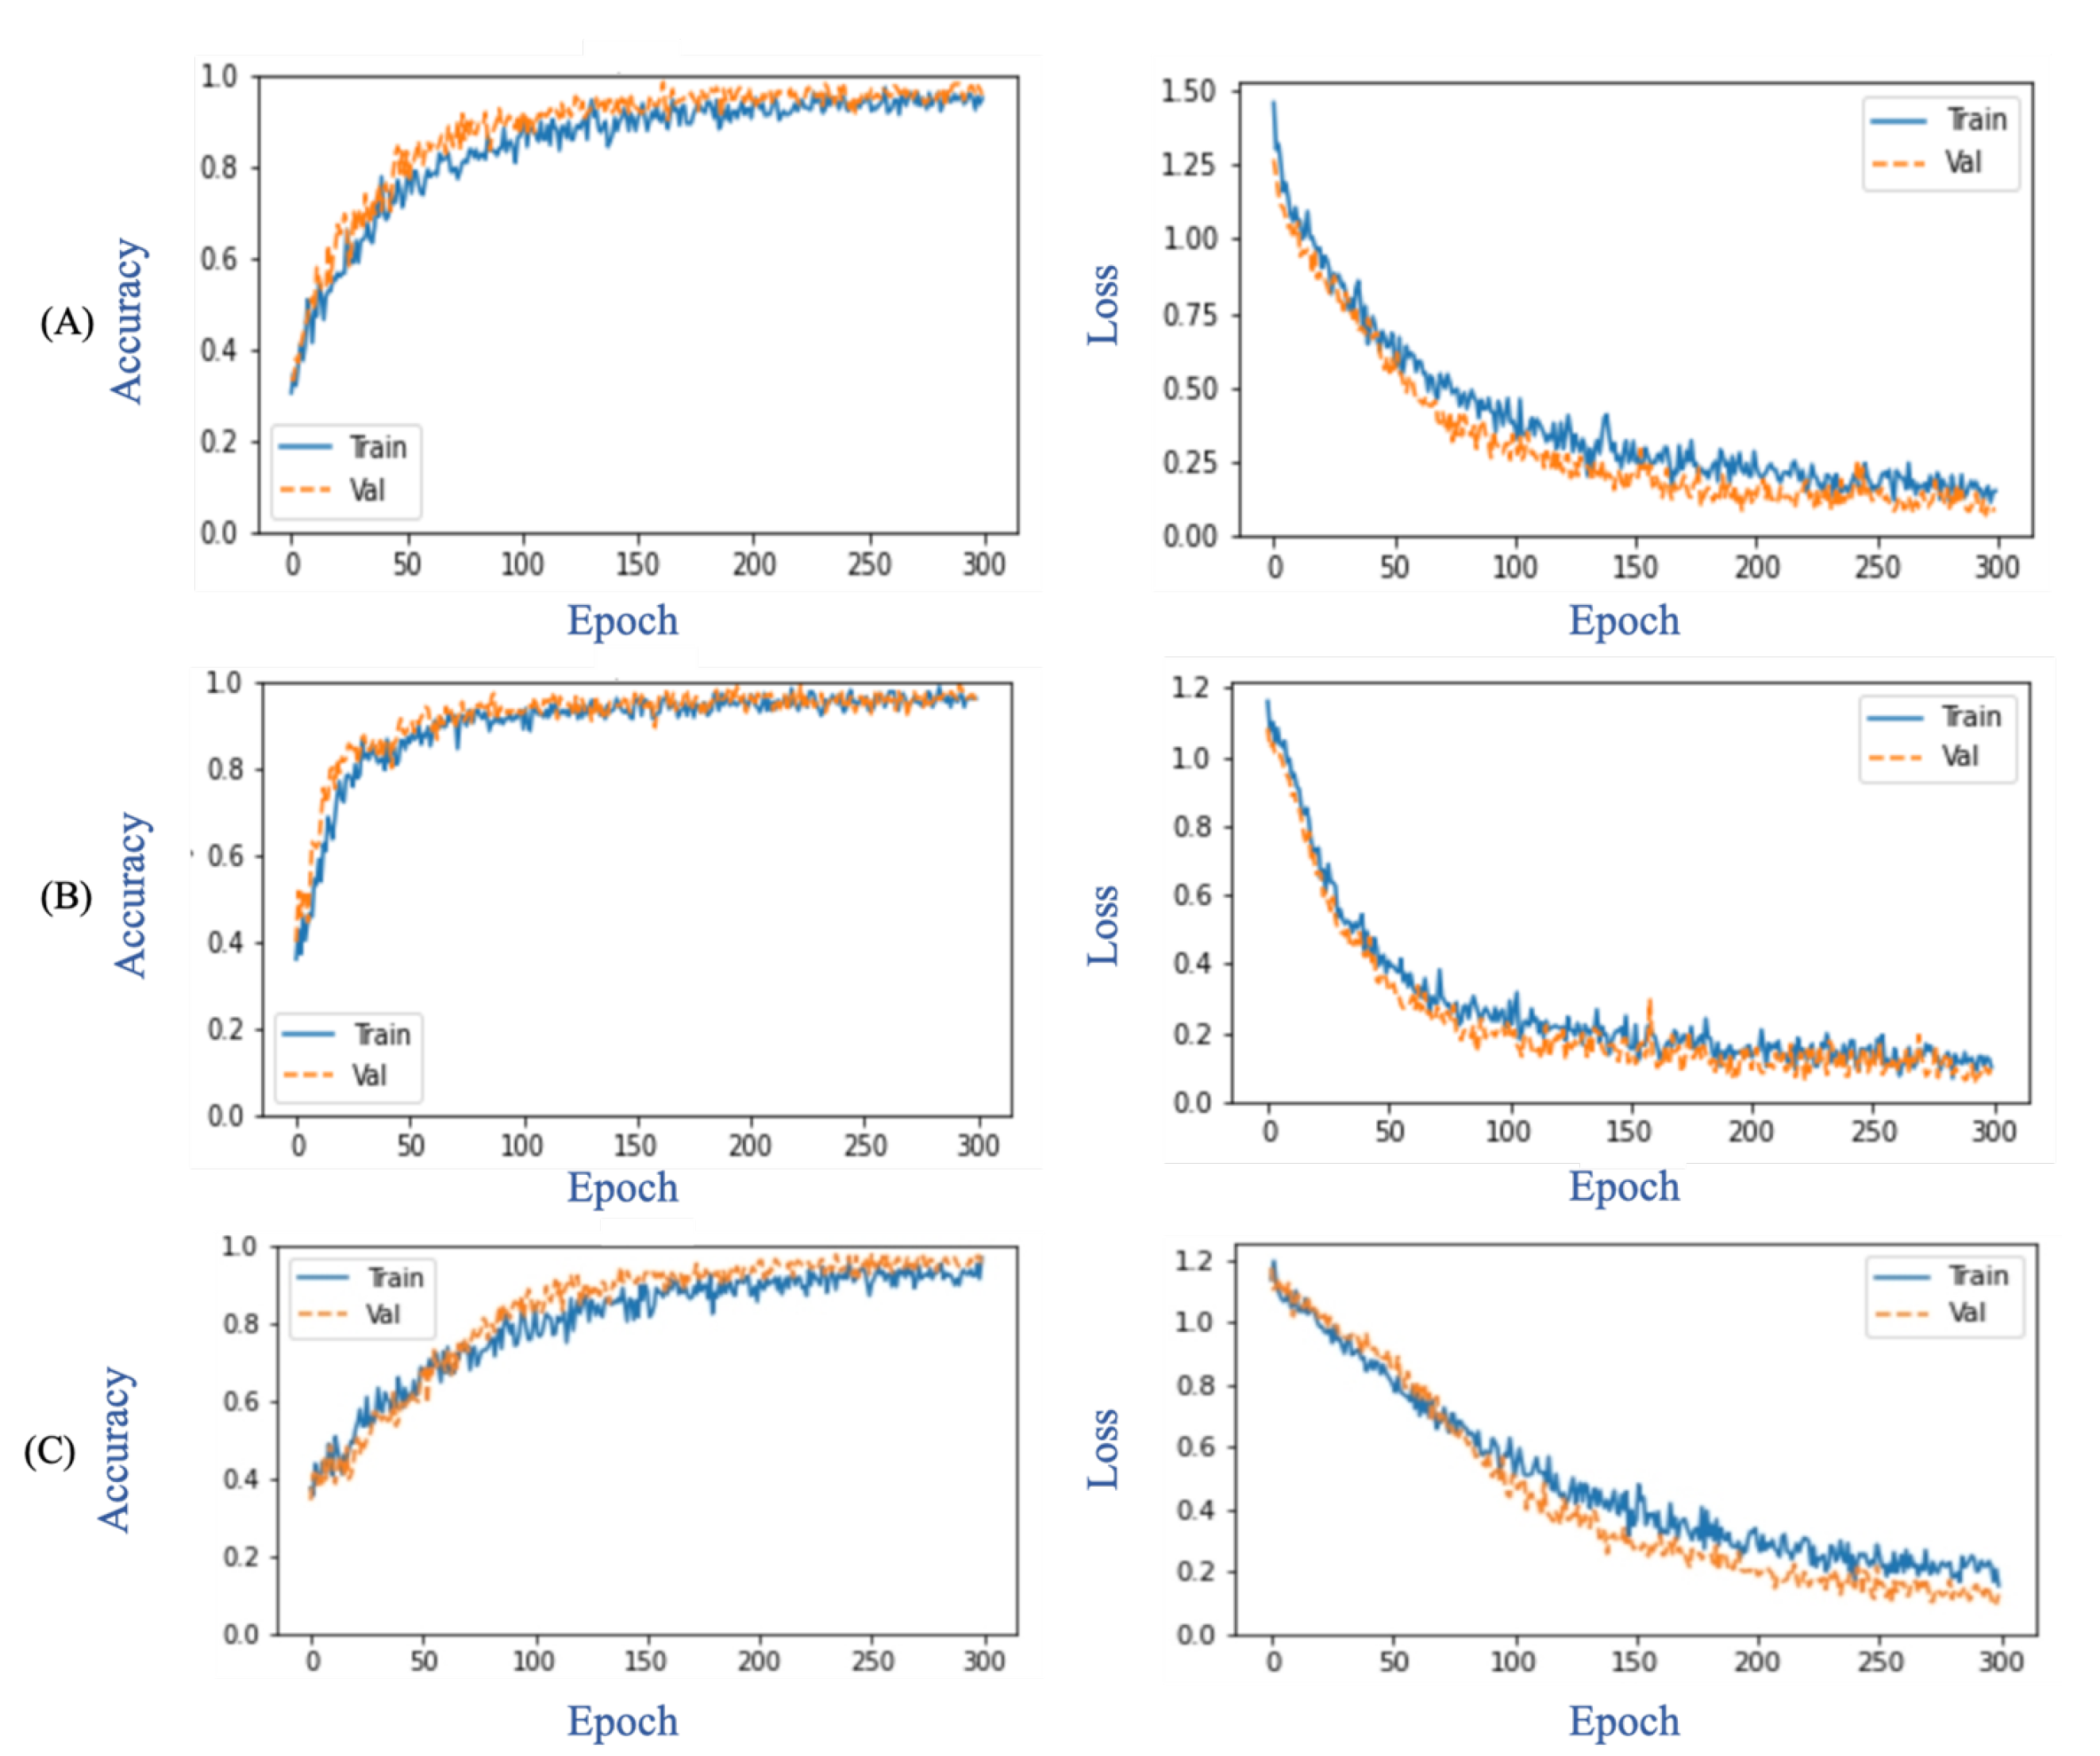
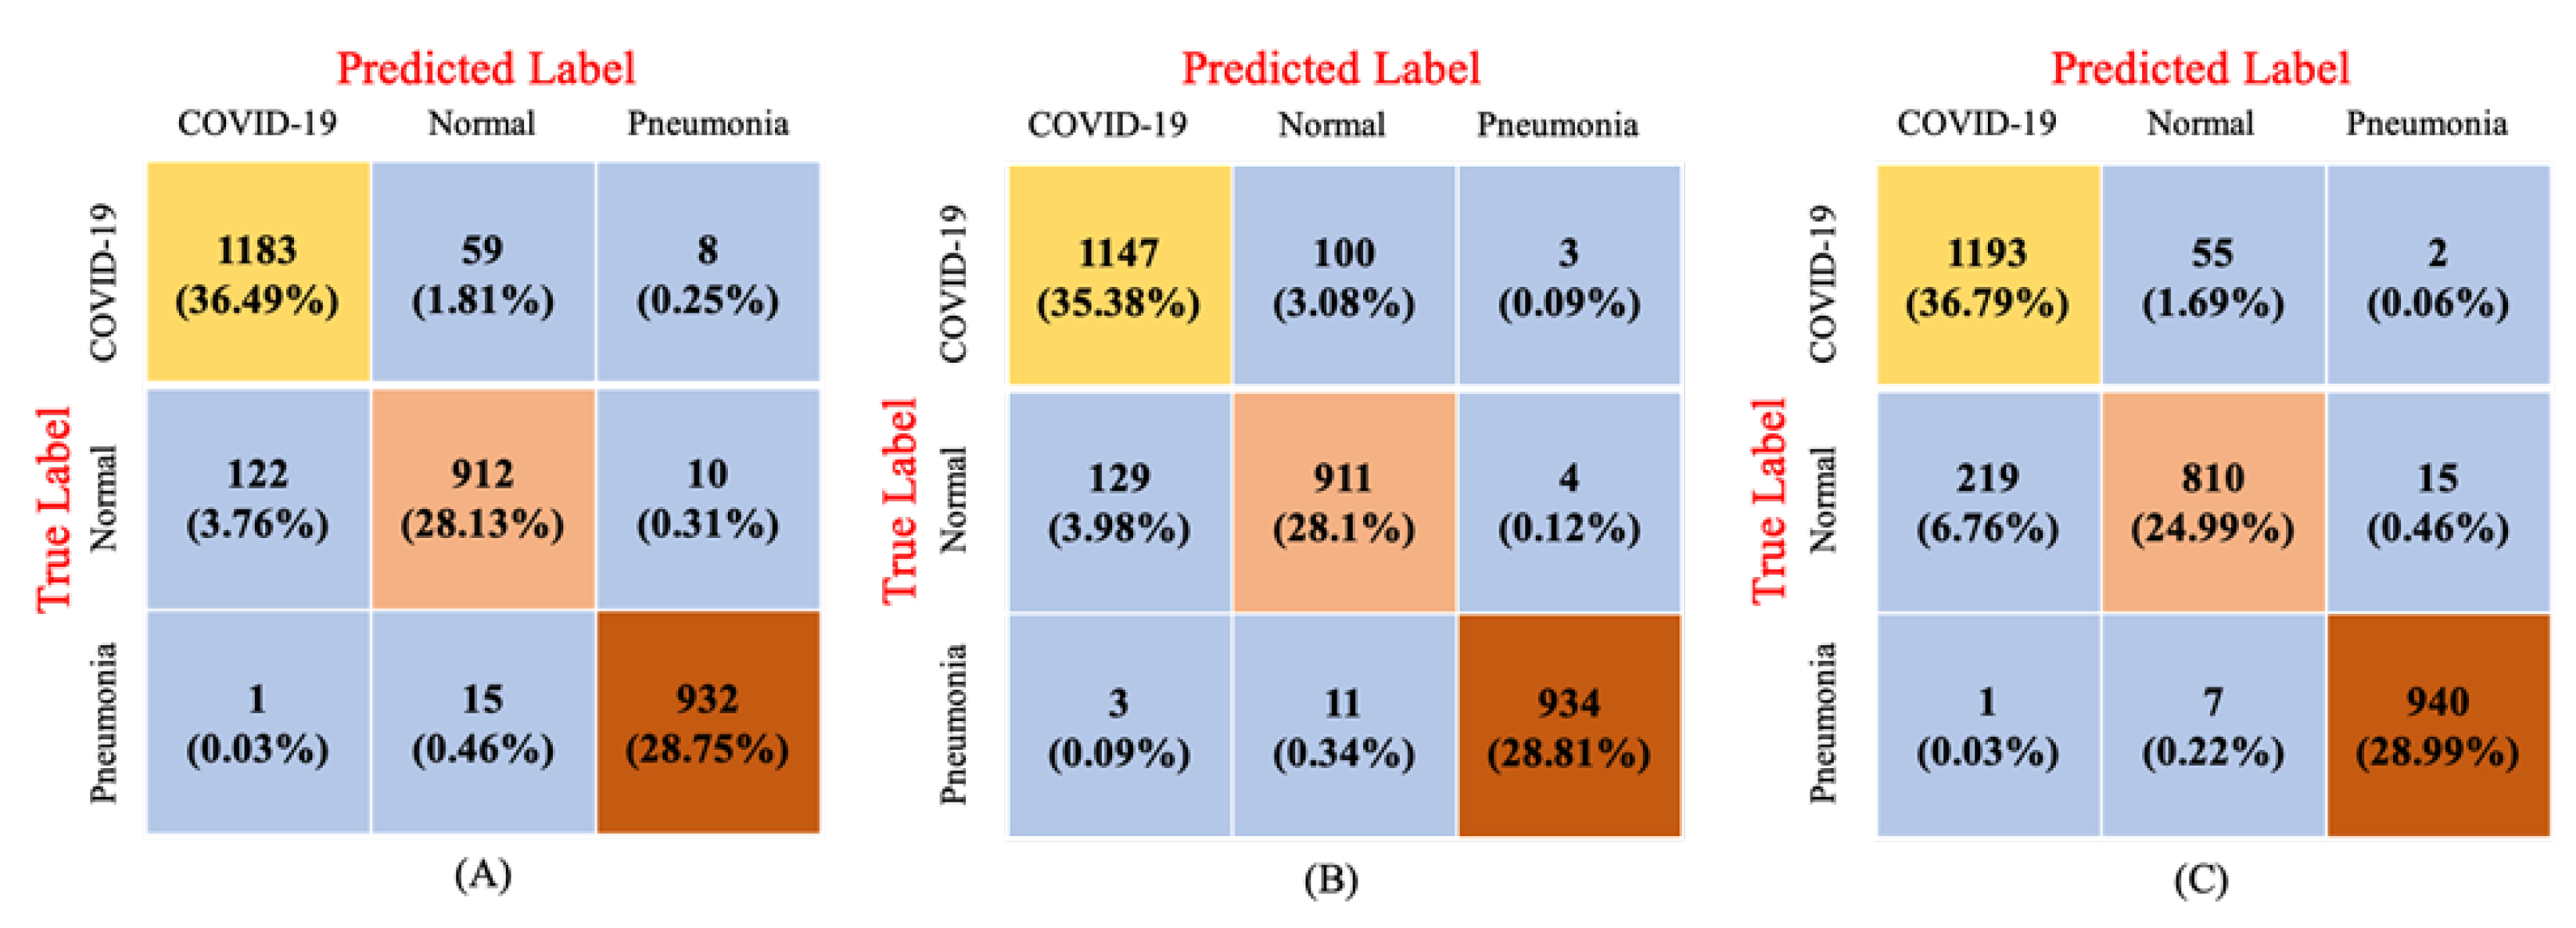
3.4. Results
4. Discussion
5. Conclusions
Author Contributions
Funding
Institutional Review Board Statement
Informed Consent Statement
Data Availability Statement
Conflicts of Interest
References
- WHO. Director-General’s Opening Remarks at the Media Briefing on COVID-19—11 March 2020. Available online: https://www.who.int/director-general/speeches/detail/who-director-general-s-opening-remarks-at-the-media-briefing-on-covid-19—11-march-2020 (accessed on 8 September 2022).
- Sethi, S.; Chakraborty, T. Molecular (real-time reverse transcription polymerase chain reaction) diagnosis of SARS-CoV-2 infections: Complexity and challenges. J. Lab. Med. 2021, 45, 135–142. [Google Scholar] [CrossRef]
- Nastaran, T.; Fariborz, T. Diagnosis of COVID-19 for controlling the pandemic: A review of the state-of-the-art. Biosens. Bioelectron. 2021, 174, 112830. [Google Scholar] [CrossRef]
- Krit, S.; Isoon, K.; Nuttakan, W.; Mayulee, L.; Chawalit, B. Intruder Detection by Using Faster R-CNN in Power Substation. In Proceedings of the International Conference on Computing and Information Technology, Tabuk, Saudi Arabia, 9–10 September 2020; pp. 159–167. [Google Scholar]
- Selim, R.; Marta, C.F.; Machado, J.J.M.; João, M.R.S.T. A multi-head attention-based transformer model for traffic flow forecasting with a comparative analysis to recurrent neural networks. Expert Syst. Appl. 2022, 202, 117275. [Google Scholar] [CrossRef]
- Zhang, J.; Zeng, Y.; Starly, B. Recurrent neural networks with long term temporal dependencies in machine tool wear diagnosis and prognosis. SN Appl. Sci. 2021, 3, 442. [Google Scholar] [CrossRef]
- Ahmed Hamza, M.; Abdullah Mengash, H.; Alotaibi, S.S.; Hassine, S.B.H.; Yafoz, A.; Althukair, F.; Othman, M.; Marzouk, R. Optimal and Efficient Deep Learning Model for Brain Tumor Magnetic Resonance Imaging Classification and Analysis. Appl. Sci. 2022, 12, 7953. [Google Scholar] [CrossRef]
- Kanjanasurat, I.; Domepananakorn, N.; Archevapanich, T.; Purahong, B. Comparison of image enhancement techniques and CNN models for COVID-19 classification using chest x-rays images. In Proceedings of the International Conference on Engineering, Applied Sciences, and Technology (ICEAST), Chiang Mai, Thailand, 8–10 June 2022; pp. 6–9. [Google Scholar] [CrossRef]
- Zhang, J.; Xie, Y.; Pang, G.; Liao, Z.; Verjans, J.; Li, W.; Sun, Z.; He, J.; Li, Y.; Shen, C.; et al. Viral Pneumonia Screening on Chest X-Rays Using Confidence-Aware Anomaly Detection. IEEE Trans. Med. Imaging 2021, 40, 879–890. [Google Scholar] [CrossRef]
- Hemdan, E.E.; Shouman, M.A.; Karar, M.E. Covidx-net: A framework of deep learning classifiers to diagnose COVID-19 in X-ray images. arXiv 2020, arXiv:2003.11055. [Google Scholar]
- Islam, Z.; Islam, M.; Asraf, A. A combined deep CNN-LSTM network for the detection of novel coronavirus (COVID-19) using X-ray images. Inform. Med. Unlocked 2020, 20, 100412. [Google Scholar] [CrossRef]
- Tawsifur, R.; Amith, K.; Yazan, Q.; Anas, T.; Serkan, K.; Saad, B.A.K.; Mohammad, T.I.; Somaya, A.M.; Susu, M.Z.; Muhammad, S.K.; et al. Exploring the effect of image enhancement techniques on COVID-19 detection using chest X-ray images. Comput. Biol. Med. 2021, 132, 104319. [Google Scholar] [CrossRef]
- Aslan, M.F. A robust semantic lung segmentation study for CNN-based COVID-19 diagnosis. Chemom. Intell. Lab. Syst. 2022, 231, 104695. [Google Scholar] [CrossRef]
- Xiangjun, W.; Hui, H.; Meng, N.; Liang, L.; Li, W.; Bingxi, H.; Xin, Y.; Li, L.; Hongjun, L.; Jie, T.; et al. Deep learning-based multi-view fusion model for screening 2019 novel coronavirus pneumonia: A multicentre study. Eur. J. Radiol. 2020, 128, 109041. [Google Scholar] [CrossRef]
- Xiaowei, X.; Xiangao, J.; Chunlian, M.; Peng, D.; Xukun, L.; Shuangzhi, L.; Liang, Y.; Qin, N.; Yanfei, C.; Junwei, S.; et al. A Deep Learning System to Screen Novel Coronavirus Disease 2019 Pneumonia. Engineering 2020, 6, 1122–1129. [Google Scholar] [CrossRef]
- Perumal, V.; Narayanan, V.; Rajasekar, S.J.S. Detection of COVID-19 using CXR and CT images using Transfer Learning and Haralick features. Appl. Intell. 2021, 51, 341–358. [Google Scholar] [CrossRef]
- Naeem, H.; Bin-Salem, A.A. A CNN-LSTM network with multi-level feature extraction-based approach for automated detection of coronavirus from CT scan and X-ray images. Appl. Soft Comput. 2021, 113, 07918. [Google Scholar] [CrossRef]
- Cohen, J.P.; Morrison, P.; Dao, L.; Roth, K.; Duong, T.Q.; Ghassemi, M. Covid-19 image data collection: Prospective predictions are the future. arXiv 2020, arXiv:2006.11988. [Google Scholar] [CrossRef]
- Chowdhury, M.E.; Rahman, T.; Khandakar, A.; Mazhar, R.; Kadir, M.A.; Mahbub, Z.B.; Islam, K.R.; Khan, M.S.; Iqbal, A.; Al-Emadi, N.A.; et al. Can AI Help in Screening Viral and COVID-19 Pneumonia? IEEE Access 2020, 8, 132665–132676. [Google Scholar] [CrossRef]
- Zhang, J.; Xie, Y.; Pang, G.; Liao, Z.; Verjans, J.; Li, W.; Sun, Z.; He, J.; Li, Y.; Shen, C.; et al. Clinically Applicable AI System for Accurate Diagnosis, Quantitative Measurements, and Prognosis of COVID-19 Pneumonia Using Computed Tomography. Cell 2020, 181, 1423–1433.e11. [Google Scholar] [CrossRef]
- Kermany, D.S.; Goldbaum, M.; Cai, W.; Valentim, C.; Liang, H.; Baxter, S.L.; McKeown, A.; Yang, G.; Wu, X.; Yan, F.; et al. Identifying Medical Diagnoses and Treatable Diseases by Image-Based Deep Learning. Cell 2018, 172, 1122–1131.e9. [Google Scholar] [CrossRef]
- Yadav, G.; Maheshwari, S.; Agarwal, A. Contrast limited adaptive histogram equalization based enhancement for real time video system. In Proceedings of the International Conference on Advances in Computing, Communications and Informatics (ICACCI), Delhi, India, 24–27 September 2014; pp. 2392–2397. [Google Scholar] [CrossRef]
- Pisano, E.D.; Zong, S.; Hemminger, B.M.; DeLuca, M.; Johnston, R.E.; Muller, K.; Braeuning, M.P.; Pizer, S.M. Contrast limited adaptive histogram equalization image processing to improve the detection of simulated spiculations in dense mammograms. J. Digit. Imaging 1998, 11, 193–200. [Google Scholar] [CrossRef]
- Simonyan, K.; Zisserman, A. Very Deep Convolutional Networks for Large-Scale Image Recognition. arXiv 2015, arXiv:1409.1556. [Google Scholar] [CrossRef]
- Alex, K.; Ilya, S.; Geoffrey, E.H. ImageNet classification with deep convolutional neural networks. Commun. ACM 2017, 60, 84–90. [Google Scholar] [CrossRef] [Green Version]
- He, K.; Zhang, X.; Ren, S.; Sun, J. Identity Mappings in Deep Residual Networks. Computer Vision; Springer: Cham, Switzerland, 2016. [Google Scholar] [CrossRef] [Green Version]
- Huang, G.; Liu, Z.; Maaten, L.V.D.; Weinberger, K.Q. Densely Connected Convolutional Networks. In Proceedings of the IEEE Conference on Computer Vision and Pattern Recognition (CVPR), Honolulu, HI, USA, 21–26 July 2017; pp. 2261–2269. [Google Scholar] [CrossRef] [Green Version]
- Hochreiter, S.; Schmidhuber, J. Long Short-Term Memory. Neural Comput. 1997, 9, 1735–1780. [Google Scholar] [CrossRef] [PubMed]
- Cho, K.; Merrienboer, B.V.; Gülçehre, Ç.; Bahdanau, D.; Bougares, F.; Schwenk, H.; Bengio, Y. Learning Phrase Representations using RNN Encoder–Decoder for Statistical Machine Translation. arXiv 2014, arXiv:1406.1078. [Google Scholar] [CrossRef]
- Hinton, G.E.; Srivastava, N.; Krizhevsky, A.; Sutskever, I.; Salakhutdinov, R.R. Improving neural networks by preventing co-adaptation of feature detectors. arXiv 2012, arXiv:1207.0580. [Google Scholar] [CrossRef]
- Hawkins, D.M. The problem of overfitting. J. Chem. Inf. Comput. Sci. 2004, 44, 1–12. [Google Scholar] [CrossRef]
- Appasami, G.; Nickolas, S. A deep learning-based COVID-19 classification from chest X-ray image: Case study. Eur. Phys. J. 2022, 231, 3767–3777. [Google Scholar] [CrossRef]
- Tulin, O.; Muhammed, T.; Eylul, A.Y.; Ulas, B.B.; Ozal, Y.U.; Rajendra, A. Automated detection of COVID-19 cases using deep neural networks with X-ray images. Comput. Biol. Med. 2020, 121, 103792. [Google Scholar] [CrossRef]
- El Asnaoui, K.; Chawki, Y. Using X-ray images and deep learning for automated detection of coronavirus disease. J. Biomol. Struct. Dyn. 2021, 39, 3615–3626. [Google Scholar] [CrossRef]
- Rahimzadeh, M.; Attar, A. A modified deep convolutional neural network for detecting COVID-19 and pneumonia from chest X-ray images based on the concatenation of Xception and ResNet50V2. Inform. Med. 2020, 19, 100360. [Google Scholar] [CrossRef]
- Saxena, A.; Singh, S.P. A Deep Learning Approach for the Detection of COVID-19 from Chest X-Ray Images using Convolutional Neural Networks. arXiv 2022, arXiv:2201.09952. [Google Scholar] [CrossRef]
- Alshehri, E.; Kalkatawi, M.; Abukhodair, F.; Khashoggi, K.; Alotaibi, R. COVID-19 Diagnosis from Medical Images Using Transfer Learning. Saudi J. Health Syst. Res. 2022, 2, 54–61. [Google Scholar] [CrossRef]
- Joshi, A.M.; Nayak, D.R.; Das, D.; Zhang, Y.D. LiMS-Net: A Lightweight Multi-Scale CNN for COVID-19 Detection from Chest CT Scans. ACM Trans. Manag. Inf. Syst. 2022, 14, 1–17. [Google Scholar] [CrossRef]
- Yin, Q.; Zhang, R.; Shao, X. CNN and RNN mixed model for image classification. MATEC Web Conf. 2019, 277, 02001. [Google Scholar] [CrossRef]


| Data | X-ray | CT Scan | Overall | ||||
|---|---|---|---|---|---|---|---|
| COVID-19 | Pneumonia | Normal | COVID-19 | Pneumonia | Normal | ||
| Training | 1750 | 2713 | 1556 | 1452 | 1452 | 1452 | 10,375 |
| Testing | 750 | 398 | 600 | 500 | 550 | 444 | 3242 |
| Validation | 437 | 678 | 389 | 363 | 363 | 363 | 2593 |
| Overall | 2937 | 3789 | 2545 | 2315 | 2365 | 2259 | 16,210 |
| Model (CNN + RNN + Enhancement) | Patient Status | ACC (%) | Precision (%) | Recall (%) | F1-Score (%) | Training Times | Predict Times (/Image) |
|---|---|---|---|---|---|---|---|
| ResNet152V2 + GRU + Original | COVID-19 Pneumonia Normal Overall | 94.14 98.95 93.65 93.37 | 90.58 98.11 92.49 93.73 | 94.64 98.31 87.36 93.44 | 92.57 98.21 89.85 93.54 | 99 m 57 s | 0.21 s |
| VGG19 + LSTM + Normalization | COVID-19 Pneumonia Normal Overall | 92.75 99.35 92.47 92.29 | 89.68 99.26 89.14 92.60 | 91.76 98.52 87.26 92.69 | 90.71 98.89 88.19 92.51 | 115 m 1 s | 0.16 s |
| DenseNet121 + LSTM + Normalization | COVID-19 Pneumonia Normal Overall | 91.45 99.23 90.86 90.77 | 84.43 98.22 92.89 91.85 | 95.44 99.16 77.59 90.73 | 89.60 98.69 84.55 90.95 | 103 m 55 s | 0.08 s |
| Author | Dataset Used (Class) | Method | ACC | Precision | Recall | F1-Score |
|---|---|---|---|---|---|---|
| Aslan et al. [13] | 2905 X-rays (Multi-class) | Deep learning + SVM | 99.83 | 99.83 | 99.83 | 99.83 |
| Ozturk et al. [33] | 625 X-rays (Multi-class) | DCNN | 87.02 | 89.96 | 85.35 | - |
| Asnaoui et al. [34] | 6087 X-rays (Multi-class) | Inception+ ResNetV2 | 92.18 | 92.38 | 92.11 | 92.07 |
| Rahimzadeh et al. [35] | 15805 X-rays (Multiclass) | Xception + ResNet50V2 | 91.40 | 72.83 | 87.31 | - |
| Saxena et al. [36] | 13975 X-rays (Multiclass) | Modified CNN | 92.63 | 95.76 | 91.87 | 93.78 |
| Alshehri et al. [37] | 746 CT (Binary) | Xception | 84.00 | - | 91.70 | - |
| Joshi et al. [38] | 746 CT (Binary) | LiMS-Net | 92.11 | - | 88.77 | 92.59 |
| Wu et al. [14] | 495 CT (Binary) | ResNet50 | 76 | - | 81.1 | - |
| Hamed et al. [17] | 2390 CT (Binary) | CNN-LSTM + MLFE | 98.94 | 99.0 | 99.0 | 99.0 |
| Xu et al. [15] | 618 CT (Multi-class) | ResNet+ LocationAttention | 86.7 | 81.3 | 86.7 | 83.9 |
| Perumal et al. [16] | 205 X-rays and 202 CT (Multi-class) | VGG16 | 93 | 91 | 90 | - |
| Proposed method | 9271 X-rays and 6939 CT (Multi-class) | ResNet152V2+ GRU | 93.37 | 93.72 | 93.44 | 93.54 |
Disclaimer/Publisher’s Note: The statements, opinions and data contained in all publications are solely those of the individual author(s) and contributor(s) and not of MDPI and/or the editor(s). MDPI and/or the editor(s) disclaim responsibility for any injury to people or property resulting from any ideas, methods, instructions or products referred to in the content. |
© 2023 by the authors. Licensee MDPI, Basel, Switzerland. This article is an open access article distributed under the terms and conditions of the Creative Commons Attribution (CC BY) license (https://creativecommons.org/licenses/by/4.0/).
Share and Cite
Kanjanasurat, I.; Tenghongsakul, K.; Purahong, B.; Lasakul, A. CNN–RNN Network Integration for the Diagnosis of COVID-19 Using Chest X-ray and CT Images. Sensors 2023, 23, 1356. https://doi.org/10.3390/s23031356
Kanjanasurat I, Tenghongsakul K, Purahong B, Lasakul A. CNN–RNN Network Integration for the Diagnosis of COVID-19 Using Chest X-ray and CT Images. Sensors. 2023; 23(3):1356. https://doi.org/10.3390/s23031356
Chicago/Turabian StyleKanjanasurat, Isoon, Kasi Tenghongsakul, Boonchana Purahong, and Attasit Lasakul. 2023. "CNN–RNN Network Integration for the Diagnosis of COVID-19 Using Chest X-ray and CT Images" Sensors 23, no. 3: 1356. https://doi.org/10.3390/s23031356