

An Ultracompact Angular Displacement Sensor Based on the Talbot Effect of Optical Microgratings
 ,
, 
Abstract
:1. Introduction
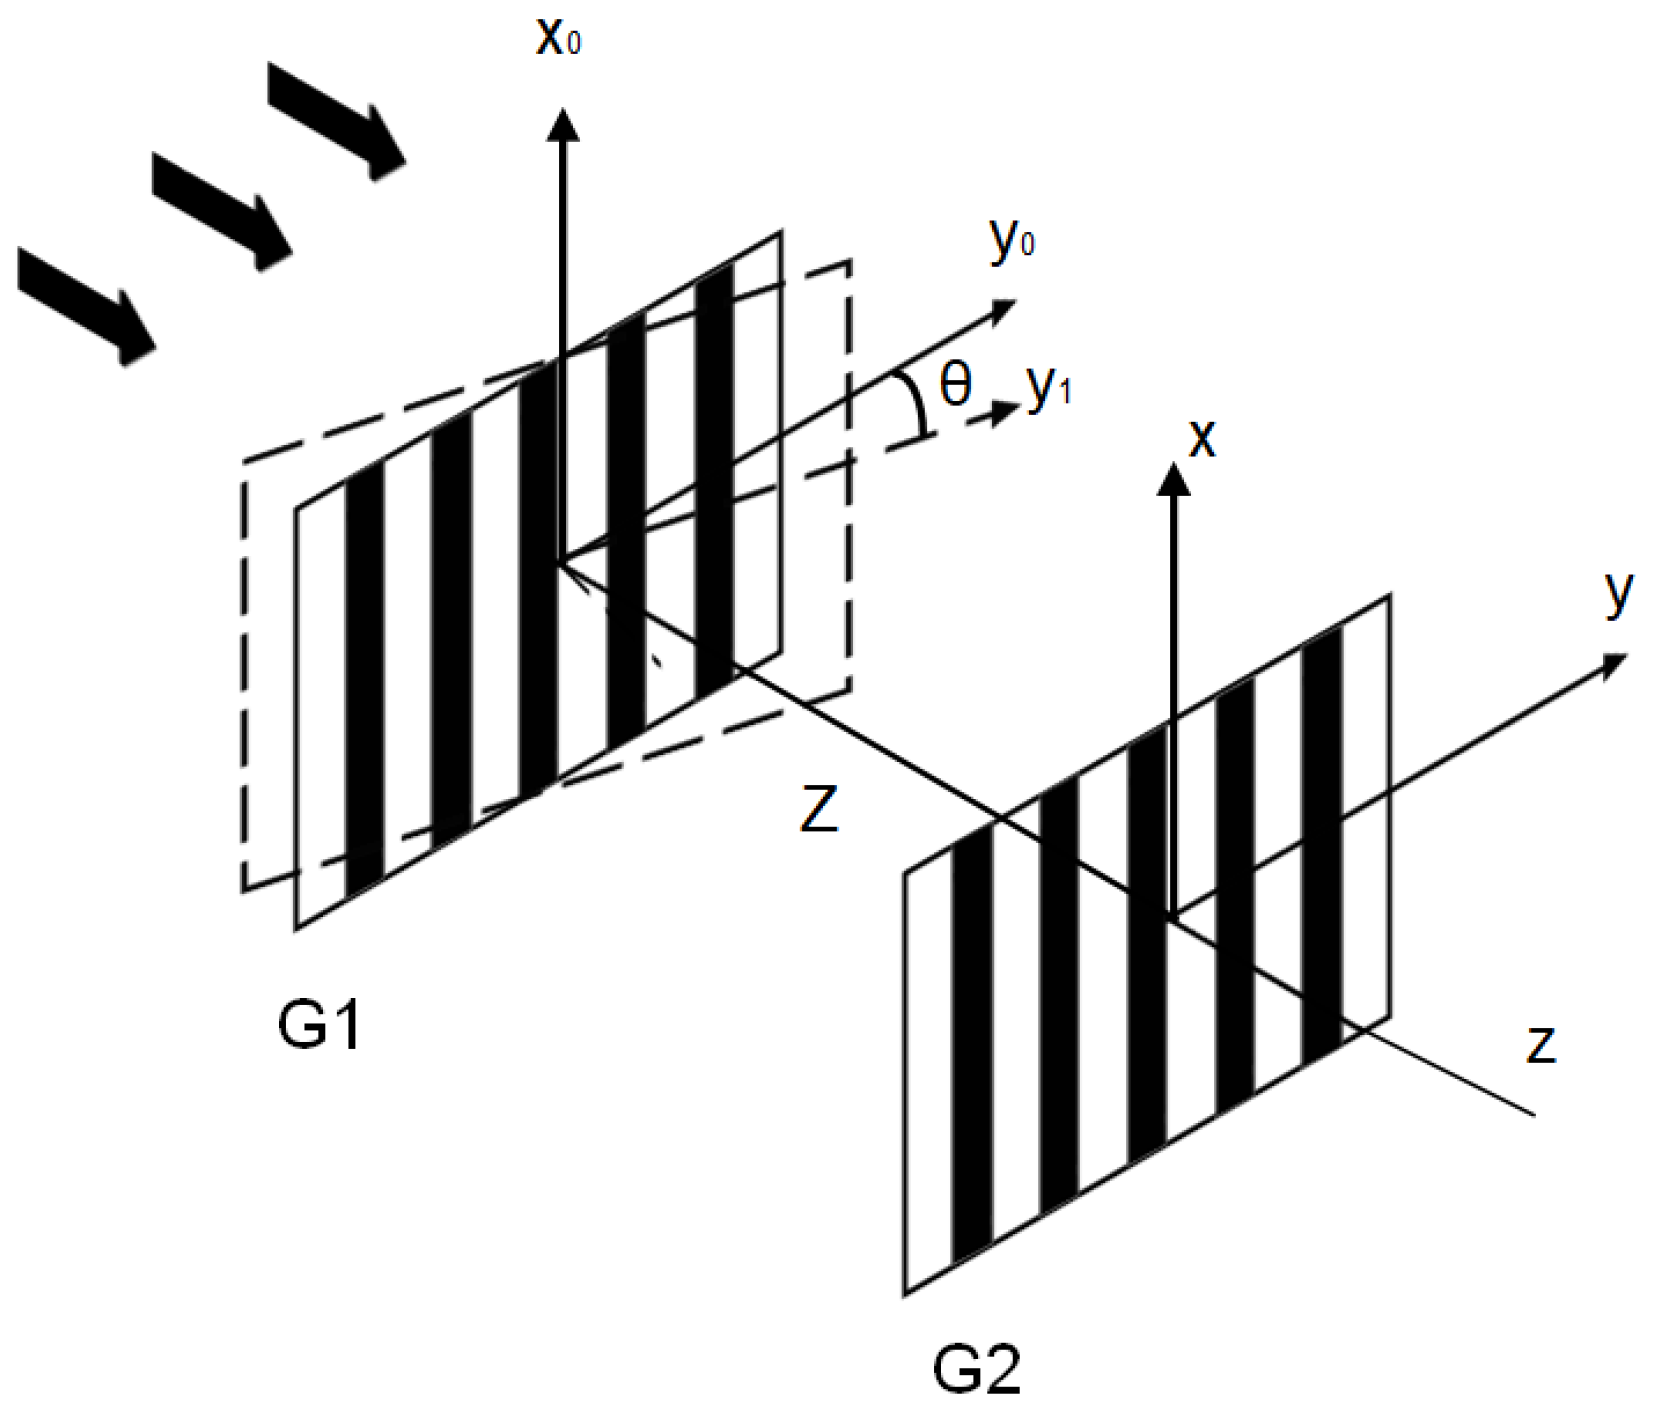
2. Principle
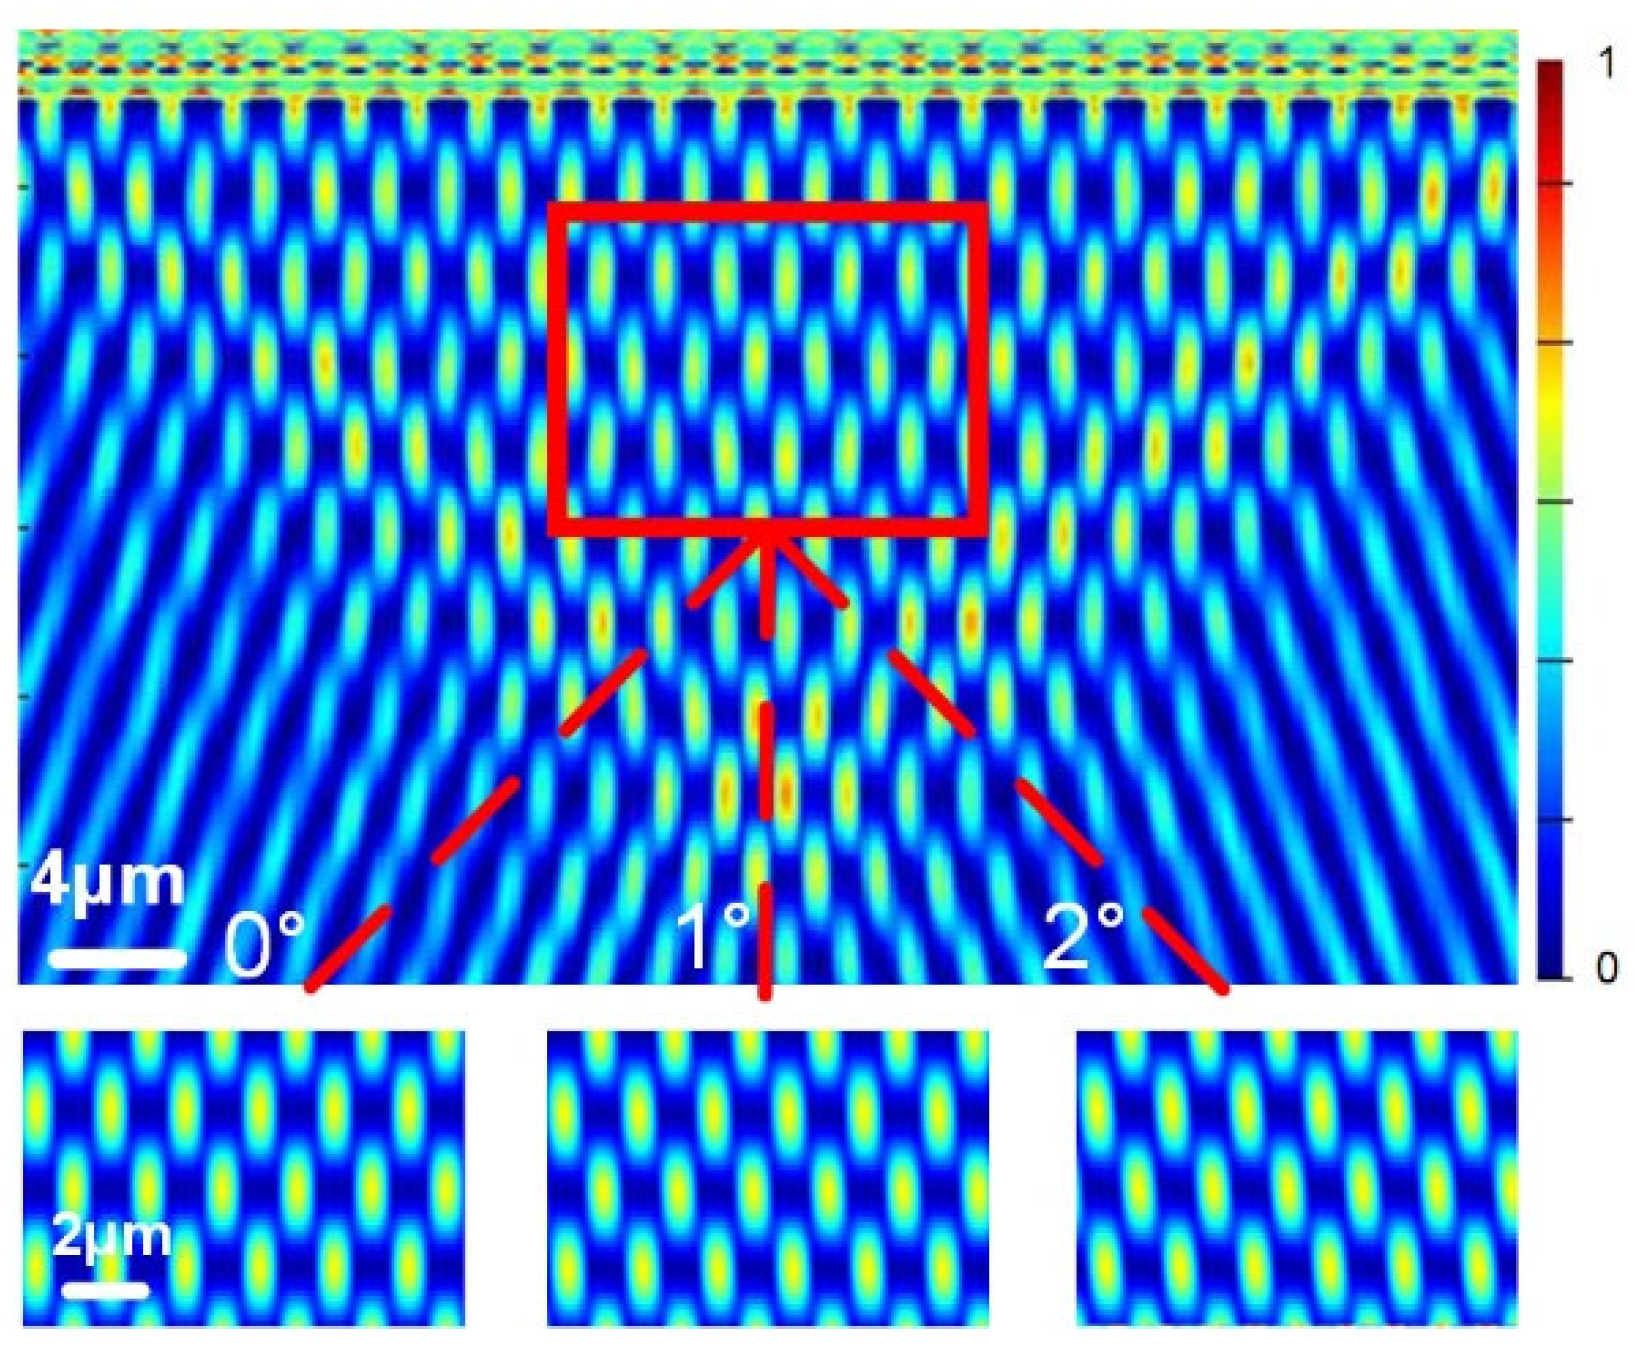
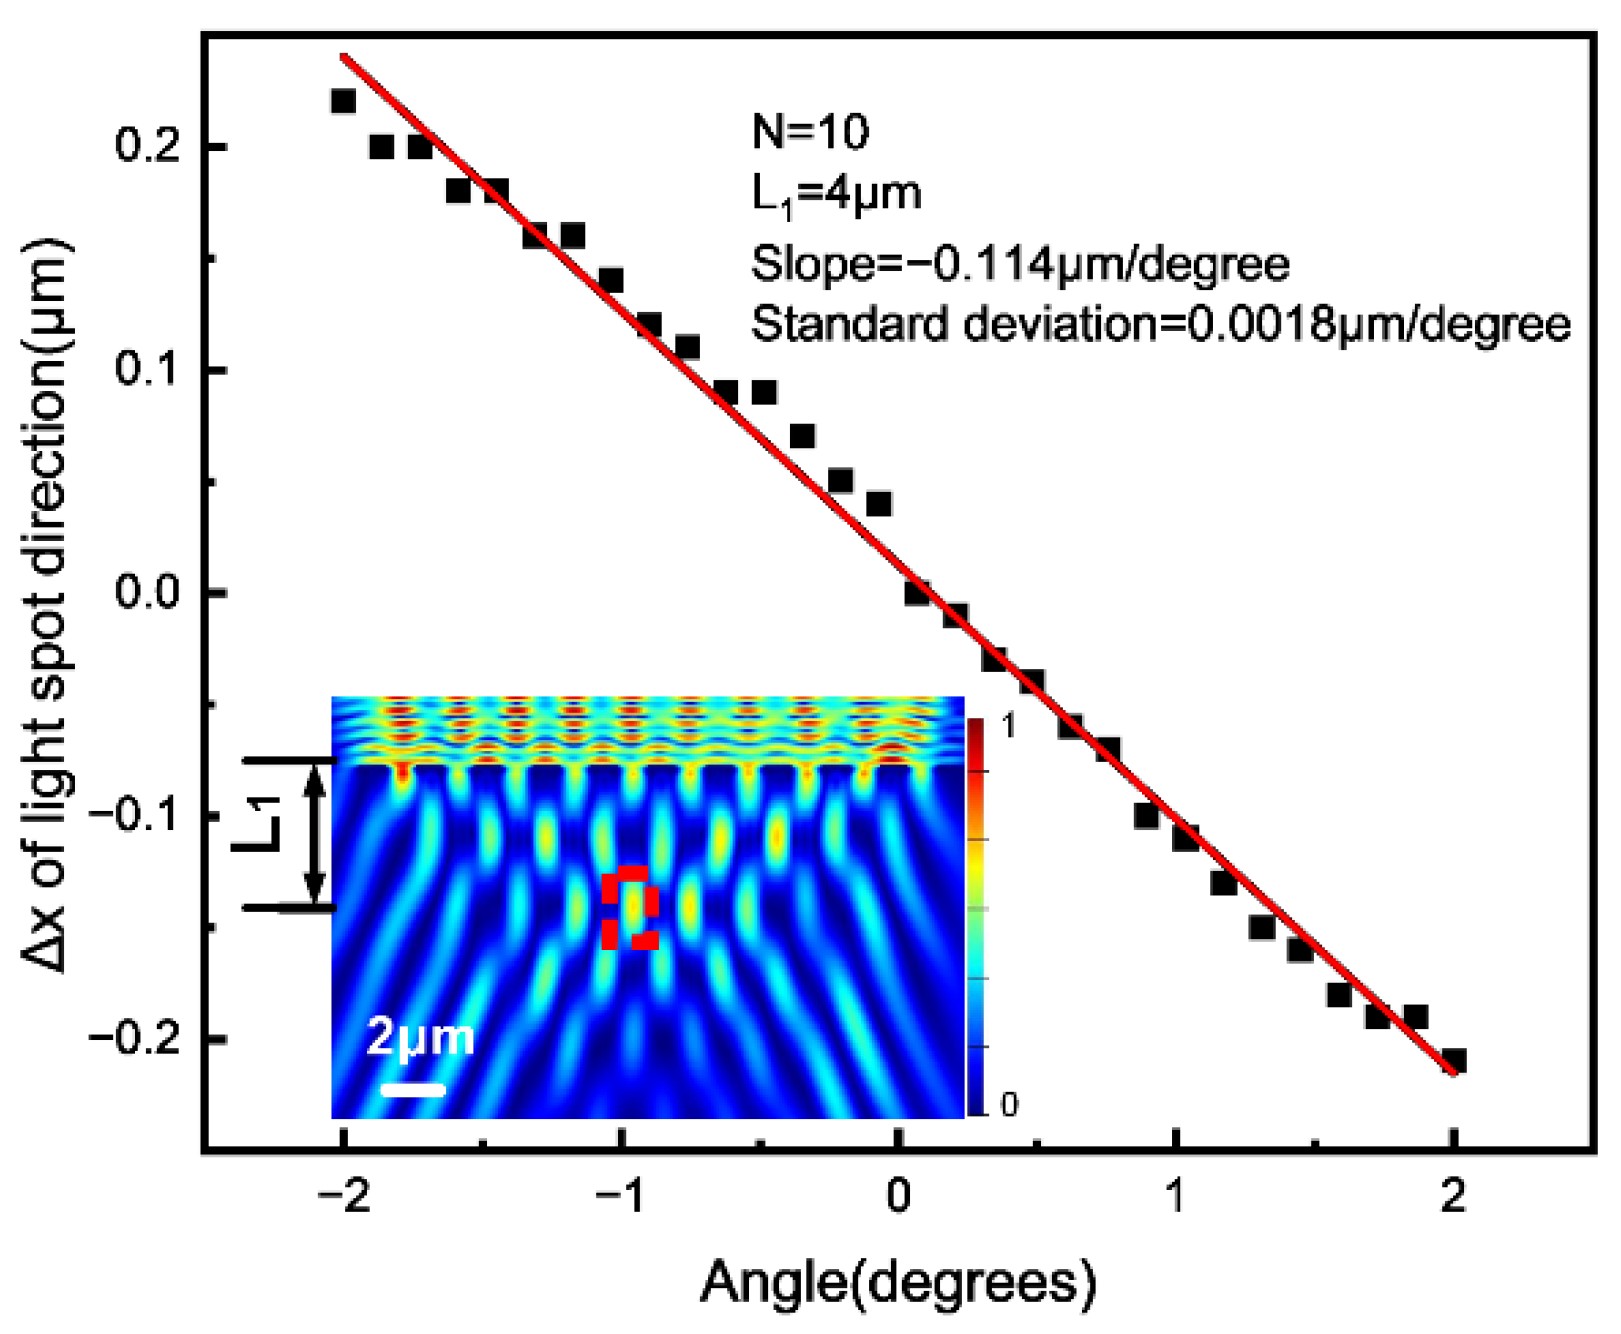
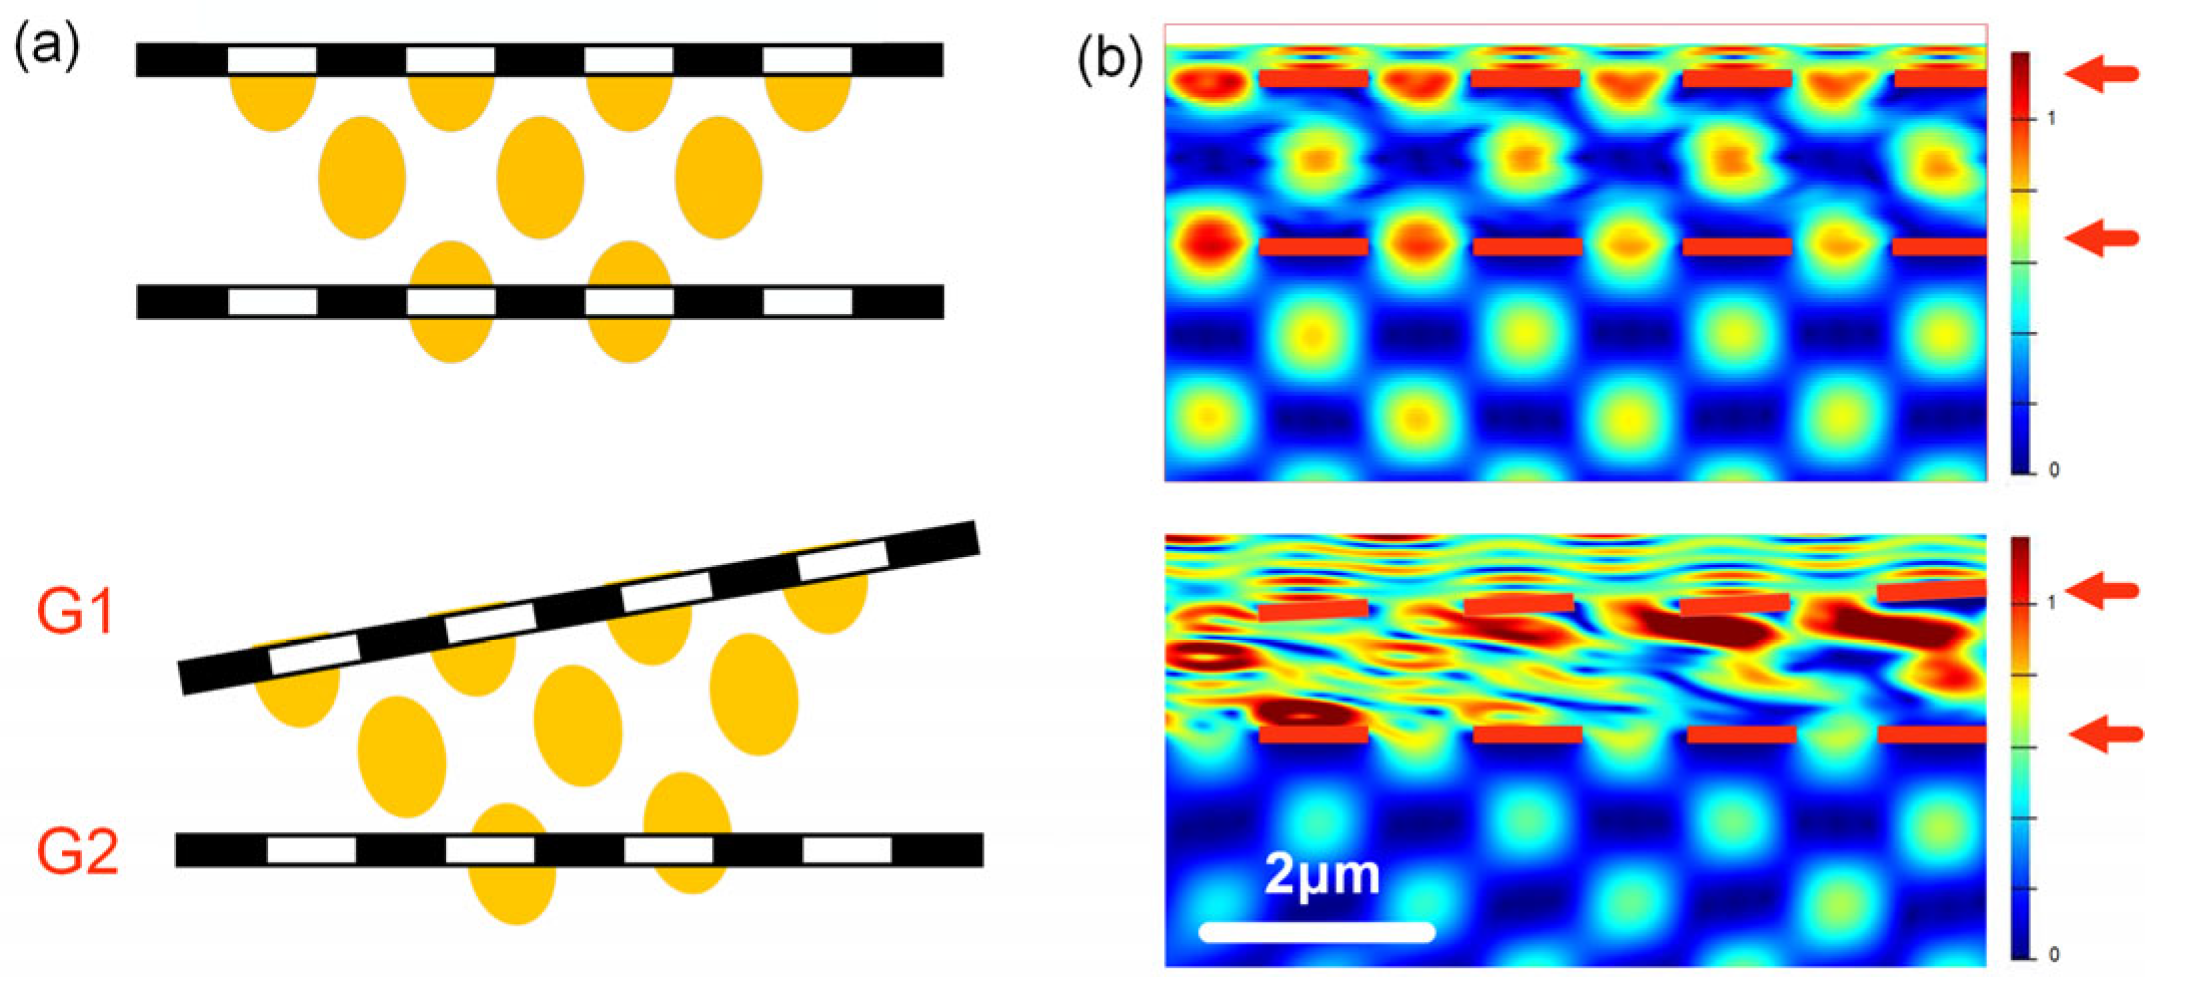
3. Simulation Results
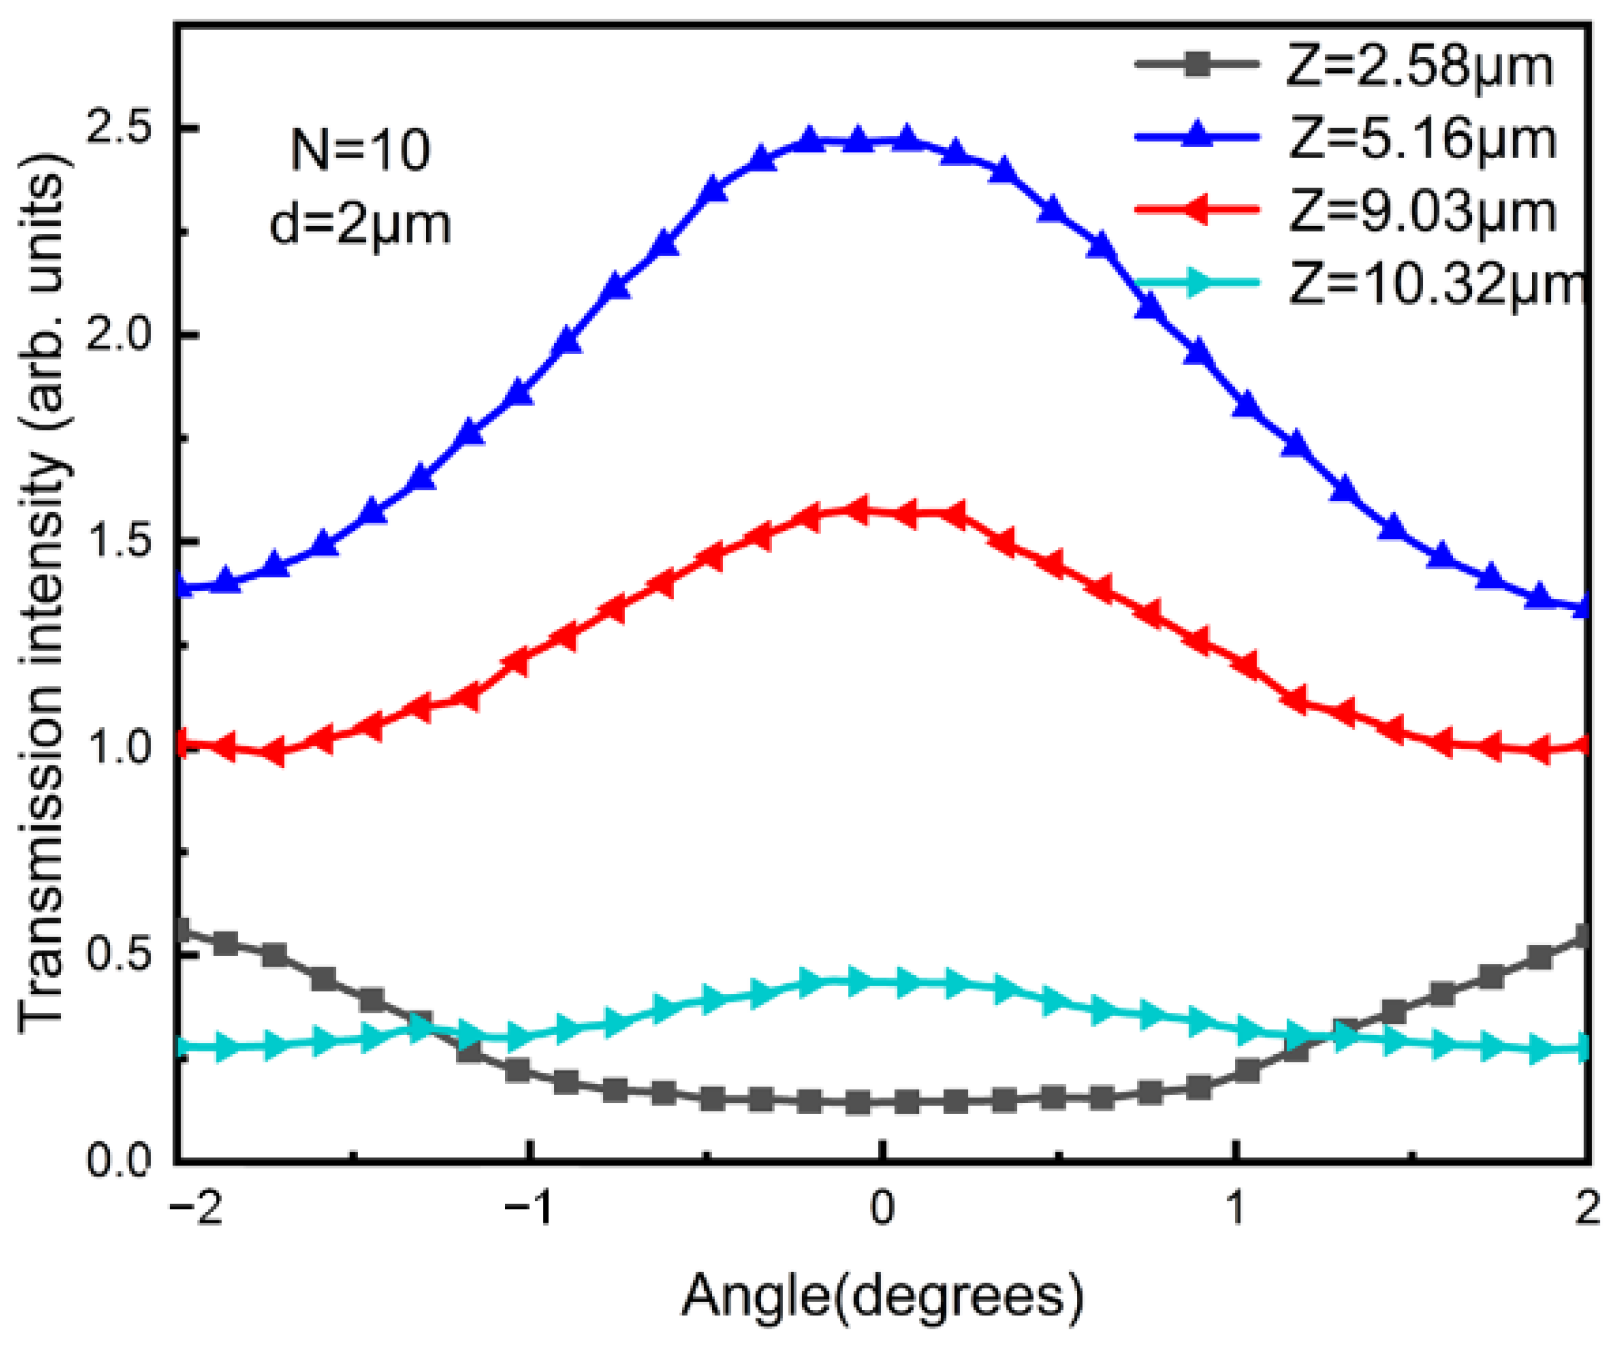
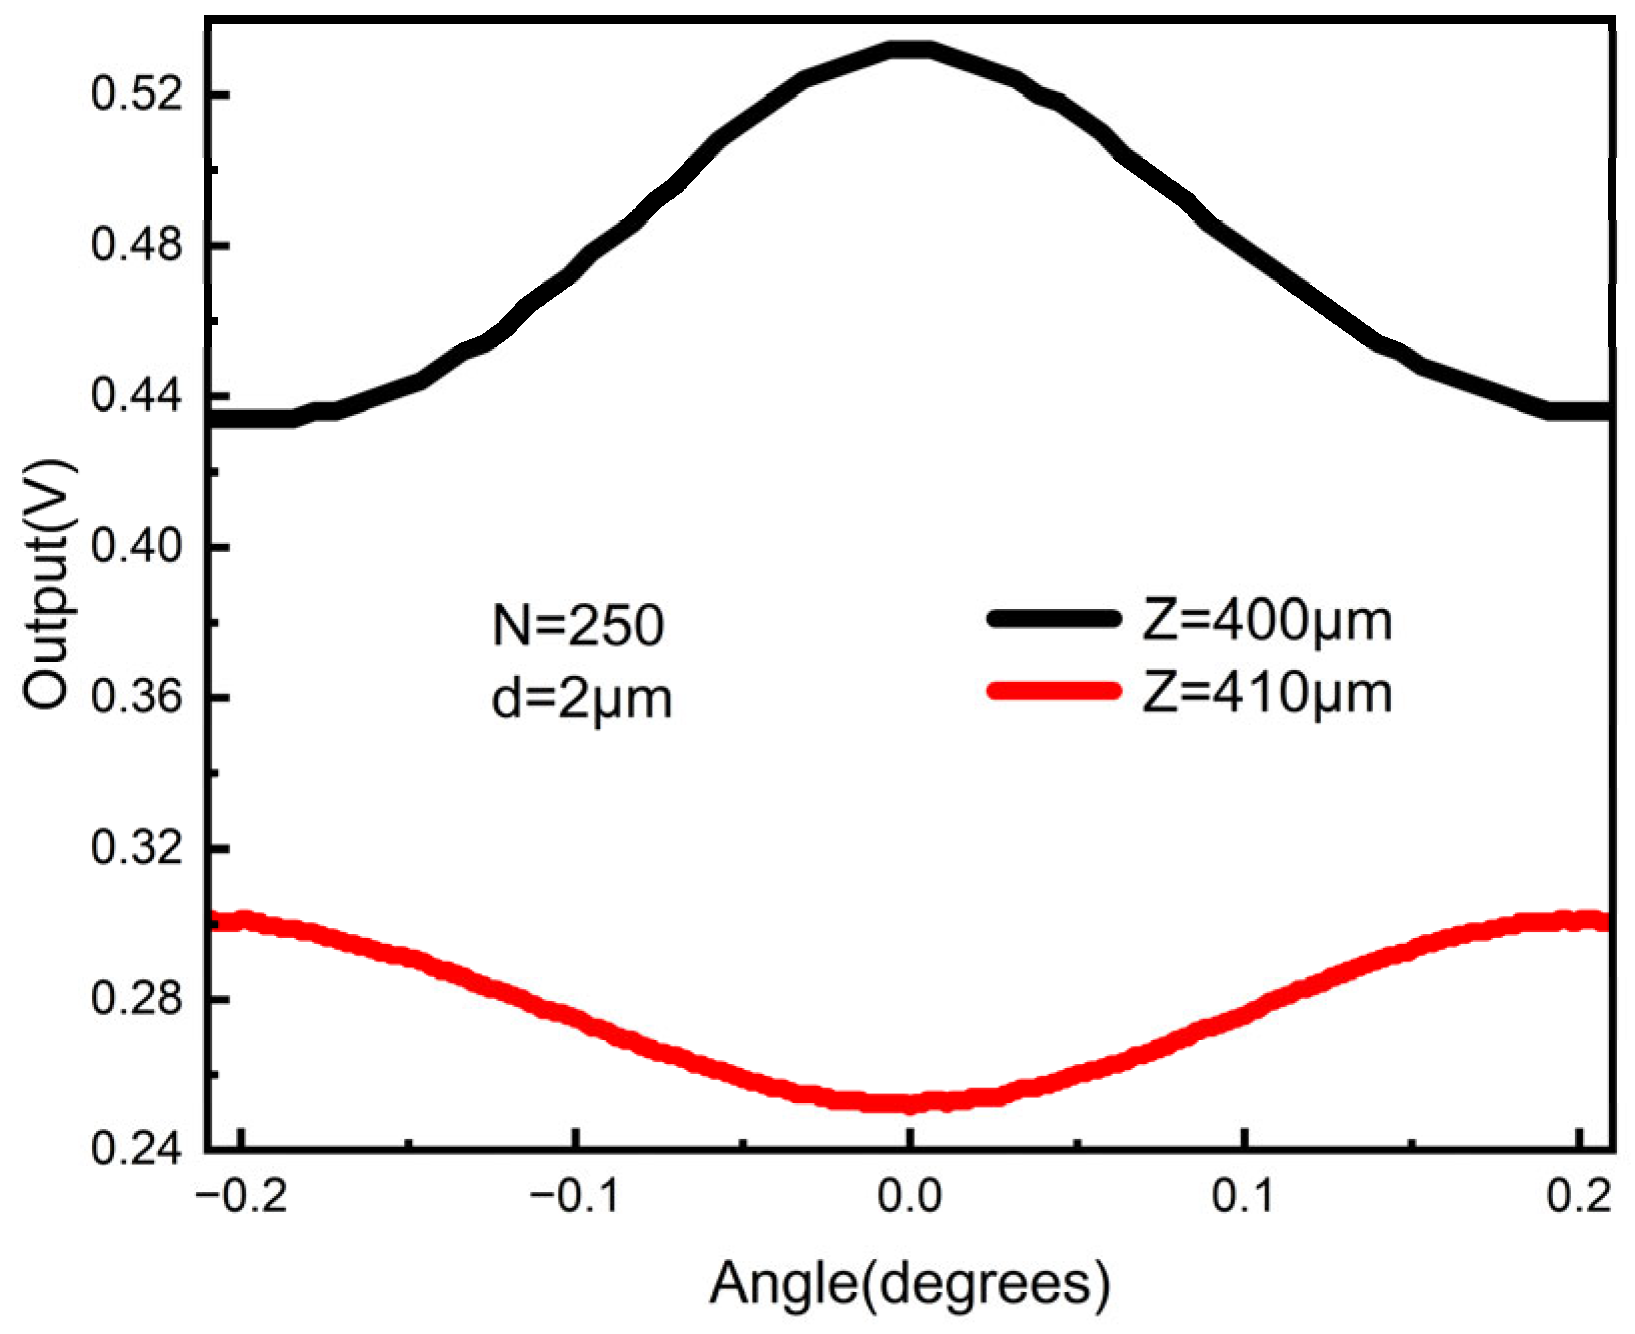
3.1. Effect of the Distance between the Two Gratings
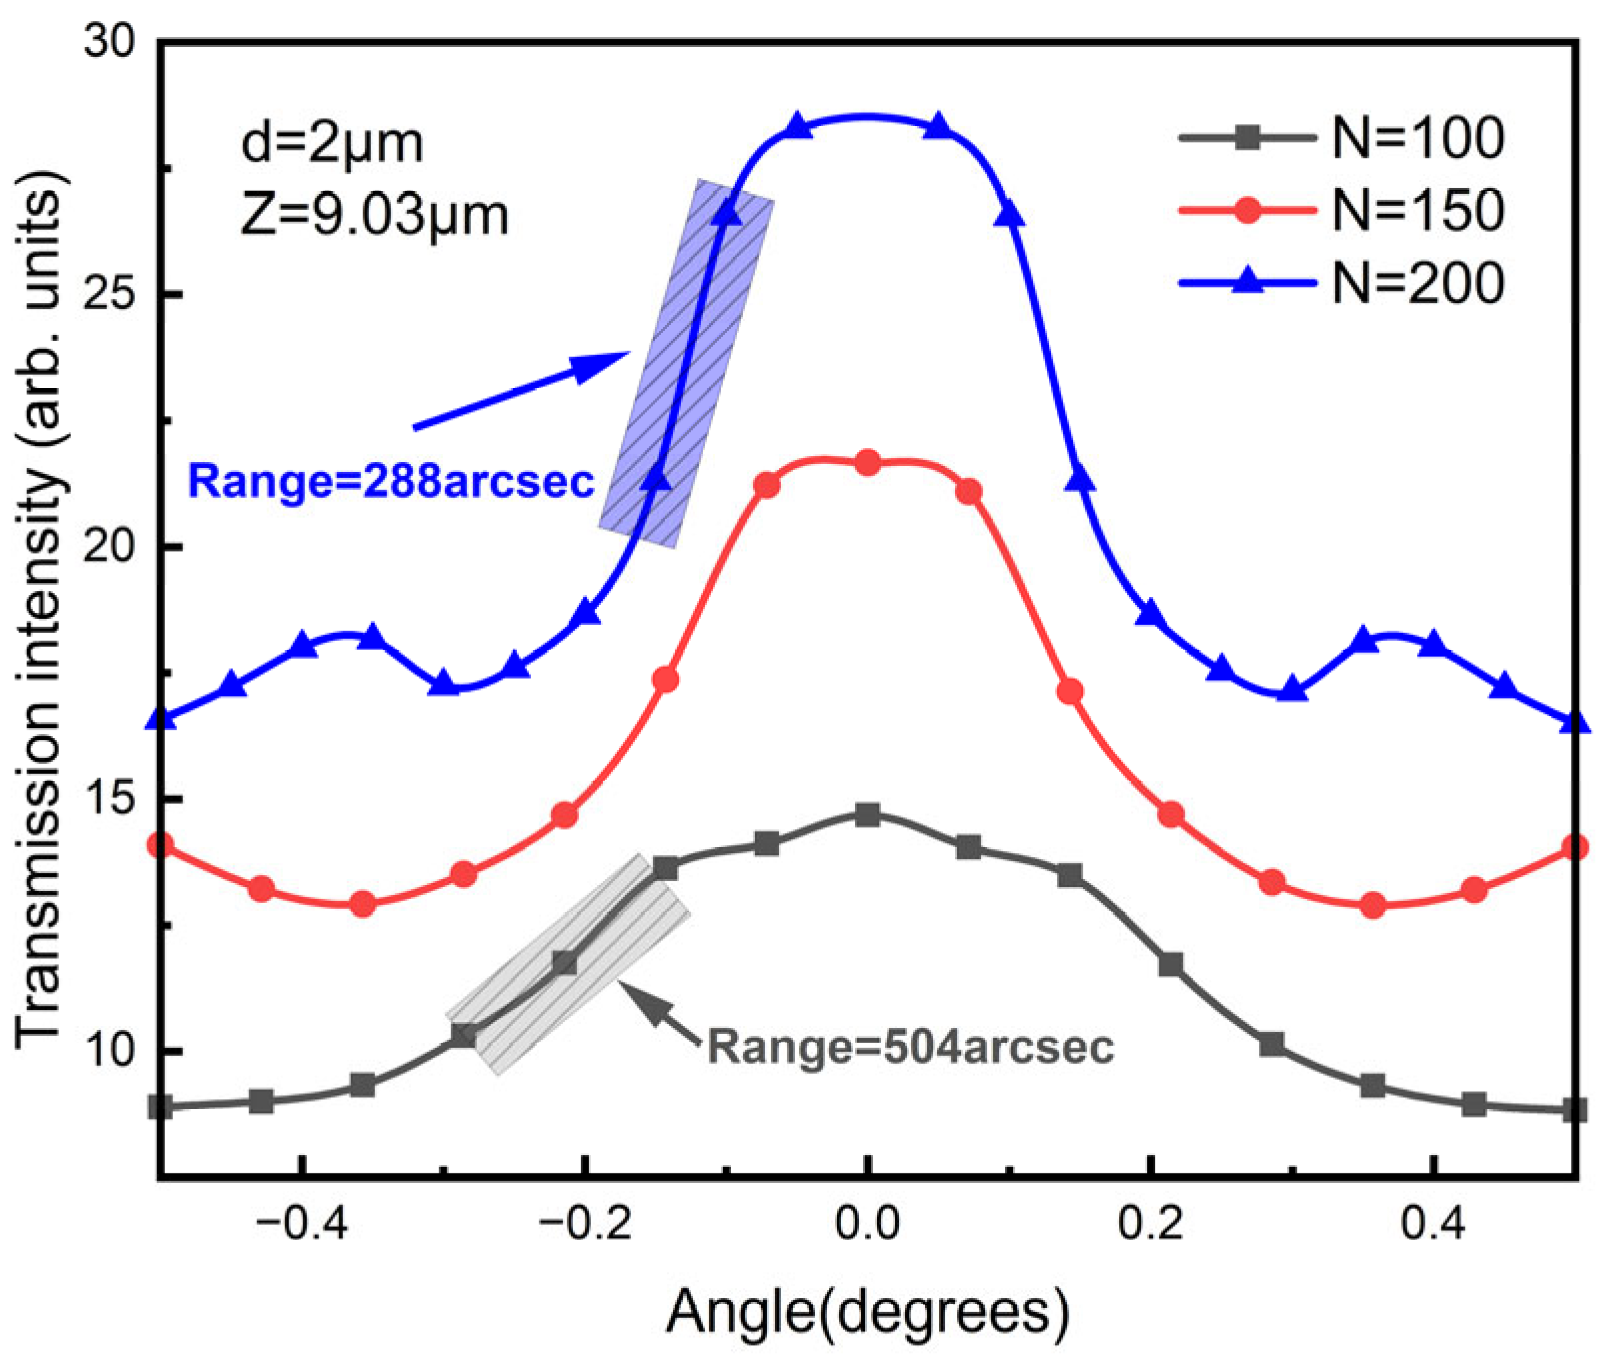
3.2. Effect of the Number of Grating Lines
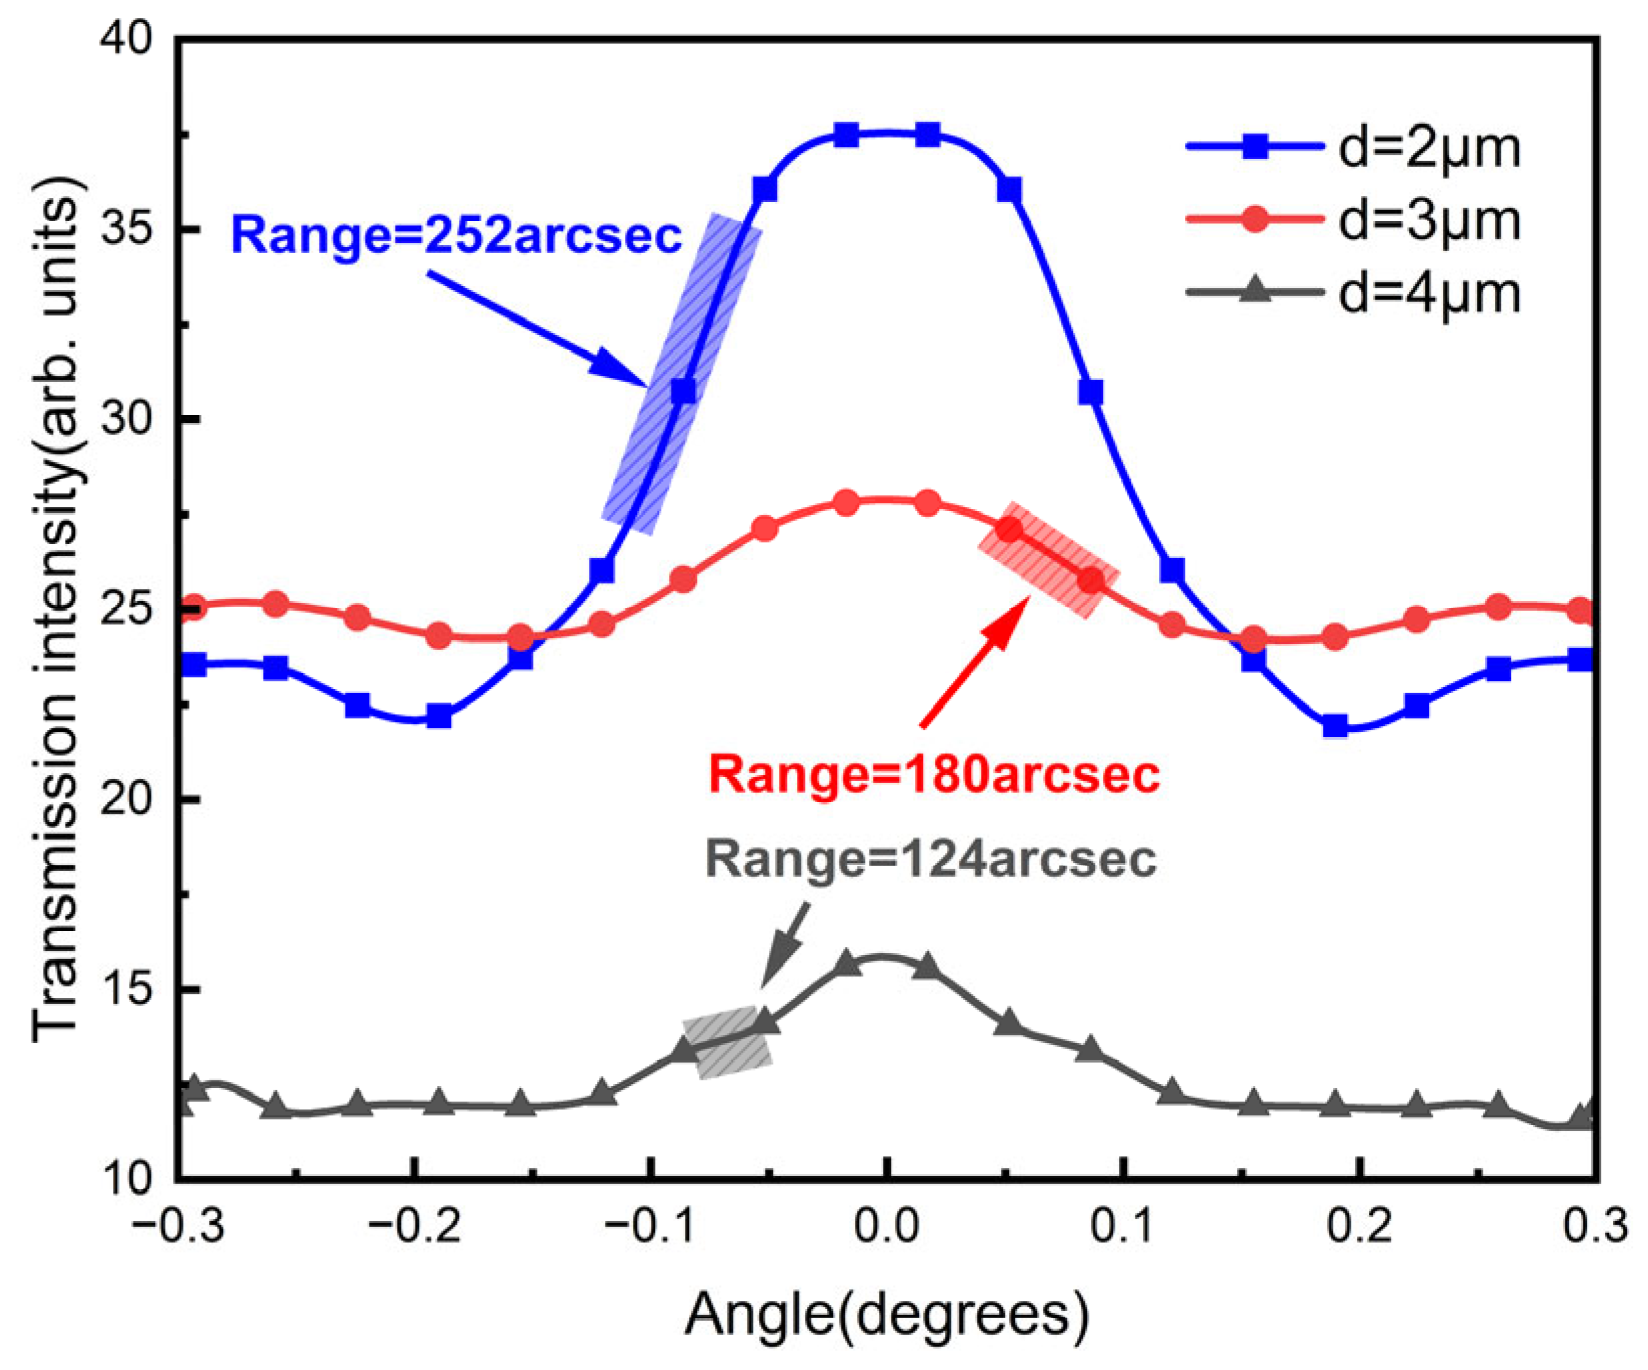
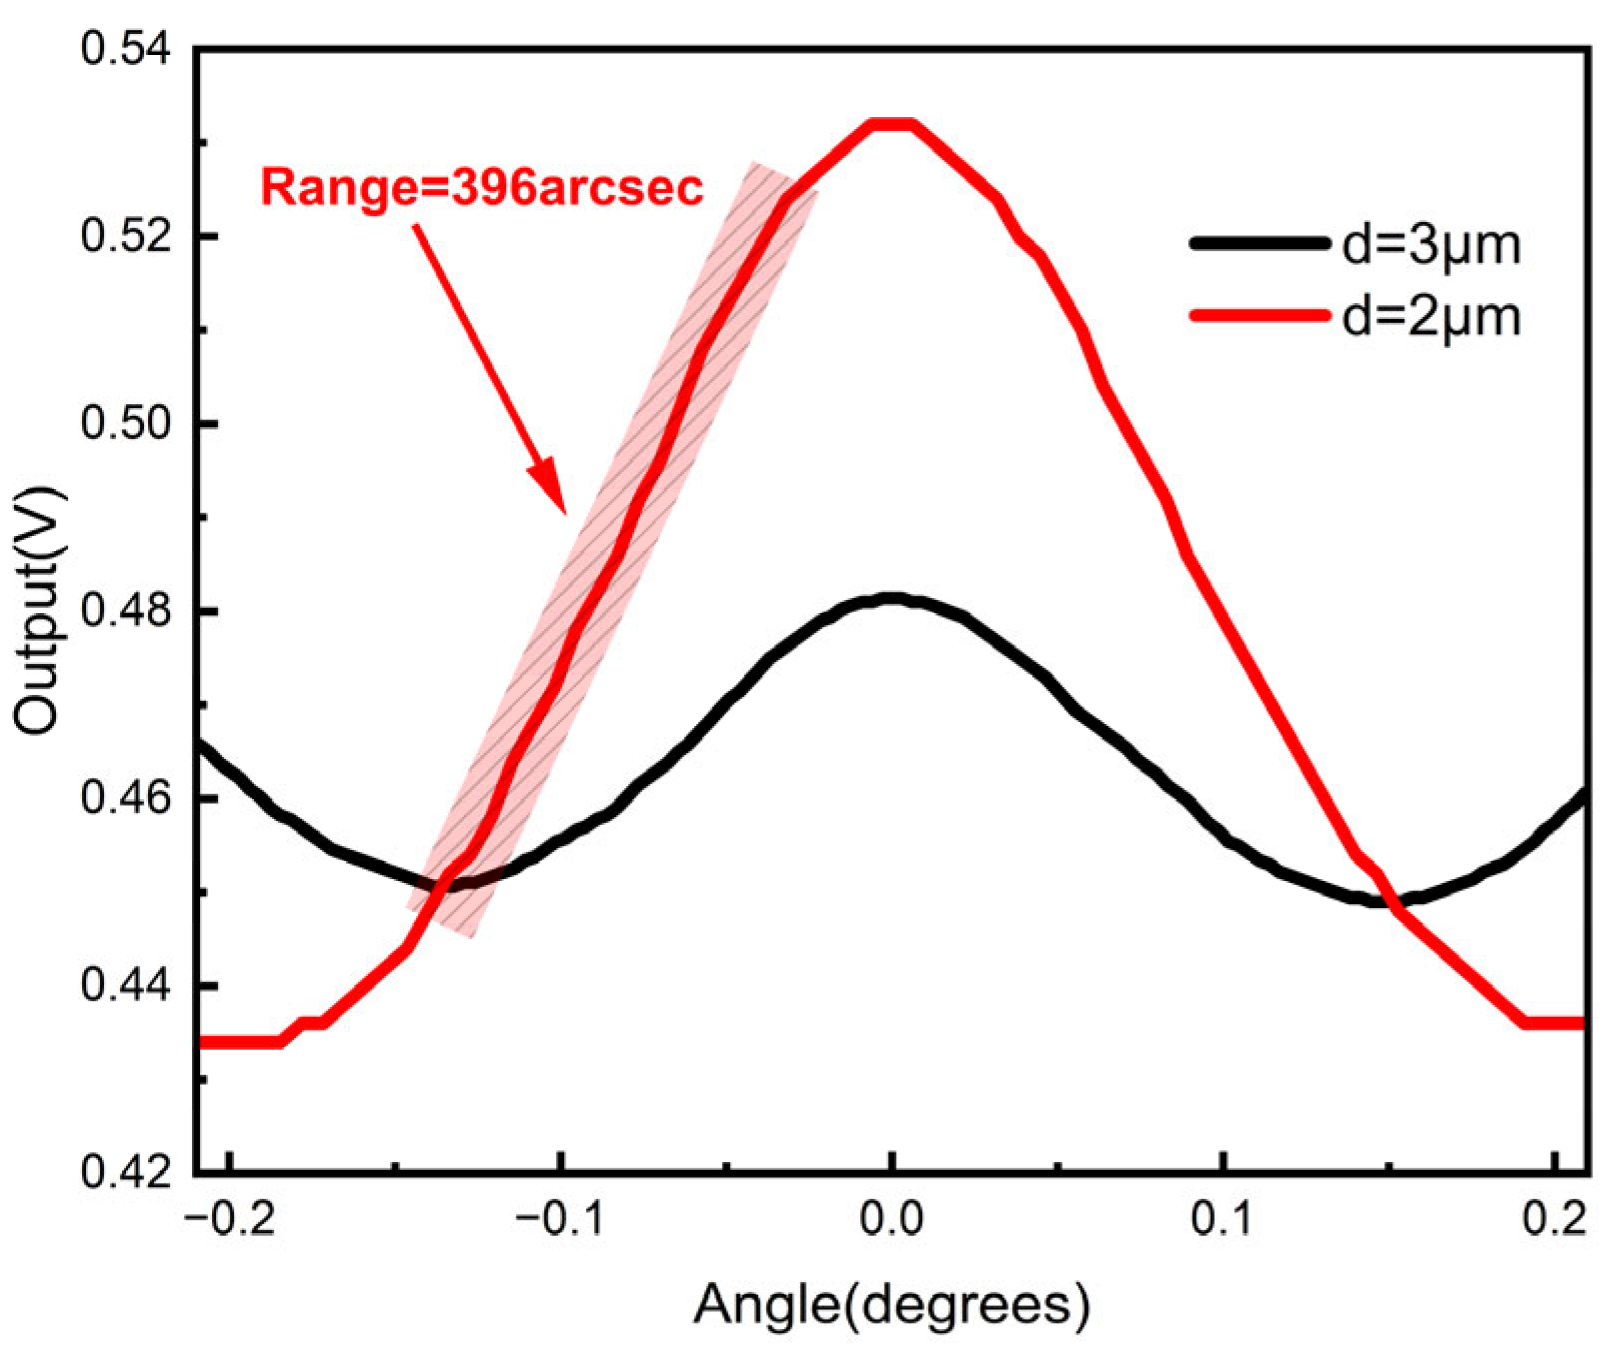
3.3. Effect of the Grating Period
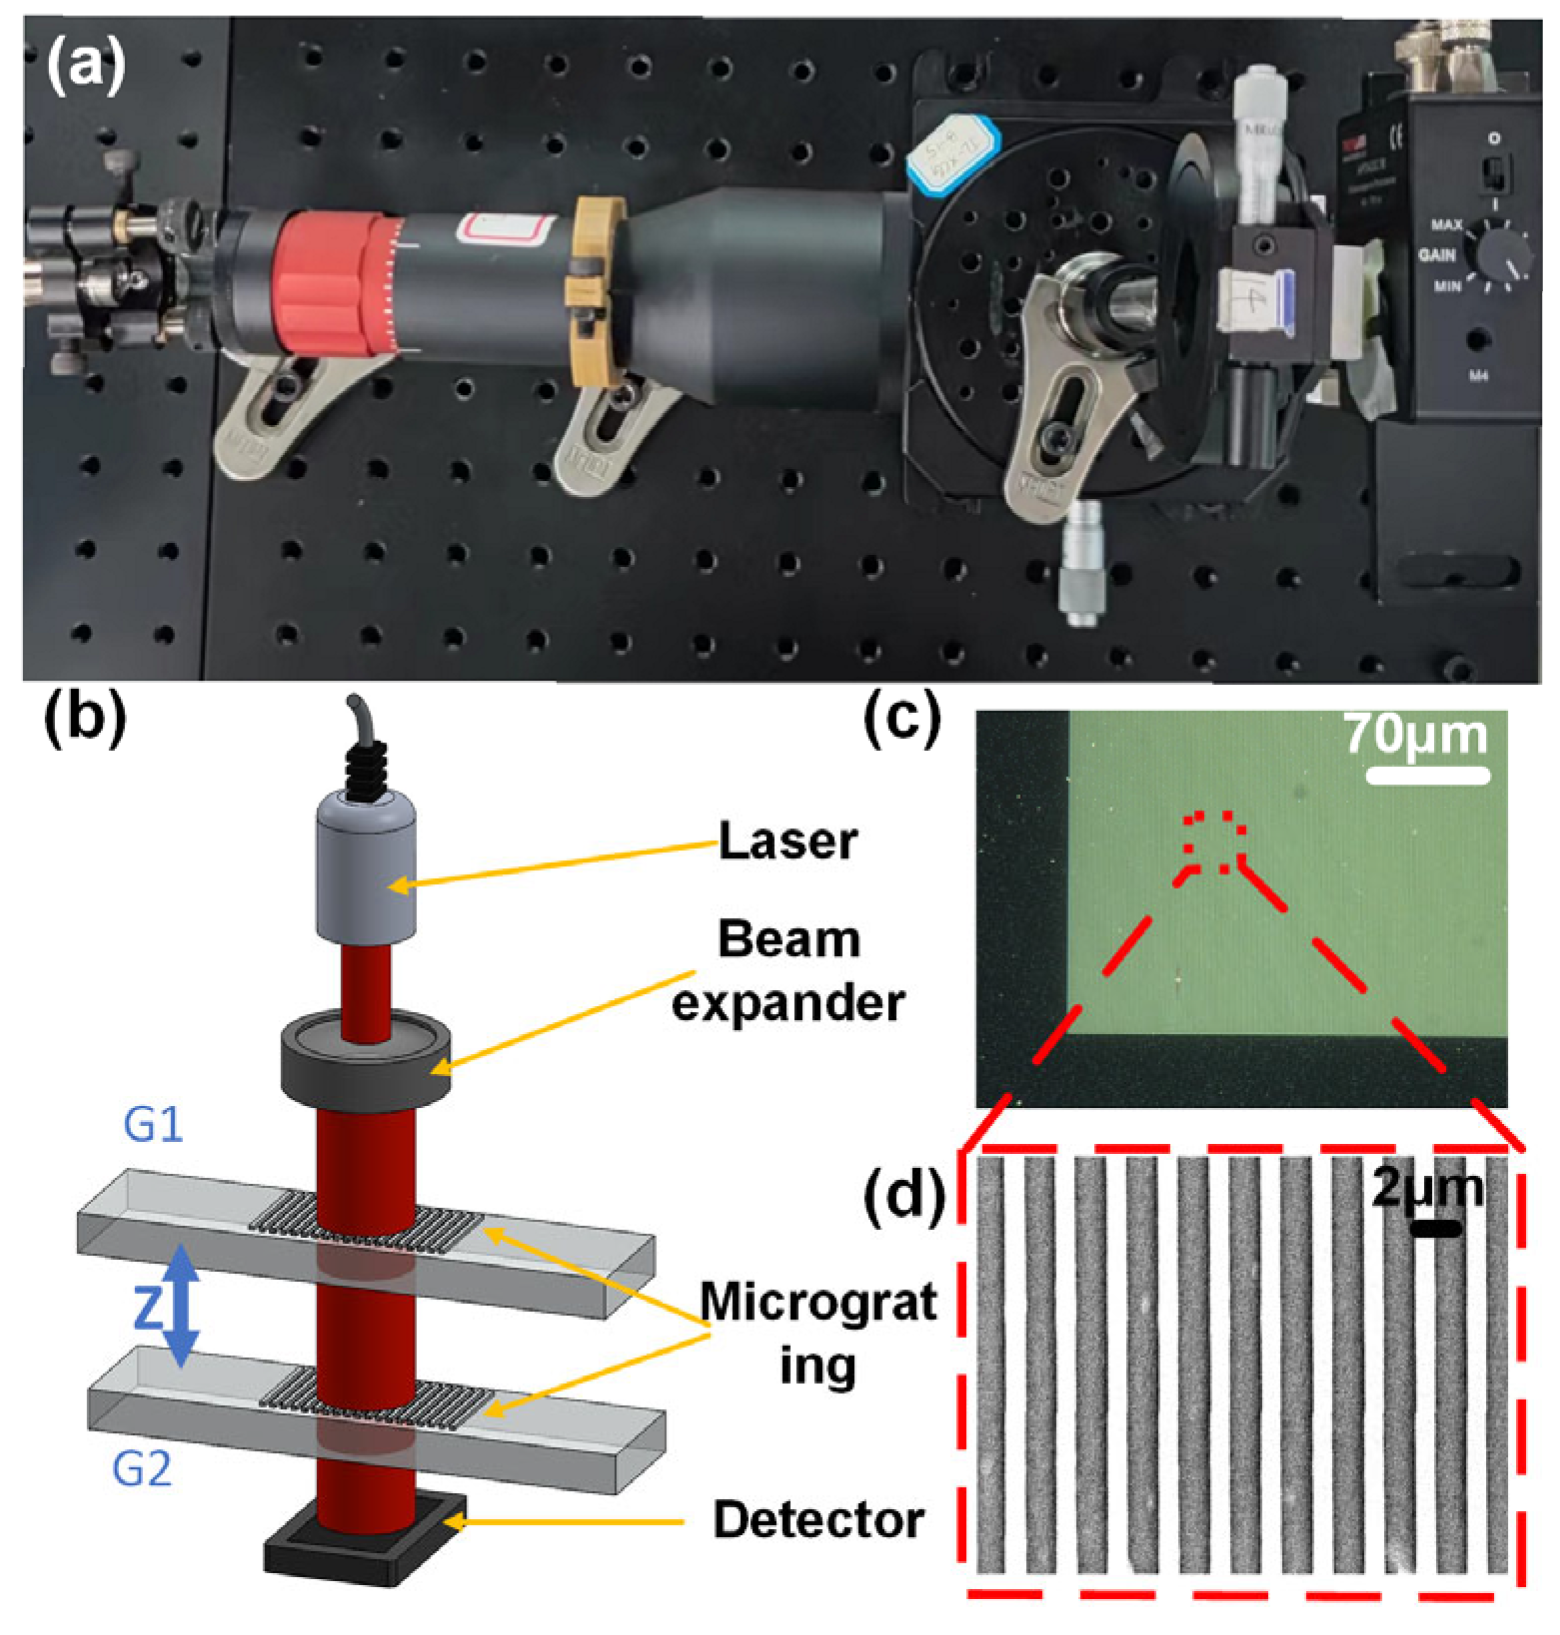
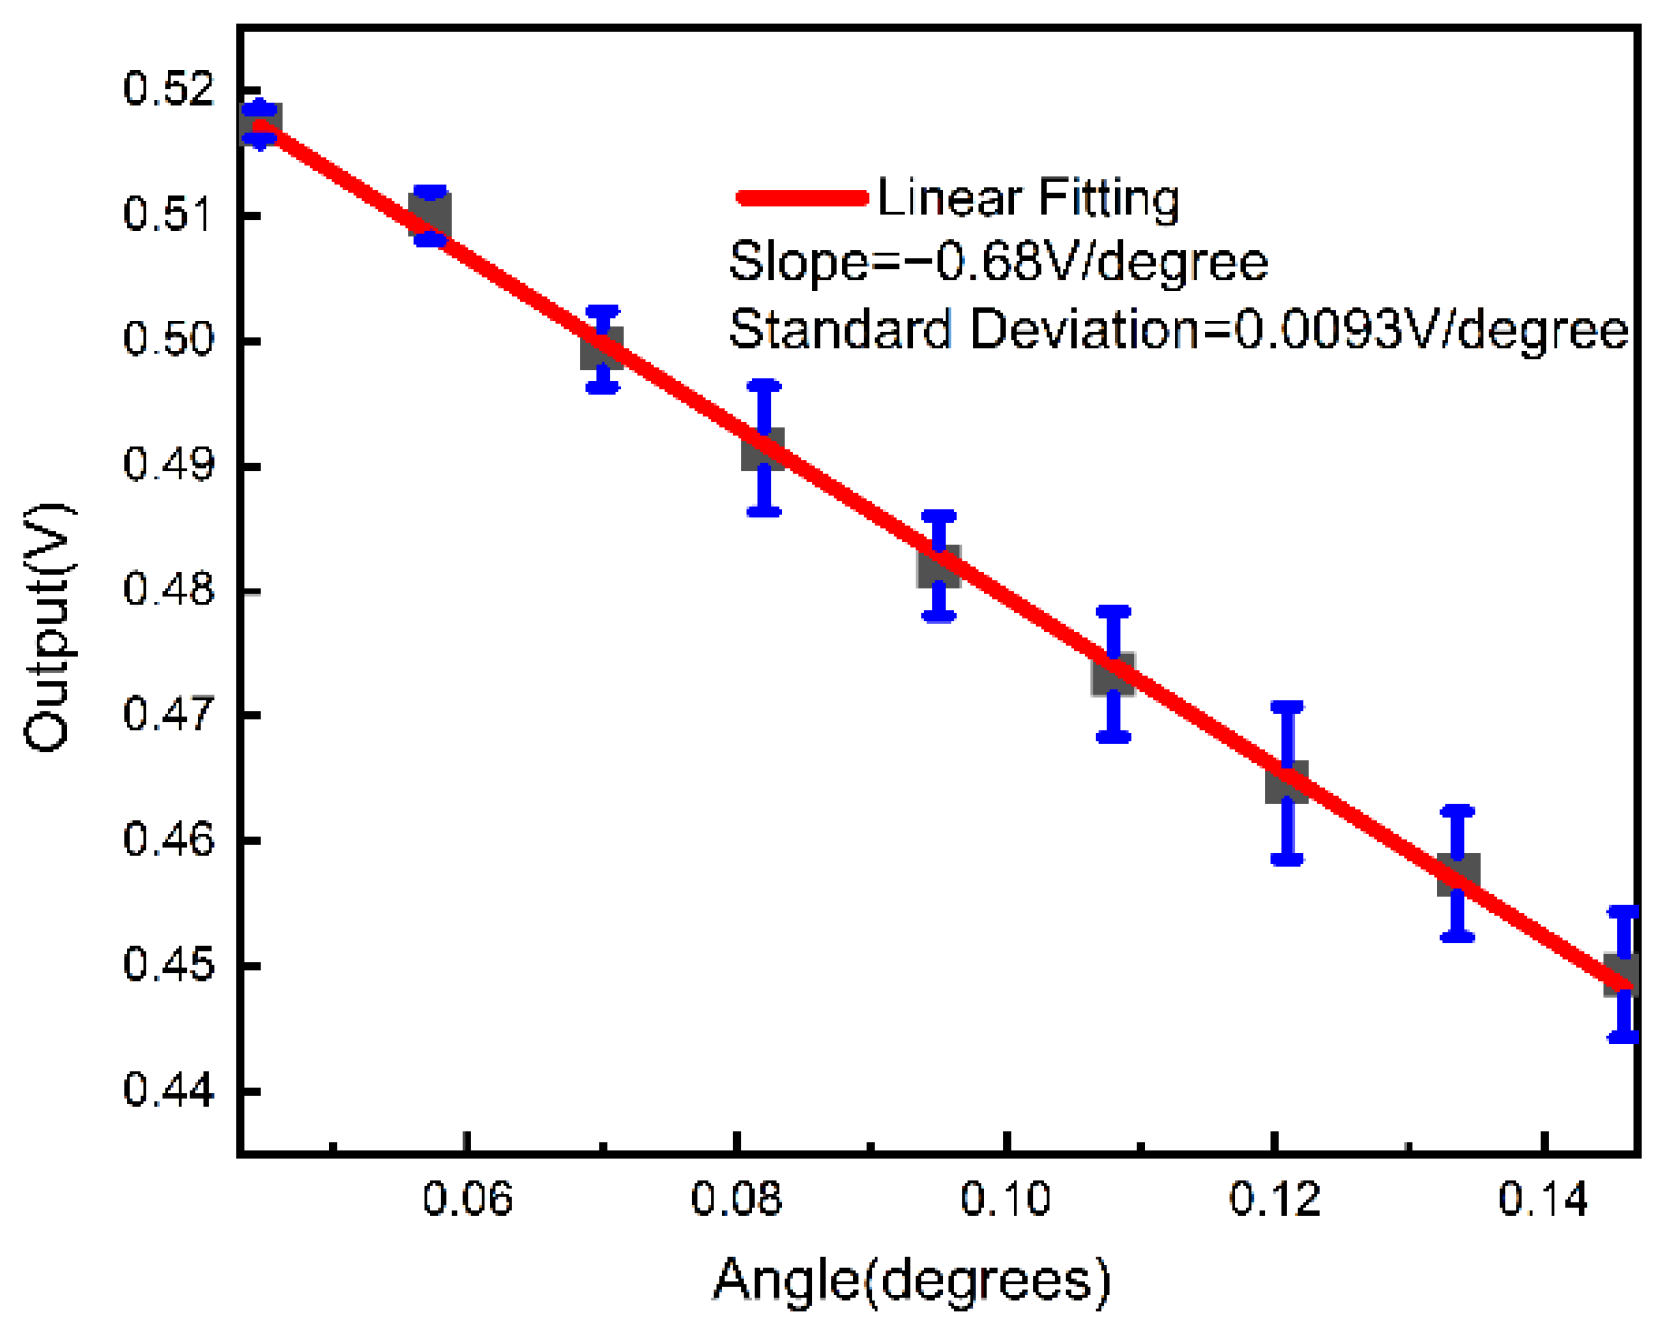
4. Experimental Results
5. Discussion
6. Conclusions
Author Contributions
Funding
Institutional Review Board Statement
Informed Consent Statement
Data Availability Statement
Acknowledgments
Conflicts of Interest
References
- Zhou, S.; Le, V.; Mi, Q.; Wu, G. Grating-Corner-Cube-Based Roll Angle Sensor. Sensors 2020, 20, 5524. [Google Scholar] [CrossRef]
- Yuan, J.; Dai, P.; Liang, D.; Zhou, S.; Xiao, S.; Liang, X. Grid Deformation Real-Time Measurement System of Ion Thruster Based on Videometrics. Appl. Sci. 2019, 9, 1759. [Google Scholar] [CrossRef] [Green Version]
- Wang, W.; Duan, M.; Si, M.; Zhang, Y. Visual measurement method for large-space dynamic angles. Meas. Sci. Technol. 2020, 31, 045011. [Google Scholar] [CrossRef]
- Chang, D.; Xing, X.; Hu, P.; Wang, J.; Tan, J. Double-Diffracted Spatially Separated Heterodyne Grating Interferometer and Analysis on its Alignment Tolerance. Appl. Sci. 2019, 9, 263. [Google Scholar] [CrossRef] [Green Version]
- Zhu, F.; Tan, J.; Cui, J. Beam splitting target reflector based compensation for angular drift of laser beam in laser autocollimation of measuring small angle deviations. Rev. Sci. Instrum. 2013, 84, 065116. [Google Scholar] [CrossRef]
- Zhu, F.; Tan, J.; Cui, J. Common-path design criteria for laser datum based measurement of small angle deviations and laser autocollimation method in compliance with the criteria with high accuracy and stability. Opt. Express 2013, 21, 11391–11403. [Google Scholar] [CrossRef]
- Saito, Y.; Gao, W.; Kiyono, S. A micro-angle sensor based on laser autocollimation, In Proceedings of the International Symposium on Optomechatronic Technologies, Sapporo, Japan, 5–7 December 2005. [CrossRef]
- Molnar, G.; Strube, S.; Koechert, P.; Danzebrink, H.U.; Fluegge, J. Simultaneous multiple degrees of freedom (DoF) measurement system. Meas. Sci. Technol. 2016, 27, 084011. [Google Scholar] [CrossRef]
- Suzuki, T.; Endo, T.; Sasaki, O.; Greivenkamp, J.E. Two-dimensional small-rotation-angle measurement using an imaging method. Opt. Eng. 2006, 45, 043604. [Google Scholar] [CrossRef]
- Zhang, C.; Duan, F.; Fu, X.; Liu, C.; Liu, W.; Su, Y. Dual-axis optoelectronic level based on laser auto-collimation and liquid surface reflection. Opt. Laser Technol. 2019, 113, 357–364. [Google Scholar] [CrossRef]
- Li, R.; Zhou, M.; Konyakhin, G.; Di, K.; Lu, Y.; Guo, U.; Liu, Y. Cube-corner autocollimator with expanded measurement range. Opt. Express 2019, 27, 6389–6403. [Google Scholar] [CrossRef]
- Astrua, M.; Pisani, M. Improved performance of a refurbished photoelectric autocollimator. Meas. Sci. Technol. 2021, 32, 015010. [Google Scholar] [CrossRef]
- Peng, C.; Gong, H.; Gao, Z.; Wang, G.; Liang, X.; He, Y.; Dong, X.; Wang, J. New type of autocollimator based on normal tracing method and Risley prisms. Appl. Opt. 2021, 60, 10114–10119. [Google Scholar] [CrossRef]
- Ren, W.; Cui, J.; Tan, J. A Novel Enhanced Roll-Angle Measurement System Based on a Transmission Grating Autocollimator. IEEE Access 2019, 7, 120929–120936. [Google Scholar] [CrossRef]
- Ren, W.; Cui, J.; Tan, J. A three-dimensional small angle measurement system based on autocollimation method. Rev. Sci. Instrum. 2022, 93, 055102. [Google Scholar] [CrossRef] [PubMed]
- Yin, Y.; Cai, S.; Qiao, Y. Design, fabrication, and verification of a three-dimensional autocollimator. Appl. Opt. 2016, 55, 9986–9991. [Google Scholar] [CrossRef]
- Guo, Y.; Cheng, H.; Wen, Y.; Feng, Y. Three-degree-of-freedom autocollimator based on a combined target reflector. Appl. Opt. 2020, 59, 2262–2269. [Google Scholar] [CrossRef]
- Huang, Y.; Fan, K.-C.; Sun, W.; Liu, S. Low cost, compact 4-DOF measurement system with active compensation of beam angular drift error. Opt. Express 2018, 26, 17185–17198. [Google Scholar] [CrossRef]
- Wang, G.; Li, Z.; Huang, J.; Duan, H.; Huang, X.; Liu, H.; Liu, Q.; Yang, S.; Tu, L.; Yeh, H.-C. Analysis and suppression of thermal effect of an ultra-stable laser interferometer for space-based gravitational waves detection. Chin. Opt. Lett. 2022, 20, 011203. [Google Scholar] [CrossRef]
- Zhang, E.; Hao, Q.; Chen, B.; Yan, L.; Liu, Y. Laser heterodyne interferometer for simultaneous measuring displacement and angle based on the Faraday effect. Opt. Express 2014, 22, 25587–25598. [Google Scholar] [CrossRef]
- Donati, S.; Rossi, D.; Norgia, M. Single Channel Self-Mixing Interferometer Measures Simultaneously Displacement and Tilt and Yaw Angles of a Reflective Target. IEEE J. Quantum Electron. 2015, 51, 1400108. [Google Scholar] [CrossRef]
- Eom, T.B.; Jeong, D.Y.; Kim, J.W. The small angle generator based on a laser angle interferometer. Int. J. Precis. Eng. Manuf. 2007, 8, 20–23. [Google Scholar]
- Chekirda, K.V.; Shur, V.L.; Lukin, A.Y.; Kos’mina, M.A.; Leibengardt, G.I. A Study of an Angle Examiner Based on the Fizeau Interferometer with Expanded Measurement Range. Meas. Tech. 2016, 59, 133–136. [Google Scholar] [CrossRef]
- Malacara, D.; Harris, O. Interferometric measurement of angles. Appl. Opt. 1970, 9, 1630–1633. [Google Scholar] [CrossRef] [PubMed]
- Hahn, I.; Weilert, M.; Wang, X.; Goullioud, R. A heterodyne interferometer for angle metrology. Rev. Sci. Instrum. 2010, 81, 045103. [Google Scholar] [CrossRef] [Green Version]
- Hsieh, H.L.; Pan, S.W. Development of a grating-based interferometer for six-degree-of-freedom displacement and angle measurements. Opt. Express 2015, 23, 2451–2465. [Google Scholar] [CrossRef]
- Hsu, C.-C.; Chen, H.; Tseng, H.-Y.; Lan, S.-C.; Lin, J. High displacement resolution encoder by using triple grating combination interferometer. Opt. Laser Technol. 2018, 105, 221–228. [Google Scholar] [CrossRef]
- Liu, Q.; Ohba, R. Effects of unparallel grating planes in Talbot interferometry. Appl. Opt. 1999, 38, 4111–4116. [Google Scholar] [CrossRef] [PubMed]
- Yang, W.; Wang, Z.; Shen, C.; Liu, Y.; Liu, S. Design of a Roll Angle Measuring Sensor. IEEE Access 2020, 8, 115159–115166. [Google Scholar] [CrossRef]
- Wang, A.; Gill, P.R.; Molnar, A.C. Light field image sensors based on the Talbot effect. Appl. Opt. 2009, 48, 5897–5905. [Google Scholar] [CrossRef]
- Lian, X.; Wu, Q.; Farrell, G.; Shen, C.; Ma, Y.; Semenova, Y. Discrete Self-Imaging in Small-Core Optical Fiber Interferometers. J. Lightwave Technol. 2019, 37, 1873–1884. [Google Scholar] [CrossRef]
- Chang, D.; Hu, P.; Tan, J. Fused-like angles: Replacement for roll-pitch-yaw angles for a six-degree-of-freedom grating interferometer. Front. Inf. Technol. Electron. Eng. 2021, 22, 1677–1684. [Google Scholar] [CrossRef]
- Deachapunya, S.; Srisuphaphon, S. Sensitivity of transverse shift inside a double-grating Talbot interferometer. Measurement 2014, 58, 1–5. [Google Scholar] [CrossRef]
- Wang, H.; Kuang, D.; Fang, Z. Diffraction analysis of blazed transmission gratings with a modified extended scalar theory. J. Opt. Soc. Am. A. 2008, 25, 1253–1259. [Google Scholar] [CrossRef] [PubMed]
- Goodman, J.W. Introduction to Fourier Optics, 4th ed.; W.H. Freeman & Company: New York, NY, USA, 2007; pp. 60–90. [Google Scholar]
- Smolyaninov, I.I.; Davis, C.C. Apparent superresolution in near-field optical imaging of periodic gratings. Opt. Lett. 1998, 23, 1346–1347. [Google Scholar] [CrossRef] [PubMed]
- Stark, H. Applications of Optical Fourier Transforms; Academic Press: Amsterdam, The Netherlands, 2012; pp. 433–440. [Google Scholar]
- Zhu, R.; Jing, R.; Cheng, Y. Simulation and experimental studies of a double-fiber angular displacement sensor. Opt. Laser. Technol. 2017, 89, 168–172. [Google Scholar] [CrossRef]
- Zha, S.; Huang, X.; Zha, C.L.; Ma, H.; Cai, X.; Li, Y.; Pan, P.; Zhan, S. Theoretical and experimental study on intensity modulation differential optical fiber angular displacement sensor. Microw. Opt. Technol. Lett. 2021, 63, 1642–1646. [Google Scholar] [CrossRef]
- Zhu, J.; Wang, G.; Wang, S.; Li, X. A Reflective-Type Heterodyne Grating Interferometer for Three-Degree-of-Freedom Subnanometer Measurement. IEEE Trans. Instrum. Meas. 2022, 71, 7007509. [Google Scholar] [CrossRef]
- Ye, W.; Zhang, M.; Zhu, Y.; Wang, L.; Hu, J.; Li, X.; Hu, C. Real-time displacement calculation and offline geometric calibration of the grating interferometer system for ultra-precision wafer stage measurement. Precis. Eng. 2019, 60, 413–420. [Google Scholar] [CrossRef]


Disclaimer/Publisher’s Note: The statements, opinions and data contained in all publications are solely those of the individual author(s) and contributor(s) and not of MDPI and/or the editor(s). MDPI and/or the editor(s) disclaim responsibility for any injury to people or property resulting from any ideas, methods, instructions or products referred to in the content. |
© 2023 by the authors. Licensee MDPI, Basel, Switzerland. This article is an open access article distributed under the terms and conditions of the Creative Commons Attribution (CC BY) license (https://creativecommons.org/licenses/by/4.0/).
Share and Cite
Yang, Z.; Ma, X.; Yu, D.; Cao, B.; Niu, Q.; Li, M.; Xin, C. An Ultracompact Angular Displacement Sensor Based on the Talbot Effect of Optical Microgratings. Sensors 2023, 23, 1091. https://doi.org/10.3390/s23031091
Yang Z, Ma X, Yu D, Cao B, Niu Q, Li M, Xin C. An Ultracompact Angular Displacement Sensor Based on the Talbot Effect of Optical Microgratings. Sensors. 2023; 23(3):1091. https://doi.org/10.3390/s23031091
Chicago/Turabian StyleYang, Zhiyong, Xiaochen Ma, Daguo Yu, Bin Cao, Qianqi Niu, Mengwei Li, and Chenguang Xin. 2023. "An Ultracompact Angular Displacement Sensor Based on the Talbot Effect of Optical Microgratings" Sensors 23, no. 3: 1091. https://doi.org/10.3390/s23031091