

Deep Learning-Inspired IoT-IDS Mechanism for Edge Computing Environments

Abstract
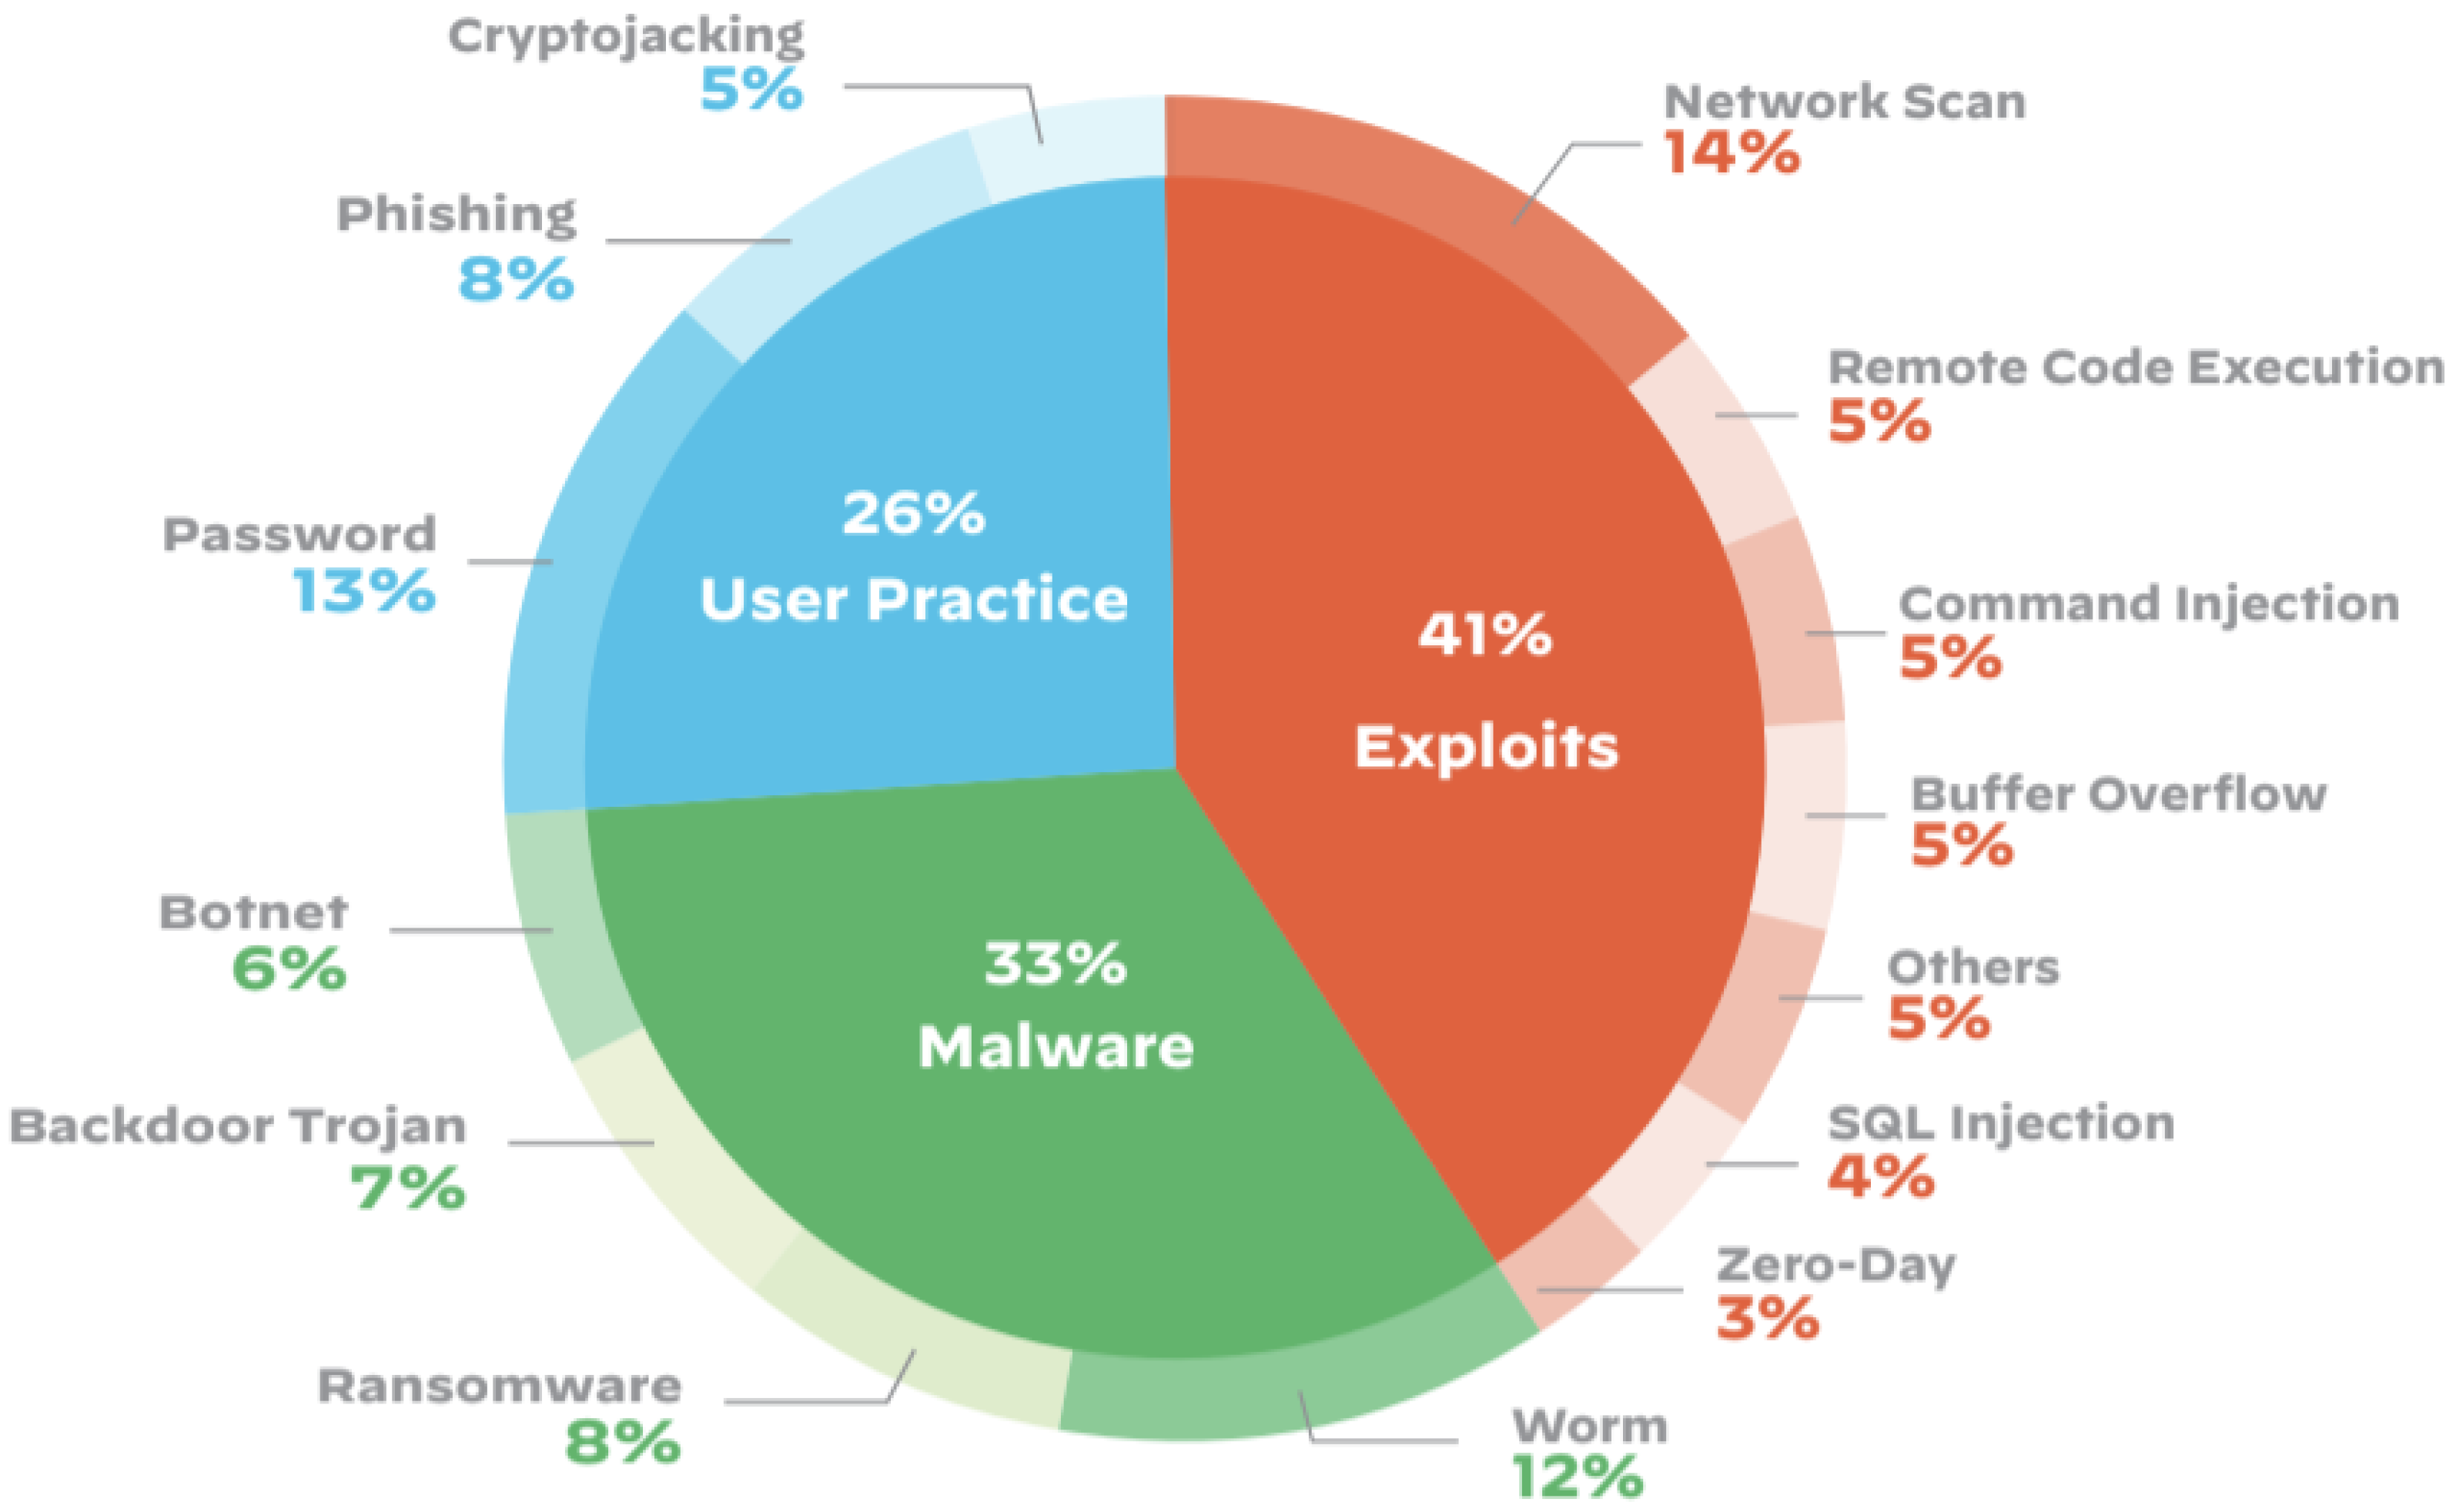
:1. Introduction
State-of-the-Art Contributions
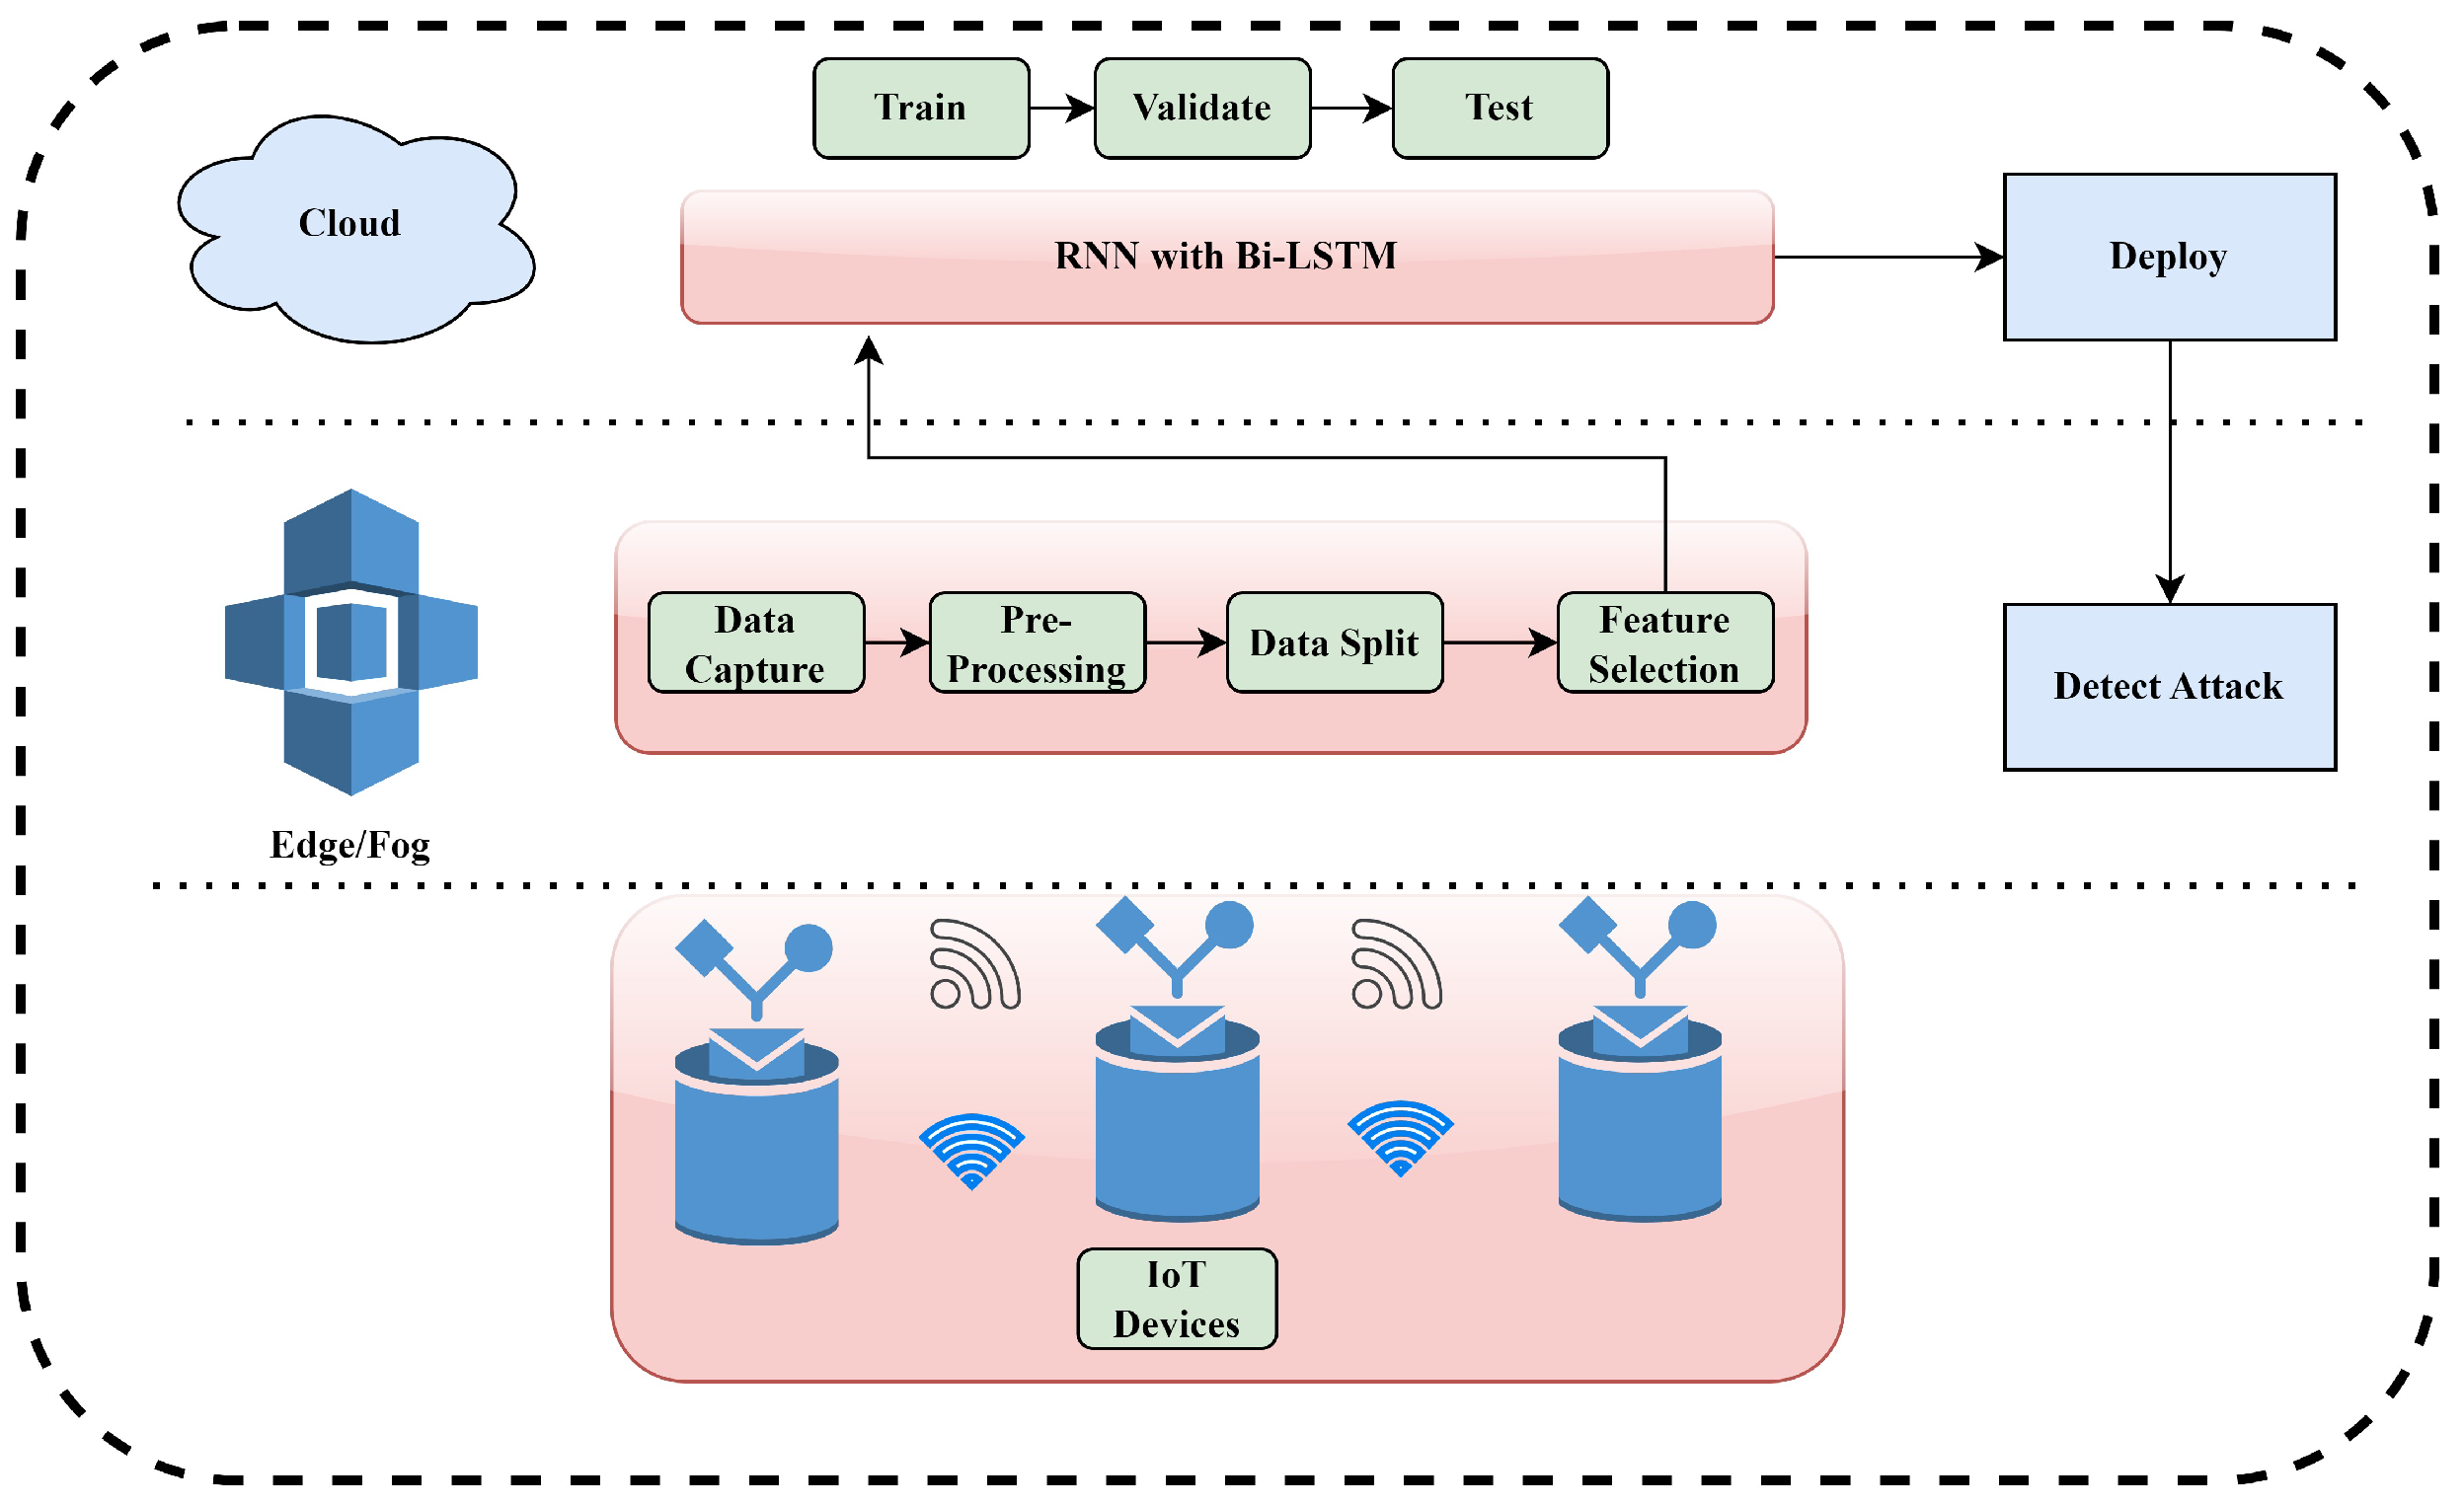
- Detect attacks on latency-critical networks via an edge–cloud-distributed Intrusion Detection System.
- Bifurcating temporal data into smaller subsets according to type of attack allows for the distributed analysis of a large-scale BoT-IoT dataset.
- With the help of attribute selection methods, the proposed technique can drastically decrease the size of the dataset without sacrificing accuracy in classifying observations.
- Recurrent Neural Networks (Simple-RNN and Bidirectional LSTM) are used in the BoT-IoT dataset to identify attack traffic and determine the performance enhancement as compared to the state-of-the-art techniques.
2. Literature Review
Research Challenges
3. Proposed Model
3.1. Attribute Selection
3.1.1. Group Method of Data Handling (GMDH)
- Step 1: Two attributes are chosen at random and supplied into a single neuron.
- Step 1.1:
- Define the pool of attributes.
- Step 1.2:
- Determine subset size = 2.
- Step 1.3:
- Random subset selection.
- Step 1.4:
- Evaluate subset performance.
- Step 1.5:
- Select optimal subset.
- Step 1.6:
- Repeat the process.
- Step 2: The weights are estimated by comparing the training set to the current state of each neuron.
- Step 3: Probabilities are computed using the training and validation datasets at each neuron.
- Step 4: The most effective neurons are chosen according to some objective standard.
- Step 5: Validation error, bias error, validation, and bias error are the available criteria offered by the Python version of GMDH. In the current scenario, a validation error is selected.
- Step 6: Users have the option of customizing neurons for every layer or having it determined automatically based on input variables.
- Step 7: In the event of a validation error, reaching the maximum number of layers, or selecting a single neuron, the process will restart from the beginning.
3.1.2. Mutual Information
3.1.3. Chi-Square (Chi-Sqr)
3.1.4. Selection Validation
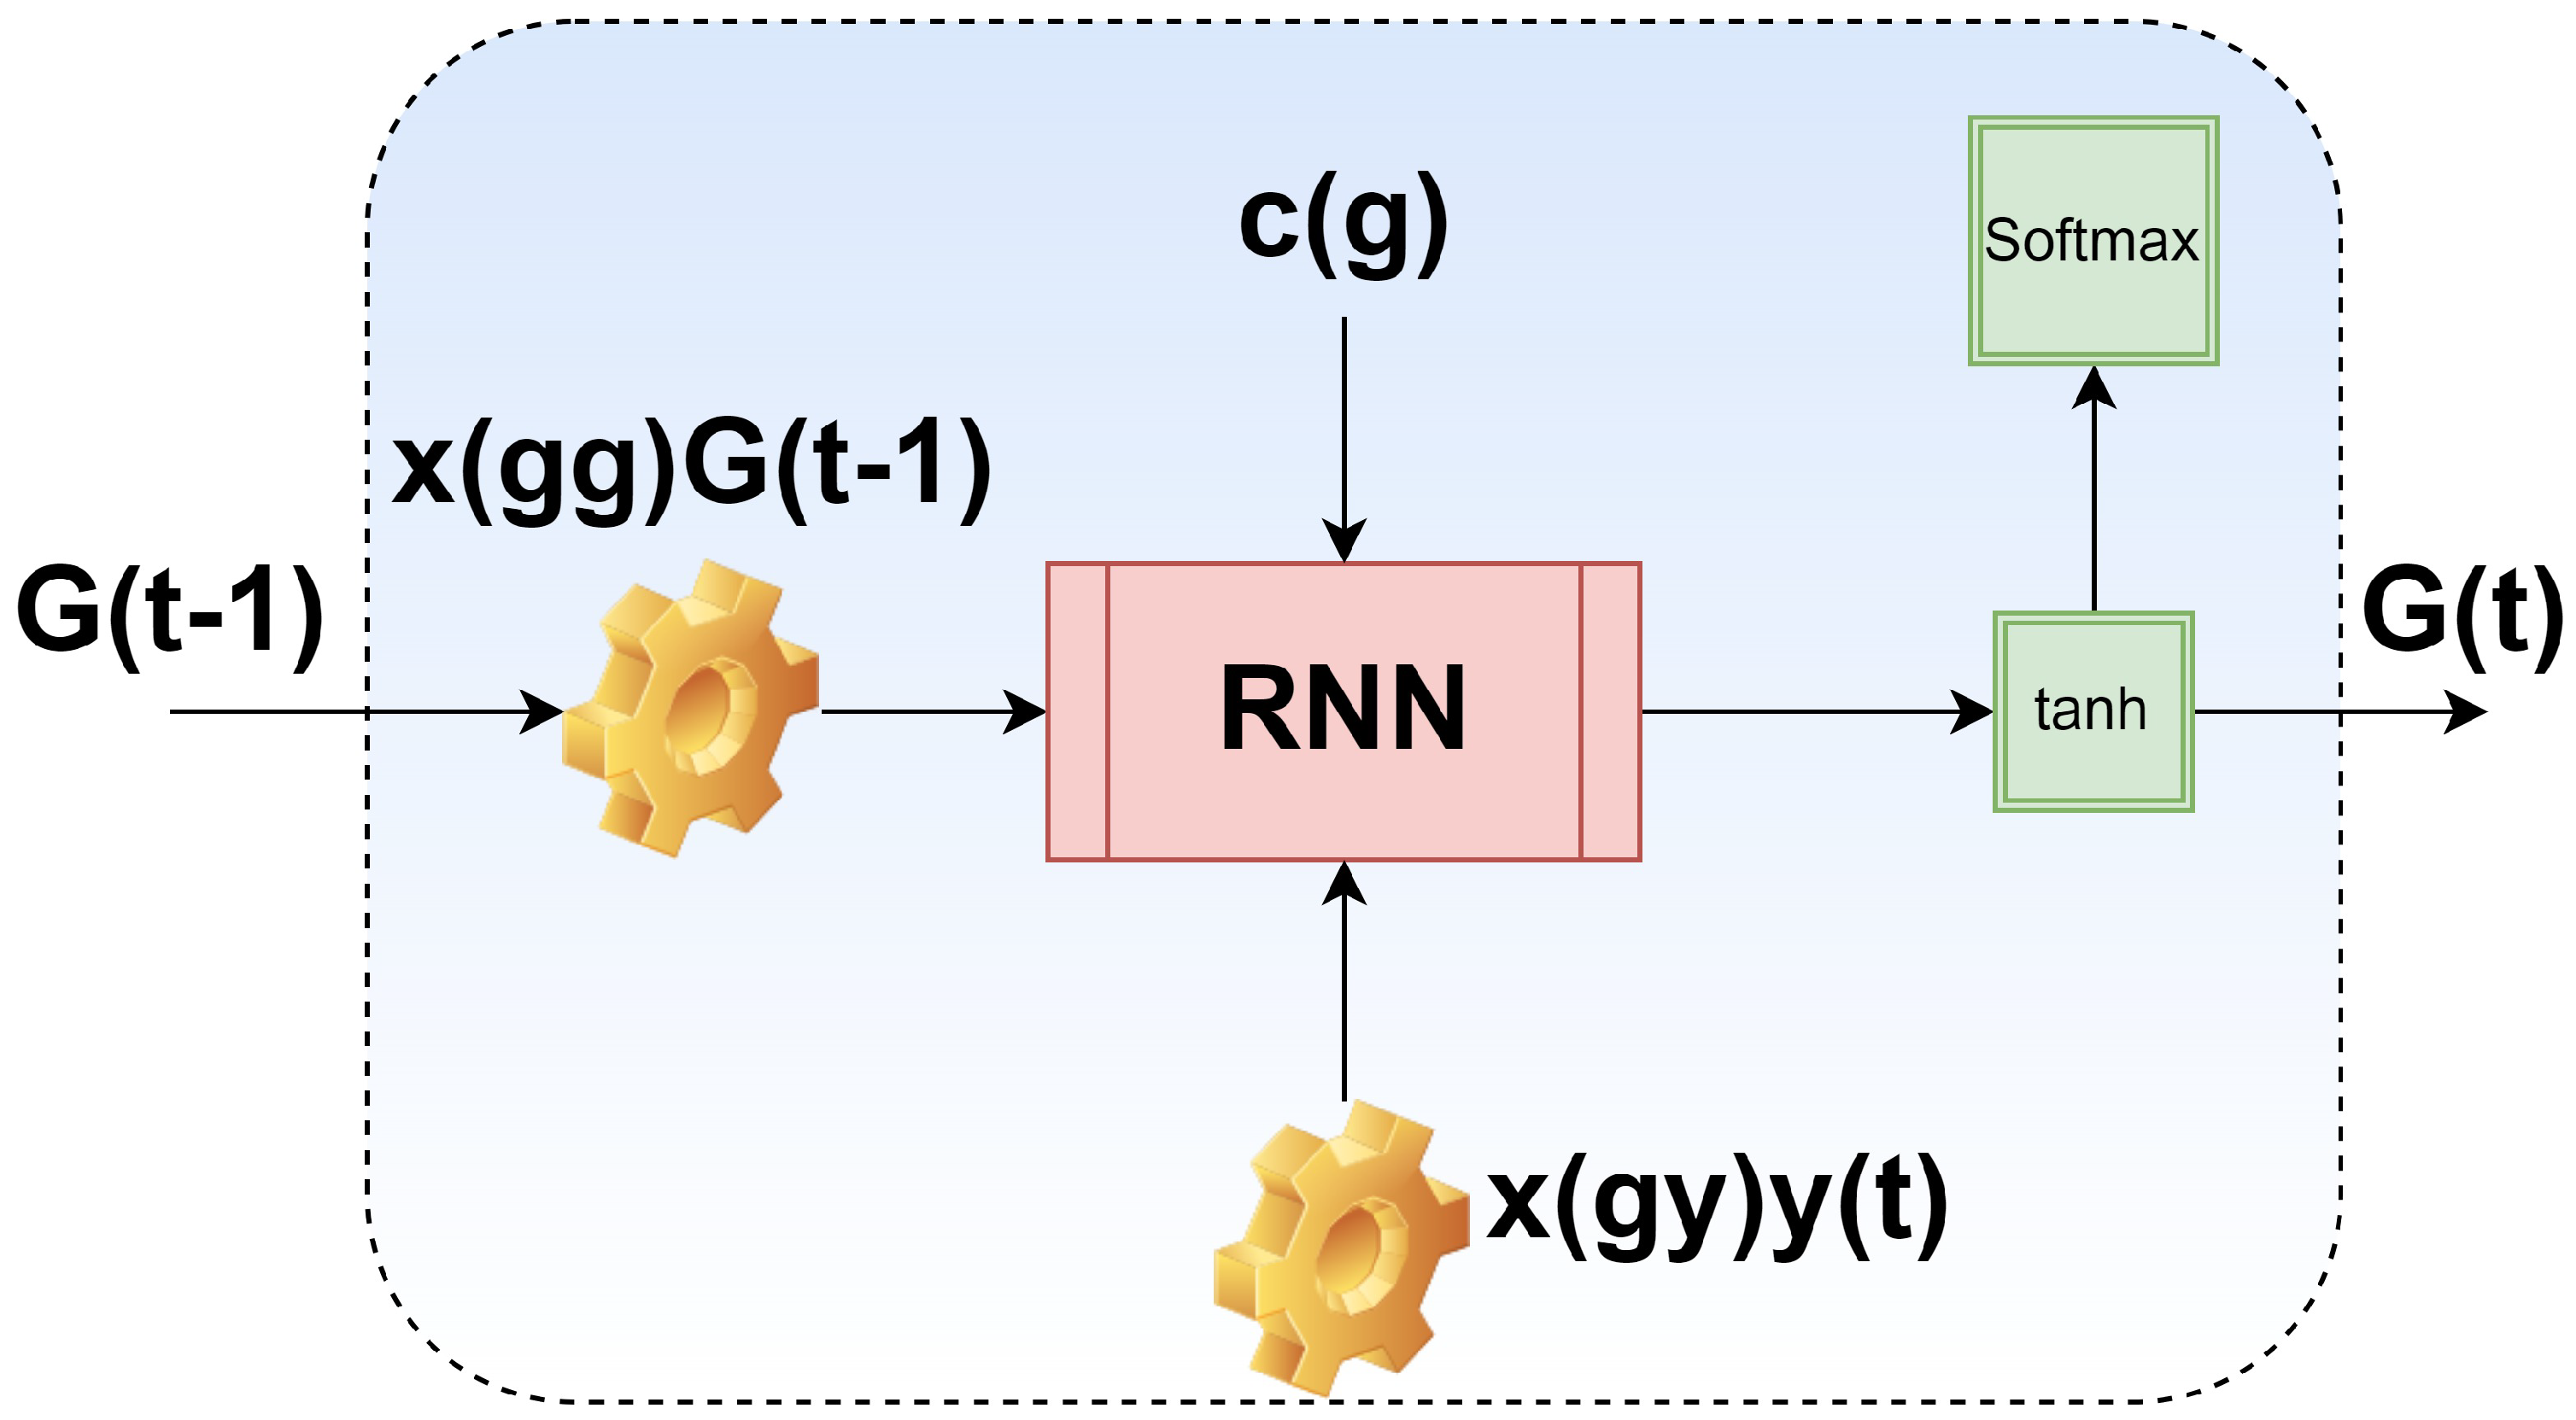
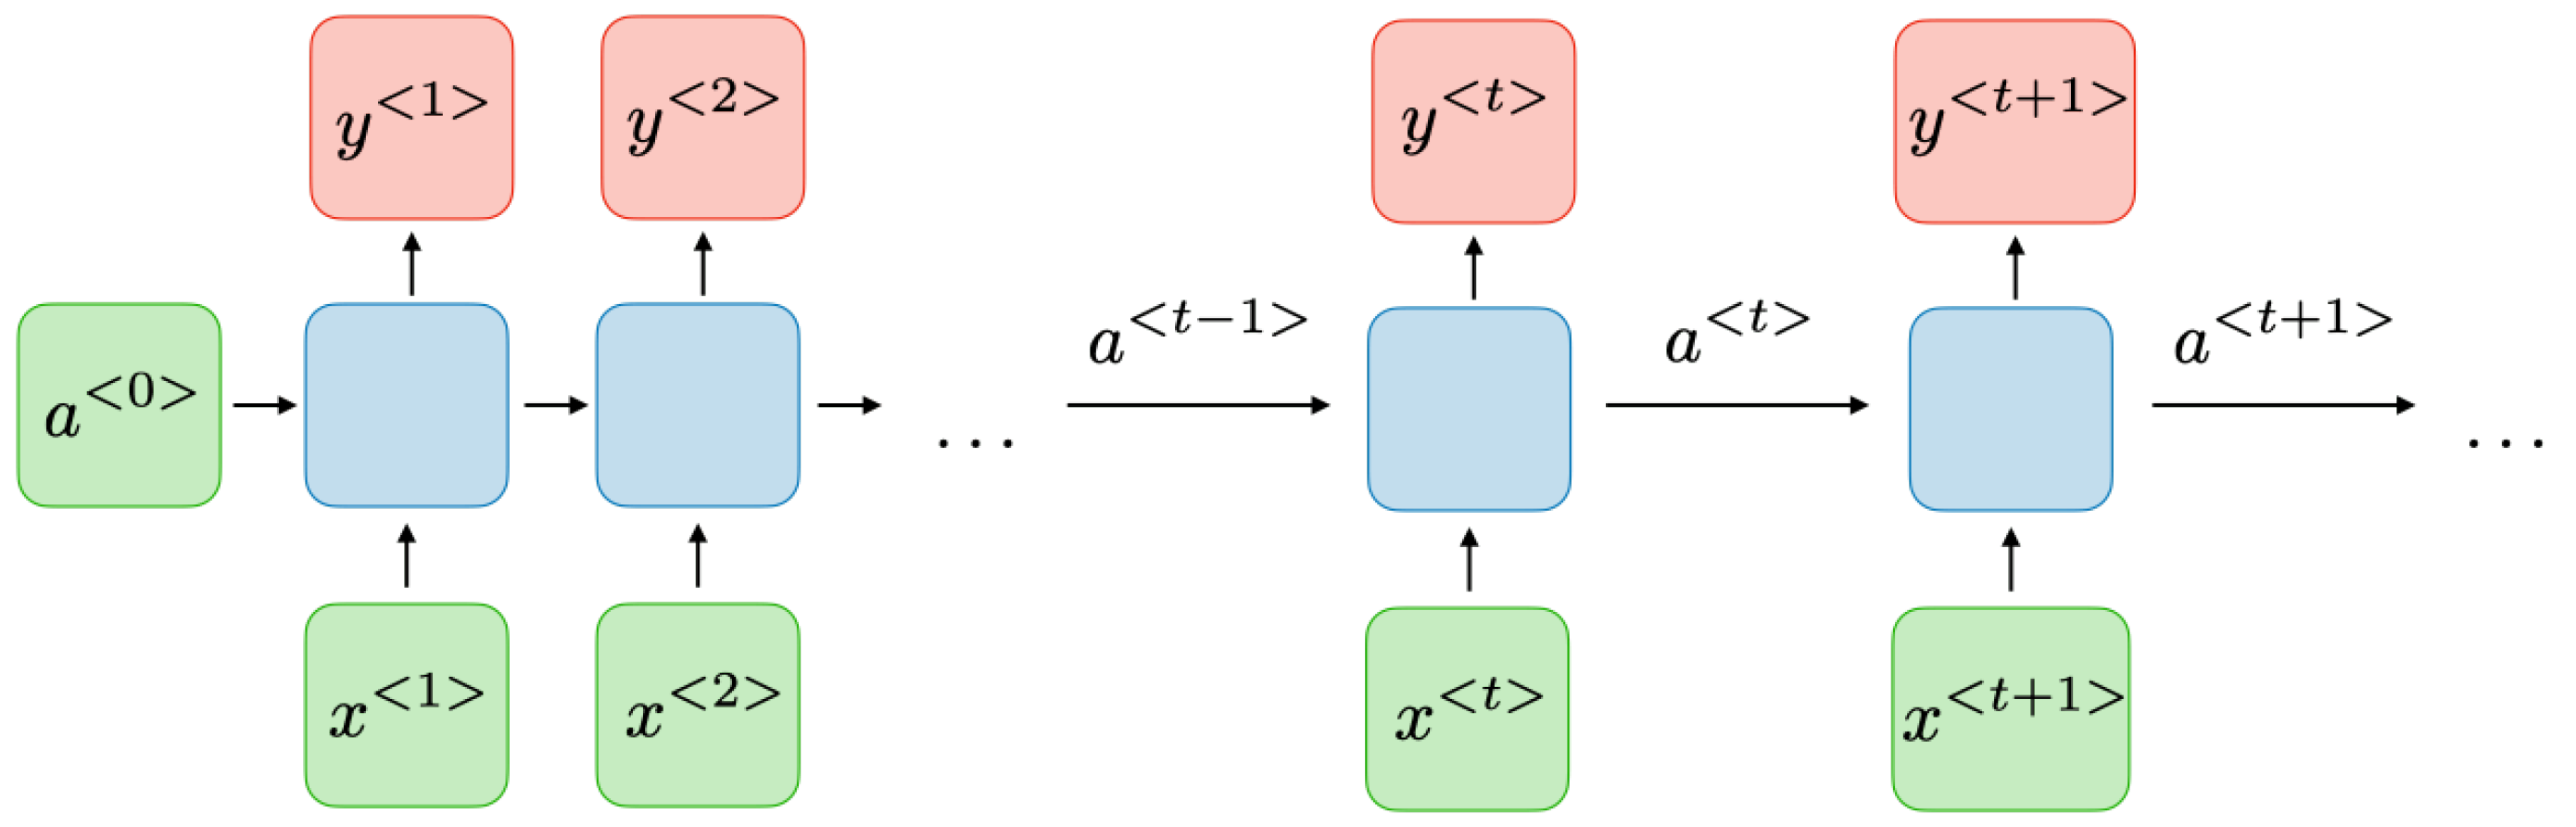
3.2. RNN
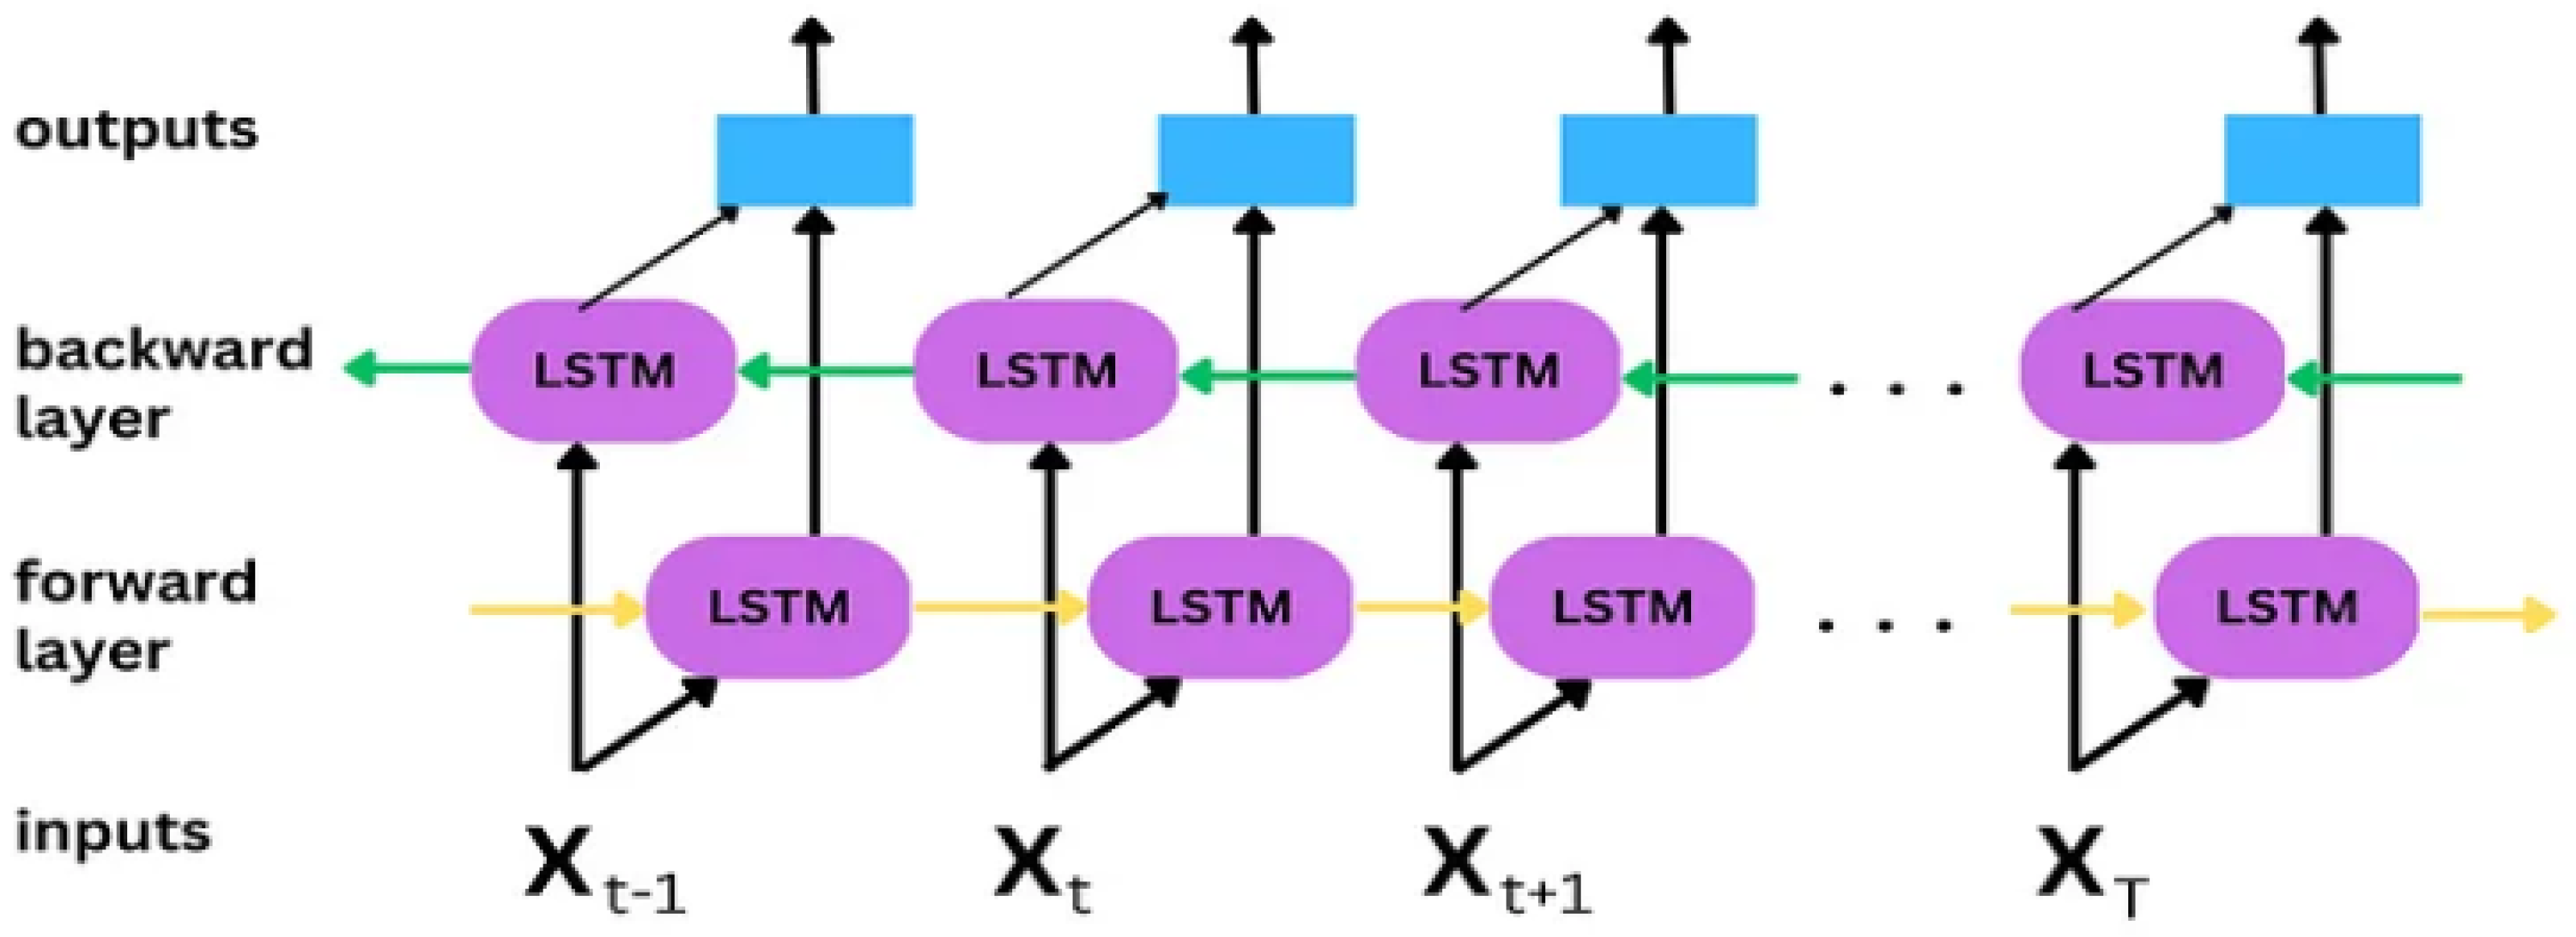
3.3. Bi-LSTM
3.4. Completion Time
4. Experimental Implementation
4.1. Conception of Experiments
4.2. Dataset
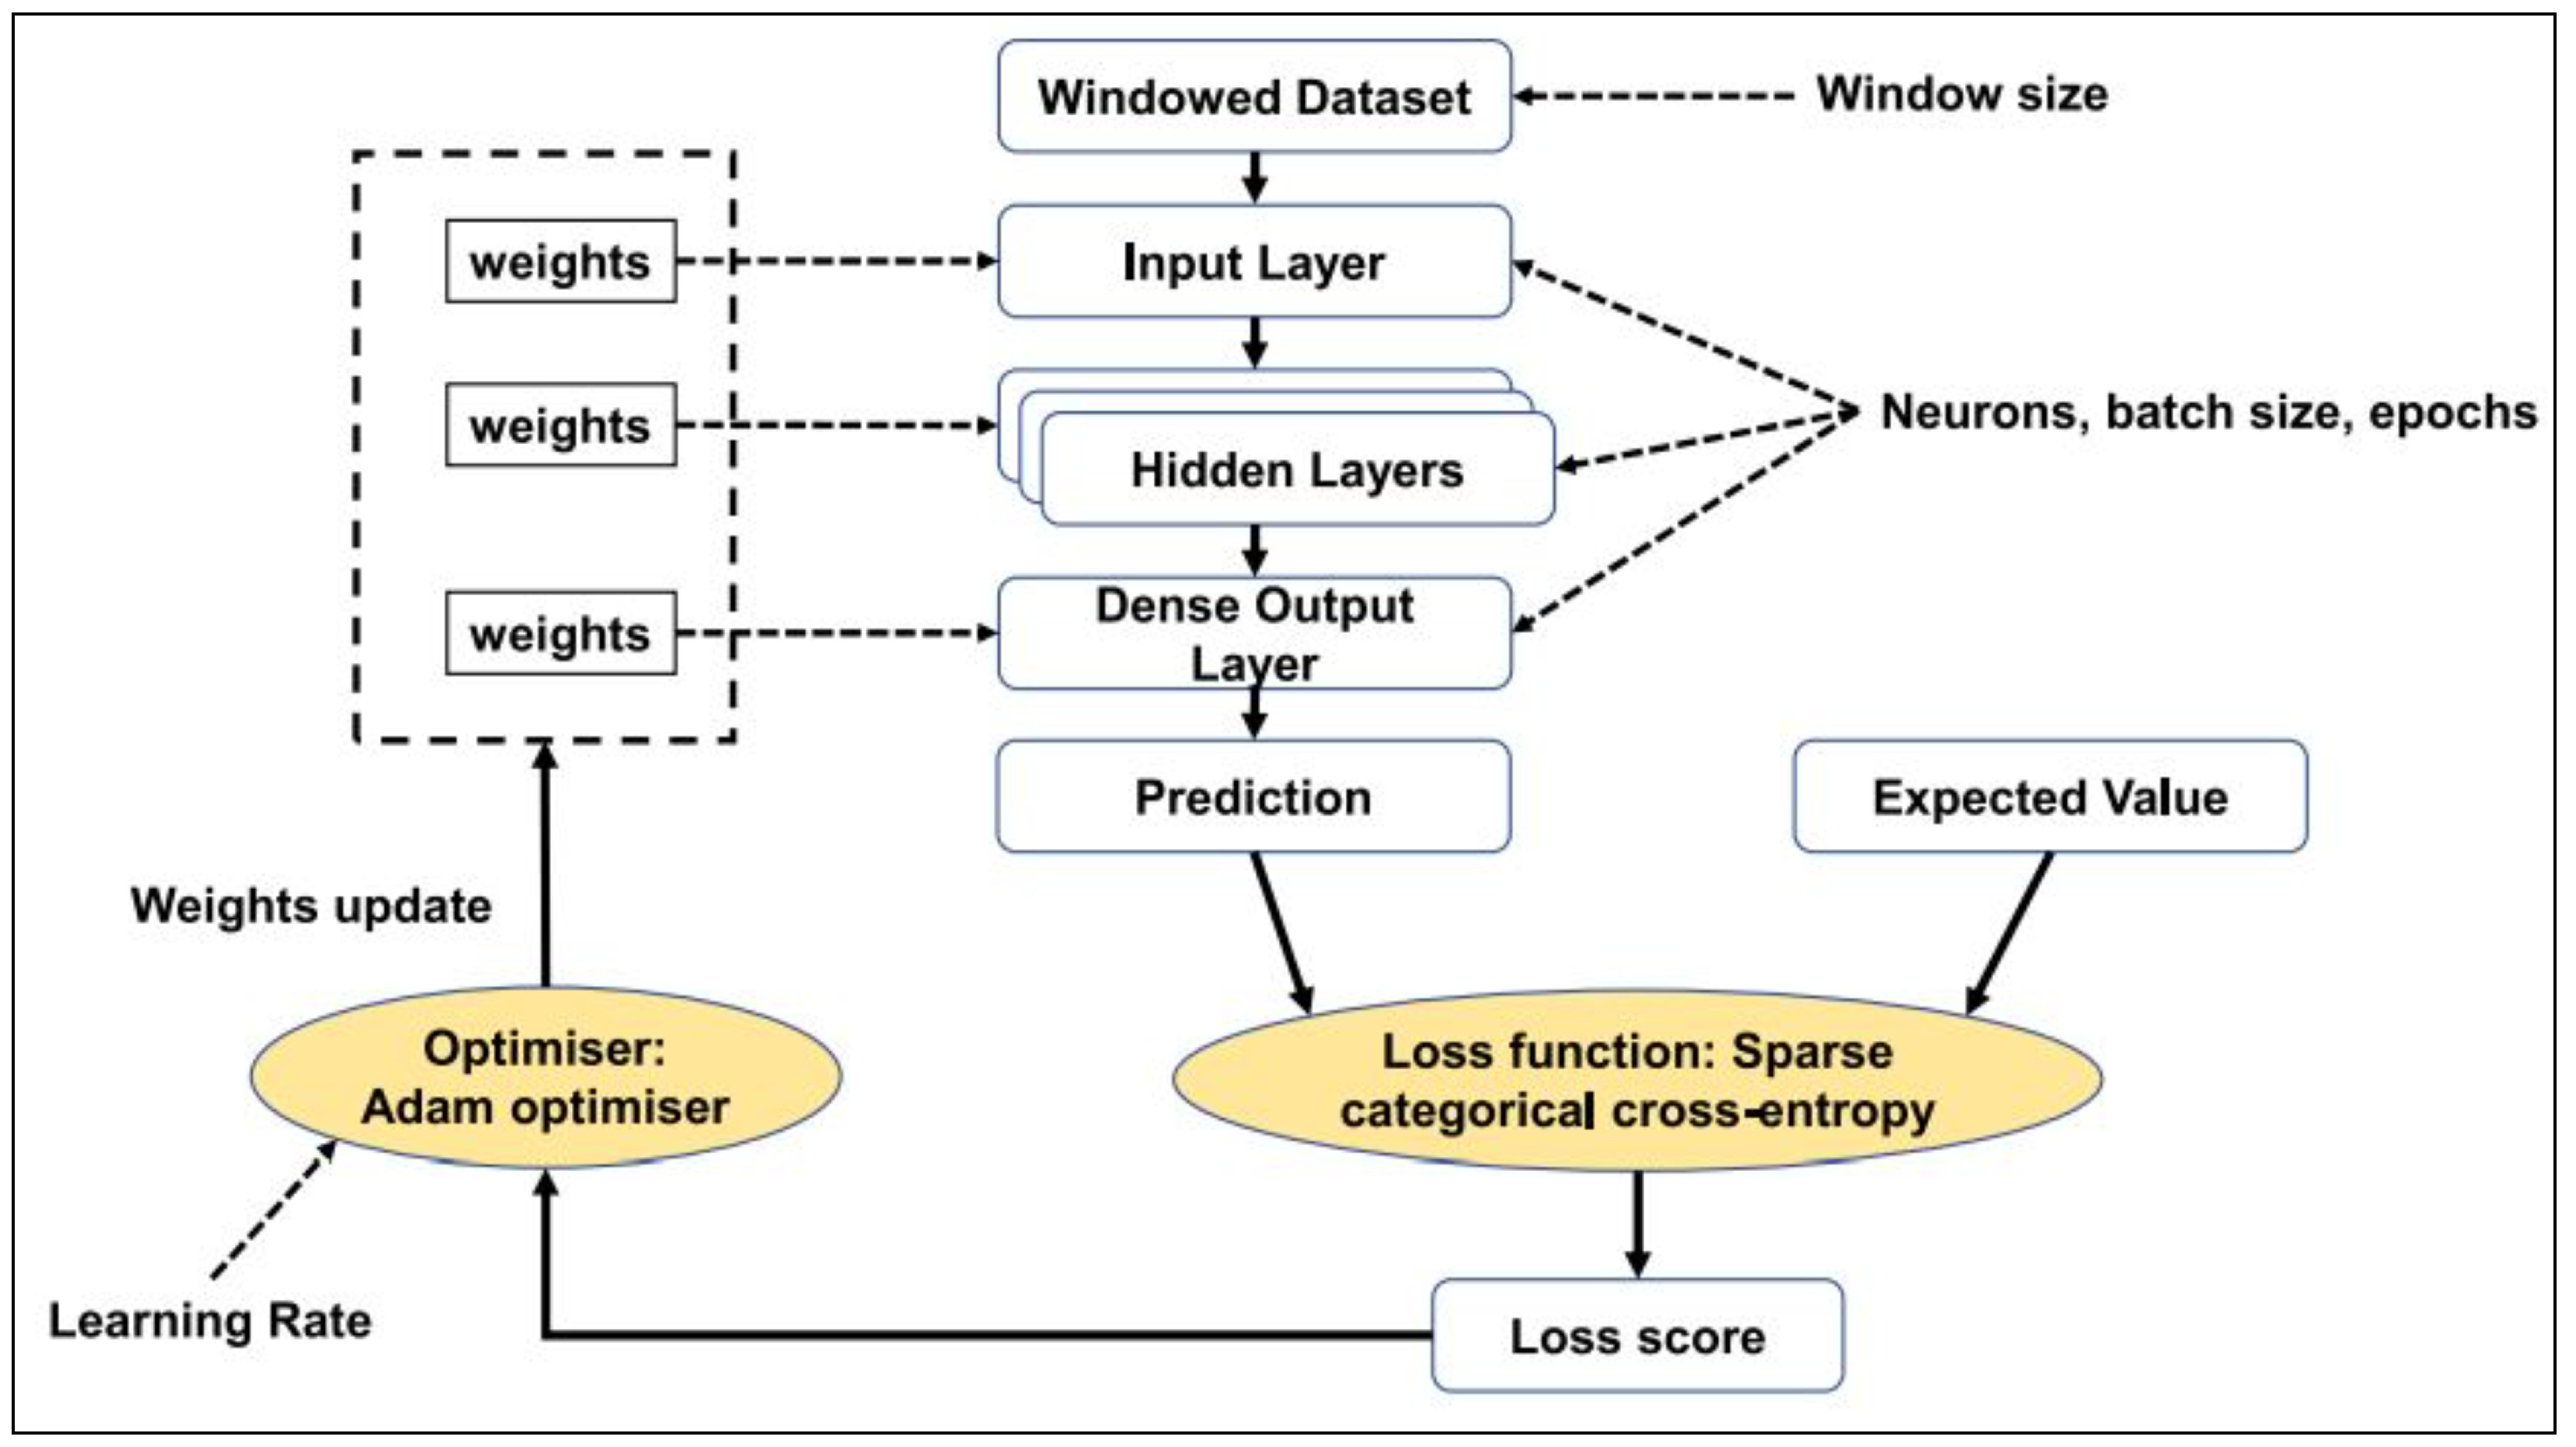
4.3. Model Formulation
4.4. Adjusting Hyper-Attributes
4.5. Evaluation of Outcomes
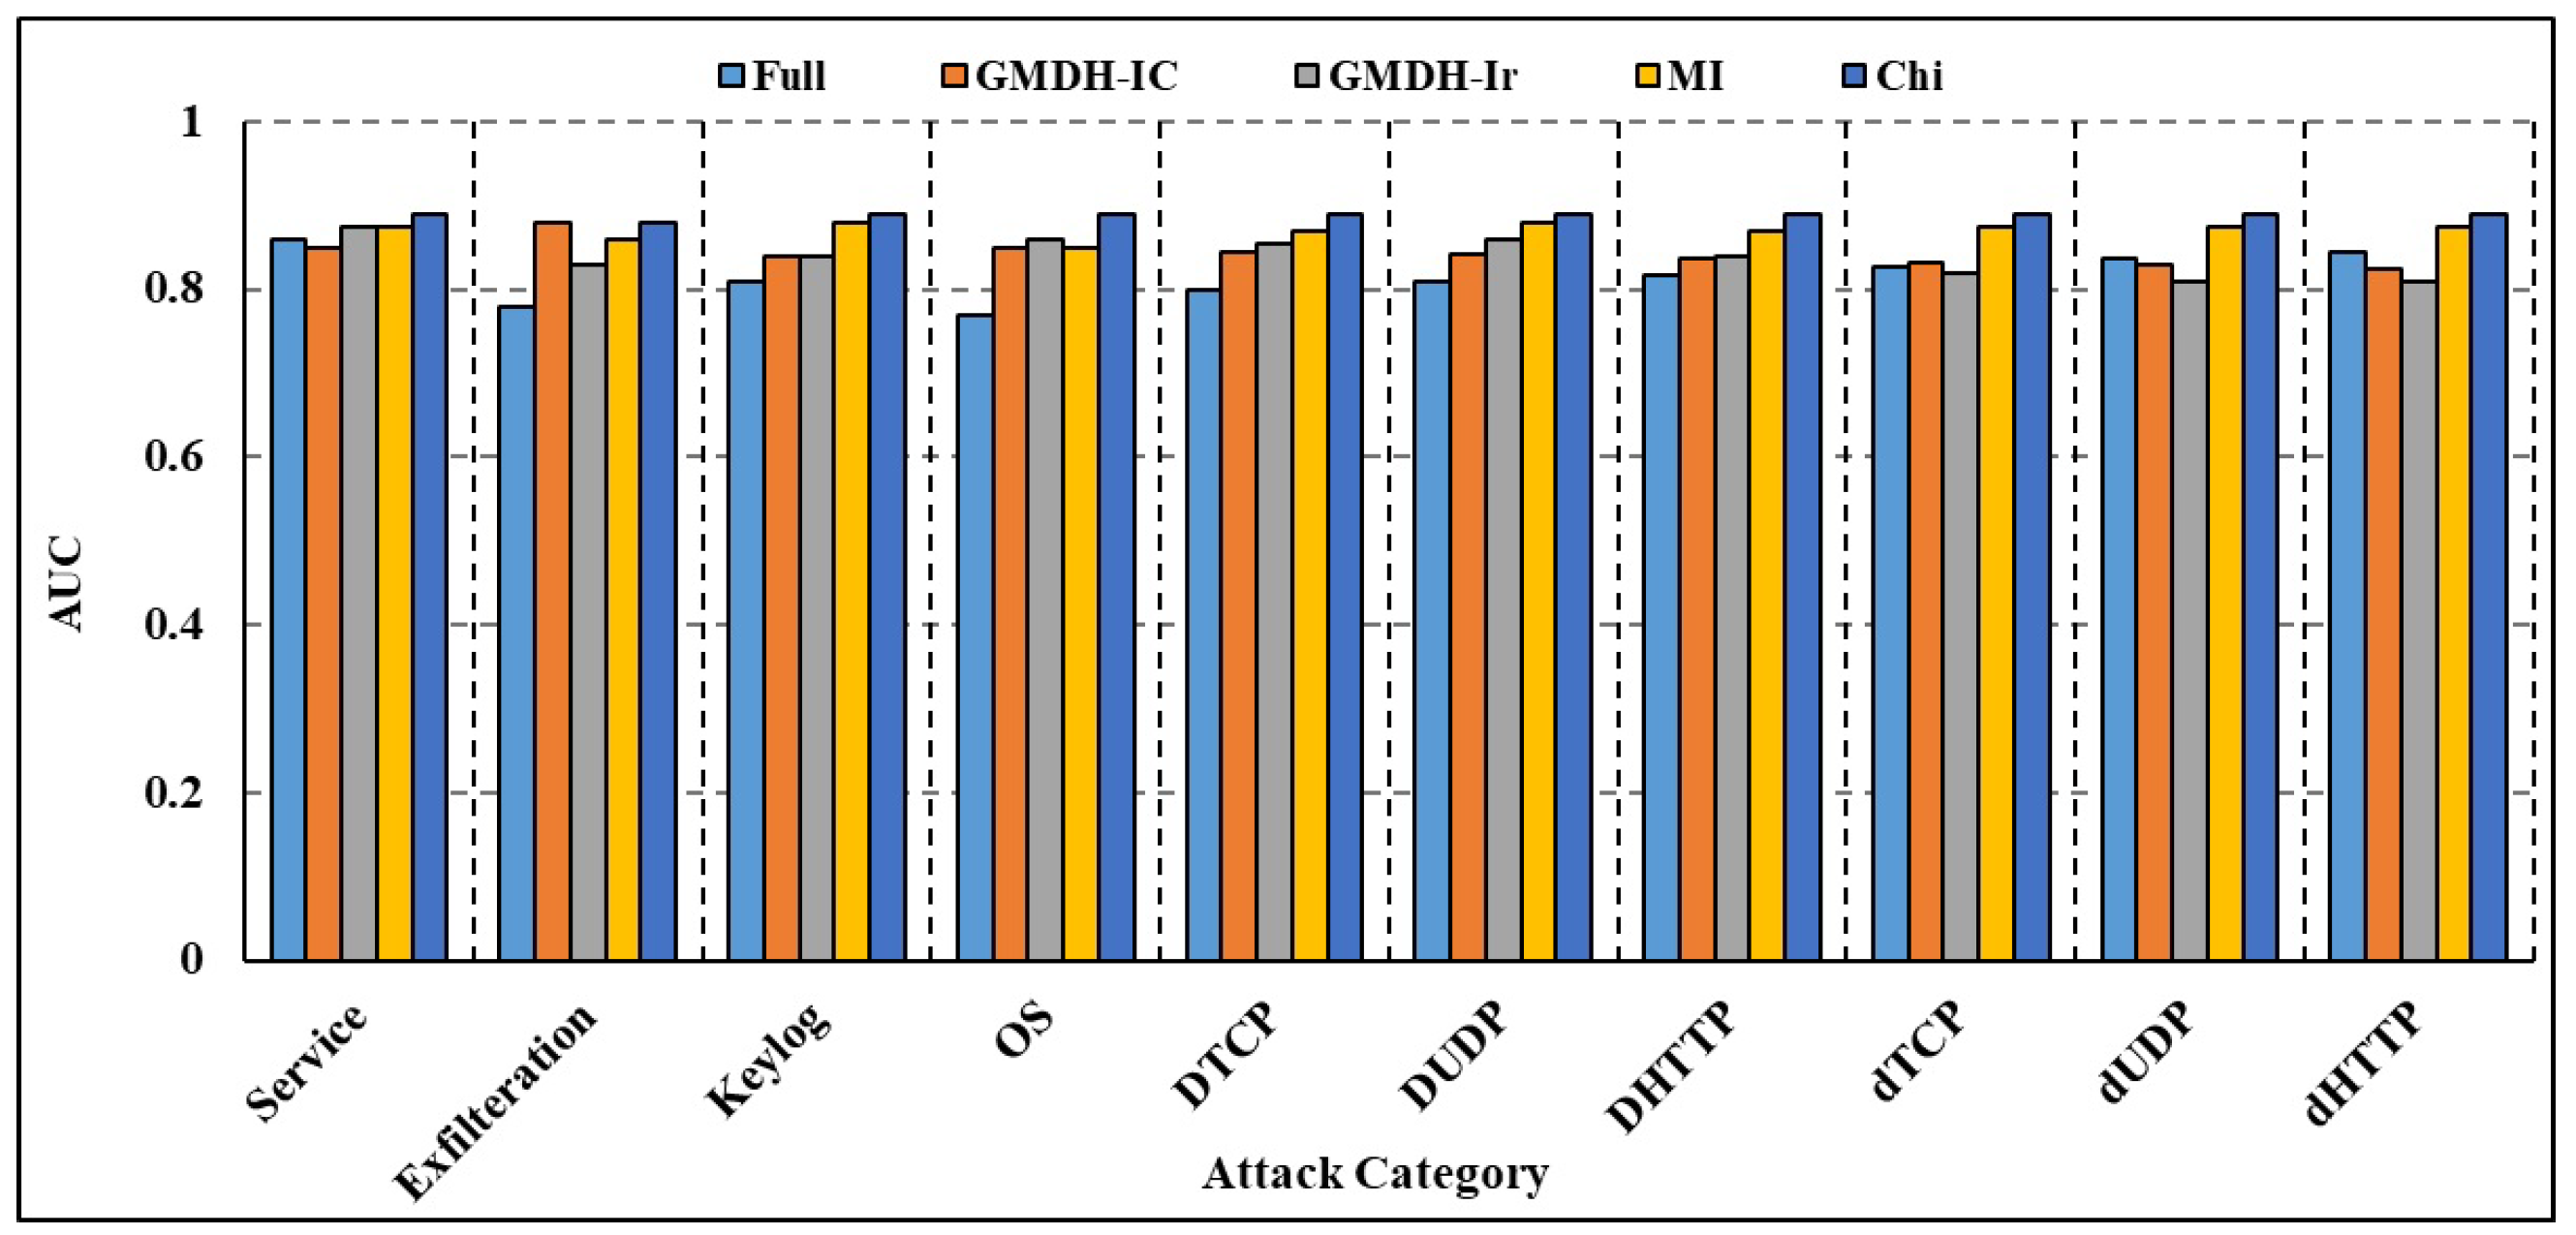
4.5.1. Data Reduction and Attribute Selection
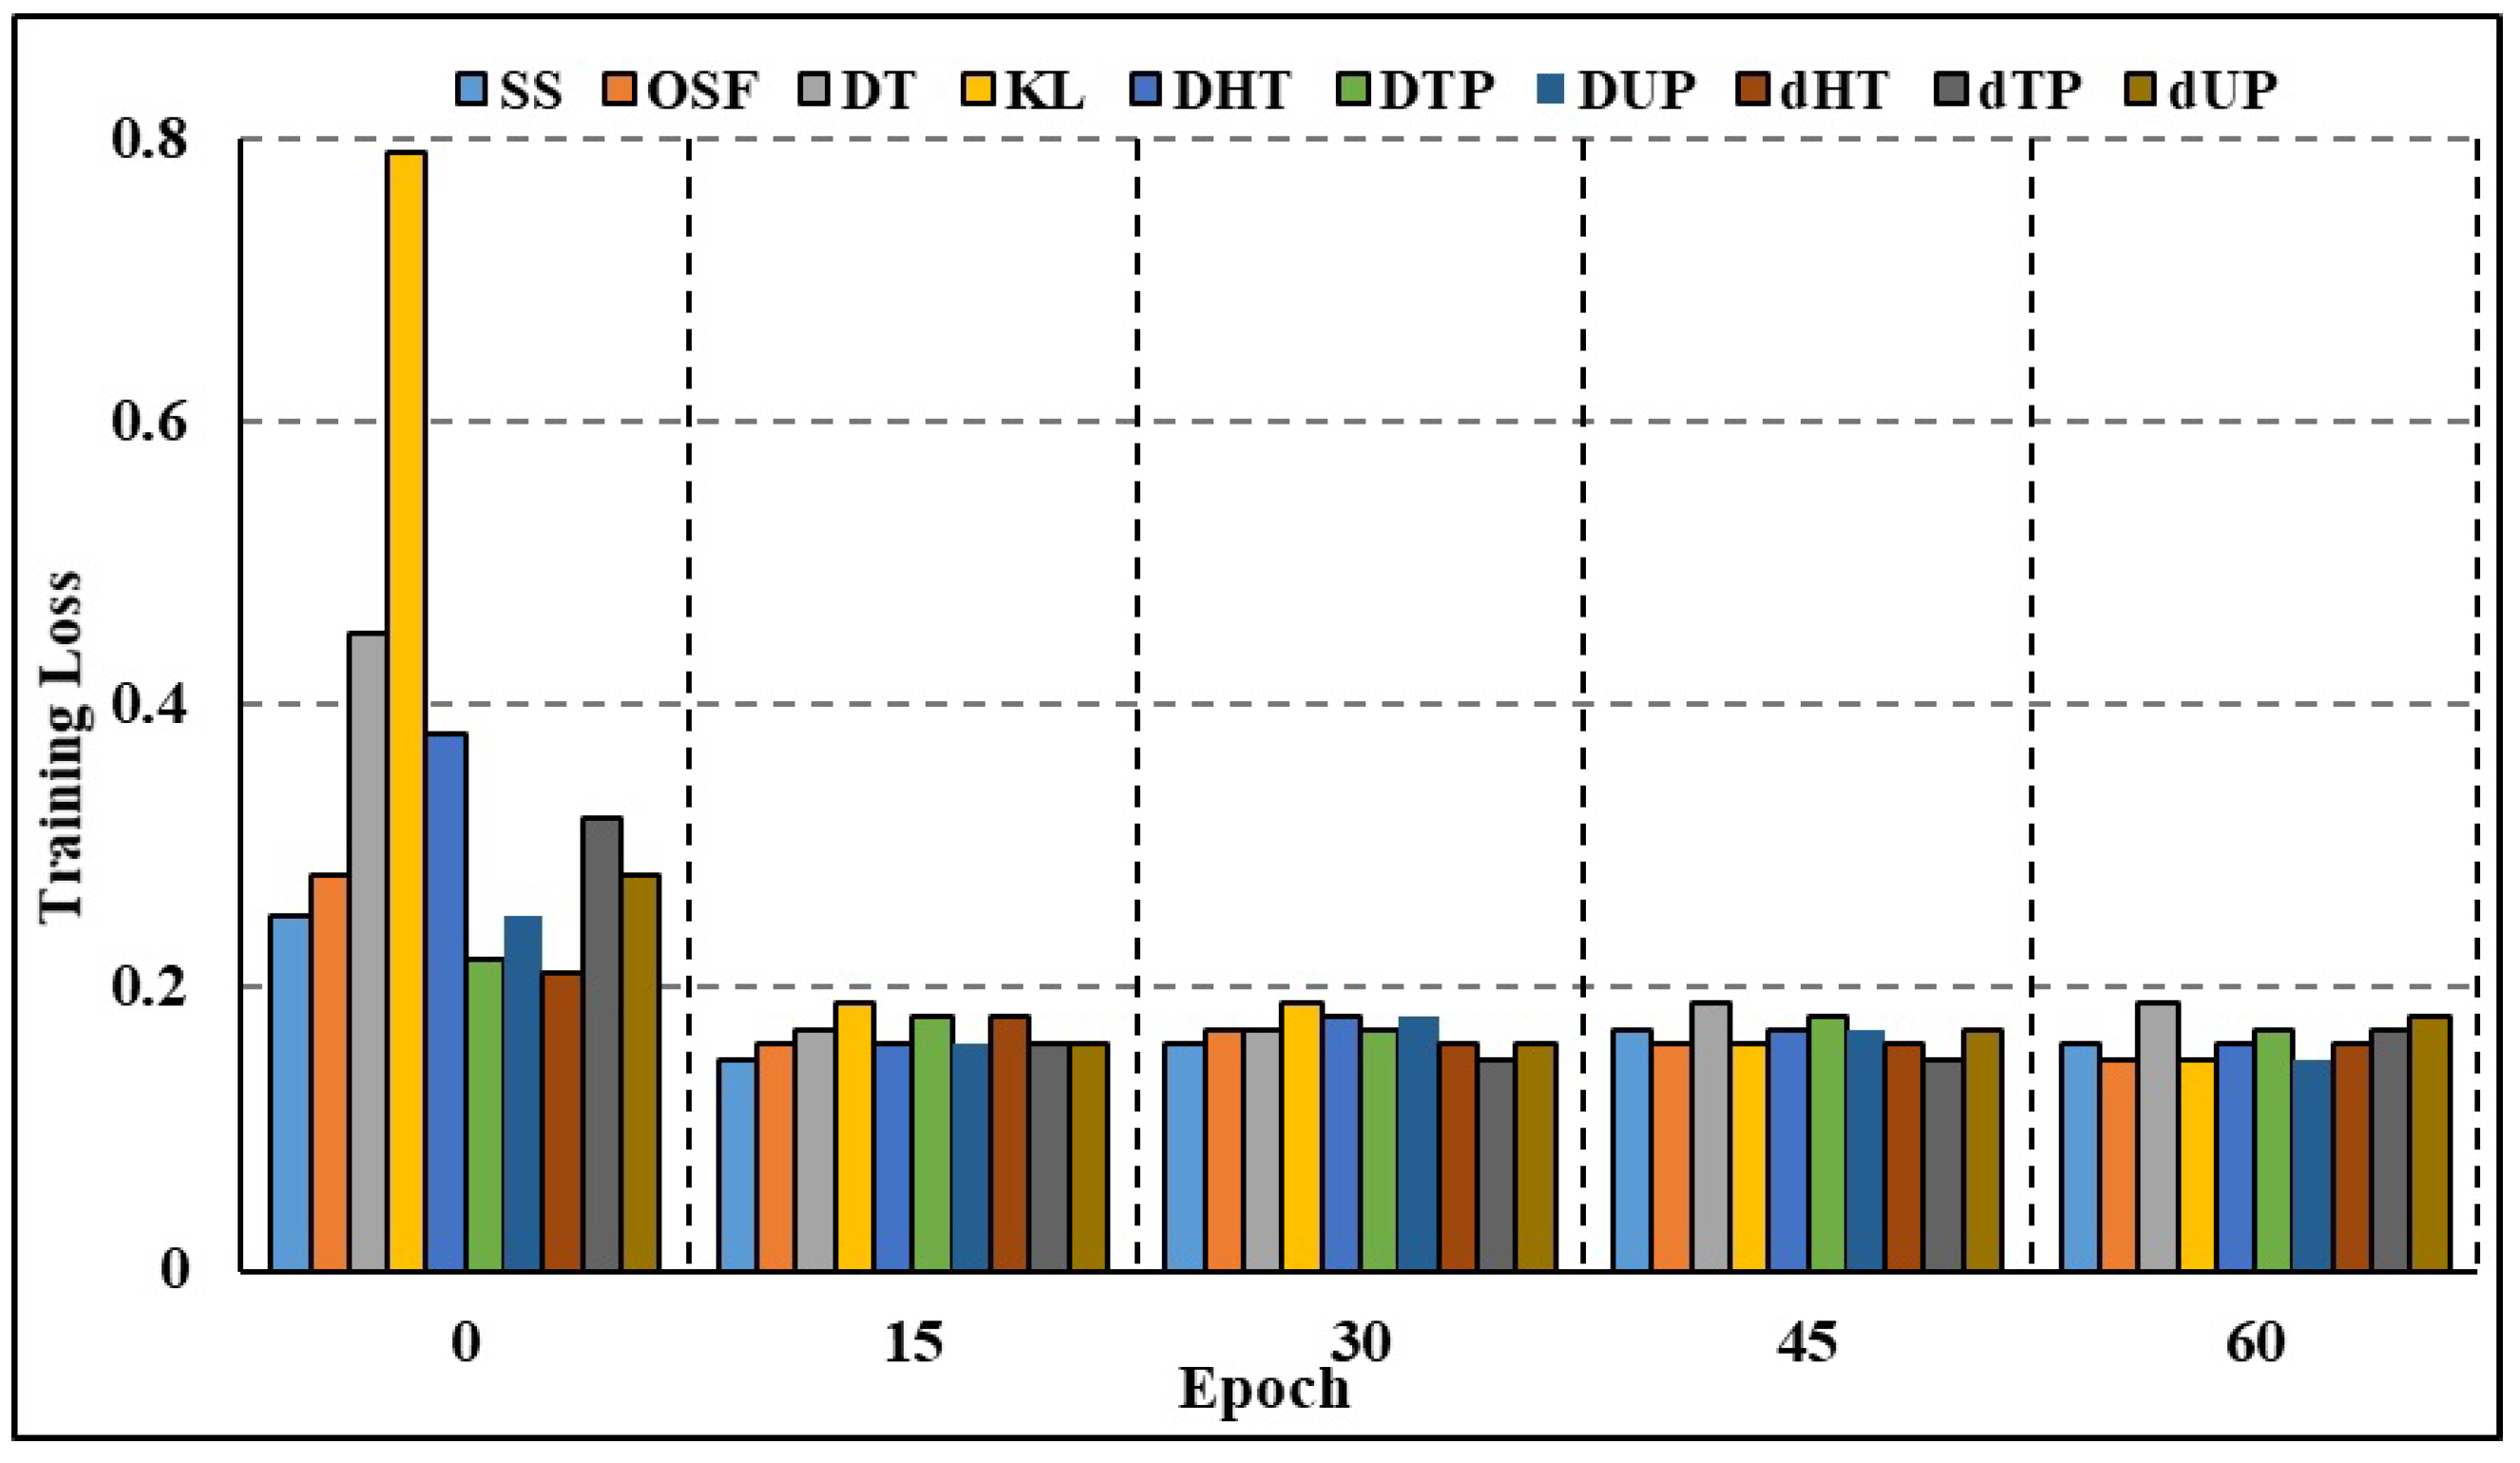
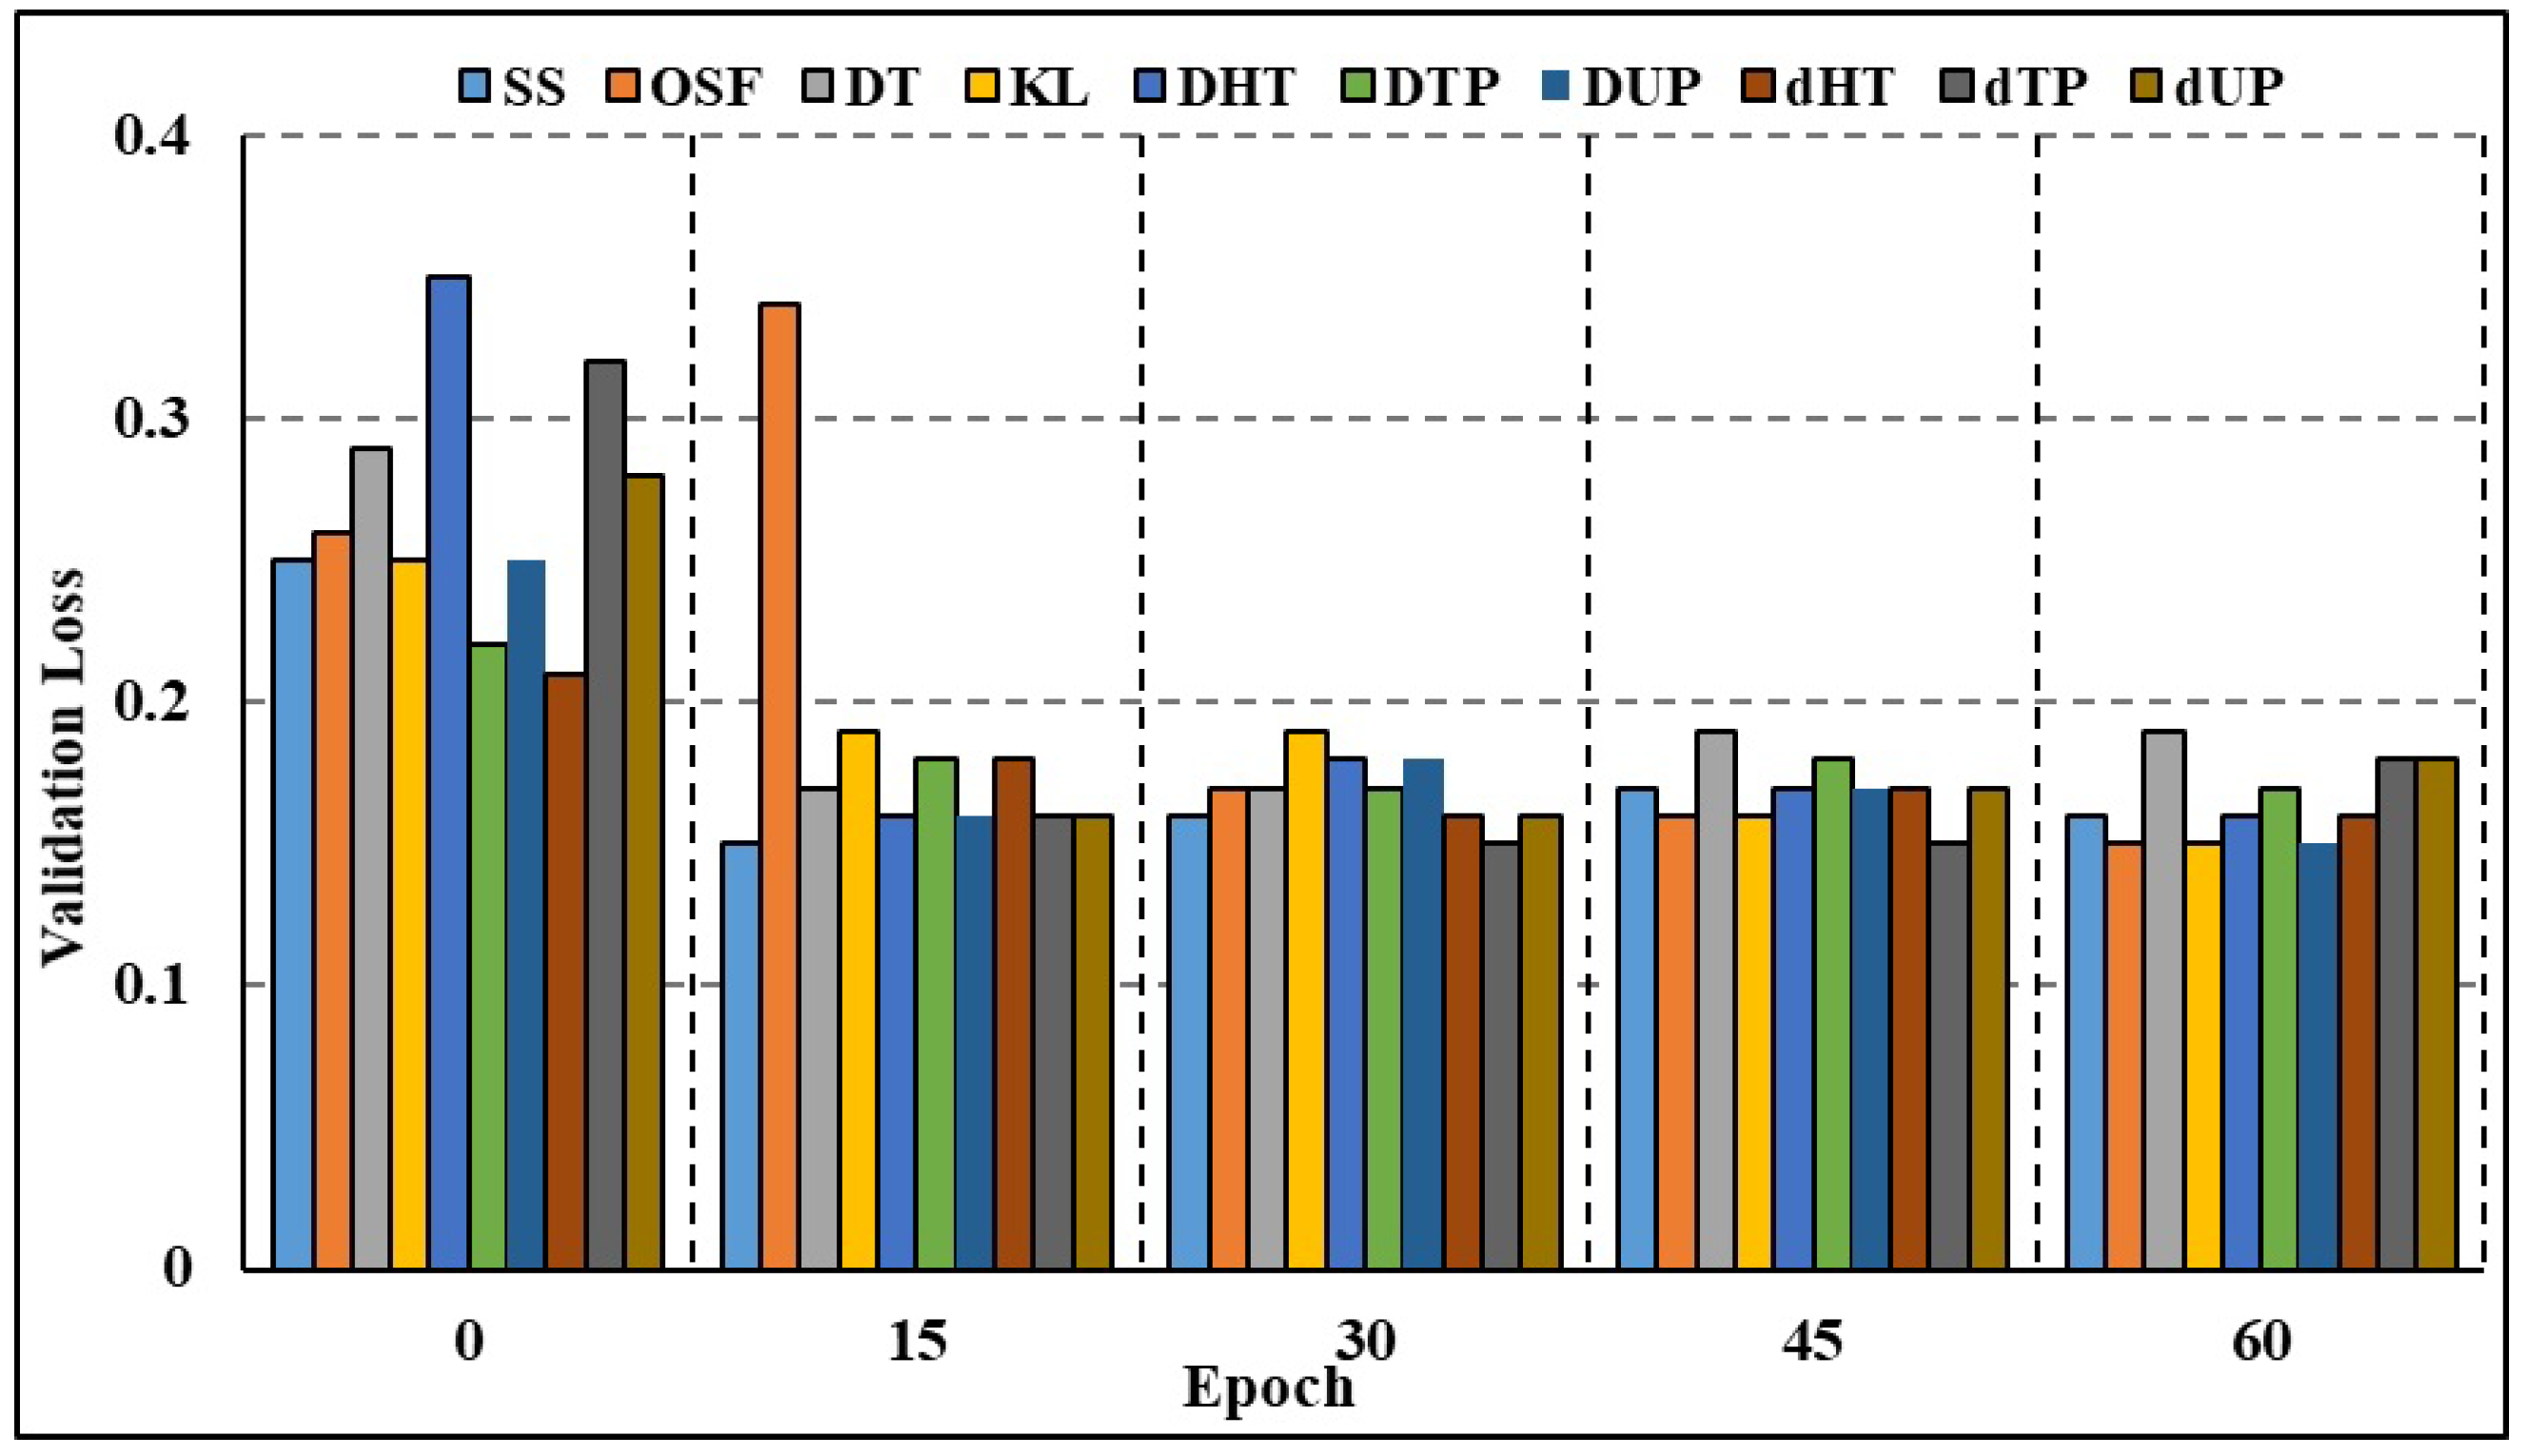
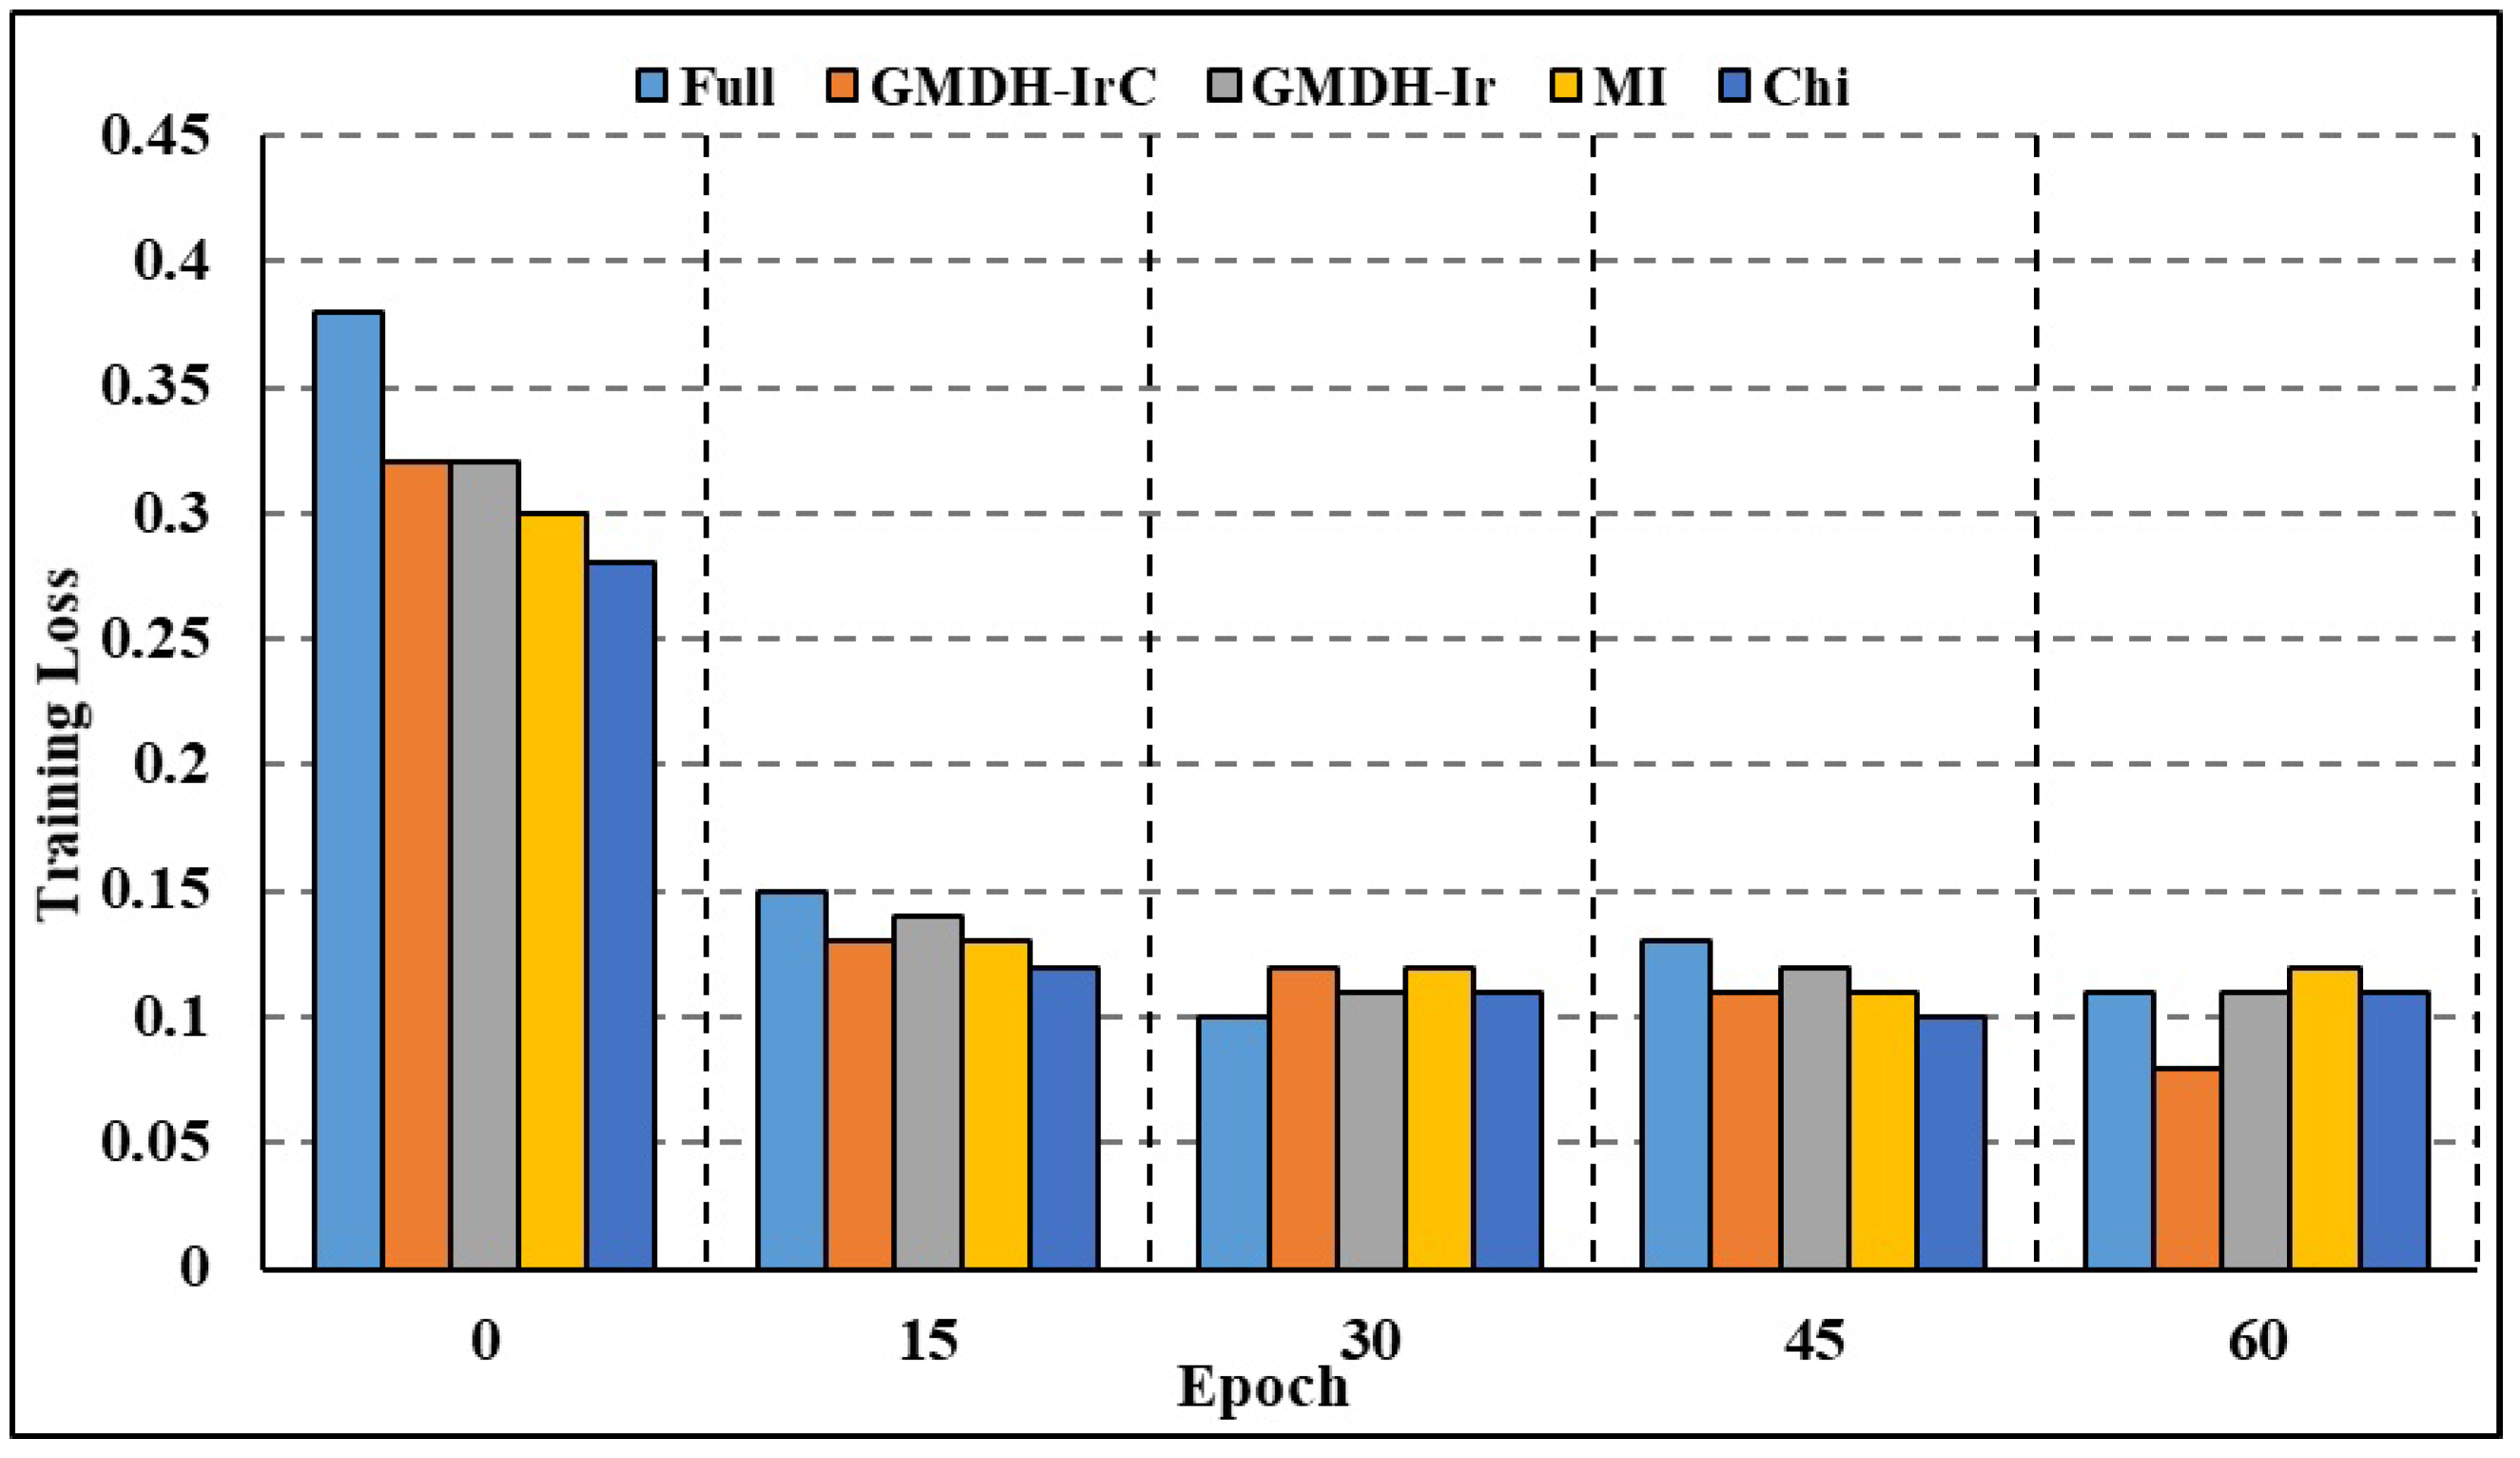
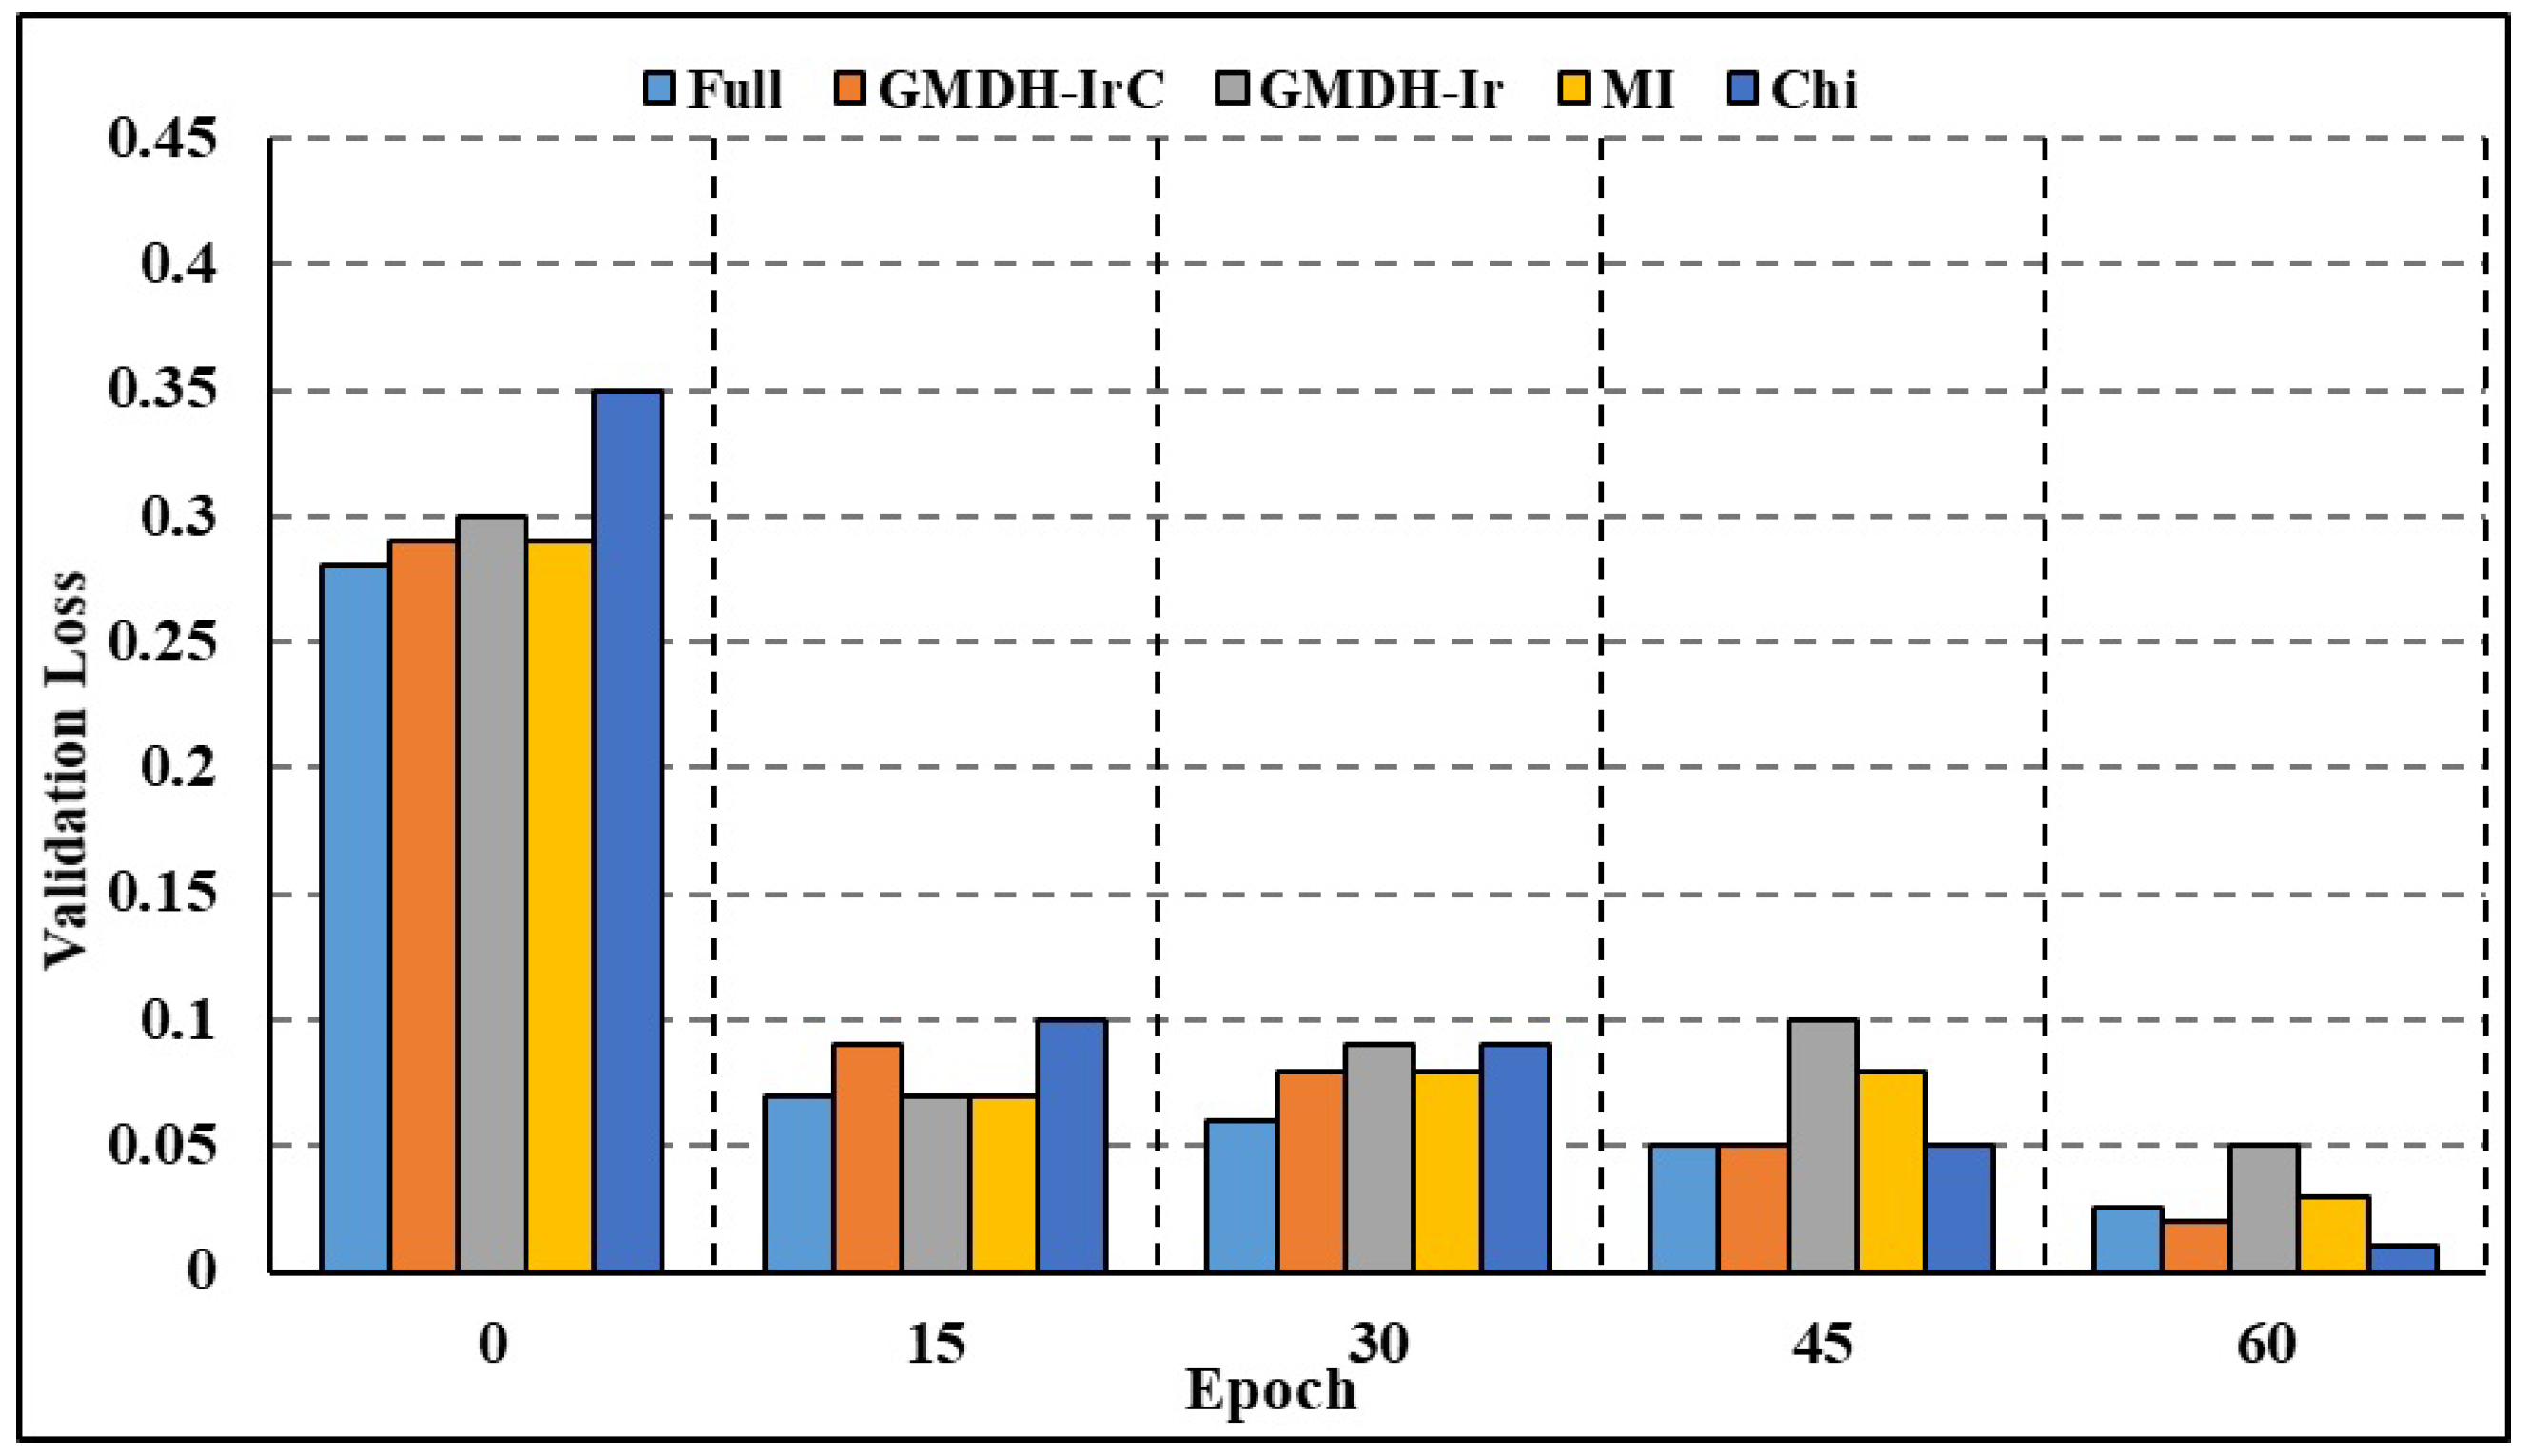
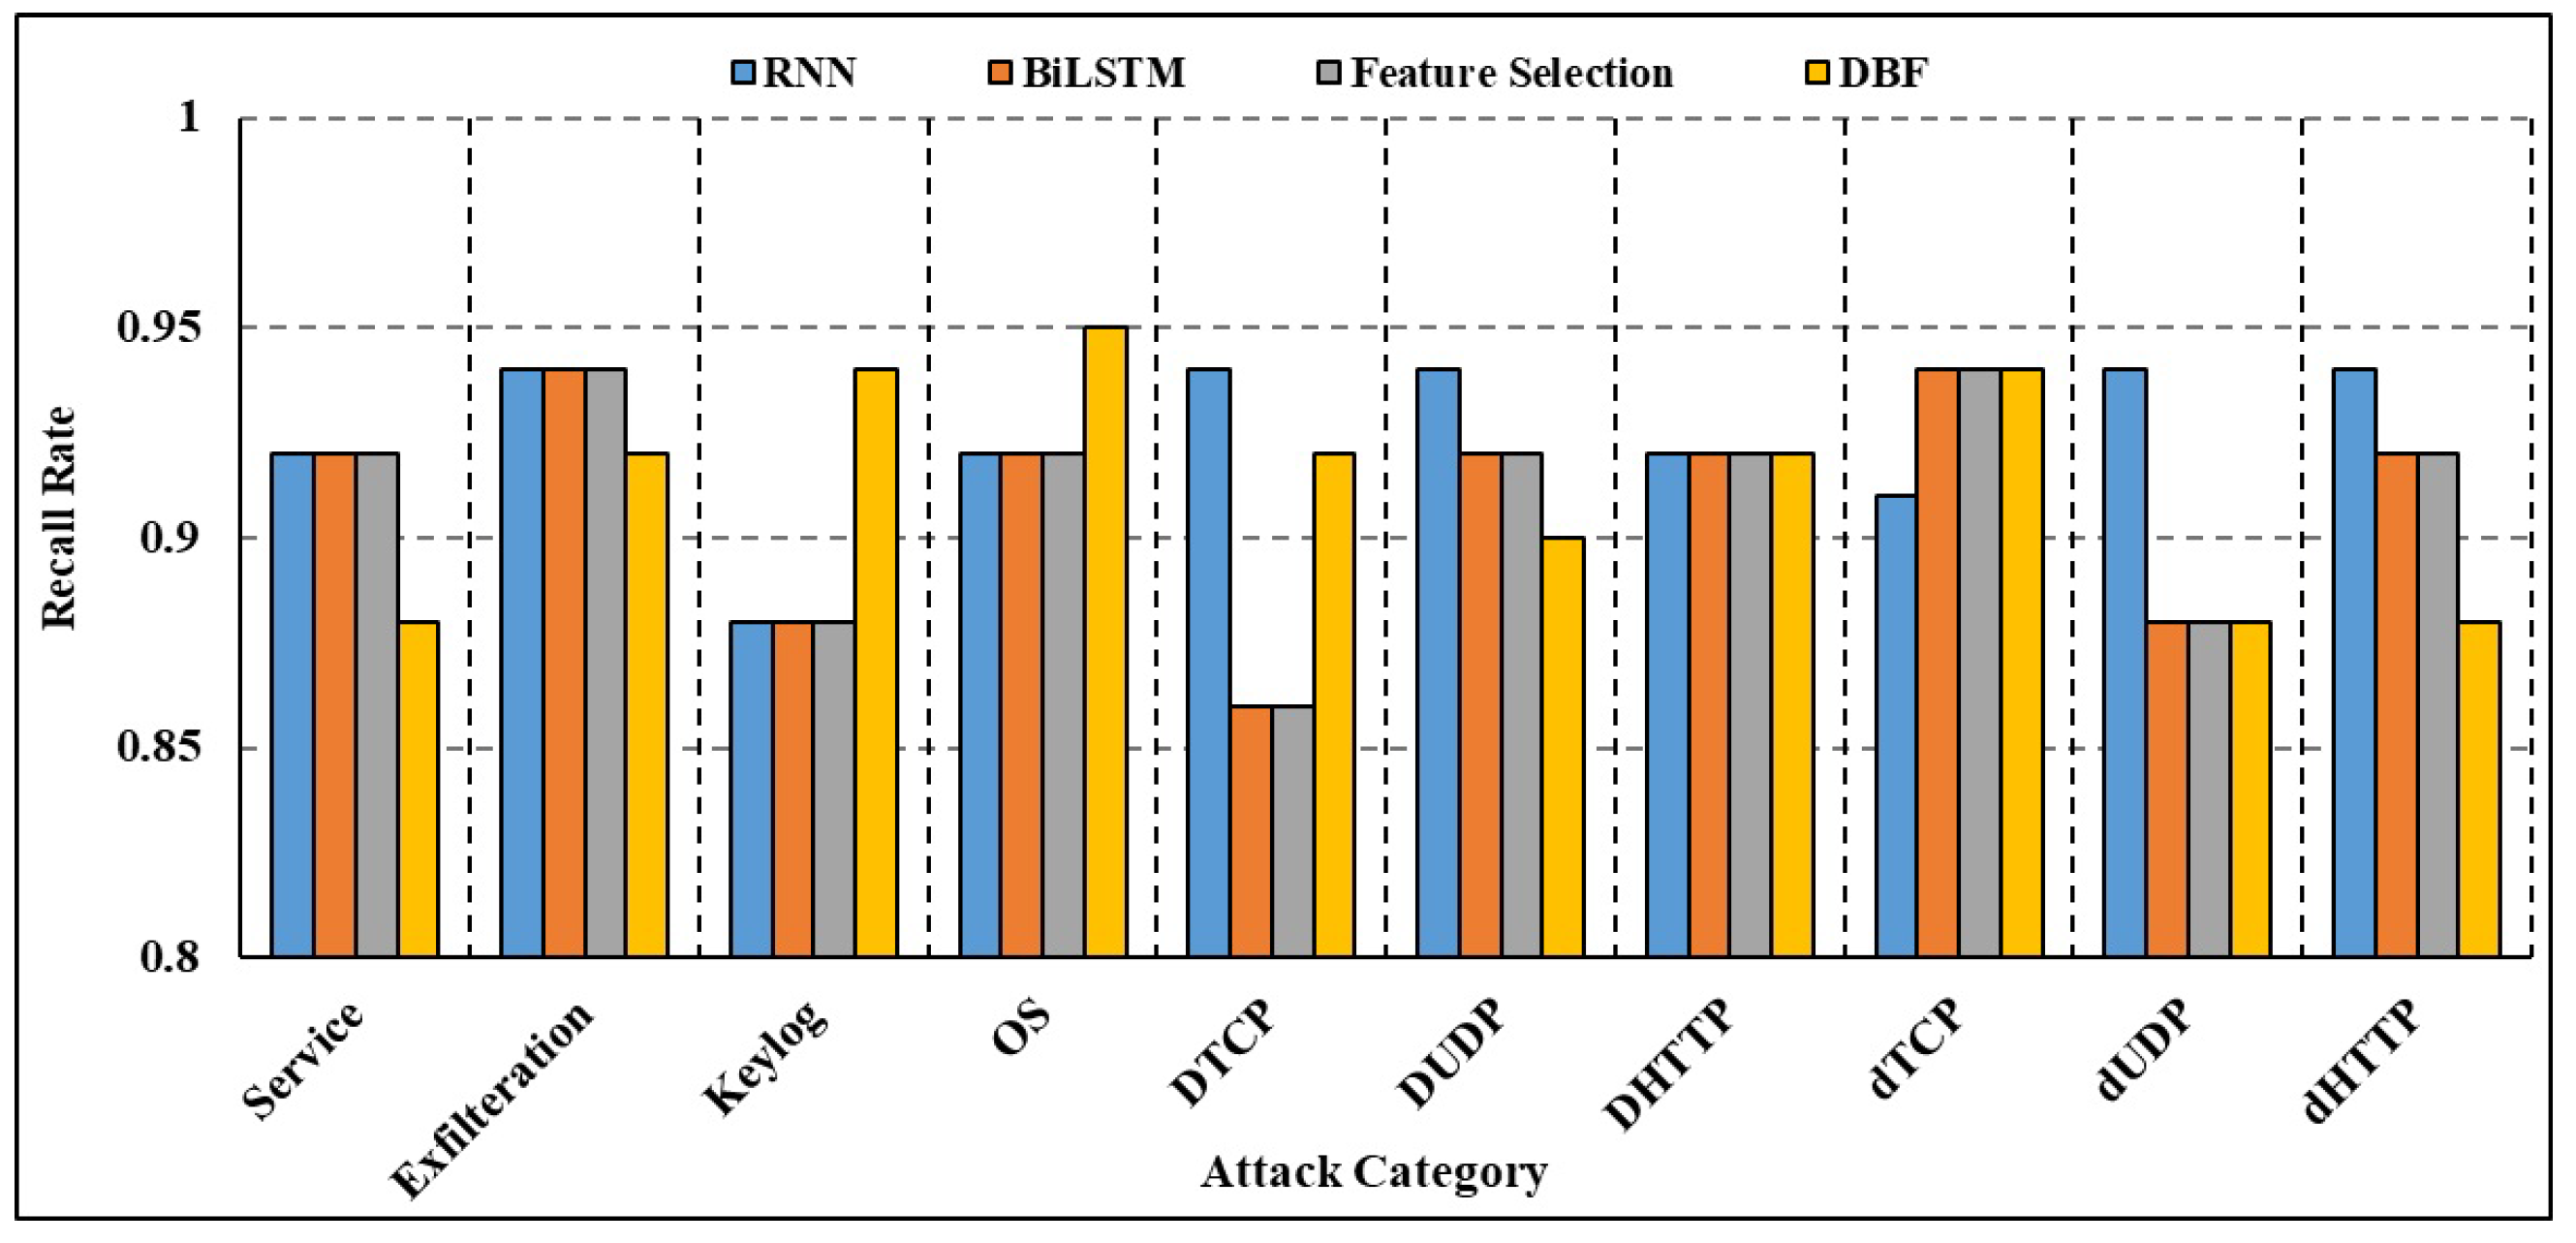
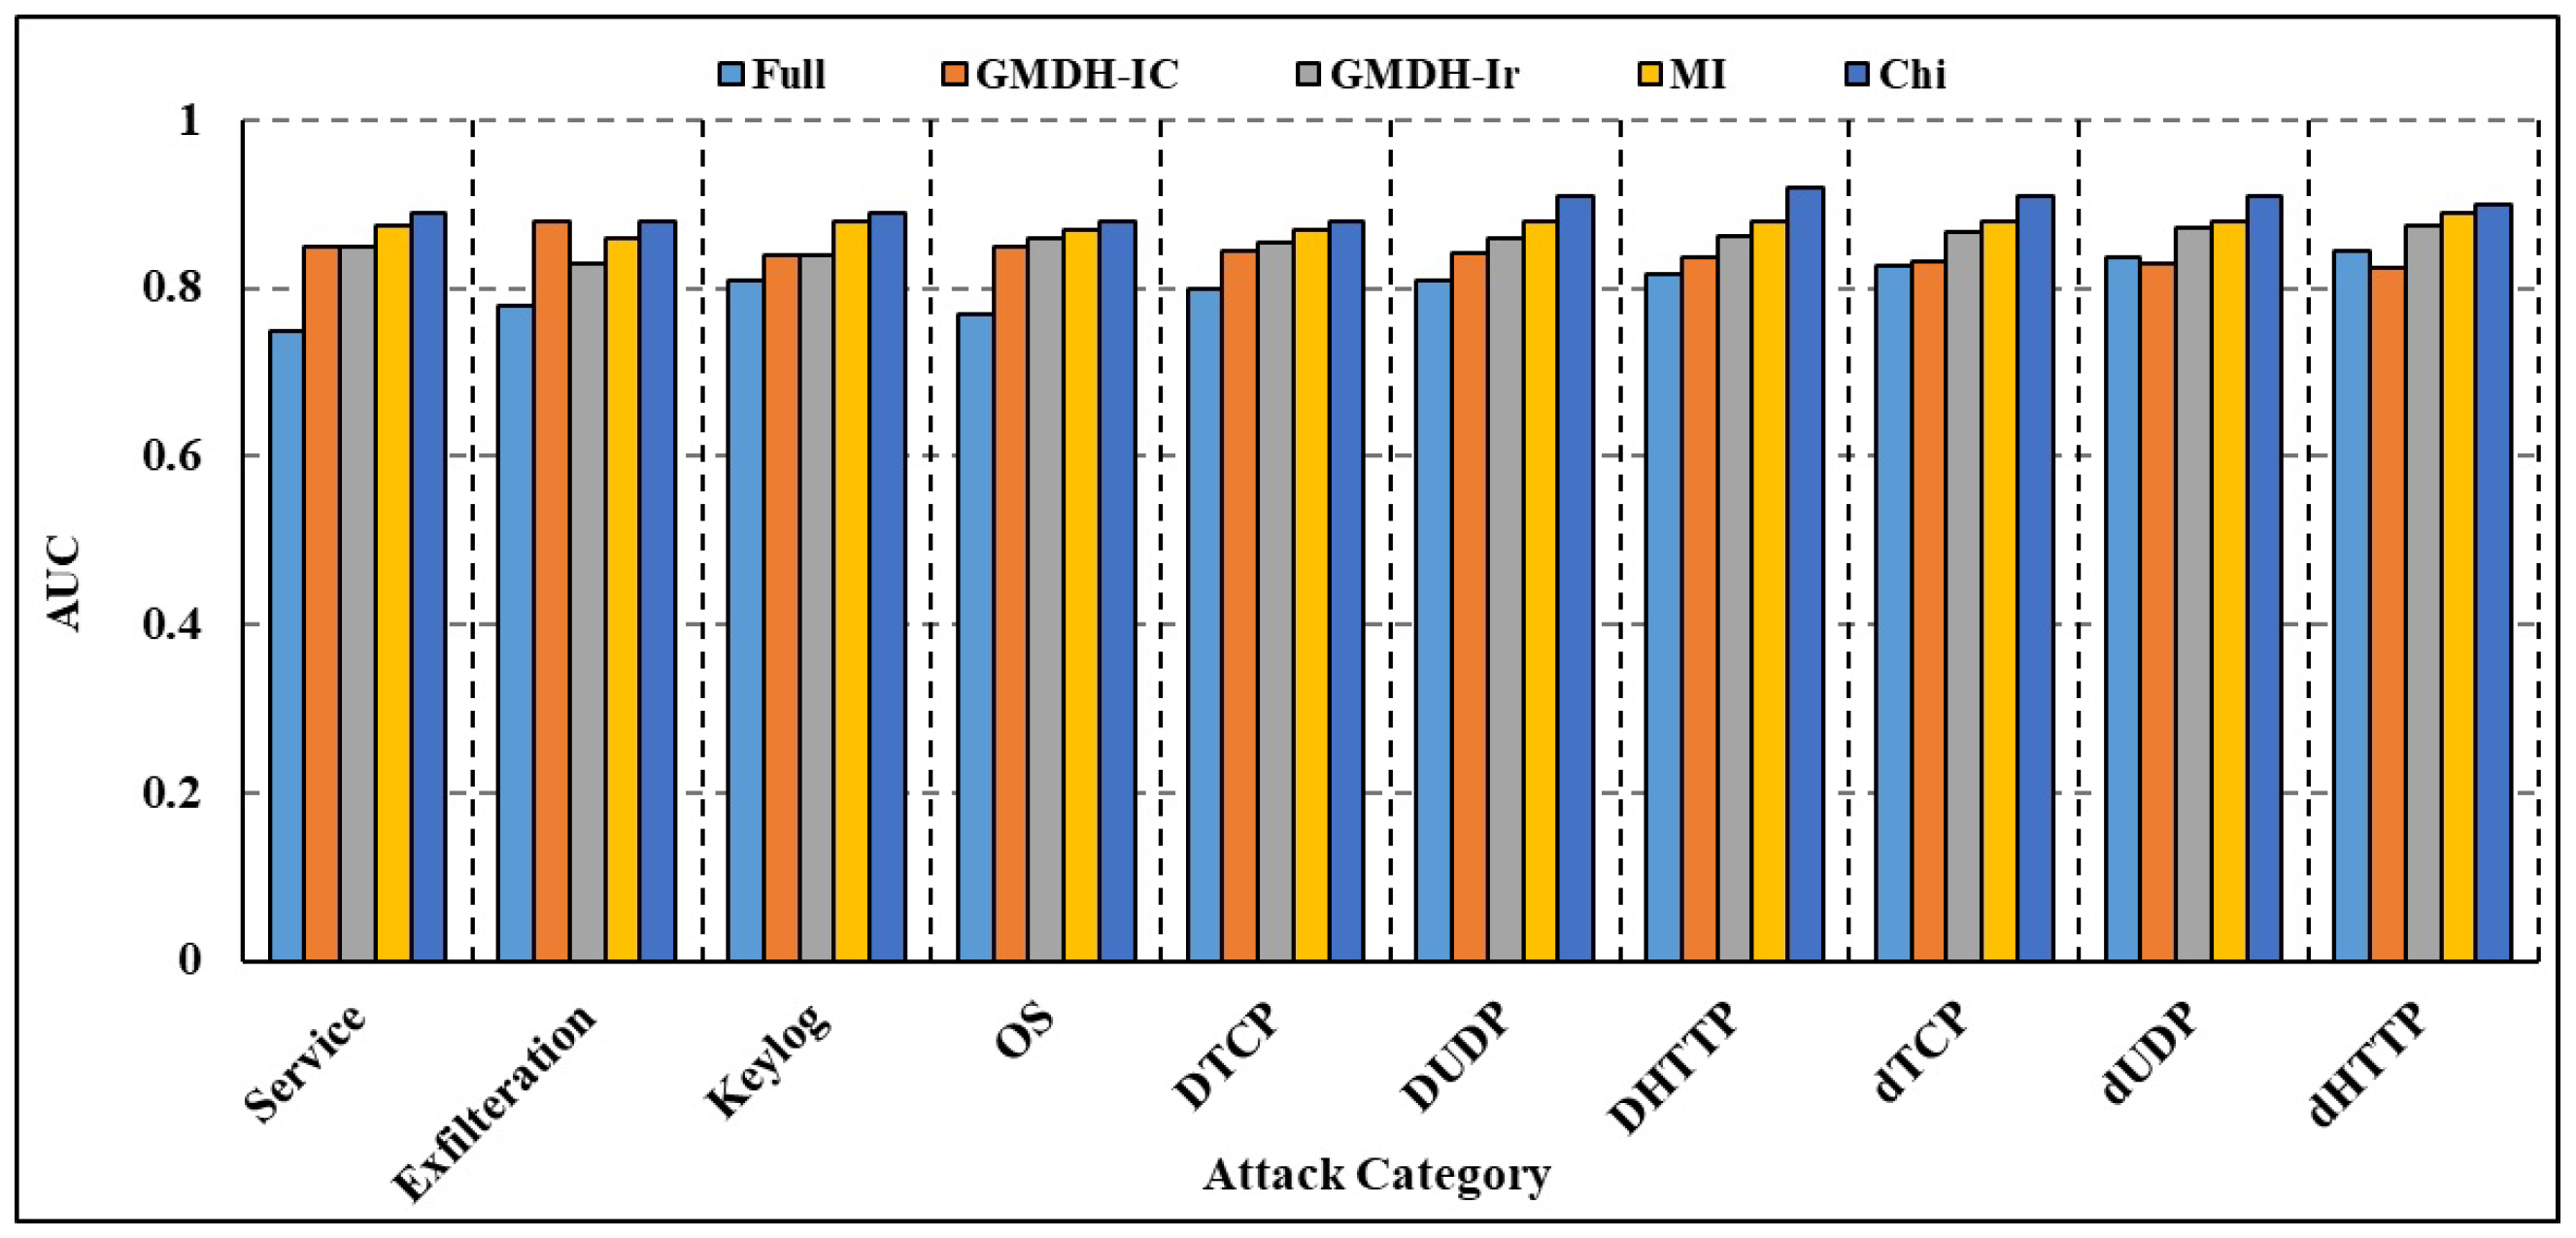
4.5.2. Efficiency of the Model
4.6. Comparative Analysis
5. Conclusions
Author Contributions
Funding
Institutional Review Board Statement
Informed Consent Statement
Data Availability Statement
Acknowledgments
Conflicts of Interest
References
- Stellios, I.; Mokos, K.; Kotzanikolaou, P. Assessing vulnerabilities and IoT-enabled attacks on smart lighting systems. In Proceedings of the Computer Security. ESORICS 2021 International Workshops: CyberICPS, SECPRE, ADIoT, SPOSE, CPS4CIP, and CDT&SECOMANE, Darmstadt, Germany, 4–8 October 2021; Revised Selected Papers. Springer: Berlin/Heidelberg, Germany, 2022; pp. 199–217. [Google Scholar]
- Kim, J.; Nakashima, M.; Fan, W.; Wuthier, S.; Zhou, X.; Kim, I.; Chang, S.Y. A Machine Learning Approach to Anomaly Detection Based on Traffic Monitoring for Secure Blockchain Networking. IEEE Trans. Netw. Serv. Manag. 2022, 19, 3619–3632. [Google Scholar] [CrossRef]
- Syed, N.F.; Ge, M.; Baig, Z. Fog-cloud based intrusion detection system using Recurrent Neural Networks and feature selection for IoT networks. Comput. Netw. 2023, 225, 109662. [Google Scholar] [CrossRef]
- Singh, A.; Amutha, J.; Nagar, J.; Sharma, S.; Lee, C.C. AutoML-ID: Automated machine learning model for intrusion detection using wireless sensor network. Sci. Rep. 2022, 12, 9074. [Google Scholar] [CrossRef] [PubMed]
- Song, Y.; Xin, R.; Chen, P.; Zhang, R.; Chen, J.; Zhao, Z. Identifying performance anomalies in fluctuating cloud environments: A robust correlative-GNN-based explainable approach. Future Gener. Comput. Syst. 2023, 145, 77–86. [Google Scholar] [CrossRef]
- Gudla, S.P.K.; Bhoi, S.K. MLP deep learning-based DDoS attack detection framework for fog computing. In Advances in Distributed Computing and Machine Learning: Proceedings of ICADCML 2022; Springer: Berlin/Heidelberg, Germany, 2022; pp. 25–34. [Google Scholar]
- Popoola, S.; Adebisi, B.; Gui, G.; Hammoudeh, M.; Gacanin, H.; Dancey, D. Optimizing Deep Learning Model Hyperparameters for Botnet Attack Detection in Iot Networks. TechRxiv 2022. [Google Scholar] [CrossRef]
- Ikhwan, S.; Wibowo, A.; Warsito, B. Intrusion Detection using Deep Neural Network Algorithm on the Internet of Things. In Proceedings of the 2022 IEEE International Conference on Communication, Networks and Satellite (COMNETSAT), Solo, Indonesia, 3–5 November 2022; pp. 84–87. [Google Scholar]
- Spadaccino, P.; Cuomo, F. Intrusion Detection Systems for IoT: Opportunities and challenges offered by Edge Computing and Machine Learning. arXiv 2020, arXiv:2012.01174. [Google Scholar]
- Khater, B.S.; Abdul Wahab, A.W.; Idris, M.Y.I.; Hussain, M.A.; Ibrahim, A.A.; Amin, M.A.; Shehadeh, H.A. Classifier performance evaluation for lightweight IDS using fog computing in IoT security. Electronics 2021, 10, 1633. [Google Scholar] [CrossRef]
- Jasim, A.D. A survey of intrusion detection using deep learning in internet of things. Iraqi J. Comput. Sci. Math. 2022, 3, 83–93. [Google Scholar]
- Aljuhani, A. IDS-Chain: A Collaborative Intrusion Detection Framework Empowered Blockchain for Internet of Medical Things. In Proceedings of the 2022 IEEE Cloud Summit, Fairfax, VA, USA, 20–21 October 2022; pp. 57–62. [Google Scholar]
- Abd Elkhalik, W.; Elhenawy, I. Semi-supervised Transformer Network for Anomaly Detection in Cellular Internet of Things. Int. J. Wirel. Ad Hoc Commun. 2023, 4, 56–68. [Google Scholar] [CrossRef]
- Guo, G. An Intrusion Detection System for the Internet of Things Using Machine Learning Models. In Proceedings of the 2022 3rd International Conference on Big Data, Artificial Intelligence and Internet of Things Engineering (ICBAIE), Xi’an, China, 15–17 July 2022; pp. 332–335. [Google Scholar]
- Nayak, J.; Meher, S.K.; Souri, A.; Naik, B.; Vimal, S. Extreme learning machine and bayesian optimization-driven intelligent framework for IoMT cyber-attack detection. J. Supercomput. 2022, 78, 14866–14891. [Google Scholar] [CrossRef] [PubMed]
- Shukla, V.; Choudhary, S. Deep Learning in Neural Networks: An Overview. Deep. Learn. Vis. Comput. Signal Process. 2022, 29–53. [Google Scholar]
- Albulayhi, K.; Abu Al-Haija, Q.; Alsuhibany, S.A.; Jillepalli, A.A.; Ashrafuzzaman, M.; Sheldon, F.T. IoT intrusion detection using machine learning with a novel high performing feature selection method. Appl. Sci. 2022, 12, 5015. [Google Scholar] [CrossRef]
- Muneer, A.; Fati, S.M.; Akbar, N.A.; Agustriawan, D.; Wahyudi, S.T. iVaccine-Deep: Prediction of COVID-19 mRNA vaccine degradation using deep learning. J. King Saud Univ.-Comput. Inf. Sci. 2022, 34, 7419–7432. [Google Scholar] [CrossRef]
- Pathan, M.I.; Shahriar, M.S.; Rahman, M.M.; Hossain, M.S.; Awatif, N.; Shafiullah, M. Comparative Analysis of Machine Learning Approaches in Enhancing Power System Stability. Artif. Intell.-Based Smart Power Syst. 2023, 157–177. [Google Scholar] [CrossRef]
- Ahmadi, A.; Asadi, Y.; Amani, A.M.; Jalili, M.; Yu, X. Resilient Model Predictive Adaptive Control of Networked Z-source Inverters using GMDH. IEEE Trans. Smart Grid 2022, 13, 3723–3734. [Google Scholar] [CrossRef]
- Pedregosa, F.; Varoquaux, G.; Gramfort, A.; Michel, V.; Thirion, B.; Grisel, O.; Blondel, M.; Prettenhofer, P.; Weiss, R.; Dubourg, V.; et al. Scikit-learn: Software repository. arXiv 2022, arXiv:1201.0490. [Google Scholar]
- Abdulqadder, I.; Zhou, S.; Zou, D.; Aziz, I.; Akber, S. Bloc-Sec: Blockchain-Based Lightweight Security Architecture for 5G/B5G Enabled SDN/NFV Cloud of IoT. In Proceedings of the 2020 IEEE 20th International Conference on Communication Technology (ICCT), Nanning, China, 28–31 October 2020; pp. 499–507. [Google Scholar] [CrossRef]
- Qiu, W.; Ma, Y.; Chen, X.; Yu, H.; Chen, L. Hybrid intrusion detection system based on Dempster-Shafer evidence theory. Comput. Secur. 2022, 117, 102709. [Google Scholar] [CrossRef]
- Ullah, I.; Mahmoud, Q.H. Design and development of RNN anomaly detection model for IoT networks. IEEE Access 2022, 10, 62722–62750. [Google Scholar] [CrossRef]
- Premkumar, R.; Priya, S.S. Service Constraint NCBQ trust orient secure transmission with IoT devices for improved data security in cloud using blockchain. Meas. Sens. 2022, 24, 100486. [Google Scholar] [CrossRef]


| Ref. | Technique | Performance | Data Split | Data Reduction | Layer | Dataset |
|---|---|---|---|---|---|---|
| [12] | CorrAUC based attribute selection | Low precision | NA | Yes | Centralized | BoT-IoT |
| [14] | DL techniques using GRU | Achieves better overall performance | NA | Yes | Edge-based, Distributed | BoT-IoT and UNSW-NB15 |
| [15] | DL-inspired feed-forward technique | High classification precision | NA | NA | Centralized | BoT-IoT |
| [13] | DL framework with BiLSTM model and blockchain technique | Enhanced accuracy | NA | NA | Centralized | UNSW-NB15 and BoT-IoT |
| [3] | LSTM | High recall rate | NA | NA | Cloud | ISCX2012 |
| [11] | Uses multi-modal with auto-encoder | Improved F1 measure | NA | NA | Distributed | BoT-IoT |
| [7] | RNN-based attack identification | Non-IoT-based traffic | Yes | NA | Centralized | NSL-KDD |
| Category | Time |
|---|---|
| DDoS_HTTP | 10 |
| DDoS_UDP | 09 |
| DDoS_TCP | 08 |
| DoS_TCP | 04 |
| DoS_UDP | 05 |
| DoS_HTTP | 04 |
| Keylogging | 04 |
| Data_Exfiltration | 02 |
| Reconnaissance | 05 |
| Normal | 01 |
| Category | Attack Class | Normal Class | Attributes |
|---|---|---|---|
| Service_Scan | 958658 | 1254954 | 90 |
| Data Ex-filtration | 321542 | 124512 | 69 |
| DDoS-HTTP | 542154 | 452145 | 69 |
| OS-Scan | 124585 | 124562 | 69 |
| DDoS-TCP | 542154 | 325623 | 71 |
| Key-logging | 145214 | 215421 | 69 |
| DoS-HTTP | 163254 | 312451 | 75 |
| DoS-TCP | 124854 | 325484 | 69 |
| DDoS-UDP | 132541 | 215421 | 71 |
| DoS-UDP | 965845 | 965845 | 70 |
| Attributes | Range | Range | Range |
|---|---|---|---|
| No. of neurons | 256 | 512 | 1024 |
| Learning rate | 0.01 | 0.001 | 0.0001 |
| No. of hidden layers | 3 | 4 | 5 |
| Dropout rate | 0.2 | – | – |
| No. of epochs | 30 | 60 | 110 |
| Window size (seconds) | 3 | 4 | 5 |
| Batch size | 64 | 64 | 512 |
| Class | GMDH (lr) | GMDH (lr-cov) | 2 | MI |
|---|---|---|---|---|
| Service | 90.23 | 90.25 | 90.48 | 90.14 |
| Data Exfiltration | 90.23 | 90.14 | 90.59 | 91.25 |
| DDoS-HTTP | 91.25 | 93.21 | 90.15 | 91.02 |
| DDoS-UDP | 90.15 | 90.23 | 90.14 | 90.14 |
| OS | 90.65 | 90.48 | 90.65 | 90.14 |
| DoS-HTTP | 90.47 | 90.65 | 90.11 | 90.32 |
| DDoS-TCP | 90.48 | 90.65 | 90.12 | 90.87 |
| Keylogging | 90.65 | 90.41 | 90.54 | 90.26 |
| DoS-UDP | 90.15 | 90.16 | 90.16 | 90.17 |
| DoS-TCP | 90.48 | 90.489 | 90.65 | 90.33 |
| Model | Data Size | F1 (%) | Accuracy (%) | Precision (%) | Recall (%) | AUC (%) | Delay |
|---|---|---|---|---|---|---|---|
| RNN | 4.1 M | 99.5 | 99.65 | 99.65 | 99.01 | 99.5 | 401 s |
| RF | 4.1 M | 99.2 | 98.5 | 98.6 | 98.45 | 98.15 | 241 s |
| NB | 4.1 M | 91.23 | 99.1 | 98.56 | 97.56 | 98.1 | 10.25 s |
| Bi-LSTM | 4.1 M | 99.15 | 97.56 | 94.56 | 96.58 | 97.45 | 841 s |
| SVM | 111 K | 95.26 | 96.23 | 94.25 | 94.36 | 94.15 | 1625 s |
| Model | Data Size | F1 (%) | Accuracy (%) | Precision (%) | Recall (%) | AUC (%) | Delay |
|---|---|---|---|---|---|---|---|
| RNN | 5.2 M | 98.15 | 97.54 | 98.54 | 98.00 | 98.40 | 395 s |
| RF | 5.2 M | 98.10 | 97.4 | 97.5 | 97.34 | 97.04 | 230 s |
| NB | 5.2 M | 90.12 | 98.0 | 97.45 | 96.45 | 97.0 | 9.14 s |
| Bi-LSTM | 5.2 M | 98.04 | 96.45 | 93.45 | 95.47 | 96.34 | 830 s |
| SVM | 132 K | 94.15 | 95.12 | 93.14 | 93.15 | 93.04 | 1152 s |
| Ref. | Technique | Accuracy | Precision | F1-Measure | Recall | AUC |
|---|---|---|---|---|---|---|
| [3] | LSTM | 98.56 | N | N | N | N |
| [7] | CNN | 94.65 | N | N | N | N |
| [11] | RF | 94.69 | N | 96.15 | N | N |
| [12] | RF | 95.65 | 95.12 | N | N | N |
| [13] | DT | 94.56 | 96.25 | 94.15 | 94.56 | N |
| [14] | BiLSTM | 94.01 | 93.2 | 91.12 | N | N |
| This paper | RNN + BiLSTM | 99.56 | 99.45 | 99.12 | 98.25 | 96.25 |
| Full | GMDH-LR | GDMH-LRCOV | Chi | MI | |
|---|---|---|---|---|---|
| Service | 1.25 | 1.02 | 1.02 | 1.03 | 1.07 |
| DDoS-UDP | 1.2 | 1.06 | 1.07 | 1.056 | 1.065 |
| Data-exfiltration | 1.23 | 1.026 | 1.02 | 1.06 | 1.05 |
| OS | 1.32 | 1.02 | 1.05 | 1.02 | 1.02 |
| DoS-UDP | 1.14 | 1.02 | 1.02 | 1.02 | 1.02 |
| Keylogging | 1.15 | 1.04 | 1.07 | 1.07 | 1.02 |
| DoS-TCP | 1.2 | 1.05 | 1.07 | 1.02 | 1.03 |
| DoS-HTTP | 1.32 | 1.07 | 1.02 | 1.02 | 1.04 |
| DDoS-HTTP | 1.23 | 1.065 | 1.07 | 1.02 | 1.02 |
| DDoS-TCP | 1.65 | 1.05 | 1.04 | 1.03 | 1.02 |
Disclaimer/Publisher’s Note: The statements, opinions and data contained in all publications are solely those of the individual author(s) and contributor(s) and not of MDPI and/or the editor(s). MDPI and/or the editor(s) disclaim responsibility for any injury to people or property resulting from any ideas, methods, instructions or products referred to in the content. |
© 2023 by the authors. Licensee MDPI, Basel, Switzerland. This article is an open access article distributed under the terms and conditions of the Creative Commons Attribution (CC BY) license (https://creativecommons.org/licenses/by/4.0/).
Share and Cite
Aldaej, A.; Ahanger, T.A.; Ullah, I. Deep Learning-Inspired IoT-IDS Mechanism for Edge Computing Environments. Sensors 2023, 23, 9869. https://doi.org/10.3390/s23249869
Aldaej A, Ahanger TA, Ullah I. Deep Learning-Inspired IoT-IDS Mechanism for Edge Computing Environments. Sensors. 2023; 23(24):9869. https://doi.org/10.3390/s23249869
Chicago/Turabian StyleAldaej, Abdulaziz, Tariq Ahamed Ahanger, and Imdad Ullah. 2023. "Deep Learning-Inspired IoT-IDS Mechanism for Edge Computing Environments" Sensors 23, no. 24: 9869. https://doi.org/10.3390/s23249869