


The Design, Fabrication, and Evaluation of a Phase-Resolved Partial Discharge Sensor Embedded in a MV-Class Bushing


Abstract
:1. Introduction
2. Design and Fabrication
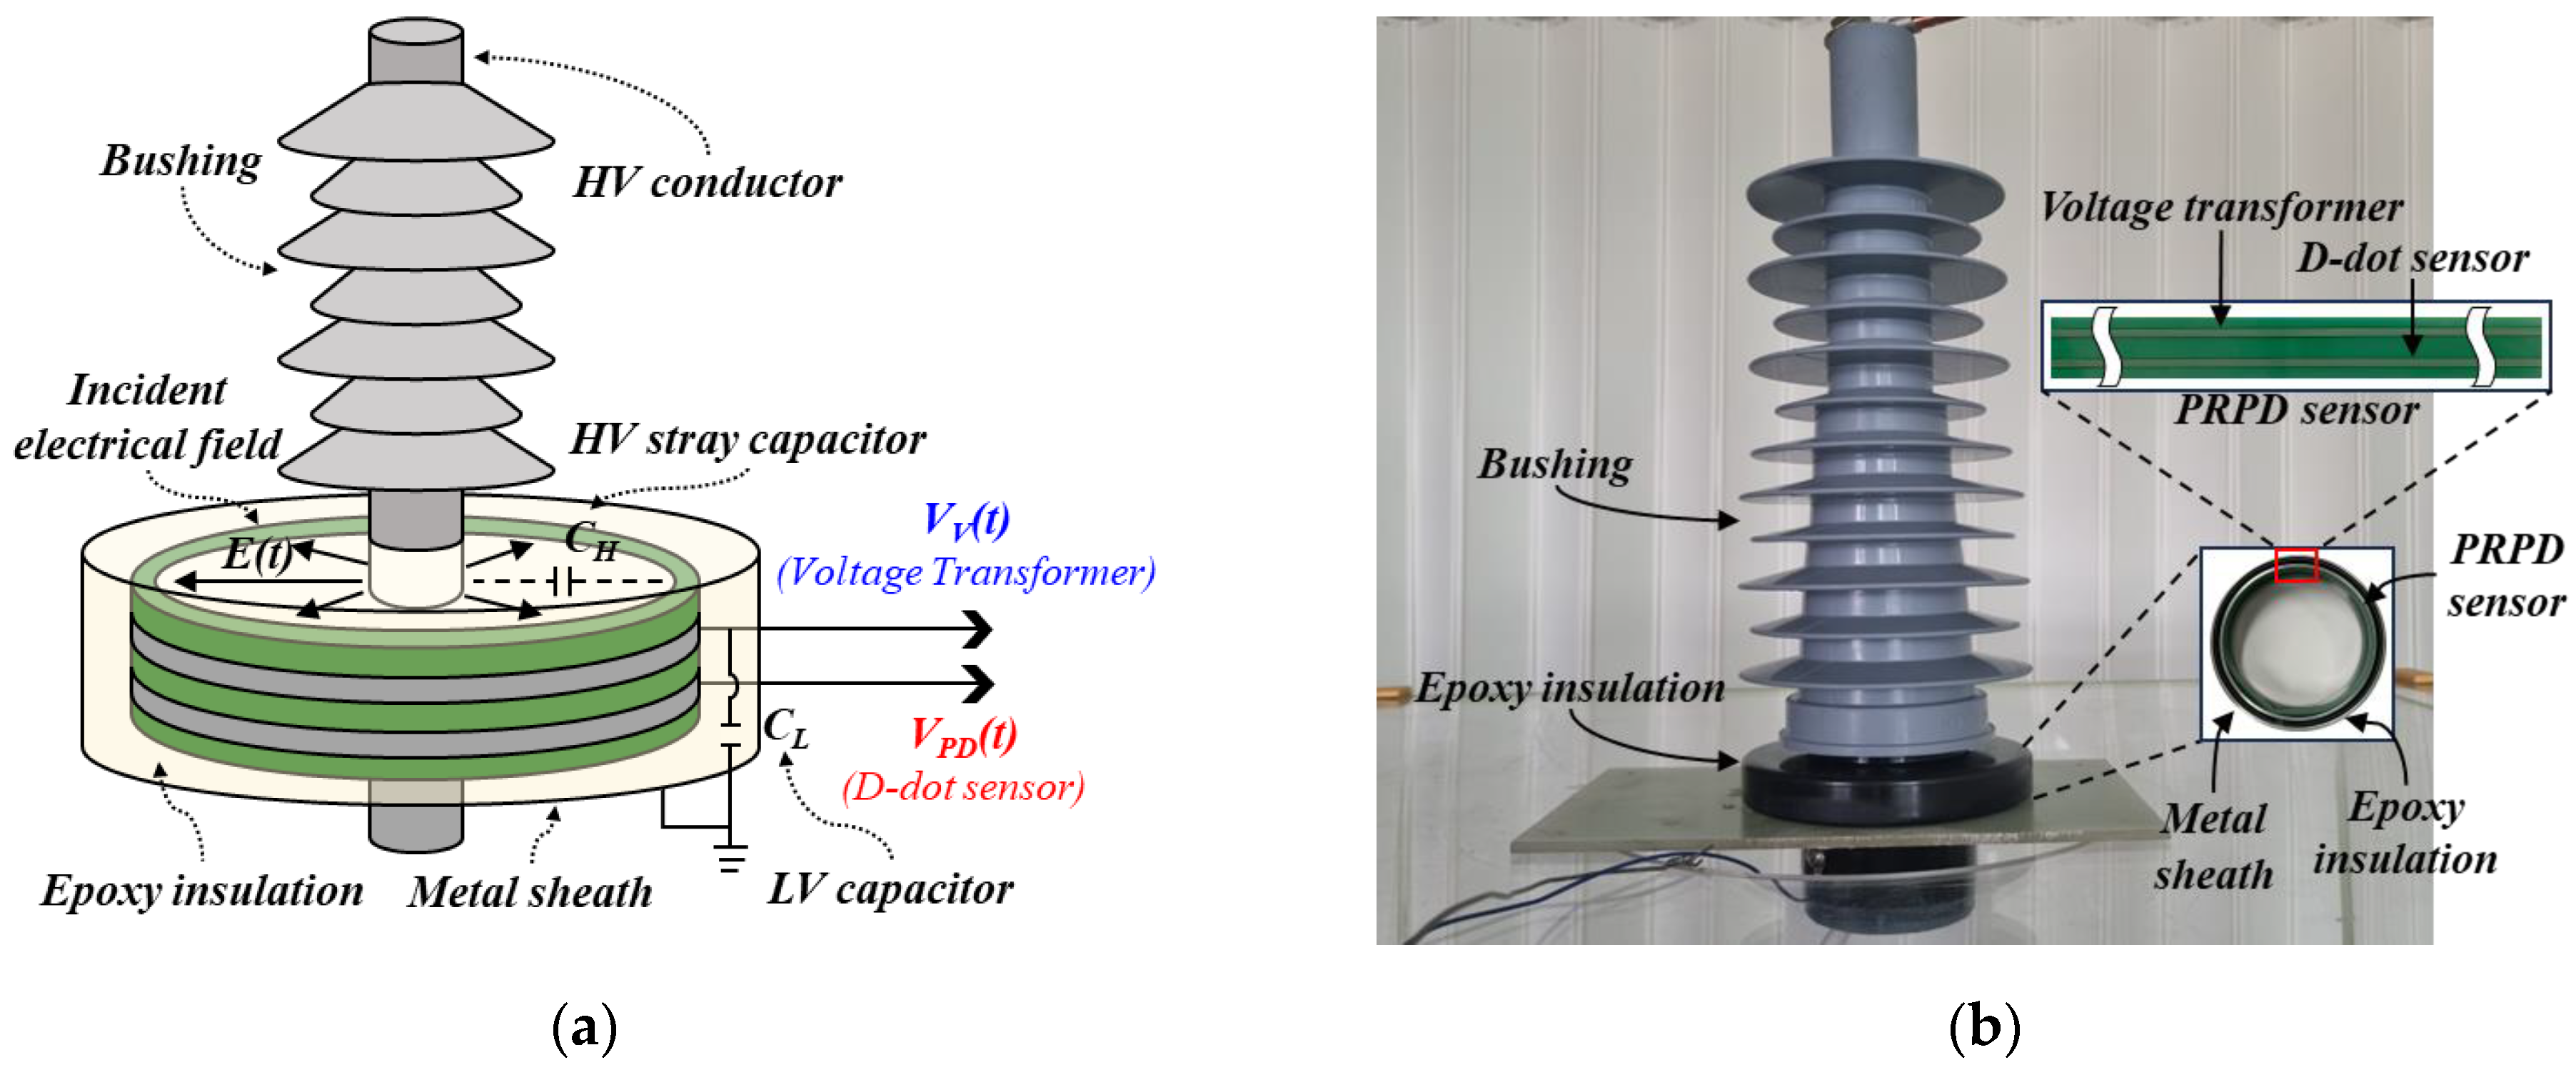
2.1. PRPD Sensor Embedded in a Bushing
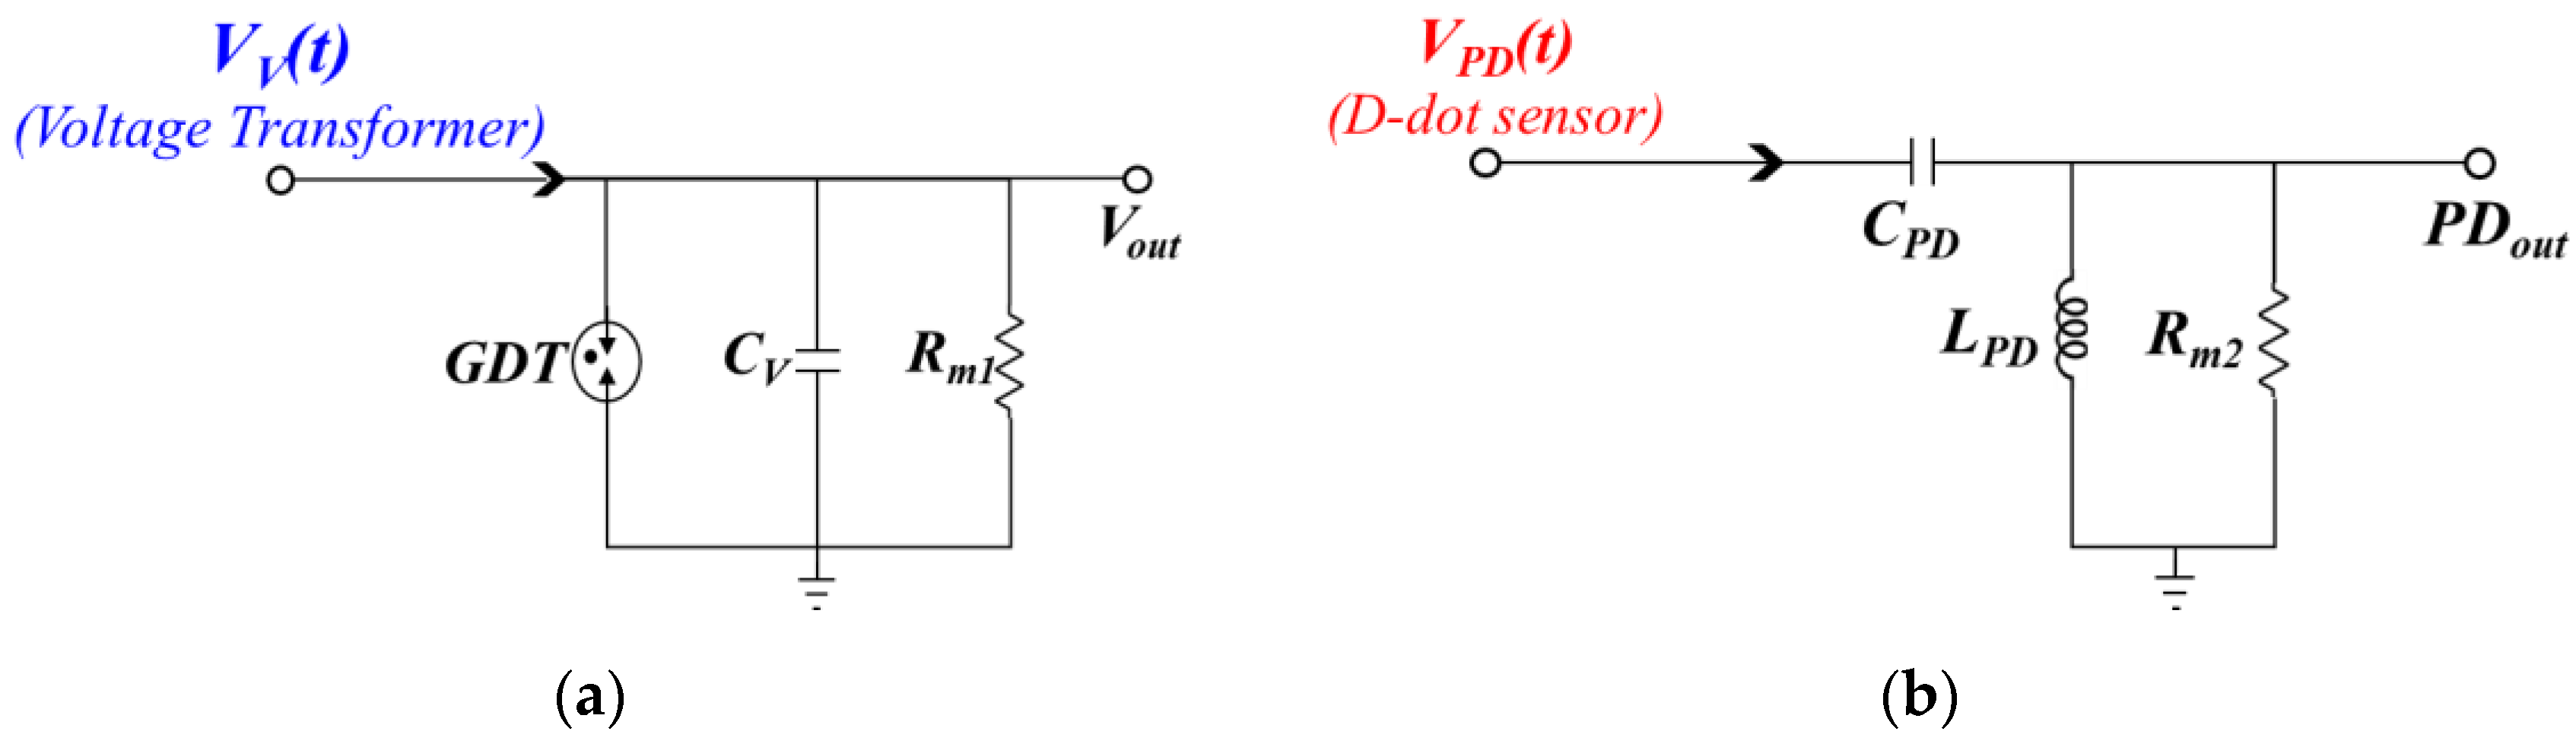
2.2. Signal Transducer
3. Experiment and Method
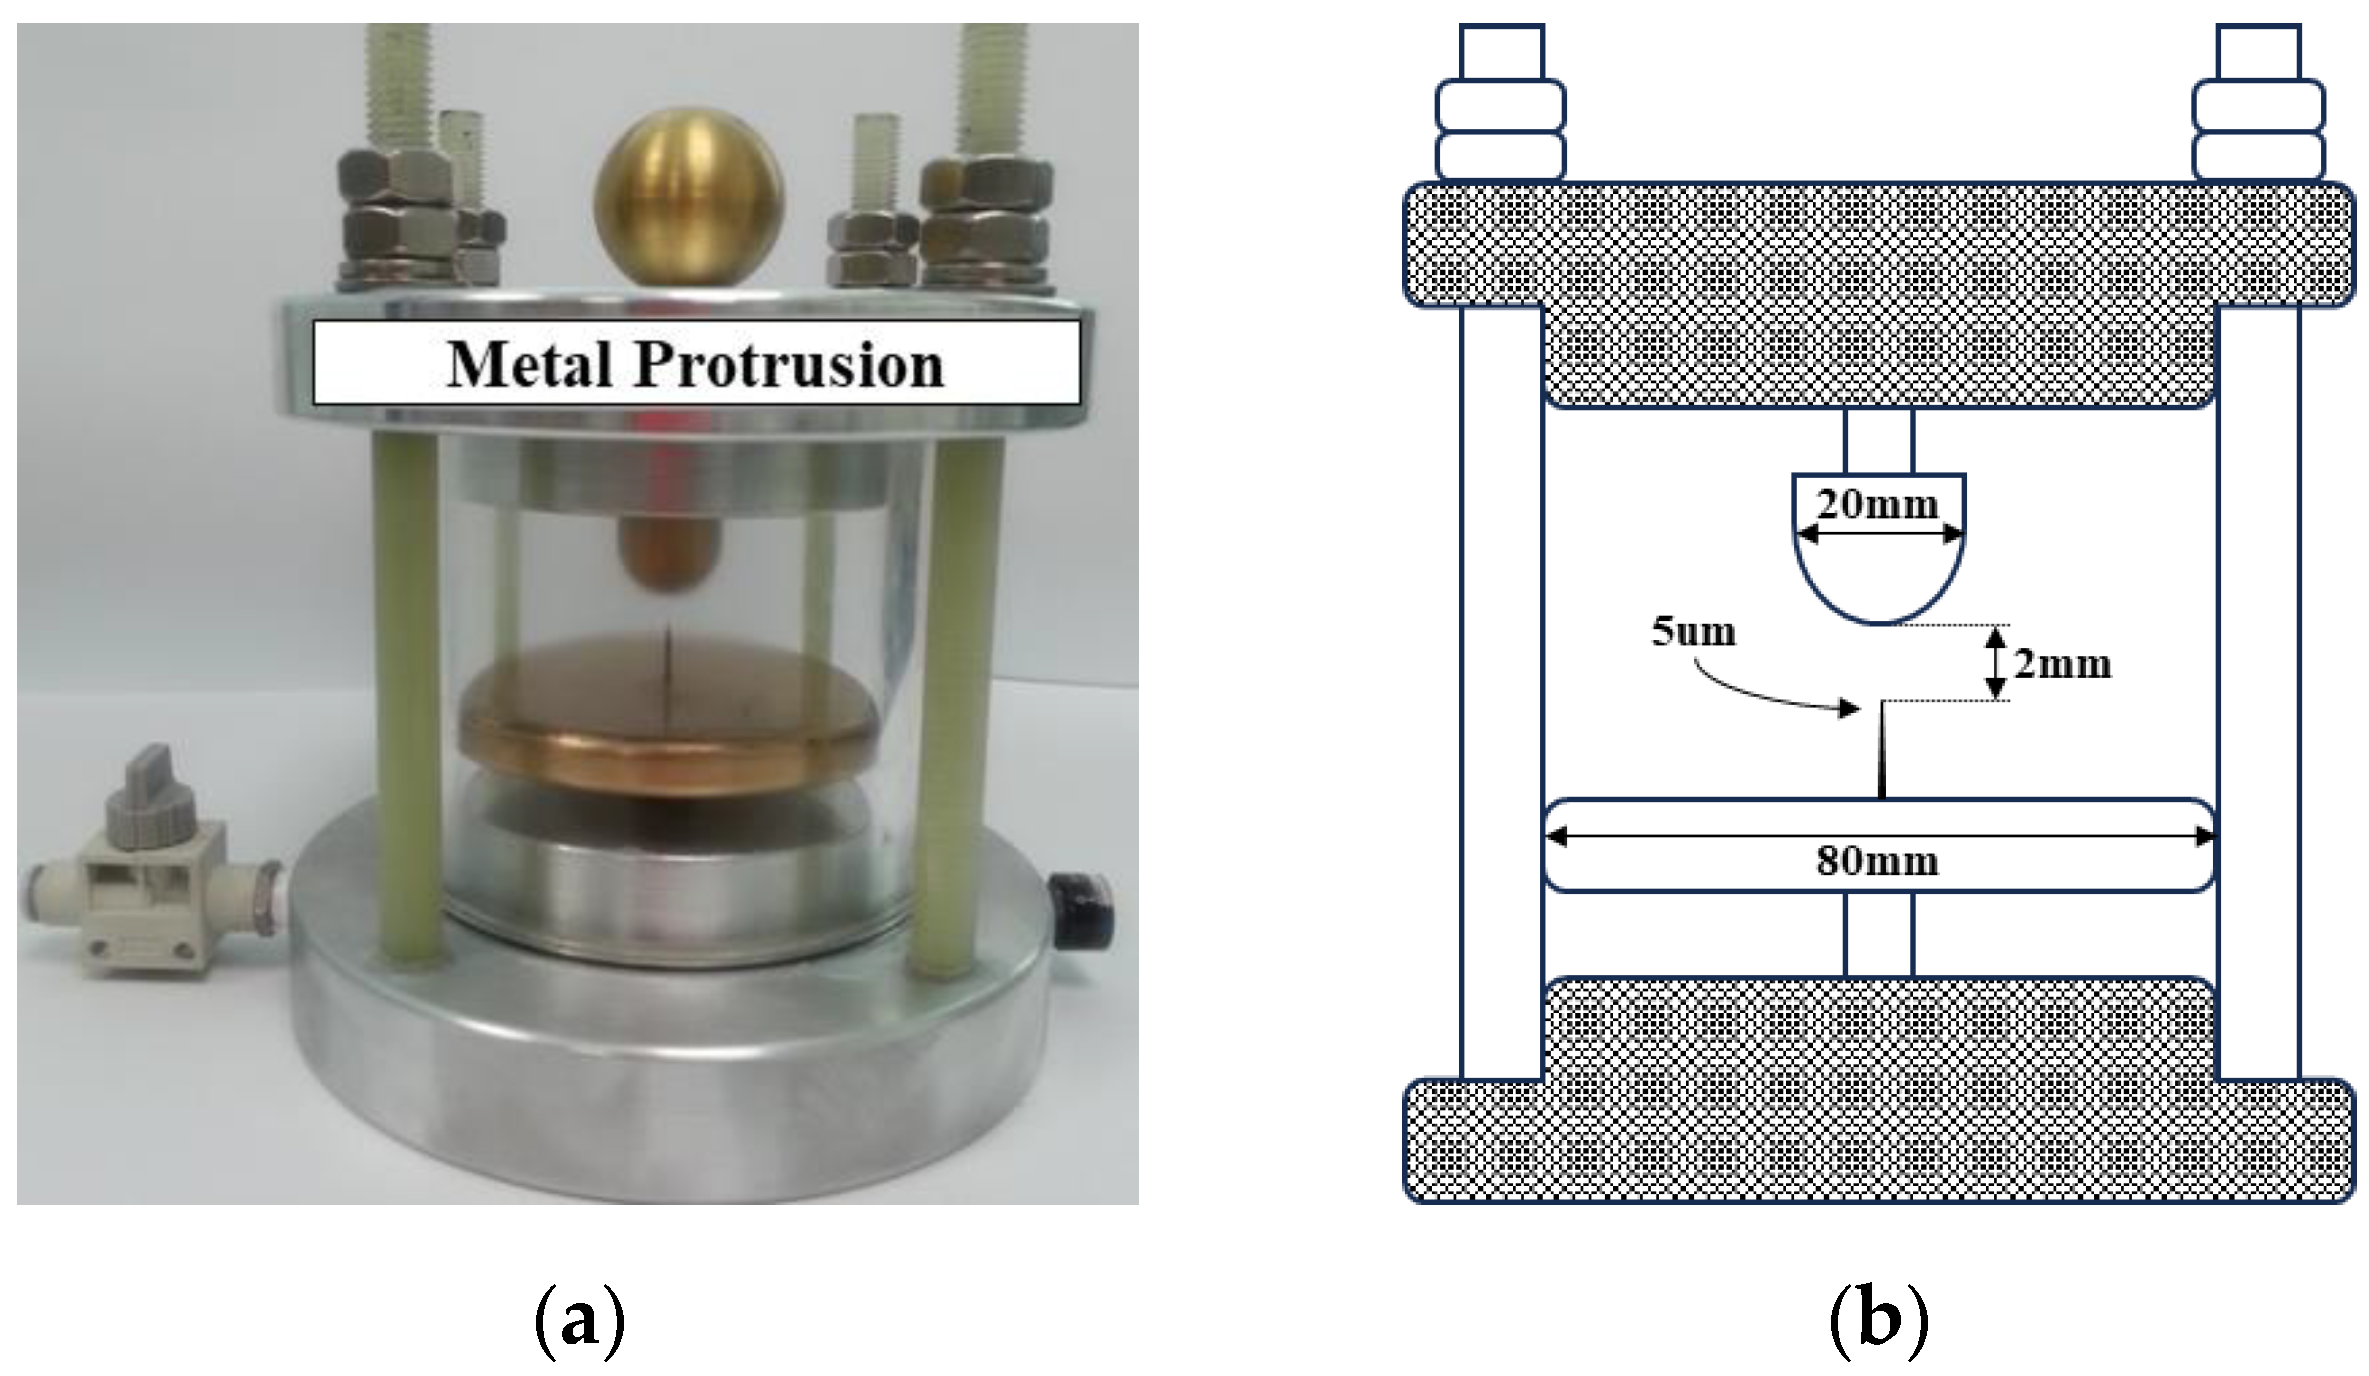
3.1. PD Simulator
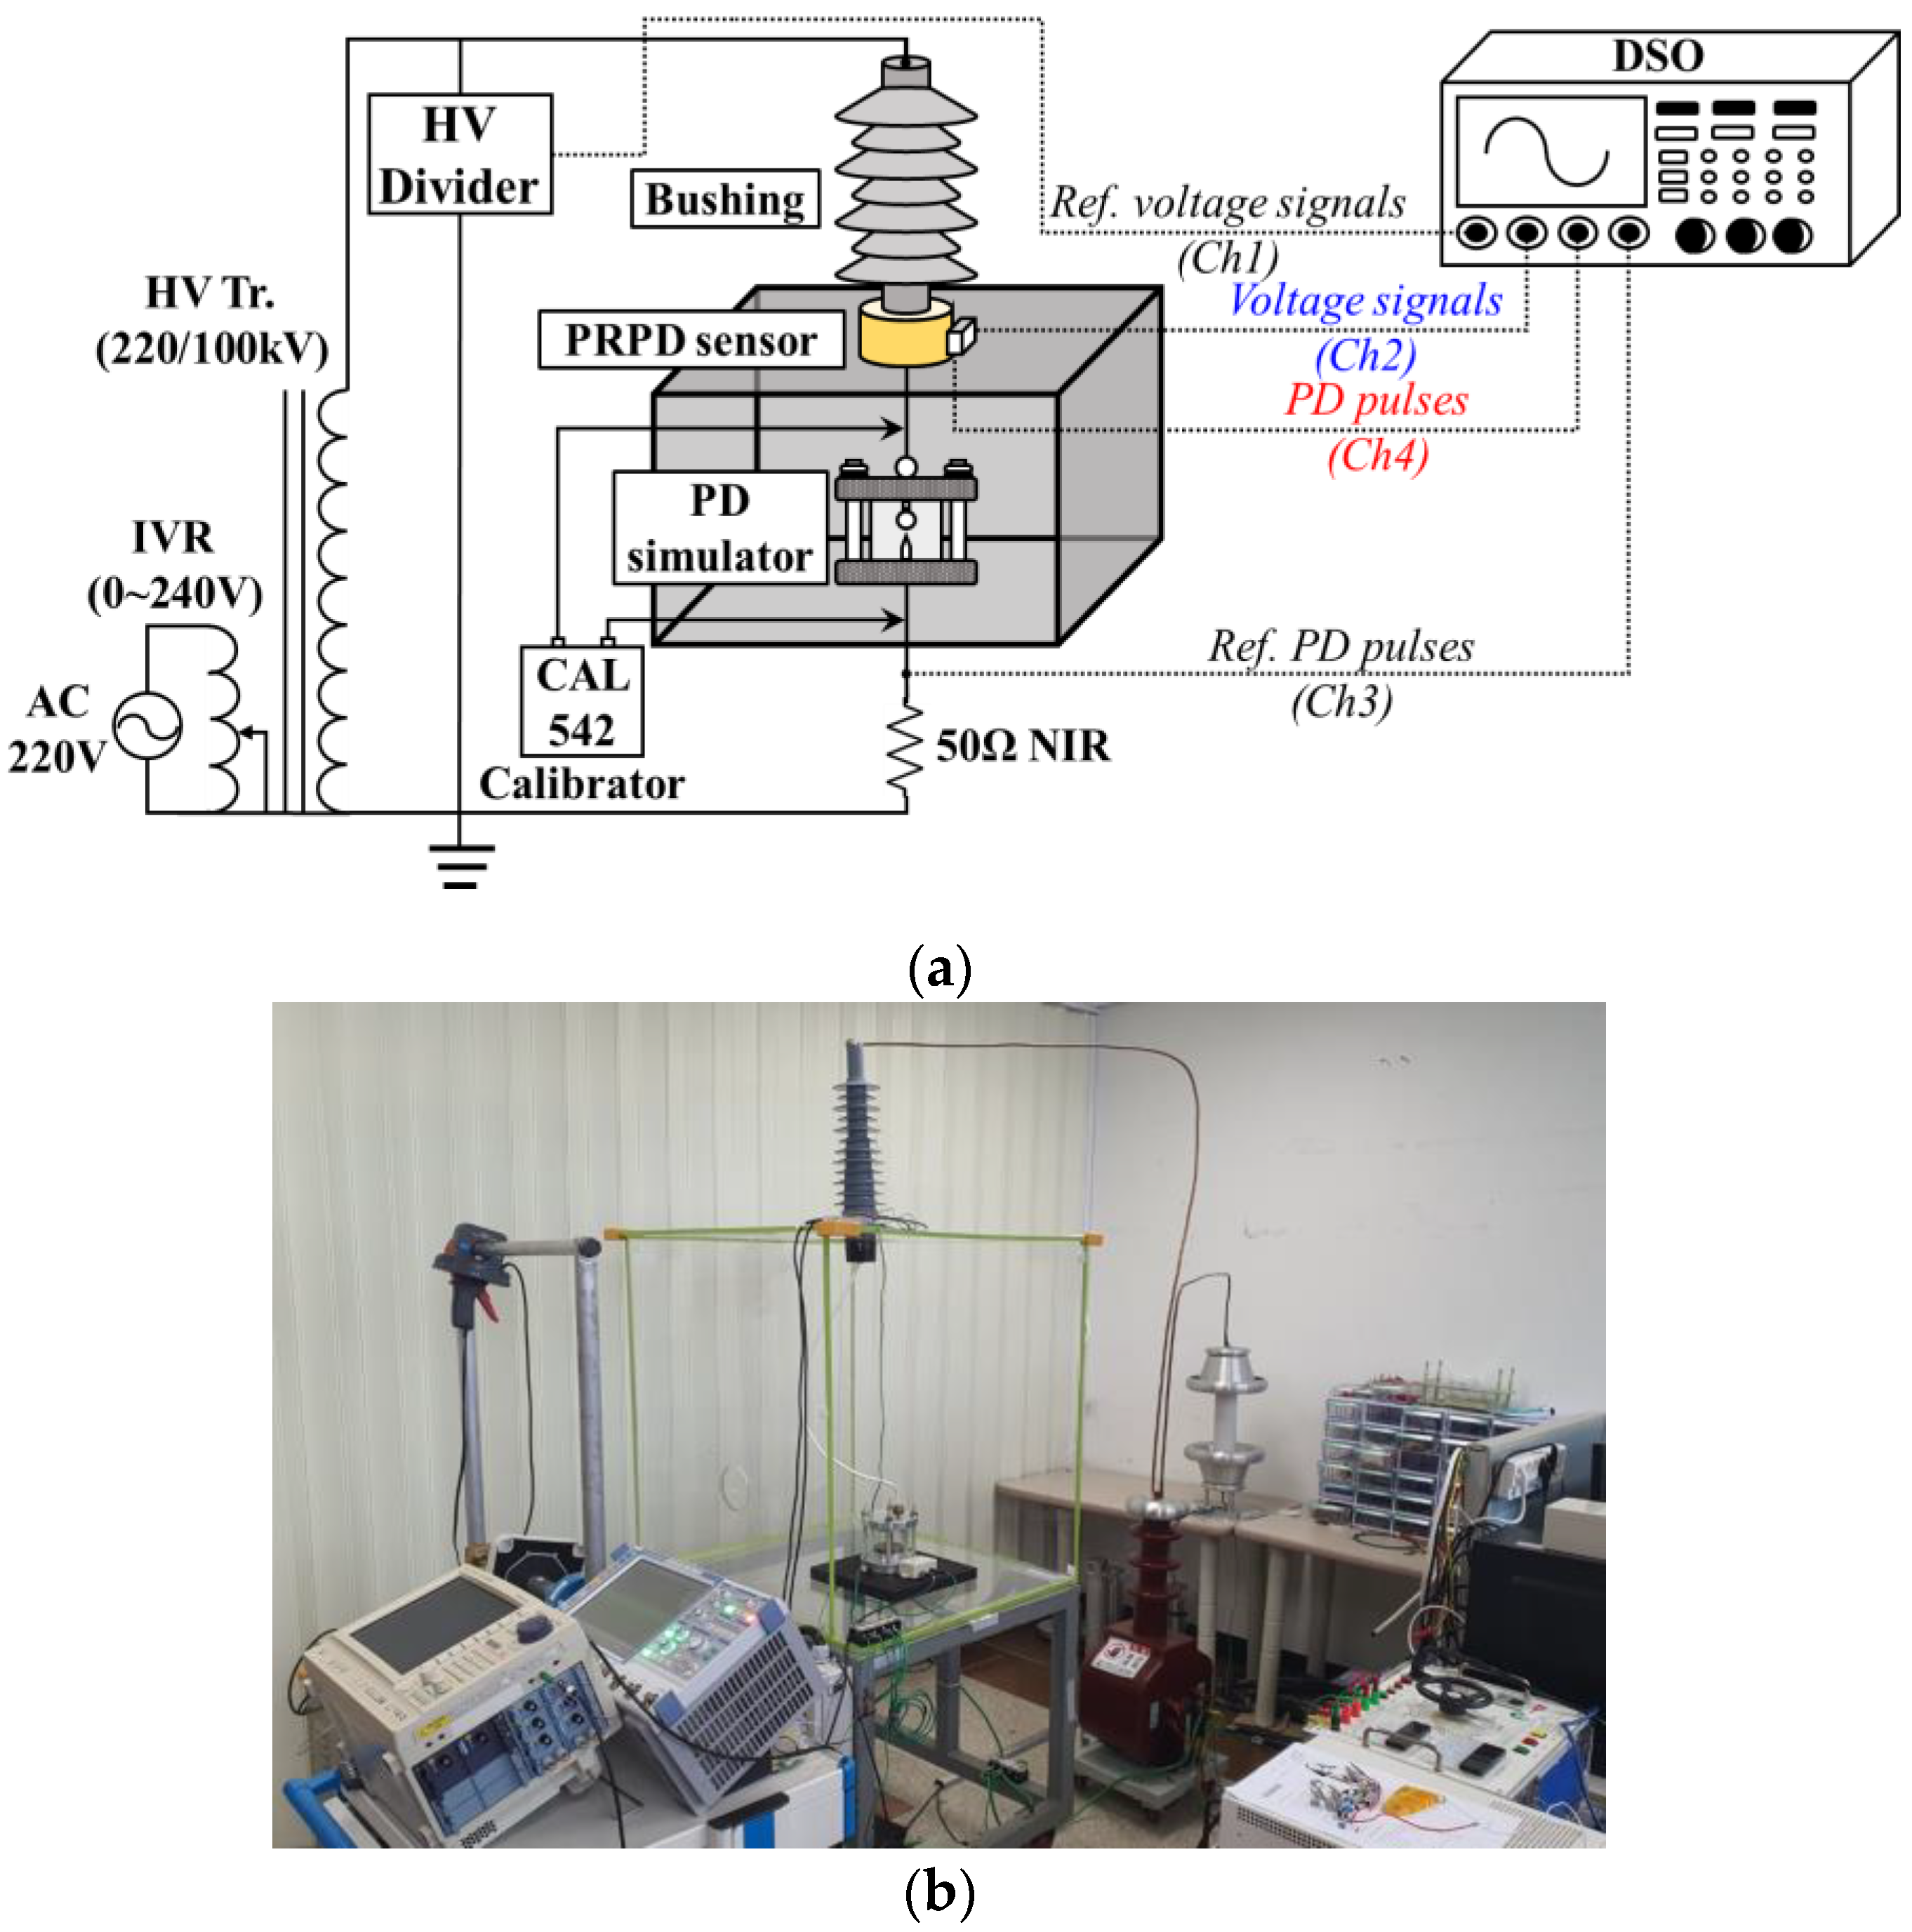
3.2. Experimental Setup
4. Performance Evaluation
4.1. Voltage Measurement
4.2. PD Detection
5. Conclusions
- A.
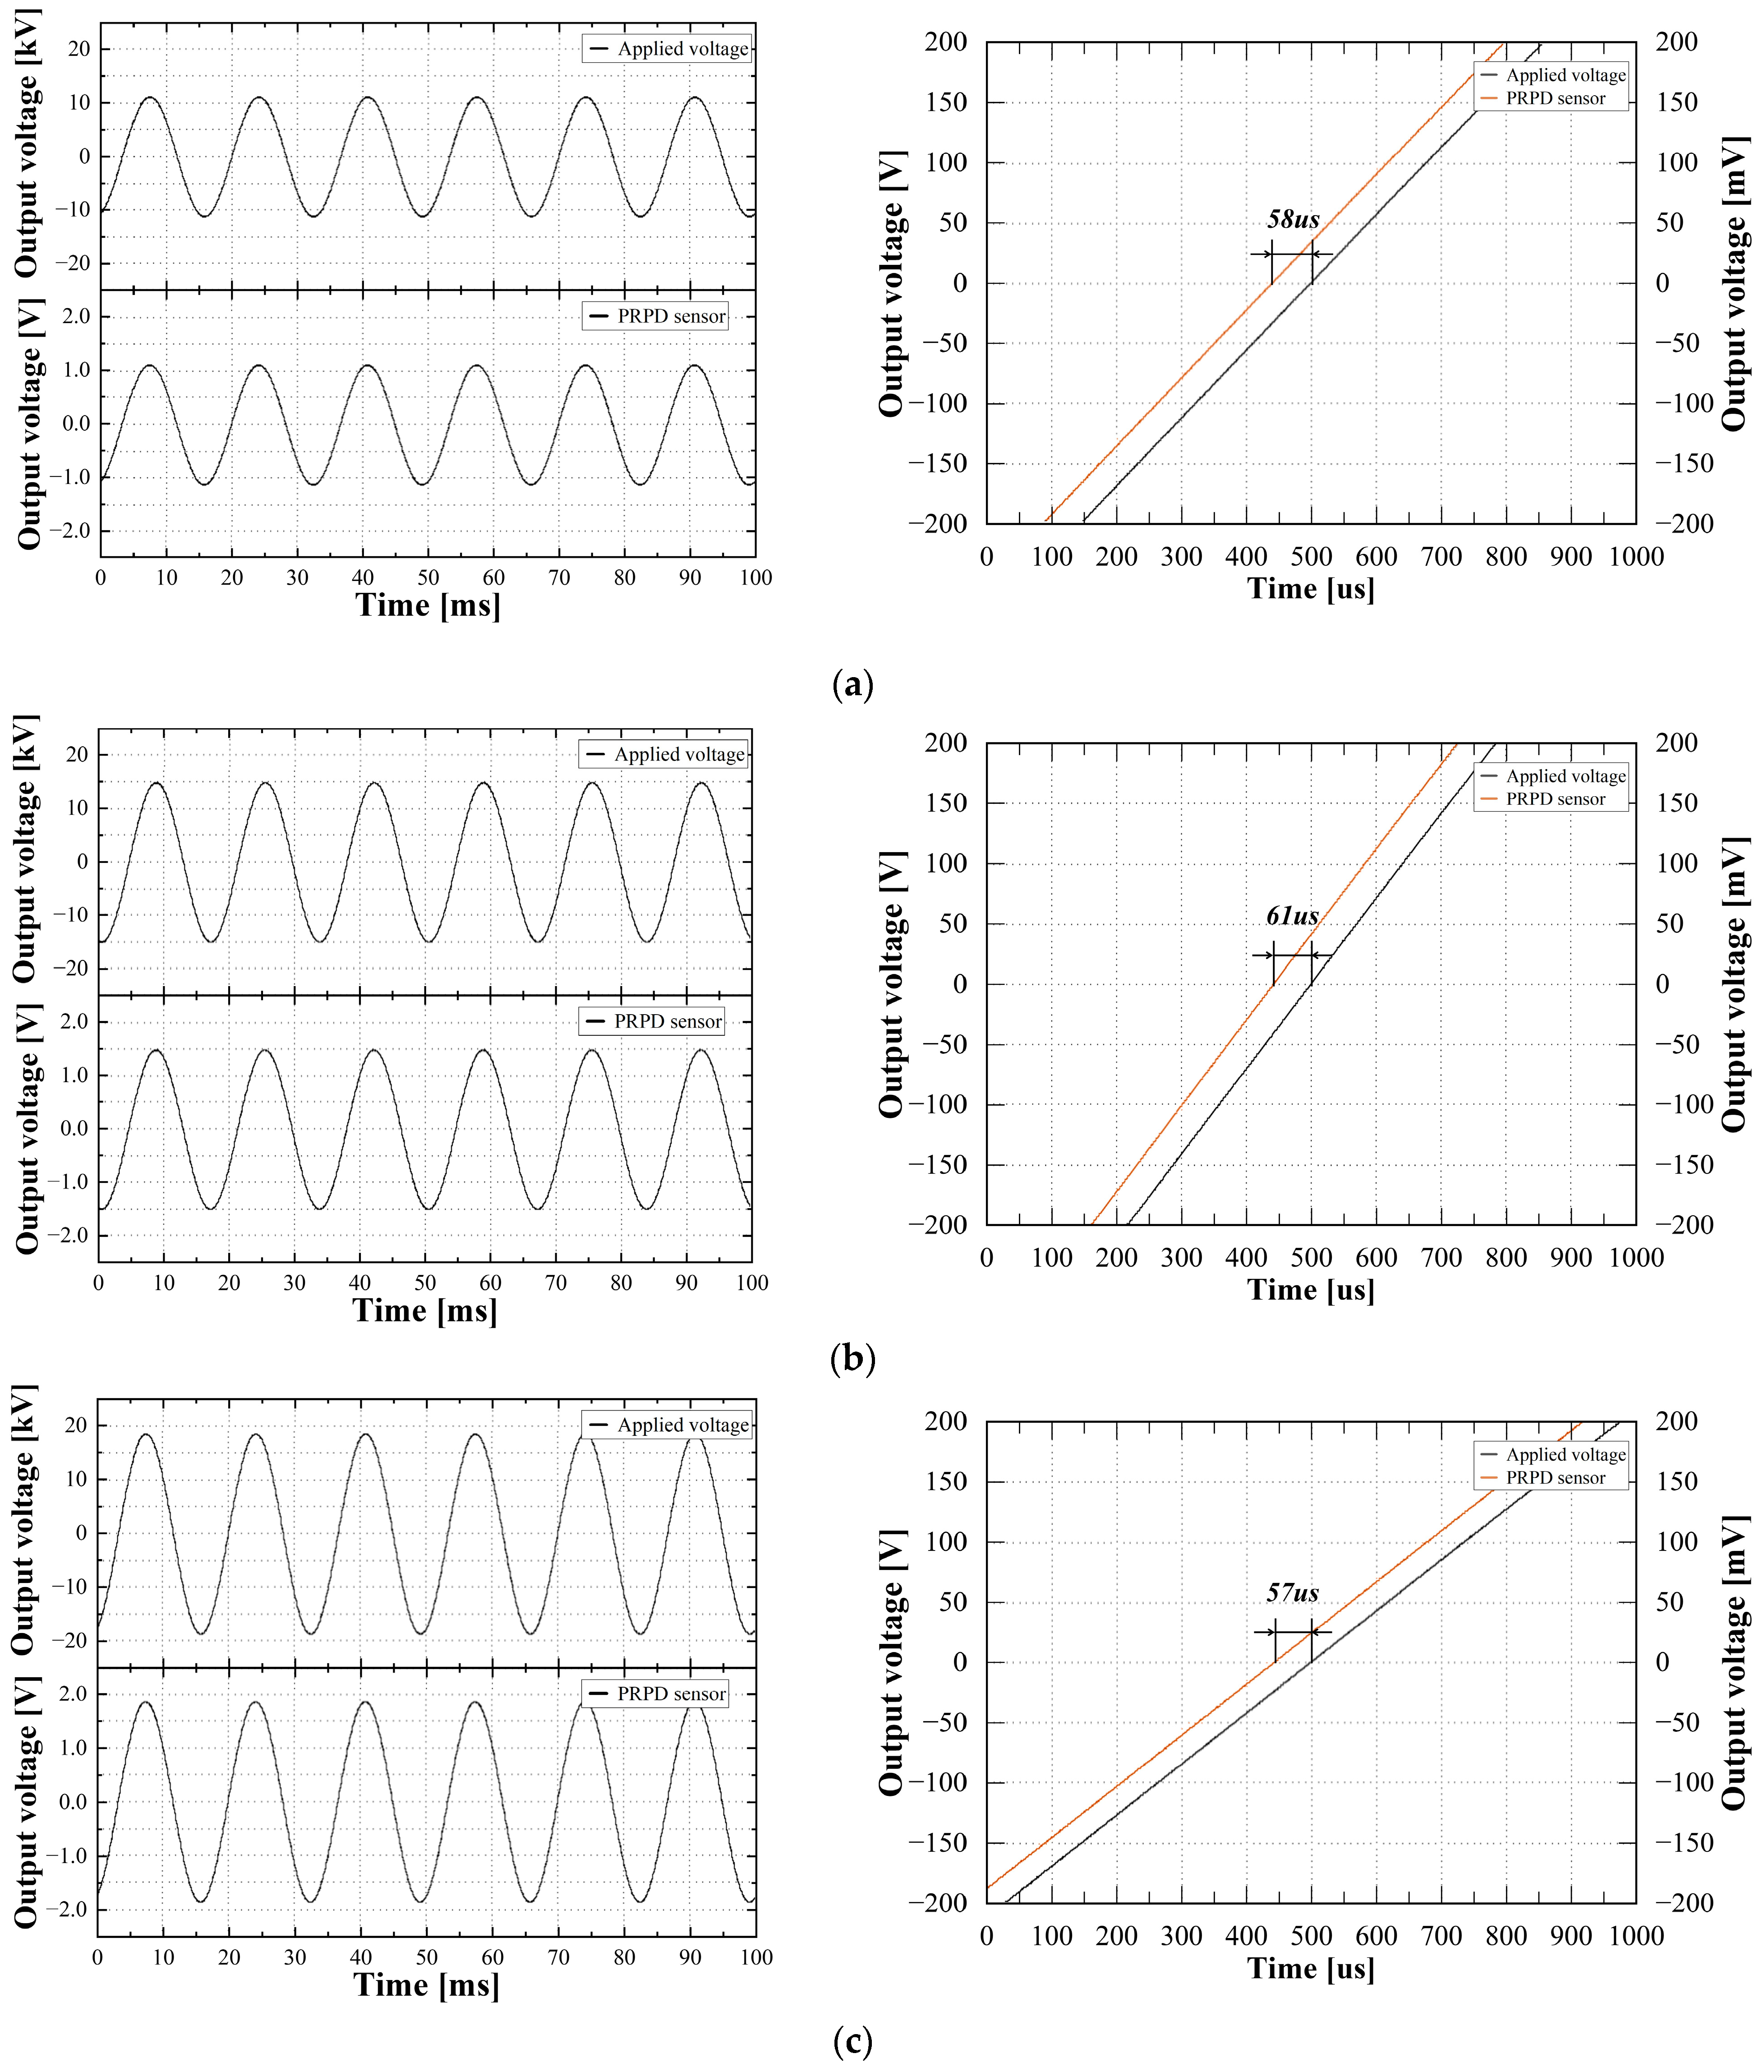
- Voltage measurementThe evaluation of voltage measurement accuracy was focused on the deviation of the output magnitude and phase among the applied voltage and PRPD sensor. The designed rated transformation ratio was 10,000:1. The correction factor and corrected phase offset were set to be 1.000 and 76 min. The maximum corrected error ratio and corrected phase error were 0.126% and +3.06 min, respectively, and they were commonly detected at 100% of the rated voltage.
- B.
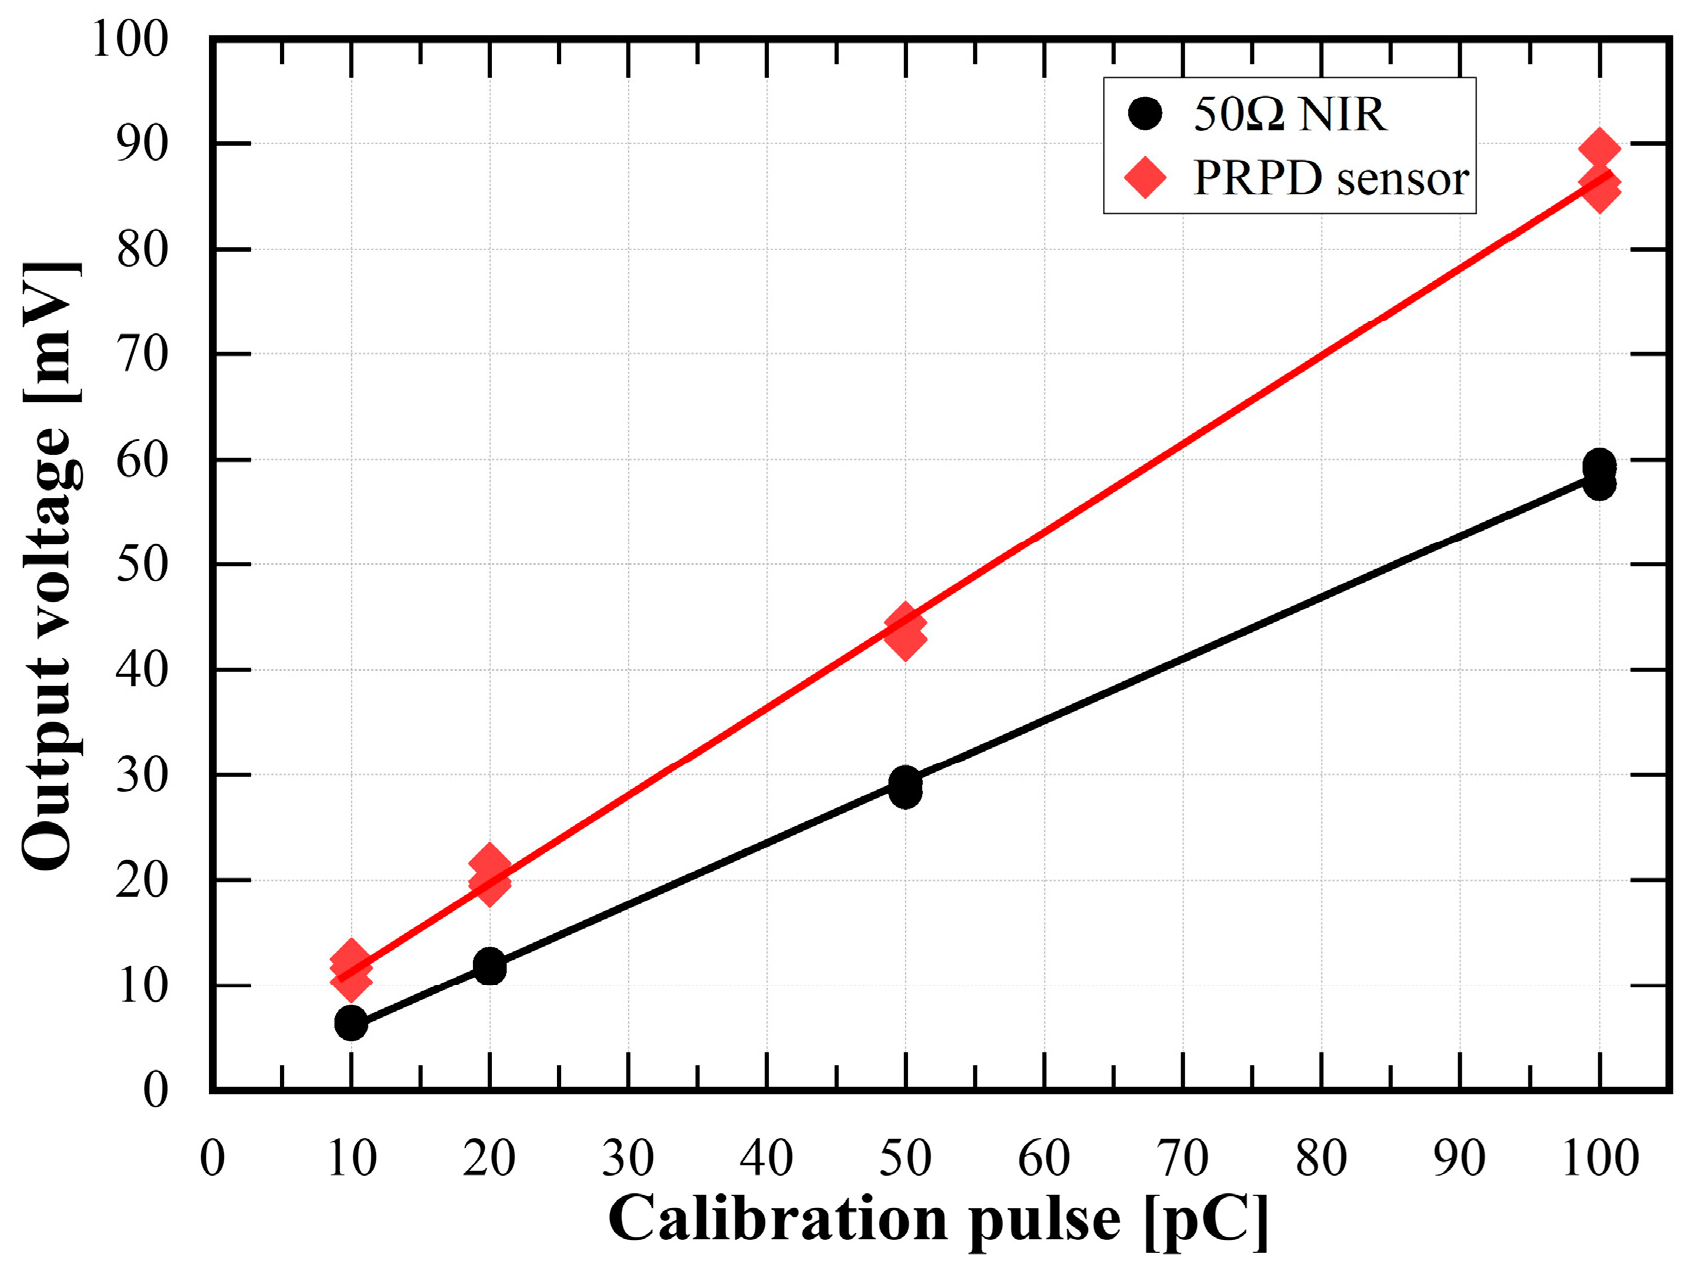
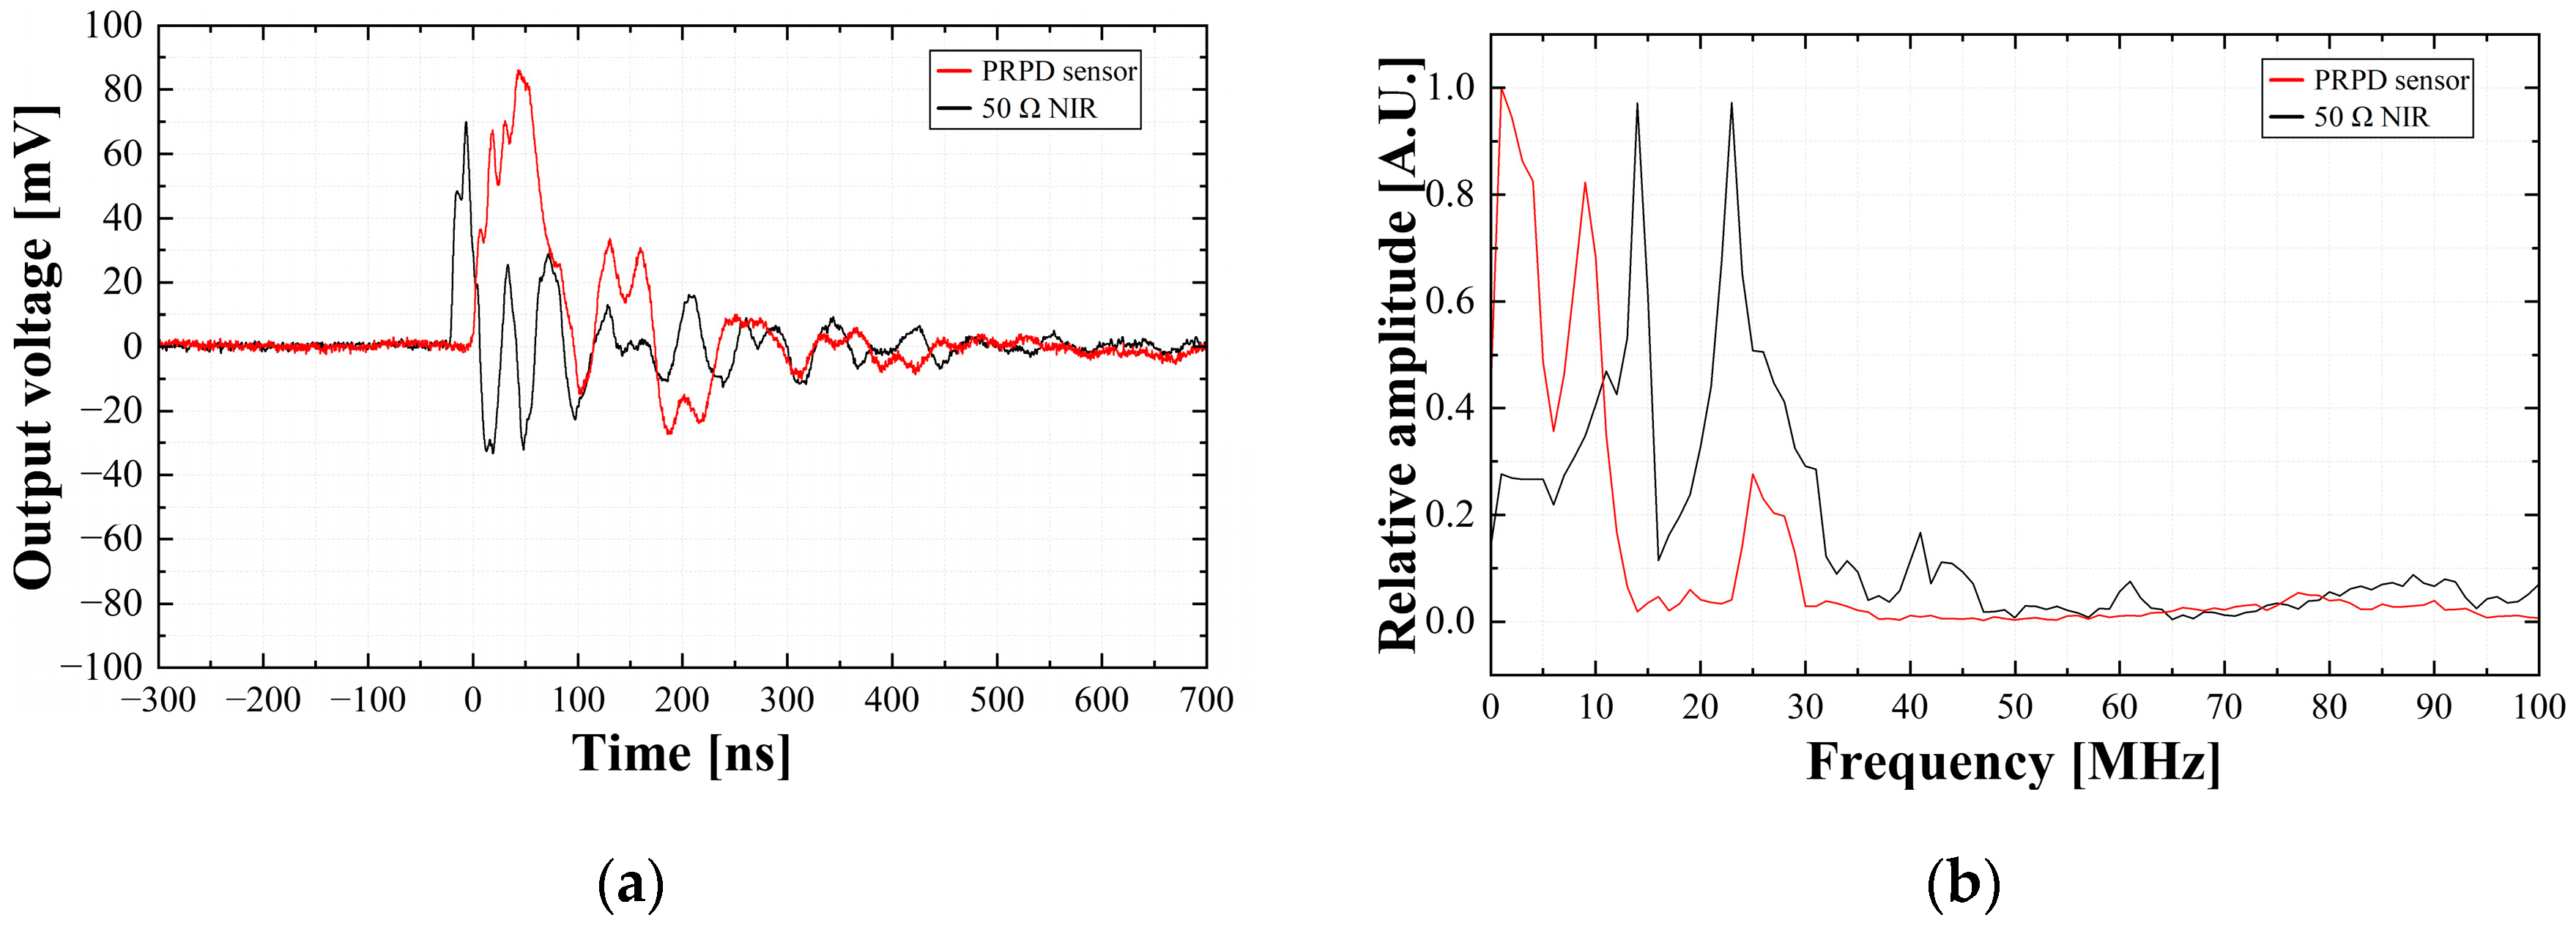
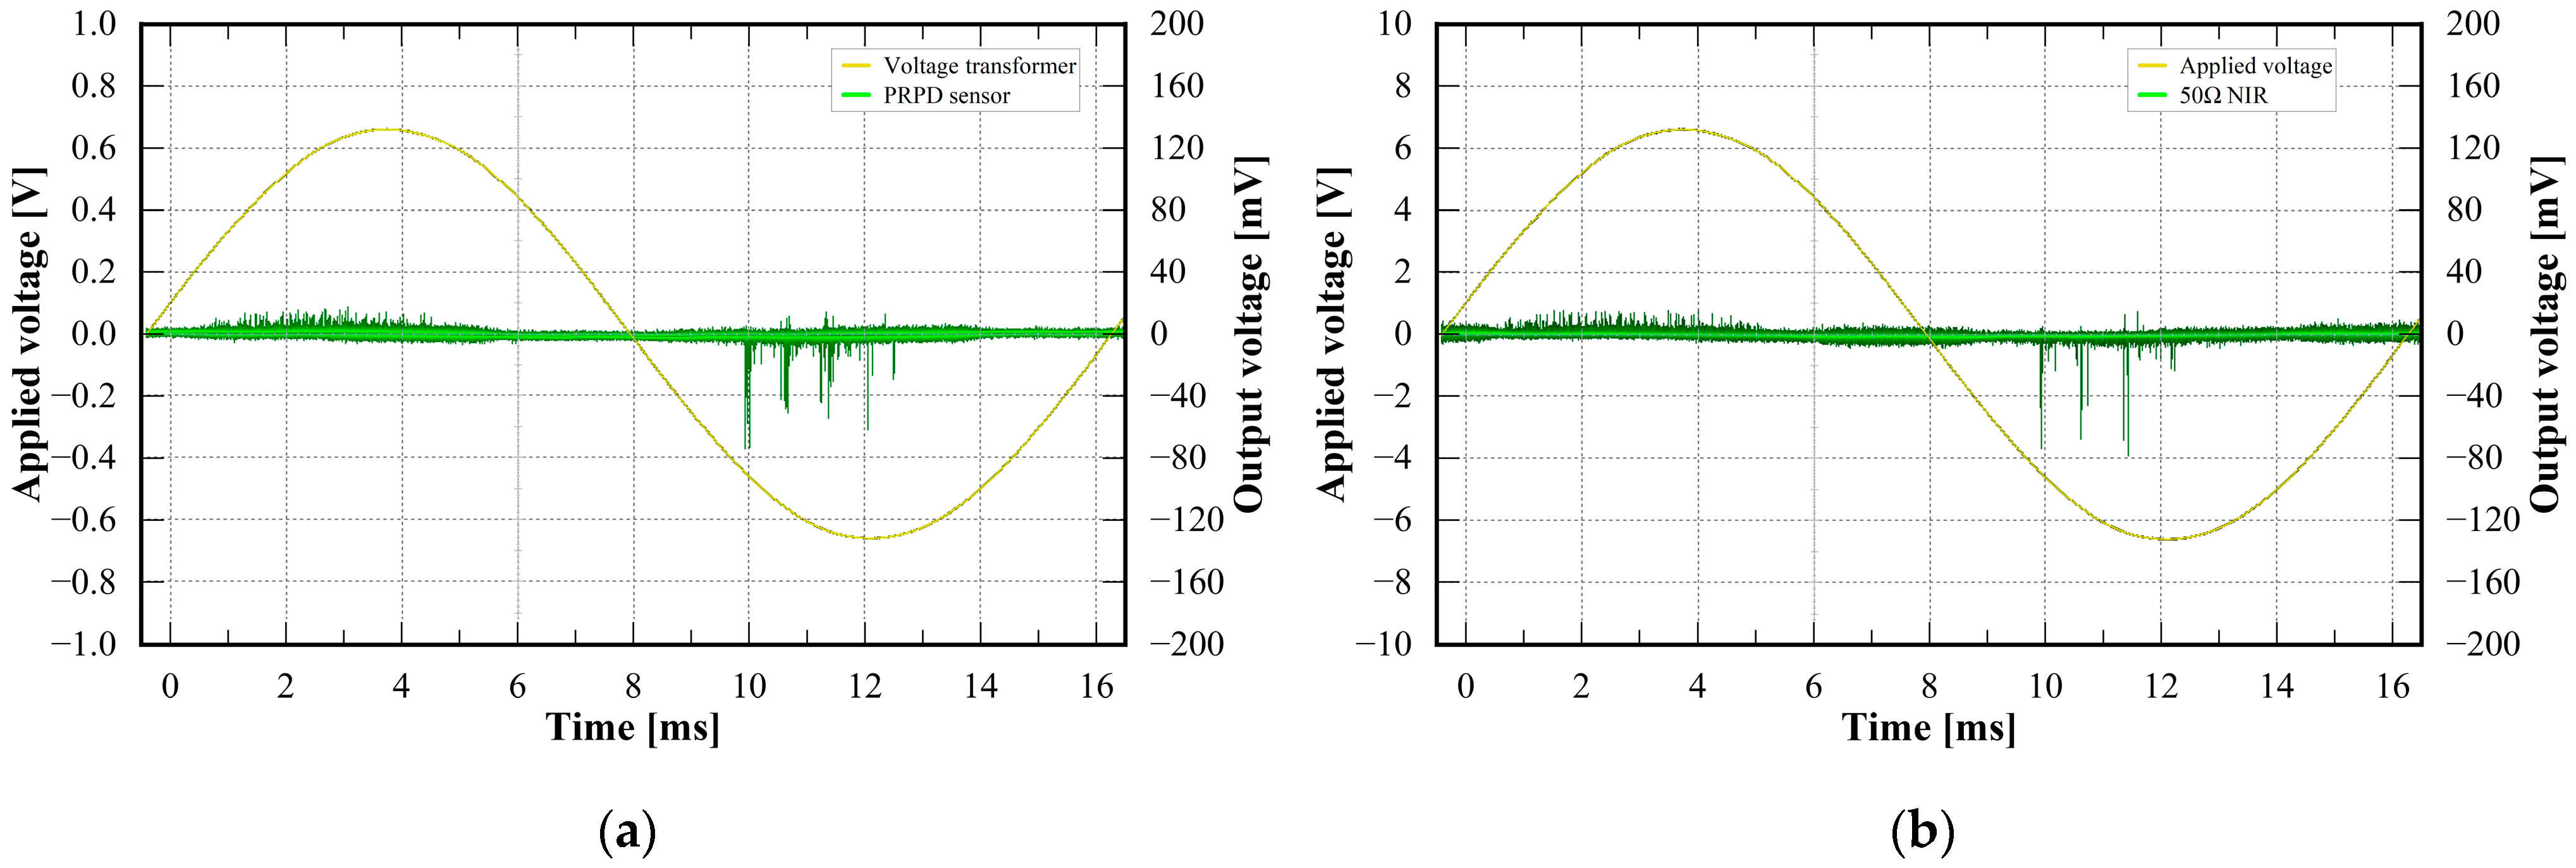
- PD detectionThe prototype PRPD sensor was linear to the artificial PD calibration pulses. Alongside that, the outputs of the PRPD sensor were approximately 1.5 times larger than those of the conventional electrical detection method via a 50 Ω NIR. Regarding the time and frequency domains, the rising time of the PD pulse was relatively longer than the falling time, and the maximum magnitude was analyzed in the frequency range of about 24 MHz. The prototype PRPD sensor was able to detect the PRPD patterns phase-synchronized with the applied voltage signal successfully. The phase ranges of the PD pulses detected by the PRPD sensor were almost the same as those detected using the conventional method.
Author Contributions
Funding
Informed Consent Statement
Data Availability Statement
Conflicts of Interest
Abbreviations and Physical Quantities
| Abbreviations | Full Name | ||
| PRPD | Phase-resolved partial discharge | ||
| PD | Partial discharge | ||
| PCB | Printed circuit board | ||
| CVD | Capacitive voltage divider | ||
| HFCT | High-frequency current transformer | ||
| UHF | Ultra-high frequency | ||
| AE | Acoustic emission | ||
| S/N | Signal-to-noise ratio | ||
| PT | Potential transformer | ||
| CPT | Capacitive potential transformer | ||
| RPT | Resistive potential transformer | ||
| LPVT | Low-power voltage transformer | ||
| IEC | International Electrotechnical Commission | ||
| SAMU | Stand-alone merging unit | ||
| EVT | Electronic voltage transformer | ||
| TL | Transmission line | ||
| EM | Electromagnetic | ||
| VT | Voltage transformer | ||
| Tg-type | High glass transition temperature | ||
| GDT | Gas discharge tube | ||
| HPF | High-pass filter | ||
| IVR | Induction-type automatic voltage regulator | ||
| NIR | Non-inductive resistor | ||
| DSO | Digital storage oscilloscope | ||
| HV Tr. | High-voltage transformer | ||
| HV divider | High-voltage divider | ||
| ZC | Zero-crossing | ||
| FFT | Fast Fourier transform | ||
| Physical quantities | Symbols | Definitions | Units |
| Corrected ratio error | Ratio error of an individual passive LPVT corrected by the factor | ±% | |
| Correction factor | Factor by which the rated transformation ratio evaluated at rated burden and rated frequency of an individual passive LPVT is to be multiplied to achieve the specified accuracy class | - | |
| Rated transformation ratio | Ratio of output voltage to the input voltage of the passive LPVT | - | |
| Phase offset correction | Value to be added to the rated phase offset evaluated at rated burden and rated frequency of an individual passive LPVT to achieve the specified accuracy class | ±Minutes ±Centiradians | |
| Corrected phase error | Phase error of an individual passive LPVT corrected by the value | ±Minutes ±Centiradians | |
| Corrected phase offset | individual phase offset of a passive LPVT | ±Minutes ±Centiradians | |
References
- Pietsch, R.; Hauschild, W. High-voltage On-site Testing with Partial Discharge Measurement. CIGRE Tech. Broch. 2012, 502, 83–93. [Google Scholar]
- Chai, H.; Phung, B.T.; Mitchell, S. Application of UHF Sensors in Power System Equipment for Partial Discharge Detection: A Review. Sensors 2019, 19, 1029. [Google Scholar] [CrossRef]
- IEC 60270; High-Voltage Test Techniques–Partial Discharge Measurements. International Electrotechnical Commission: Genova, Switzerland, 2000.
- Kreuger, F.H. Partial Discharge Detection in High Voltage Equipment. Butterworth 1989, 129, 152. [Google Scholar]
- Liu, J.; Zhang, G.; Dong, J.; Wang, J. Study on Miniaturized UHF Antennas for Partial Discharge Detection in High-Voltage Electrical Equipment. Sensors 2015, 15, 29434–29451. [Google Scholar] [CrossRef]
- Gulski, E.; Koltunowicz, W.; Ariaans, T.; Behrmann, G.; Jongen, R.; Garnacho, F.; Kornhuber, S.; Ohtsuka, S.; Petzold, F.; Sánchez-Urán, M.A.; et al. Guidelines for Partial Discharge Detection using Conventional (IEC60270) and Unconventional Methods; CIGRE WG D1.37; CIGRE: Paris, France, 2016. [Google Scholar]
- Wu, M.; Cao, H.; Cao, J.; Nguyen, H.L.; Gomes, J.B.; Krishnaswamy, S.P. An overview of state-of-the-art partial discharge analysis techniques for condition monitoring. IEEE Electr. Insul. Mag. 2015, 31, 22–35. [Google Scholar] [CrossRef]
- Wang, X.; Li, X.; Rong, M.; Xie, D.; Ding, D.; Wang, Z. UHF Signal Processing and Pattern Recognition of Partial Discharge in Gas-Insulated Switchgear Using Chromatic Methodology. Sensors 2017, 17, 177. [Google Scholar] [CrossRef]
- Schichler, U.; Koltunowicz, W.; Gautschi, D.; Girodet, A.; Hama, H.; Juhre, K.; Lopez-Roldan, J.; Okabe, S.; Neuhold, S.; Neumann, C.; et al. UHF Partial Discharge Detection System for GIS: Application Guide for Sensitivity Verification. IEEE Trans. Dielectr. Electr. Insul. 2016, 23, 1313–1321. [Google Scholar] [CrossRef]
- Reuters, M.; Templeton, D.; Beck, M.; Bélec, M.; Dullni, E.; Hoek, S.; Jung, J.-R.; Kyrkjeeide, S.; Lefter, Z.; Linn, T.; et al. Benefits of PD Diagnosis on GIS Condition Assessment; CIGRE WG B3.24; CIGRE: Paris, France, 2017. [Google Scholar]
- Kim, S.W.; Kim, N.H.; Kim, D.E.; Kim, T.H.; Jeong, D.H.; Chung, Y.H.; Kil, G.S. Experimental Validation for Moving Particle Detection Using Acoustic Emission Method. Energies 2021, 14, 8516. [Google Scholar] [CrossRef]
- Lundgaard, L.; Skyberg, B.; Schei, A.; Diessner, A. Method and instrumentation for acoustic diagnoses of GIS. CIGRE Session. 2000, 15, 309. [Google Scholar]
- Mondal, M.; Kumbhar, G.B. Partial Discharge Localization in a Power Transformer: Methods, Trends, and Future Research. IETE Tech. Rev. 2017, 34, 504–513. [Google Scholar] [CrossRef]
- de Castro, B.A.; dos Santos, V.V.; Lucas, G.B.; Ardila-Rey, J.A.; Riehl, R.R.; Andreoli, A.L. A Comparative Analysis Applied to the Partial Discharges Identification in Dry-Type Transformers by Hall and Acoustic Emission Sensors. Sensors 2022, 22, 1716. [Google Scholar] [CrossRef]
- Sikorski, W.; Wielewski, A. Low-Cost Online Partial Discharge Monitoring System for Power Transformers. Sensors 2023, 23, 3405. [Google Scholar] [CrossRef]
- Shin, G.C.; Kim, S.W.; Kil, G.S. Comparison between the PD Characteristics of g3 and Dry Air for Gas-Insulated Switchgears. Energies 2022, 15, 7043. [Google Scholar] [CrossRef]
- Bozzo, R.; Centurioni, L.; Guastavino, F. Measuring the Endurance of Films in Partial Discharges. IEEE Trans. Dielectr. Electr. Insul. 1993, 28, 1050–1056. [Google Scholar] [CrossRef]
- Lu, Z.; Li, Z.; Lu, S.; Xu, M.; Liu, W. Fault Mechanism Analysis of Voltage Transformer Caused by Iron Core Saturation. In Proceedings of the 2022 IEEE 6th Advanced Information Technology, Electronic and Automation Control Conference (IAEAC), Beijing, China, 3–5 October 2022; pp. 856–859. [Google Scholar] [CrossRef]
- Xiao, Y.; Fu, J.; Hu, B.; Li, X.; Deng, C. Problems of voltage transducer in harmonic measurement. IEEE Trans. Pow. Deliv. 2004, 19, 1483–1487. [Google Scholar] [CrossRef]
- Mingotti, A.; Costa, F.; Pasini, G.; Peretto, L.; Tinarelli, R. Modeling Capacitive Low-Power Voltage Transformer Behavior over Temperature and Frequency. Sensors 2021, 21, 1719. [Google Scholar] [CrossRef]
- IEC 61869-11; Instrument Transformers—Part 11: Additional Requirements for Low-Power Passive Voltage Transformers. International Electrotechnical Commission: Genova, Switzerland, 2017.
- IEC 60044-7; Instrument Transformers—Part 7: Electronic Voltage Transformers. International Electrotechnical Commission: Genova, Switzerland, 1999.
- IEC 61869-13; Instrument Transformers—Part 13: Stand-Alone Merging Unit (SAMU). International Electrotechnical Commission: Genova, Switzerland, 2021.
- Wagoner, T.C.; Stygar, W.A.; Ives, H.C.; Gilliland, T.L.; Spielman, R.B.; Johnson, M.F.; Reynolds, P.G.; Moore, J.K.; Mourning, R.L.; Fehl, D.L.; et al. Differential-output B-dot and D-dot monitors for current and voltage measurements on a 20-MA, 3-MV pulsed-power accelerator. Phys. Rev. Spec. Top. Accel. Beams 2008, 11, 100401. [Google Scholar] [CrossRef]
- Wang, J.; Ban, S.; Yang, Y. A Differential Self-Integration D-Dot Voltage Sensor and Experimental Research. IEEE Sens. J. 2015, 7, 3846–3852. [Google Scholar] [CrossRef]
- Kim, N.H.; Kim, D.E.; Kim, S.W.; Kim, J.H.; Kil, G.S. Development of Electronic Voltage Transformer for Electric Rolling Stocks. J. Korean Soc. Railw. 2023, 26, 445–453. [Google Scholar] [CrossRef]
- Wang, J.; Gao, C.; Yang, J. Design, Experiments and Simulation of Voltage Transformers on the Basis of a Differential Input D-dot Sensor. Sensors 2014, 14, 12771–12783. [Google Scholar] [CrossRef]
- Yao, L.; Huang, J.; Kang, N.; Shen, T.; Liu, D.; Zhang, F.; Sun, H. Compensation of the offset in numerical integration of a D-dot sensor measurement. In Proceedings of the 2014 3rd Asia-Pacific Conference on Antennas and Propagation, Harbin, China, 26–29 July 2014; pp. 898–901. [Google Scholar] [CrossRef]
- Hussain, G.A.; Shafiq, M.; Lehtonen, M.; Hashmi, M. Online Condition Monitoring of MV Switchgear Using D-Dot Sensor to Predict Arc-Faults. IEEE Sens. J. 2015, 15, 7262–7272. [Google Scholar] [CrossRef]
- Hussain, G.A.; Amjad, G.; Zaher, A.A.; Hummes, D.; Safdar, M.; Lehtonen, M. Hybrid Sensing of Internal and Surface Partial Discharges in Air-Insulated Medium Voltage Switchgear. Energies 2020, 13, 1738. [Google Scholar] [CrossRef]
- Rostaghi-Chalaki, M.; Yousefpour, K.; Donohoe, J.P.; Kurum, M.; Park, C.; Klss, J. Design of Transmission Line and Electromagnetic Field Sensors for DC Partial Discharge Analysis. IEEE Trans Dielectr. Electr. Insul. 2020, 27, 2138–2146. [Google Scholar] [CrossRef]
- Jin, M.; Li, H.; Liu, S. Identification and Compensation for D-Dot Measurement System in Transient Electromagnetic Pulse Measurement. Sensors 2022, 22, 8538. [Google Scholar] [CrossRef]
- Kim, S.W.; Jung, J.R.; Kim, Y.M.; Kil, G.S.; Wang, G. New Diagnosis Method of Unknown Phase-shifted PD Signals for Gas Insulated Switchgears. IEEE Trans Dielectr. Electr. Insul. 2018, 25, 102–109. [Google Scholar] [CrossRef]
- Lee, J.H.; Hozumi, N.; Okamoto, T. Discrimination of phase-shifted partial discharge patterns by neural network using standardization method. In Proceedings of the 1994 IEEE International Symposium on Electrical Insulation, Pittsburgh, PA, USA, 5–8 June 1994; pp. 314–317. [Google Scholar] [CrossRef]
- Boggs, S.; Pathak, A.; Walker, P. Partial discharge. XXII. High frequency attenuation in shielded solid dielectric power cable and implications thereof for PD location. IEEE Electr. Insul. Mag. 1996, 12, 9–16. [Google Scholar] [CrossRef]
- Yifan, Z.; Wang, Y.; Wang, W. A study on the propagation characteristics of partial discharge in cable joints based on the FDTD method. IEEE Access 2020, 8, 130094–130103. [Google Scholar]


| Parameter | Value | |
|---|---|---|
| Diameter | Φ 160 mm | |
| Height | 12 mm | |
| Sensing electrodes (Voltage and PD) | Width | 3 mm |
| Thickness | 1 ounce (oz) | |
| Insulation layer | 0.2 mm | |
| Dielectric constant () | 4.7 | |
| Voltage Level | Applied Voltage [kV] | PRPD Sensor [V] | Corrected Error Ratio [%] | Corrected Phase Error [min] | ||
|---|---|---|---|---|---|---|
| Measured Value | Accuracy Class of 0.2 | Measured Value | Accuracy Class of 0.2 | |||
| 10.561 | 1.056 | 0.001 | 0.2 | −0.83 | 10 | |
| 13.204 | 1.322 | 0.126 | +3.06 | |||
| 15.803 | 1.583 | 0.166 | −2.13 | |||
Disclaimer/Publisher’s Note: The statements, opinions and data contained in all publications are solely those of the individual author(s) and contributor(s) and not of MDPI and/or the editor(s). MDPI and/or the editor(s) disclaim responsibility for any injury to people or property resulting from any ideas, methods, instructions or products referred to in the content. |
© 2023 by the authors. Licensee MDPI, Basel, Switzerland. This article is an open access article distributed under the terms and conditions of the Creative Commons Attribution (CC BY) license (https://creativecommons.org/licenses/by/4.0/).
Share and Cite
Lee, G.-Y.; Kim, N.-H.; Kim, D.-E.; Kil, G.-S.; Kim, S.-W. The Design, Fabrication, and Evaluation of a Phase-Resolved Partial Discharge Sensor Embedded in a MV-Class Bushing. Sensors 2023, 23, 9844. https://doi.org/10.3390/s23249844
Lee G-Y, Kim N-H, Kim D-E, Kil G-S, Kim S-W. The Design, Fabrication, and Evaluation of a Phase-Resolved Partial Discharge Sensor Embedded in a MV-Class Bushing. Sensors. 2023; 23(24):9844. https://doi.org/10.3390/s23249844
Chicago/Turabian StyleLee, Gyeong-Yeol, Nam-Hoon Kim, Dong-Eon Kim, Gyung-Suk Kil, and Sung-Wook Kim. 2023. "The Design, Fabrication, and Evaluation of a Phase-Resolved Partial Discharge Sensor Embedded in a MV-Class Bushing" Sensors 23, no. 24: 9844. https://doi.org/10.3390/s23249844