Article

Path Loss Characterization in an Outdoor Corridor Environment for IoT-5G in a Smart Campus University at 850 MHz and 3.5 GHz Frequency Bands

1
Telecommunications Research Group, Pedagogical and Technological University of Colombia, Sogamoso 152211, Colombia
2
Antennas and Propagation Lab, iTEAM Research Institute, Universitat Politècnica de València, 46022 Valencia, Spain
*
Author to whom correspondence should be addressed.
Sensors 2023, 23(22), 9237; https://doi.org/10.3390/s23229237
Submission received: 23 August 2023 / Revised: 25 September 2023 / Accepted: 3 November 2023 / Published: 17 November 2023
(This article belongs to the Special Issue Internet of Things for Smart City Application)

Abstract

:
The usage scenarios defined in the ITU-M2150-1 recommendation for IMT-2020 systems, including enhanced Mobile Broadband (eMBB), Ultra-reliable Low-latency Communication (URLLC), and massive Machine Type Communication (mMTC), allow the possibility of accessing different services through the set of Radio Interface Technologies (RITs), Long-term Evolution (LTE), and New Radio (NR), which are components of RIT. The potential of the low and medium frequency bands allocated by the Federal Communications Commission (FCC) for the fifth generation of mobile communications (5G) is described. In addition, in the Internet of Things (IoT) applications that will be covered by the case of use of the mMTC are framed. In this sense, a propagation channel measurement campaign was carried out at 850 MHz and 5.9 GHz in a covered corridor environment, located in an open space within the facilities of the Pedagogical and Technological University of Colombia campus. The measurements were carried out in the time domain using a channel sounder based on a Universal Software Radio Peripheral (USRP) to obtain the received signal power levels over a range of separation distances between the transmitter and receiver from 2.00 m to 67.5 m. Then, a link budget was proposed to describe the path loss behavior as a function of these distances to obtain the parameters for the close-in free space reference distance (CI) and the floating intercept (FI) path loss prediction models. These parameters were estimated from the measurements made using the Minimum Mean Square Error (MMSE) approach. The estimated path loss exponent (PLE) values for both the CI and FI path loss models at 850 MHz and 3.5 GHz are in the range of 2.21 to 2.41, respectively. This shows that the multipath effect causes a lack of constructive interference to the received power signal for this type of outdoor corridor scenario. These results can be used in simulation tools to evaluate the path loss behavior and optimize the deployment of device and sensor network infrastructure to enable 5G-IoT connectivity in smart university campus scenarios.

1. Introduction

The massive deployment of fifth-generation (5G) cellular networks and their integration with the deployment of the Internet of Things (IoT) has led to a significant increase in the amount of wireless traffic. This is due to the potential of IoT-focused applications such as augmented reality, autonomous driving, telemedicine, and high-definition video. This creates a need for a broadband spectrum with the capacity to handle this huge traffic demand. To provide additional spectrum for 5G services, the Federal Communications Commission (FCC) has proposed the low-frequency bands below 1 GHz, the mid-frequency bands from 1 GHz to 6 GHz, and the high-frequency bands, mmWave [1]. To be sure, 5G Americas [2] is a review of 5G spectrum considerations for the Americas, Europe, East Asia, and Australia. The review discusses the characteristics, challenges, opportunities, and identification of the potential of the low, medium, and high-frequency bands for the 5G services. The International Telecommunication Union (ITU), through the ITU-R M.2150-1 recommendation defines the radio interface specifications for the terrestrial component of the International Mobile Technologies 2020 (IMT-2020). The ITU details the characteristics and parameters to achieve global compatibility, international roaming, and access to services in the use environments: Indoor Hotspot (InH)—enhanced Mobile Broadband (eMBB); Dense Urban (DU)—eMBB; Rural (R)—eMBB; Urban Macrocell (UMa)—Ultra-reliable Low-latency Communication (URLLC), and UMa—massive Machine Type Communication (mMTC) [3].
A university campus IoT scenario consists of applications that create a smart environment, such as a smart office, smart transport, smart research laboratory, smart campus corridor, smart sports, and smart library; see Figure 1. These spaces allow access to all services with less effort and time. This smart system will need to interact with the environment around it. It therefore requires an automated 5G infrastructure where all devices and sensors are connected. One of the main challenges in deploying this infrastructure is to carry out propagation channel measurement campaigns to generate path loss models that predict propagation loss behavior for the optimal deployment of device and sensor networks in 5G-IoT ecosystems. Likewise, for the integration of technologies such as Low-power Wide Area Networks (LPWAN) and Low-power Wireless Sensor Networks (LPWSN) [4]. As a result, the goals set for 5G networks such as large bandwidths, higher data rates, massive connectivity, low end-to-end latency, cost-effectiveness, consistent quality of service, device computational capabilities, and device intelligent services [5] will be achieved.
Some groups of researchers have been proposing path loss models in the mmWave band for 5G networks. In [6], the authors compile and compare the path loss models for UMa, Urban Microcell (UMi), InH mixed, and open office in Line-of-Sight (LOS) and Non-LOS (NLOS) propagation conditions scenarios, which were developed by some groups and organizations. In [7], the path loss results obtained experimentally in an office environment in the 25–40 GHz frequency band under LOS and Obstructed LOS (OLOS) conditions are considered. Similarly, some researchers have performed propagation channel measurements to analyze path loss models in corridor environments [8,9,10,11]. However, very few studies have focused their efforts on generating path loss models in the medium and low-frequency bands of 5G for corridor environments [12,13]. In this study, an extensive measurement campaign was carried out in a covered corridor environment to obtain the received signal power levels. This data set has allowed the estimation of path loss exponent (PLE) values for the close-in free space reference distance (CI) and the floating-intercept (FI) path loss prediction models at 850 MHz and 3.5 GHz. These PLE values can be used in simulation tools to evaluate the propagation loss behavior and optimize the implementation of device and sensor network infrastructure to enable IoT-5G connectivity in smart campus scenarios. These are scenarios where students have access to all IoT applications through the infrastructure of 5G cellular networks, as shown in Figure 2.
The paper is organized as follows: Section 2 describes the propagation environment and the equipment and measurement setup. Section 3 presents a brief description of the CI and FI path loss prediction models. Section 4 presents the results of the models with their corresponding metrics, as well as a comparison with the results that have been obtained in this type of environment. Finally, the conclusions are presented in Section 5.

2. Measurements Campaign

The applications that make up the IoT ecosystem generate a large demand for traffic. Therefore, broadband spectrum is required for the 5G cellular networks to provide access to the use cases defined in the ITU-M2150-1 recommendation. To achieve this, the authors in [2] propose combining the spectrum between the low, mid, and high bands to successfully enable 5G-IoT interaction. Similarly, the potential of the new mid-band and extended mid-band spectrum for 5G cellular networks is shown in [14]. Table 1 shows some services related to the 5G use cases and their corresponding spectrum and coverage.
The 5G use cases offer the possibility to access different services through the IMT-2020 specifications. These specifications are a set of Radio Interface Technologies (RITs). For example, Long-term Evolution (LTE) and New Radio (NR), both components of RIT, have been developed by the 3rd Generation Partnership Project (3GPP) and use frequency bands below 6 GHz. The NR can also use the frequency bands above 6 GHz. LTE RIT uses Frequency Division Duplex (FDD) and Time Division Duplex (TDD), supporting transmission bandwidths from 1.4 MHz to 640 MHz and peak data rates of up to 32 Gbps in the downlink (DL) and 13.6 Gbps in the uplink (UL). The DL transmission scheme is also based on Orthogonal Frequency Division Multiplexing (OFDM) and the UL transmission scheme is based on Discrete Fourier Transform Spread OFDM (DFTS-OFDM). The NR RIT uses FDD and TDD and supports channel bandwidths up to 400 MHz and peak data rates up to 140 Gbps in DL and 65 Gbps in UL. LTE RTI also includes multi-antenna transmission schemes. This enables support for enhanced MTC (eMTC), Narrow-band Internet of Things (NB-IoT), and Multicast Broadcast Multimedia Service (MBMS) with modulation schemes in DL up to 1024QAM in the case of LTE RIT and QPSK for NB-IoT, with up to 200 kHz bandwidth. In addition, eMTC and NB-IoT have extended the original LTE coverage area by ~15 dB and ~20 dB, respectively. The NR RIT supports eMMB, URLLC, Industrial IoT (IIoT), V2X, private networks, and others. NR RIT supports in-band coexistence with NB-IoT and eMTC [3].

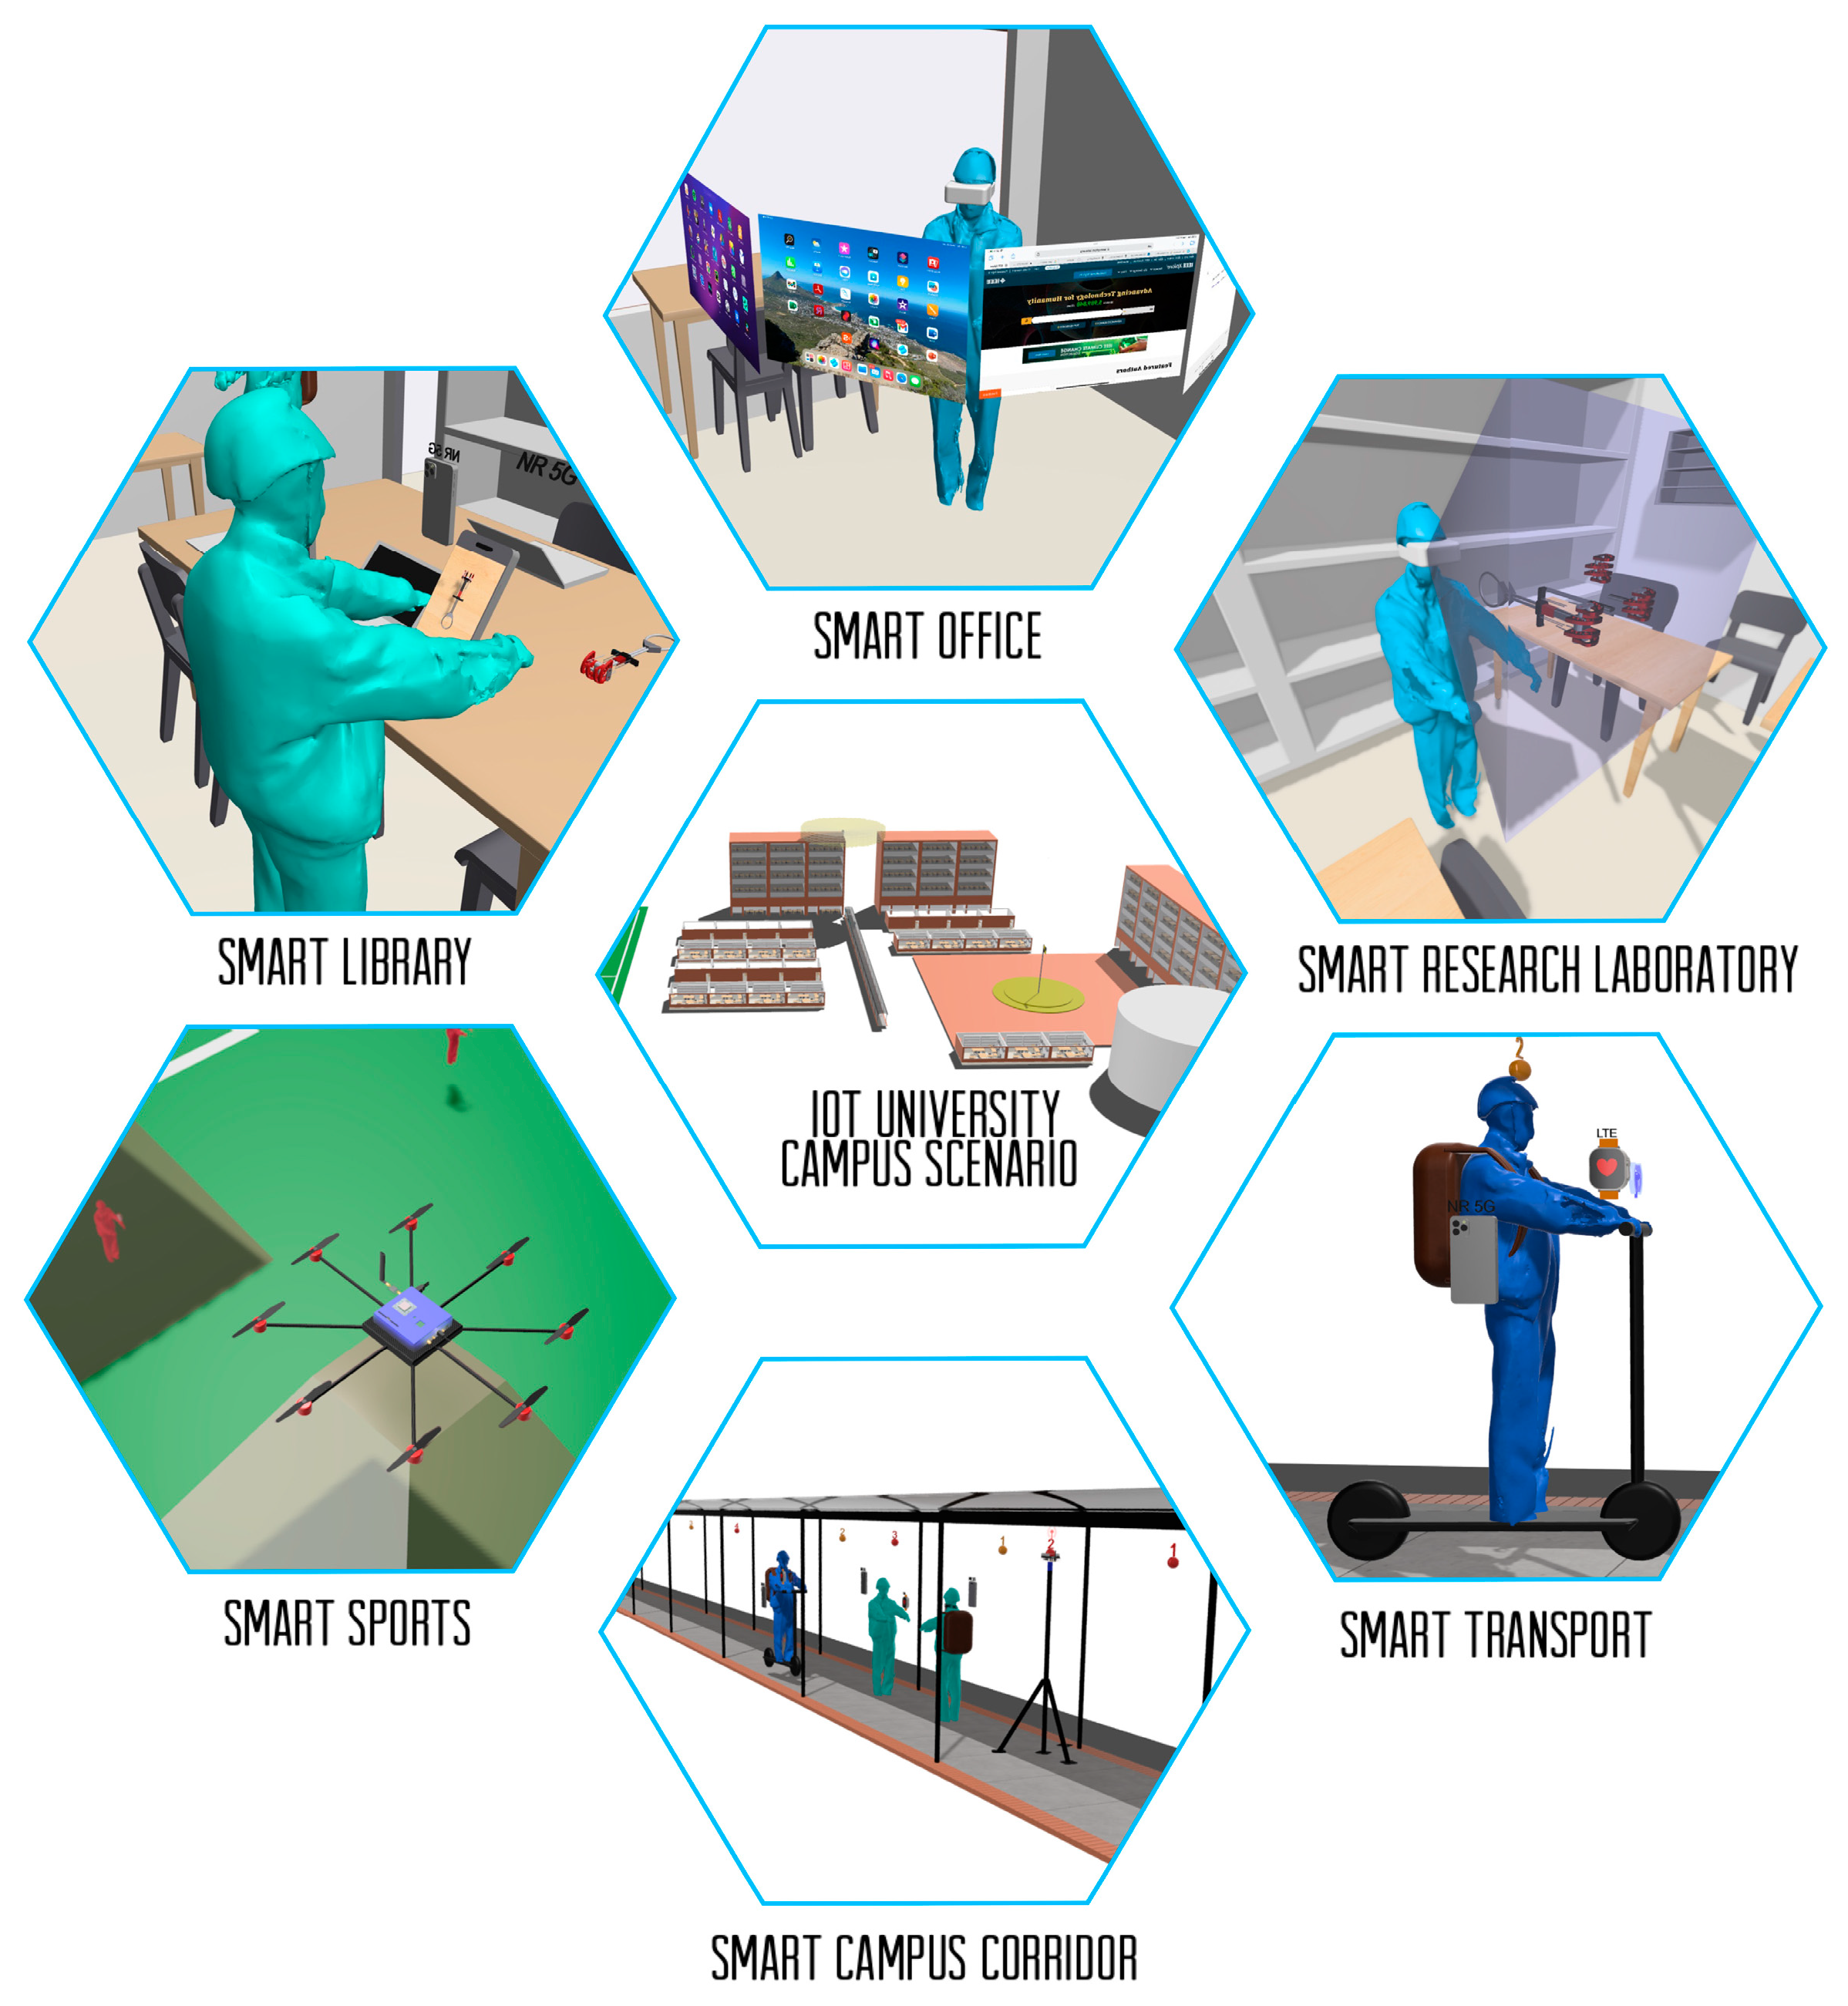
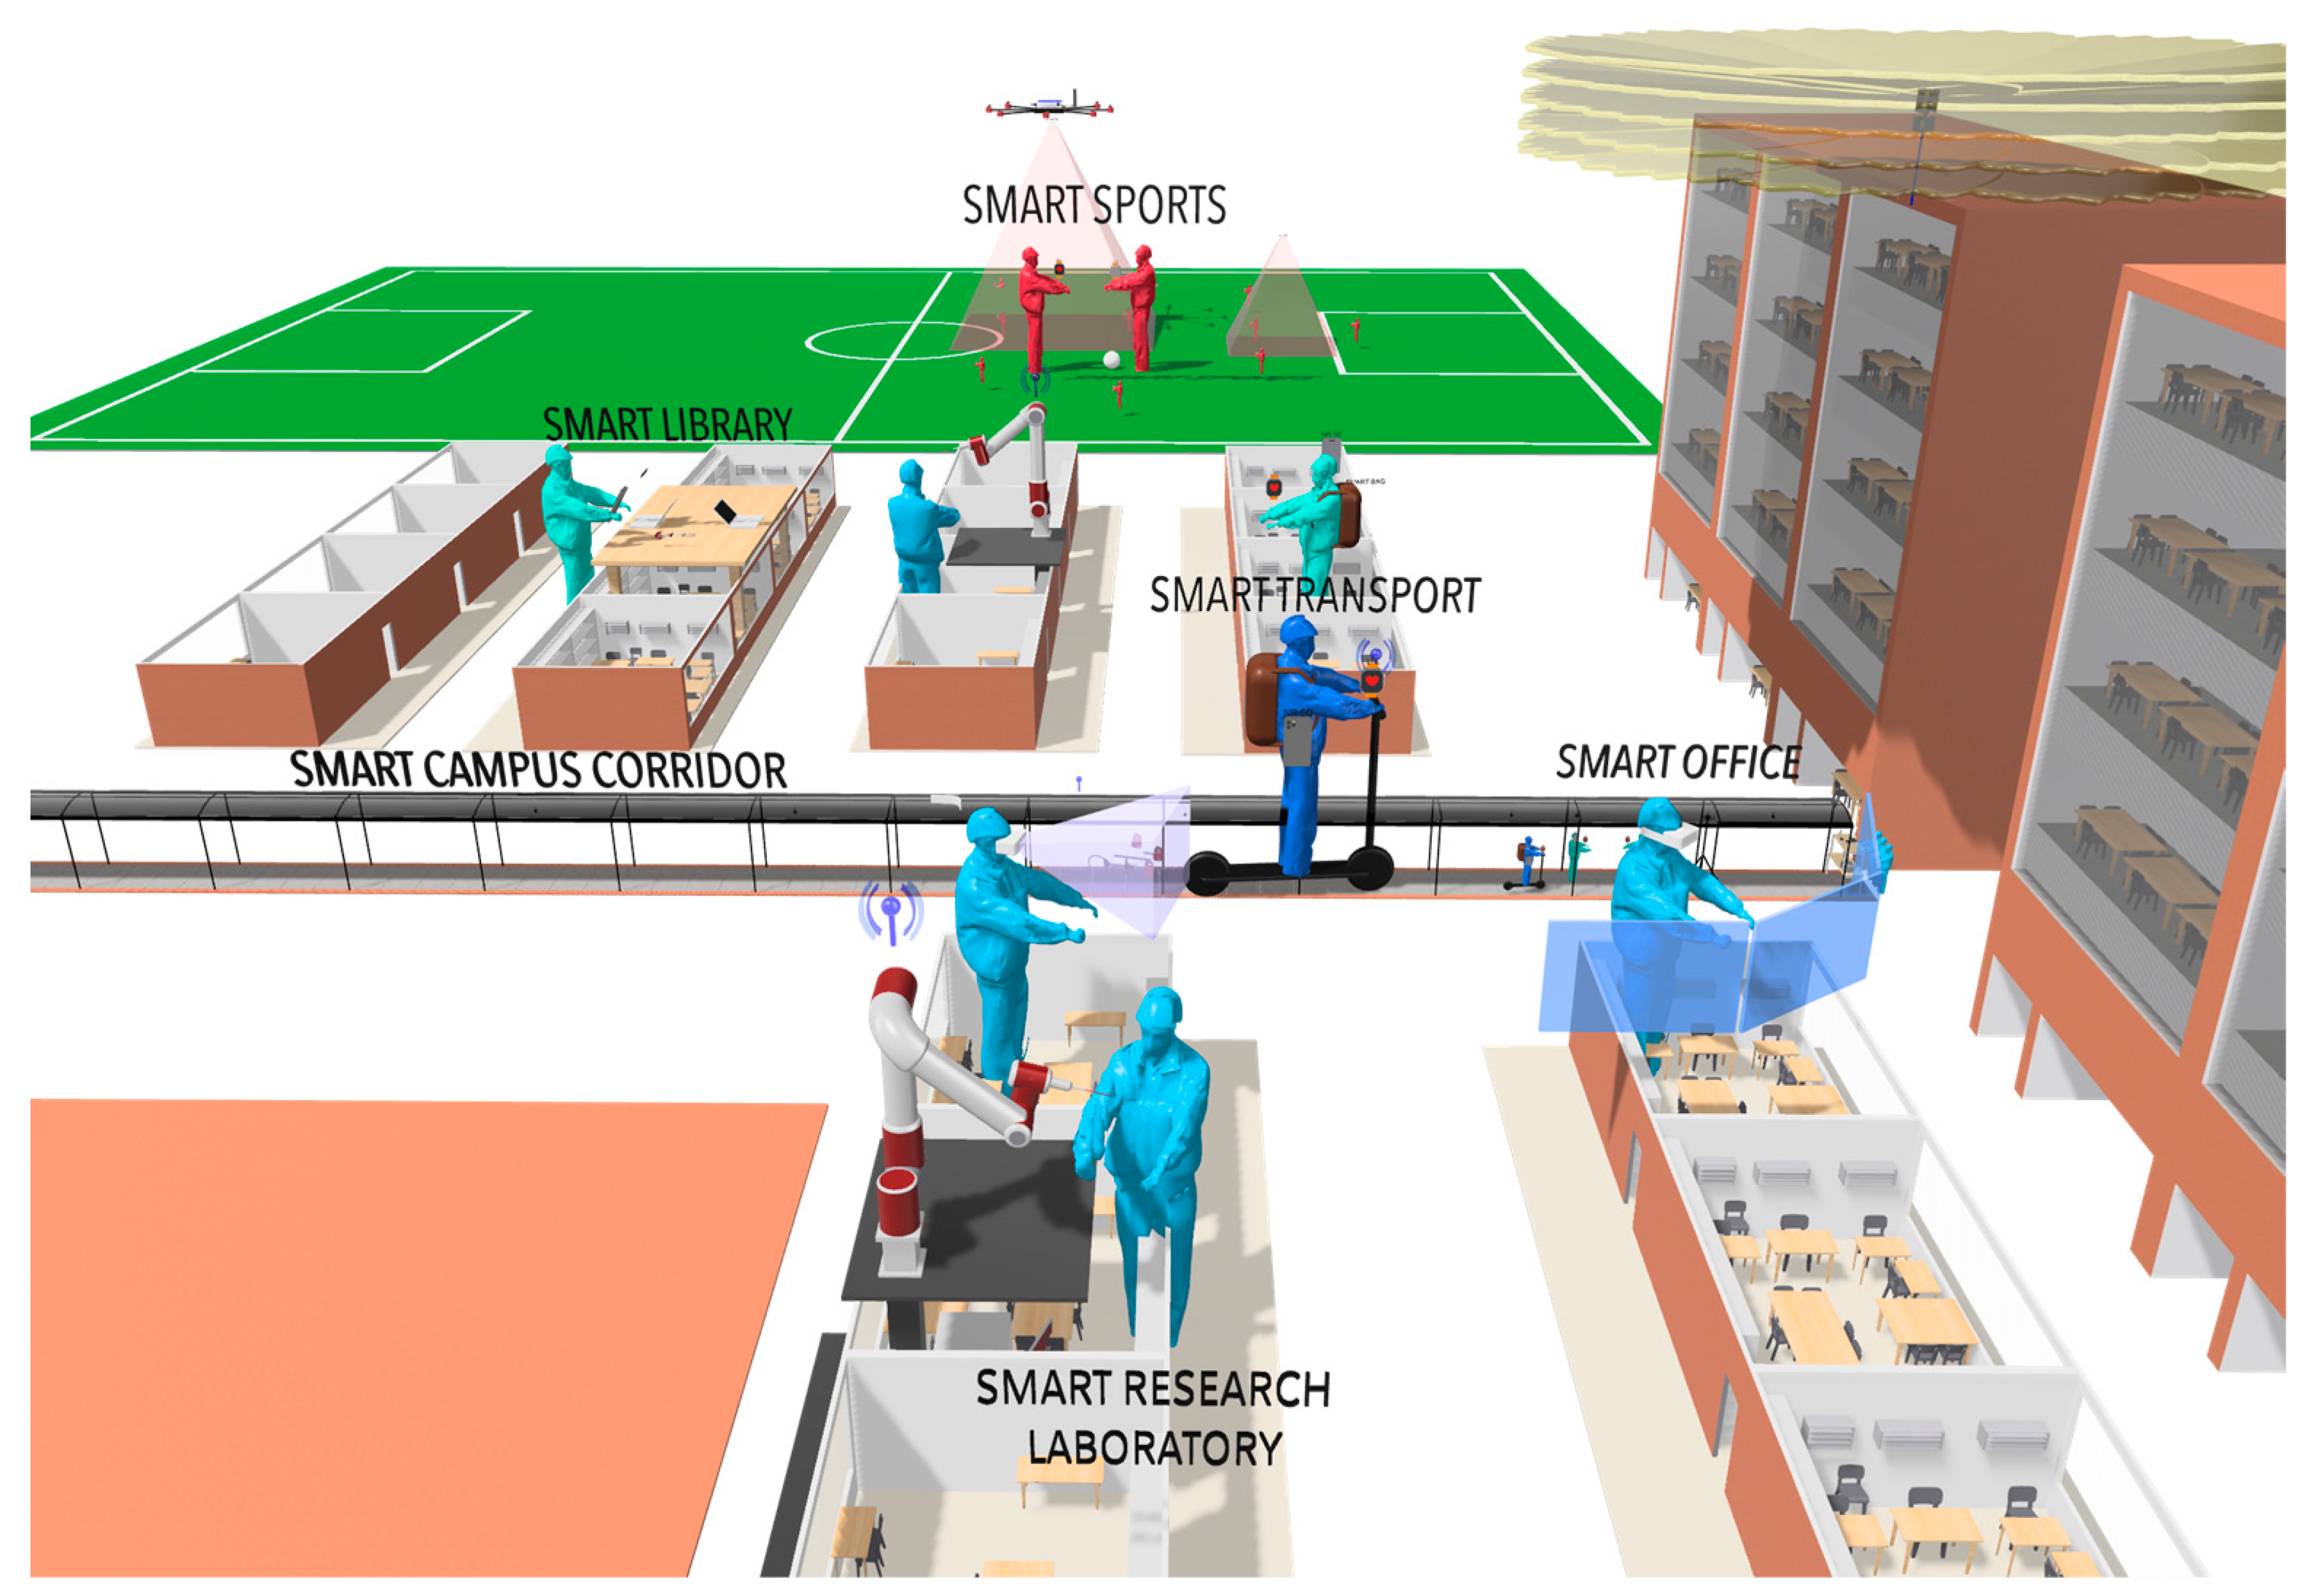
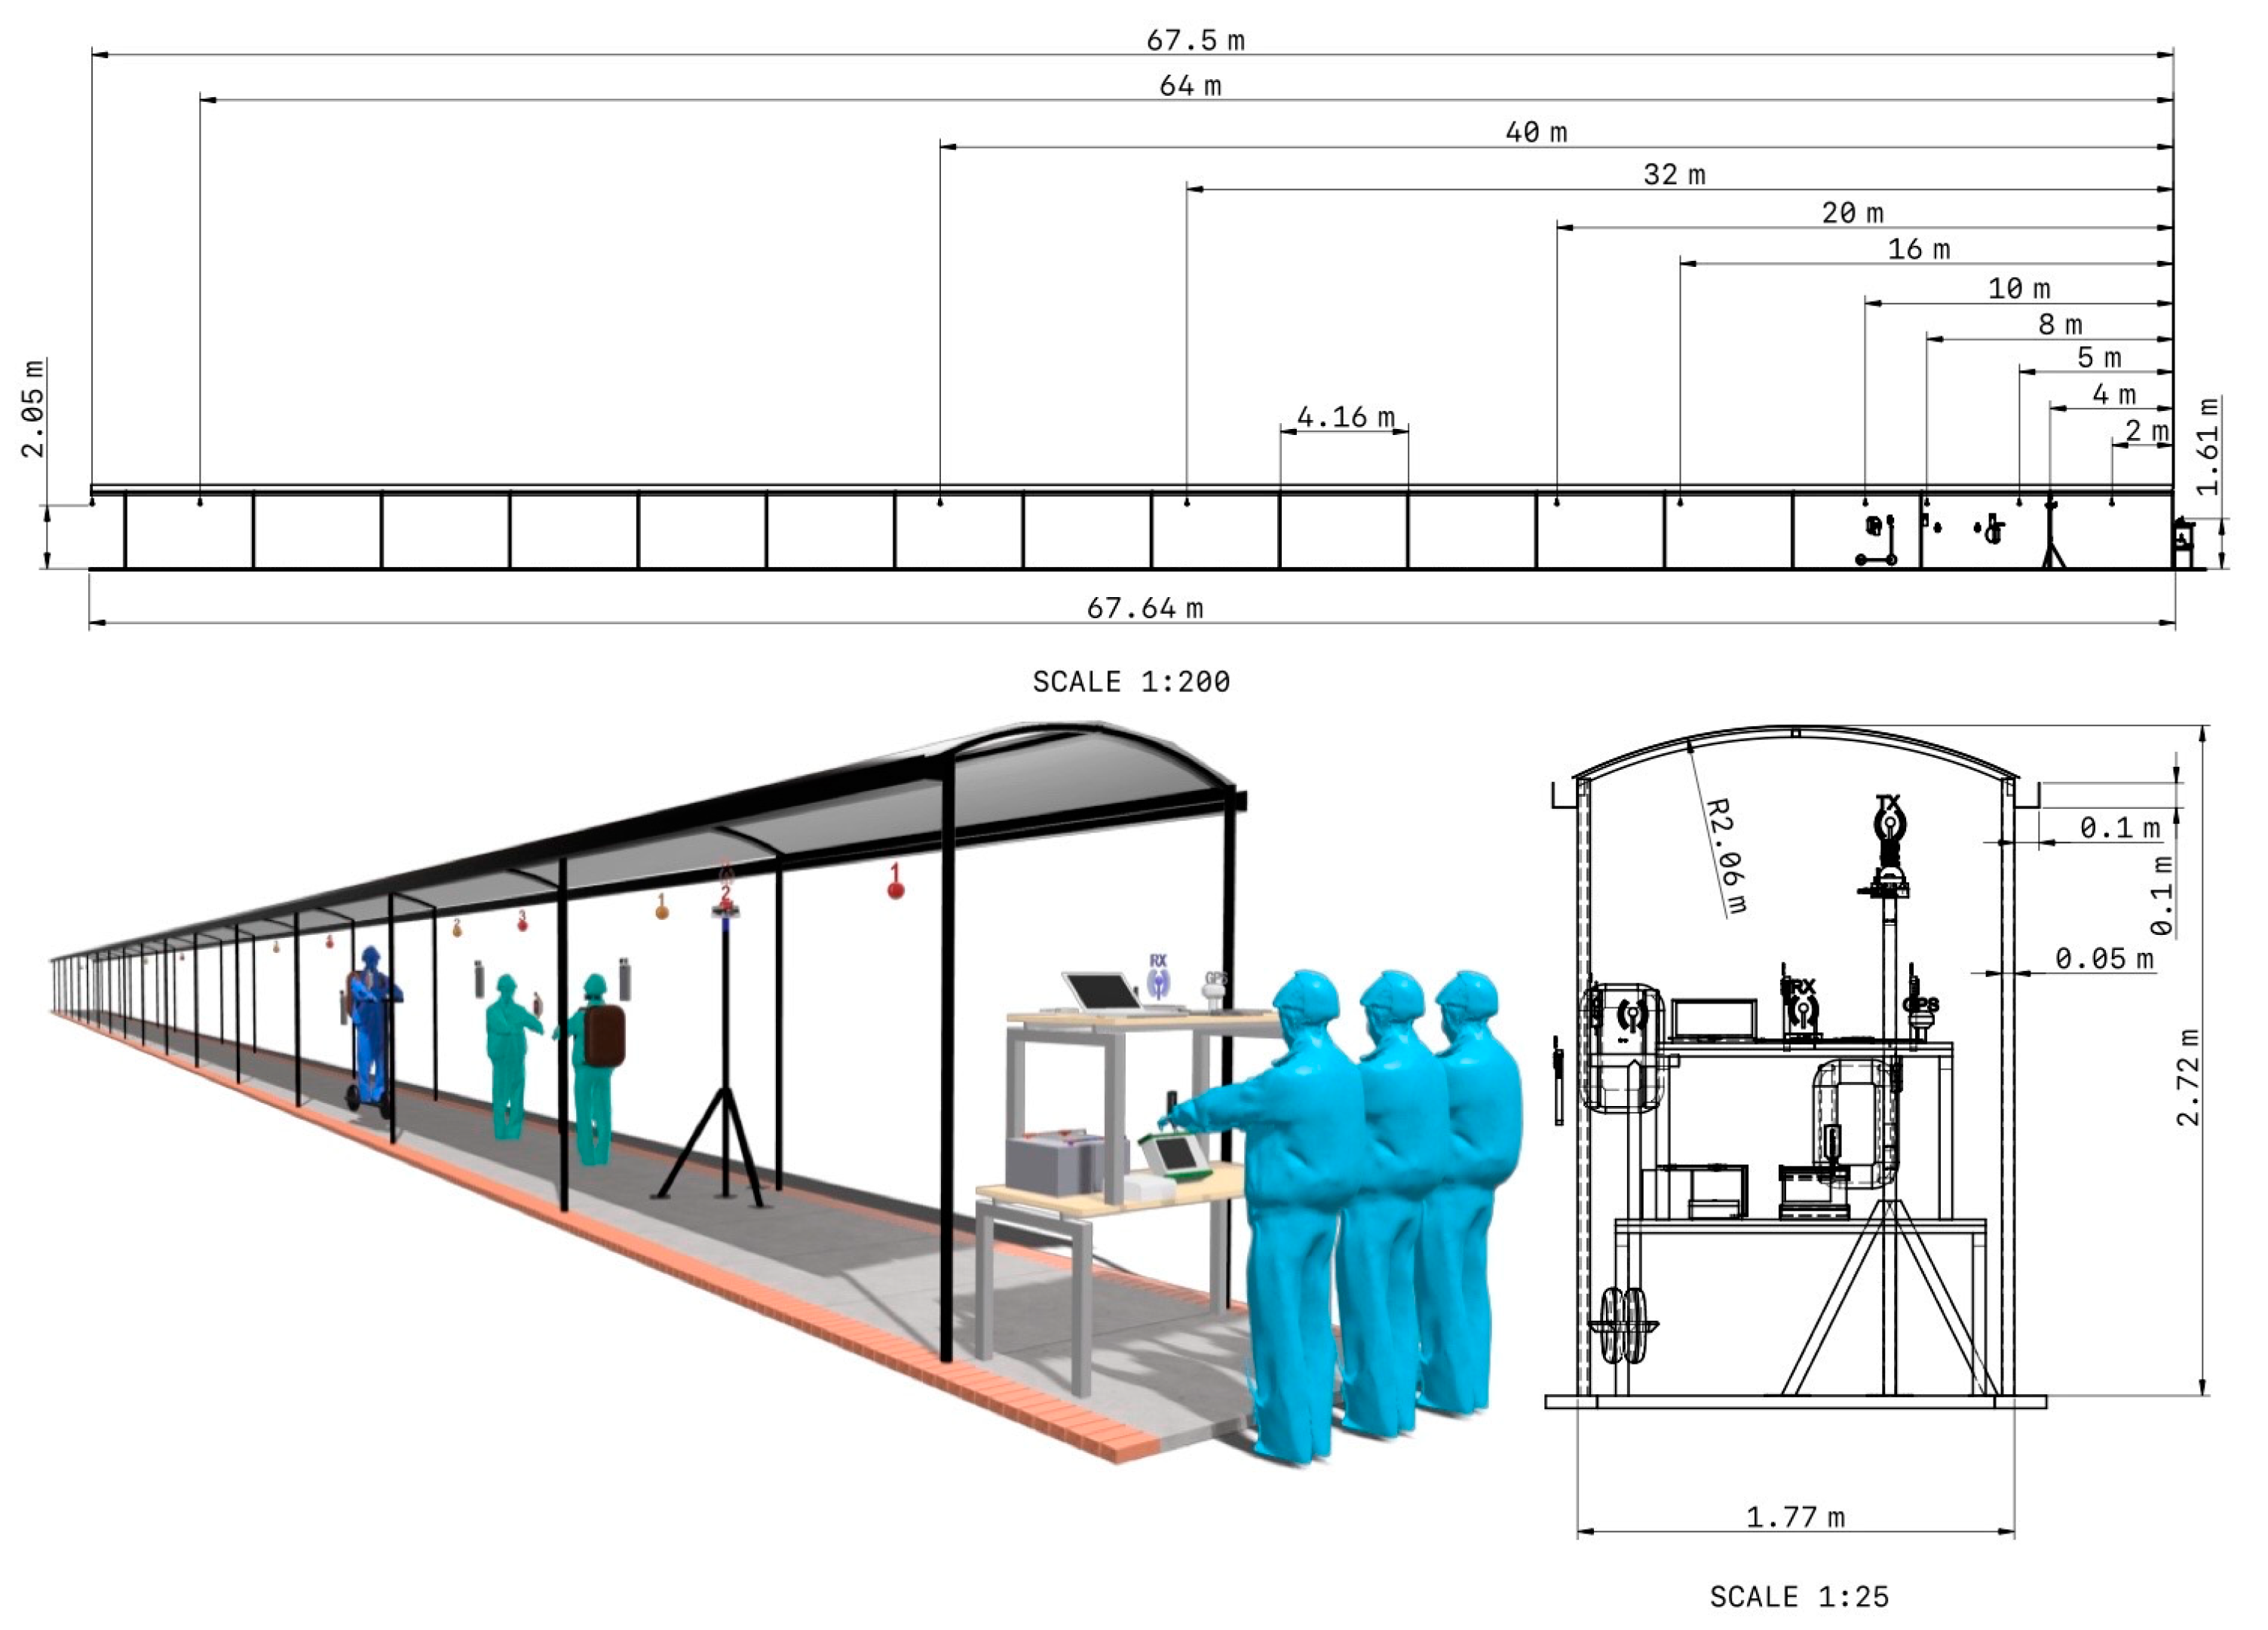
2.1. Propagation Environment

The channel measurement campaign has been carried out in a covered corridor environment. Located in an open space immersed in the facilities of the campus of the Pedagogical and Technological University of Colombia. Measures have been taken on holidays to guarantee LOS conditions, since on days of normal activity the flow of people is quite high. The dimensions of the corridor environment are 67.64 m long by 1.77 m wide with a height of 2.72 m. Figure 3 illustrates the propagation environment.

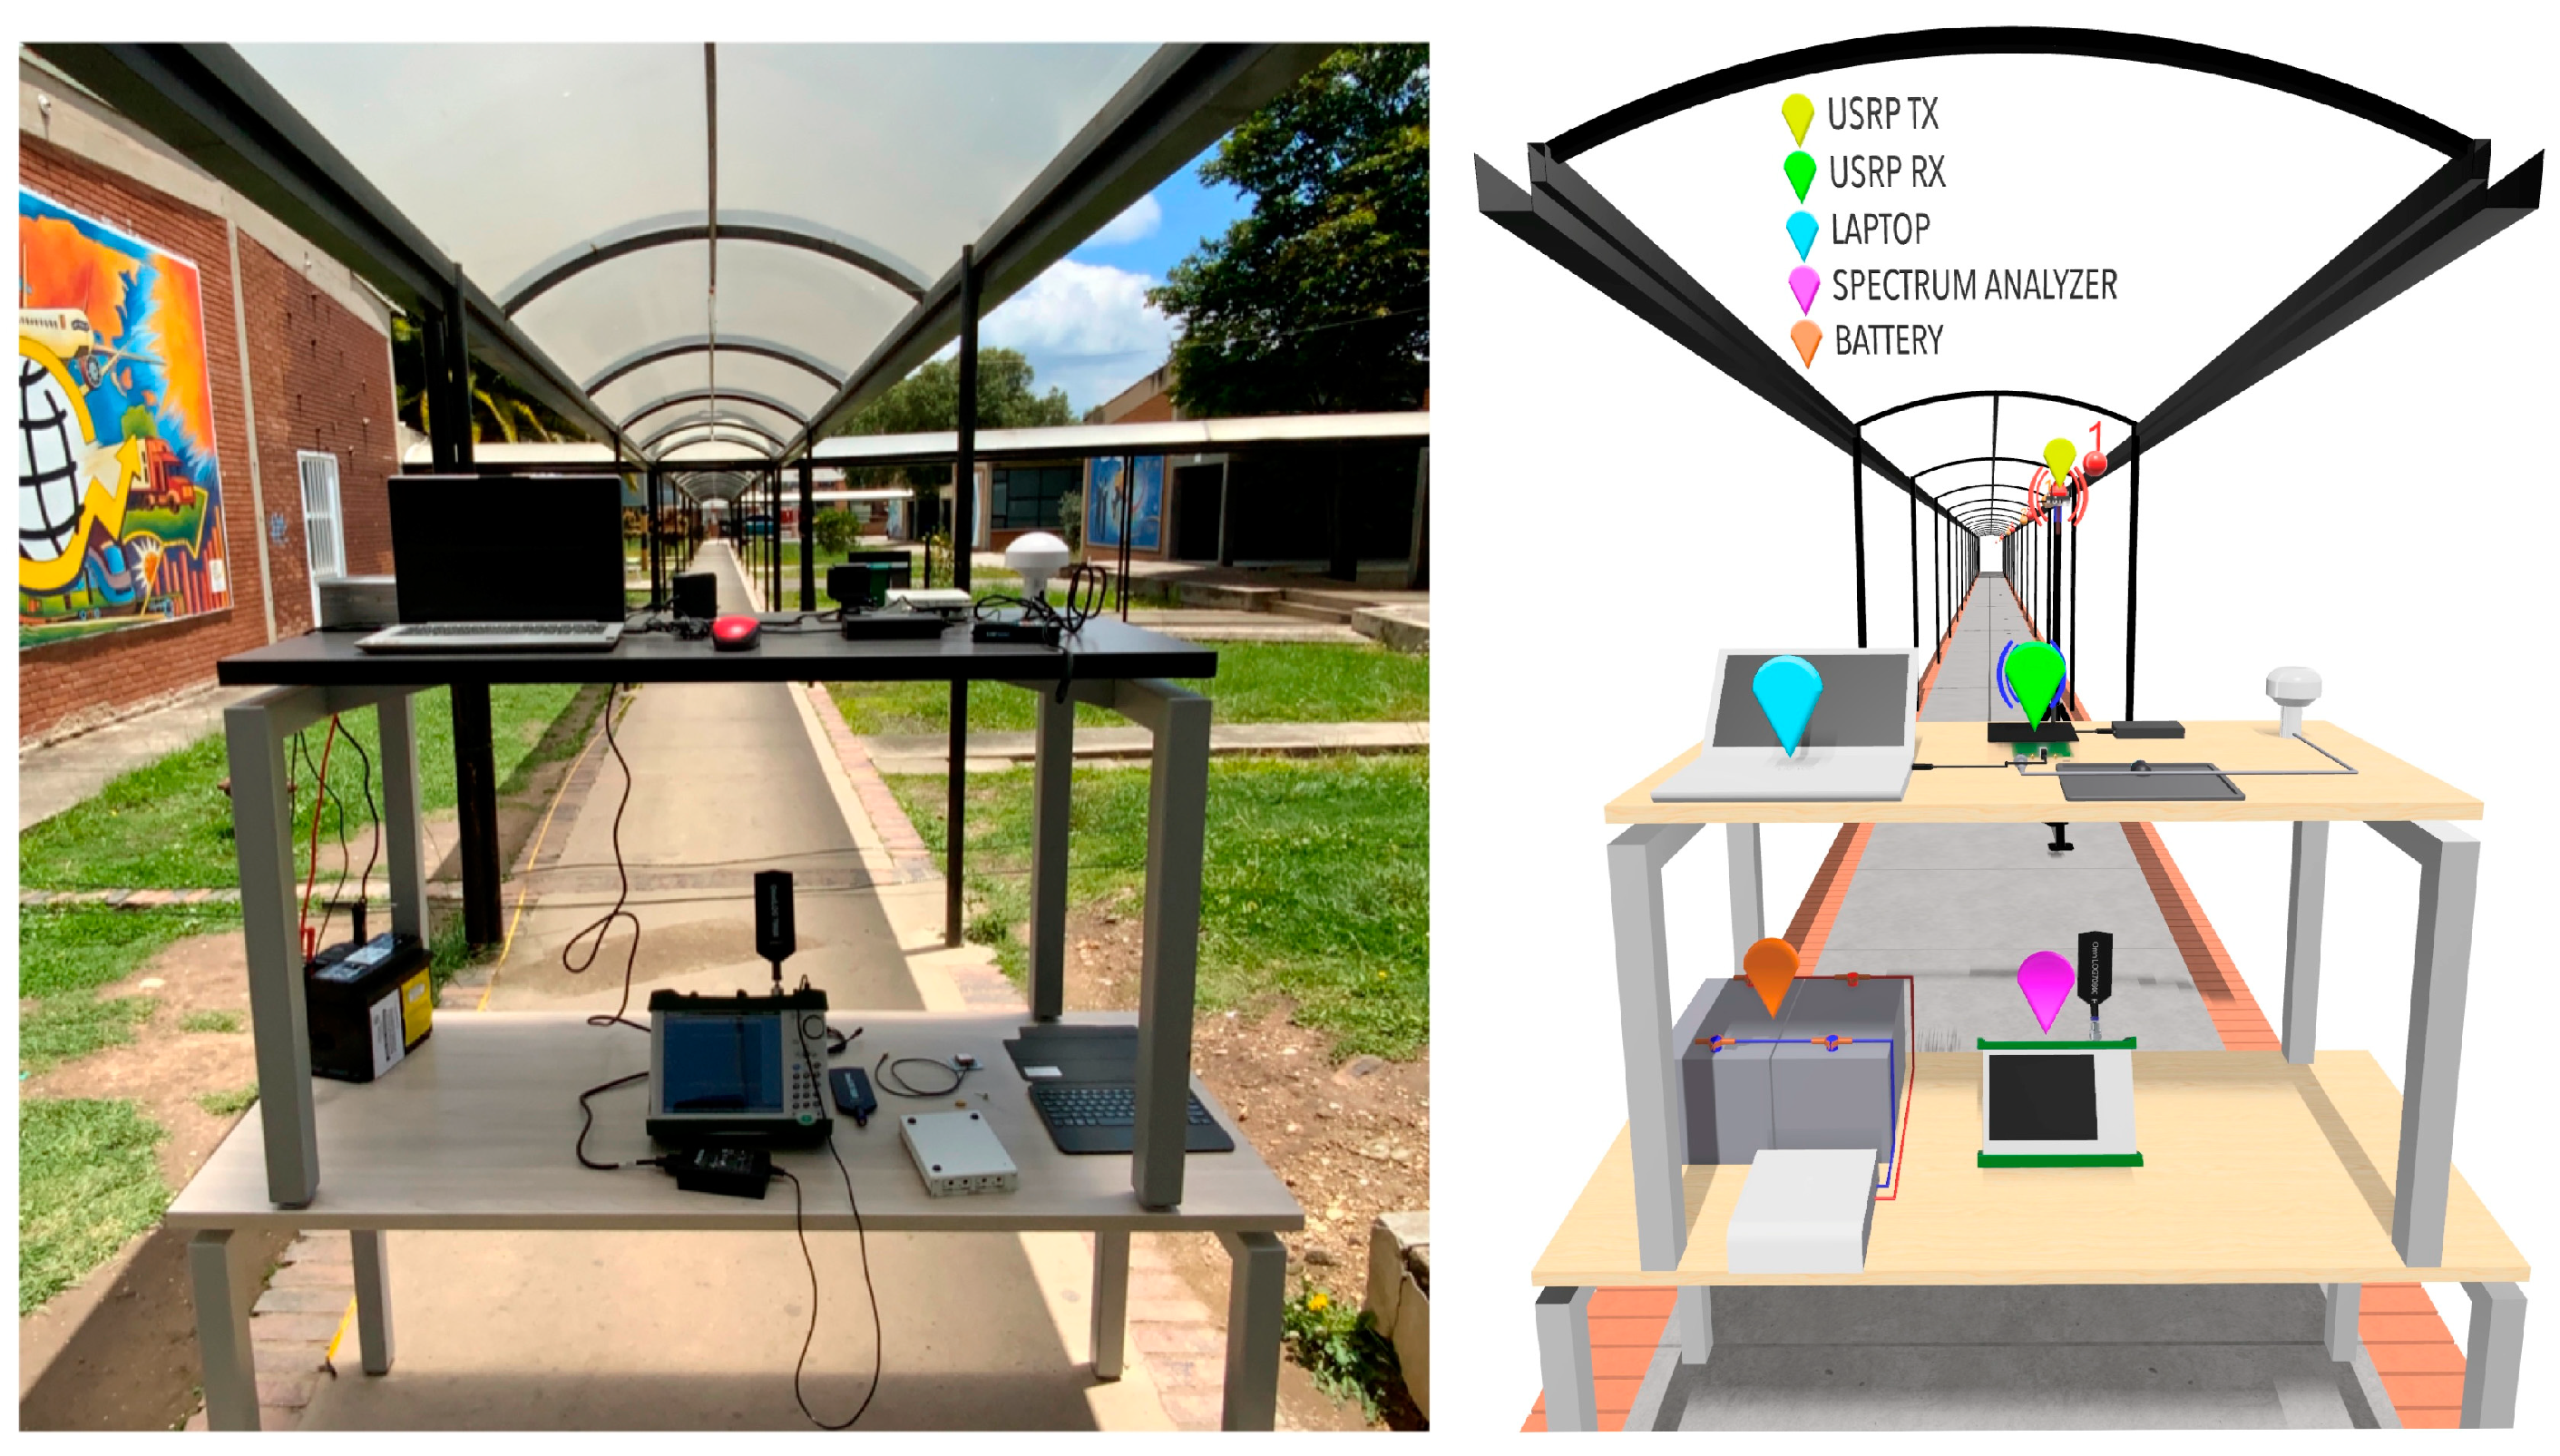
2.2. Equipment and Measurement Setup

The measurements have been made in the time domain through a channel sounder based on a Universal Software Radio Peripheral (USRP) (Ettus Research™, Austin, United States). The received power level has been measured at 850 MHz and 3.5 GHz with 97,653 data points for each transmitter position (Tx). The bandwidth of the intermediate frequency filter has been 50 kHz. Omnidirectional antennas with linear (vertical) polarization have been used at the transmitter and receiver (Rx) ends. The transmitting antenna has been placed at different positions in the corridor, thus emulating the position of a moving user (U). The Rx subsystem remained in the same position, near the access to one of the buildings, with the purpose of emulating the position of an access point that offers coverage to corridor users. The transmitting and receiving antennas were located at a height of 2.05 m and 1.61 m above ground level, respectively. Figure 4 shows the top view of the corridor environment, with the location of the receiving antenna and the 11 positions of the transmitting antenna together, in a range of Tx-Rx distances from 2.00 m to 67.5 m.

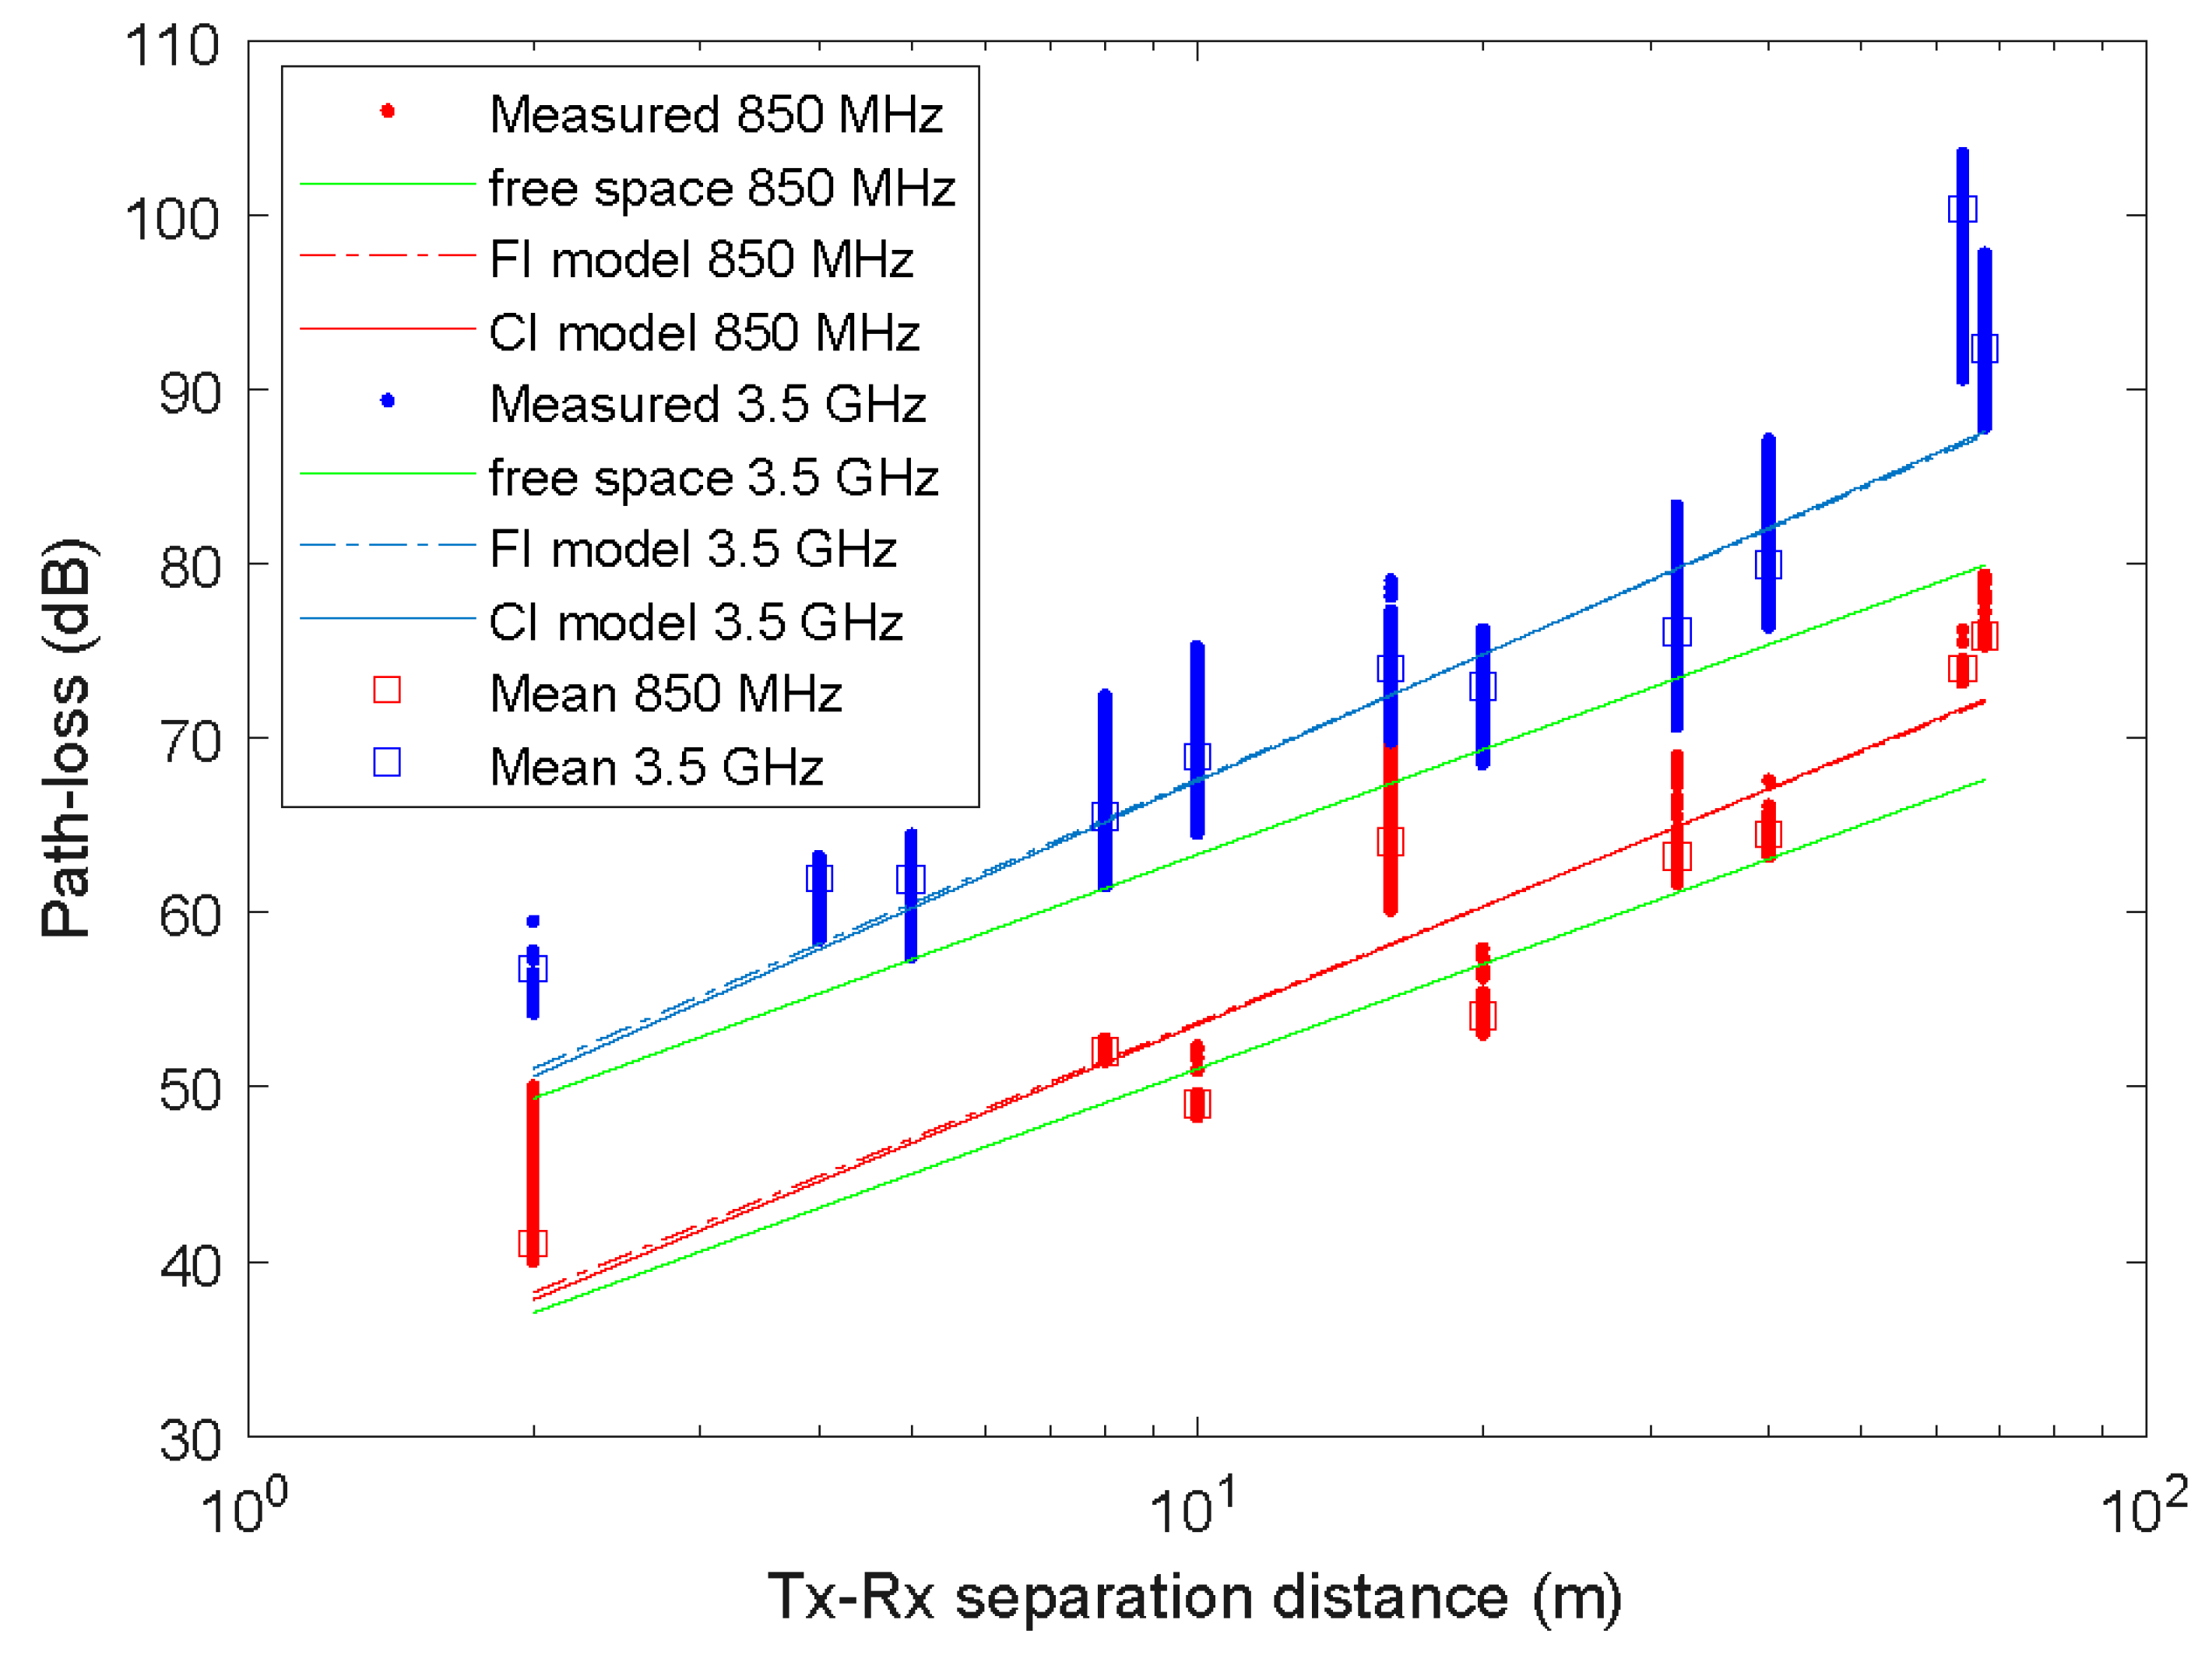
3. Large-Scale Path Loss Models
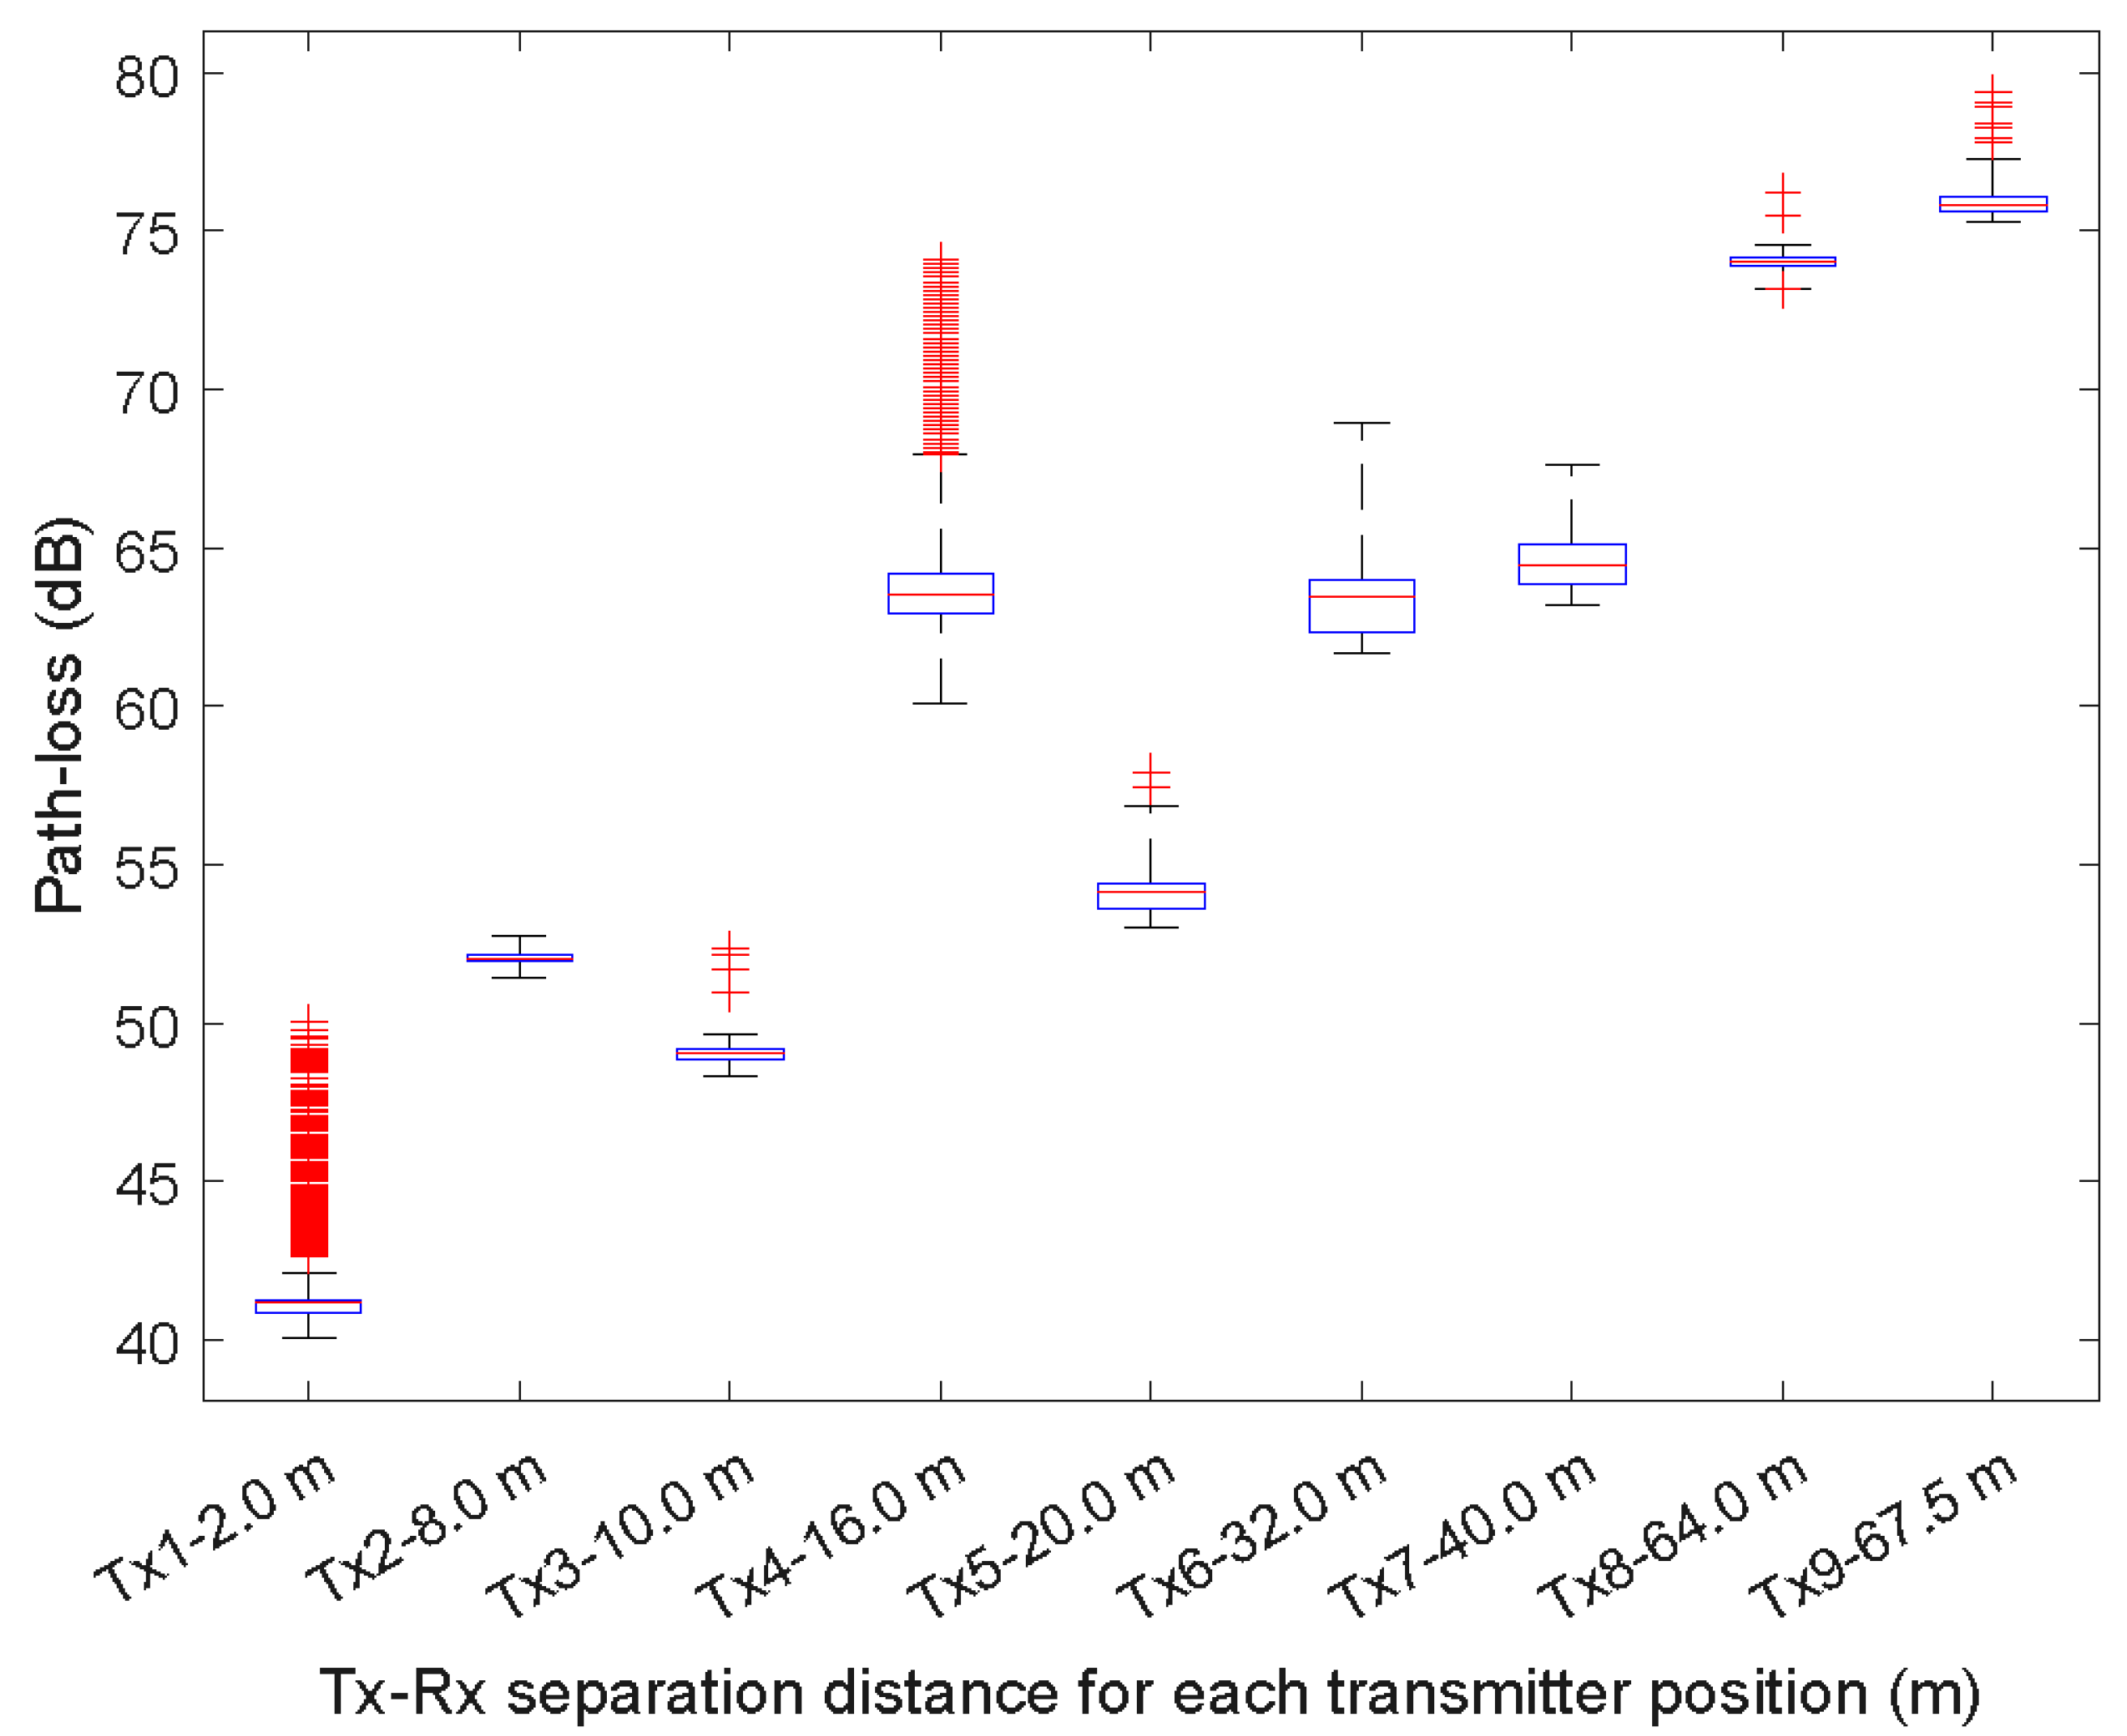
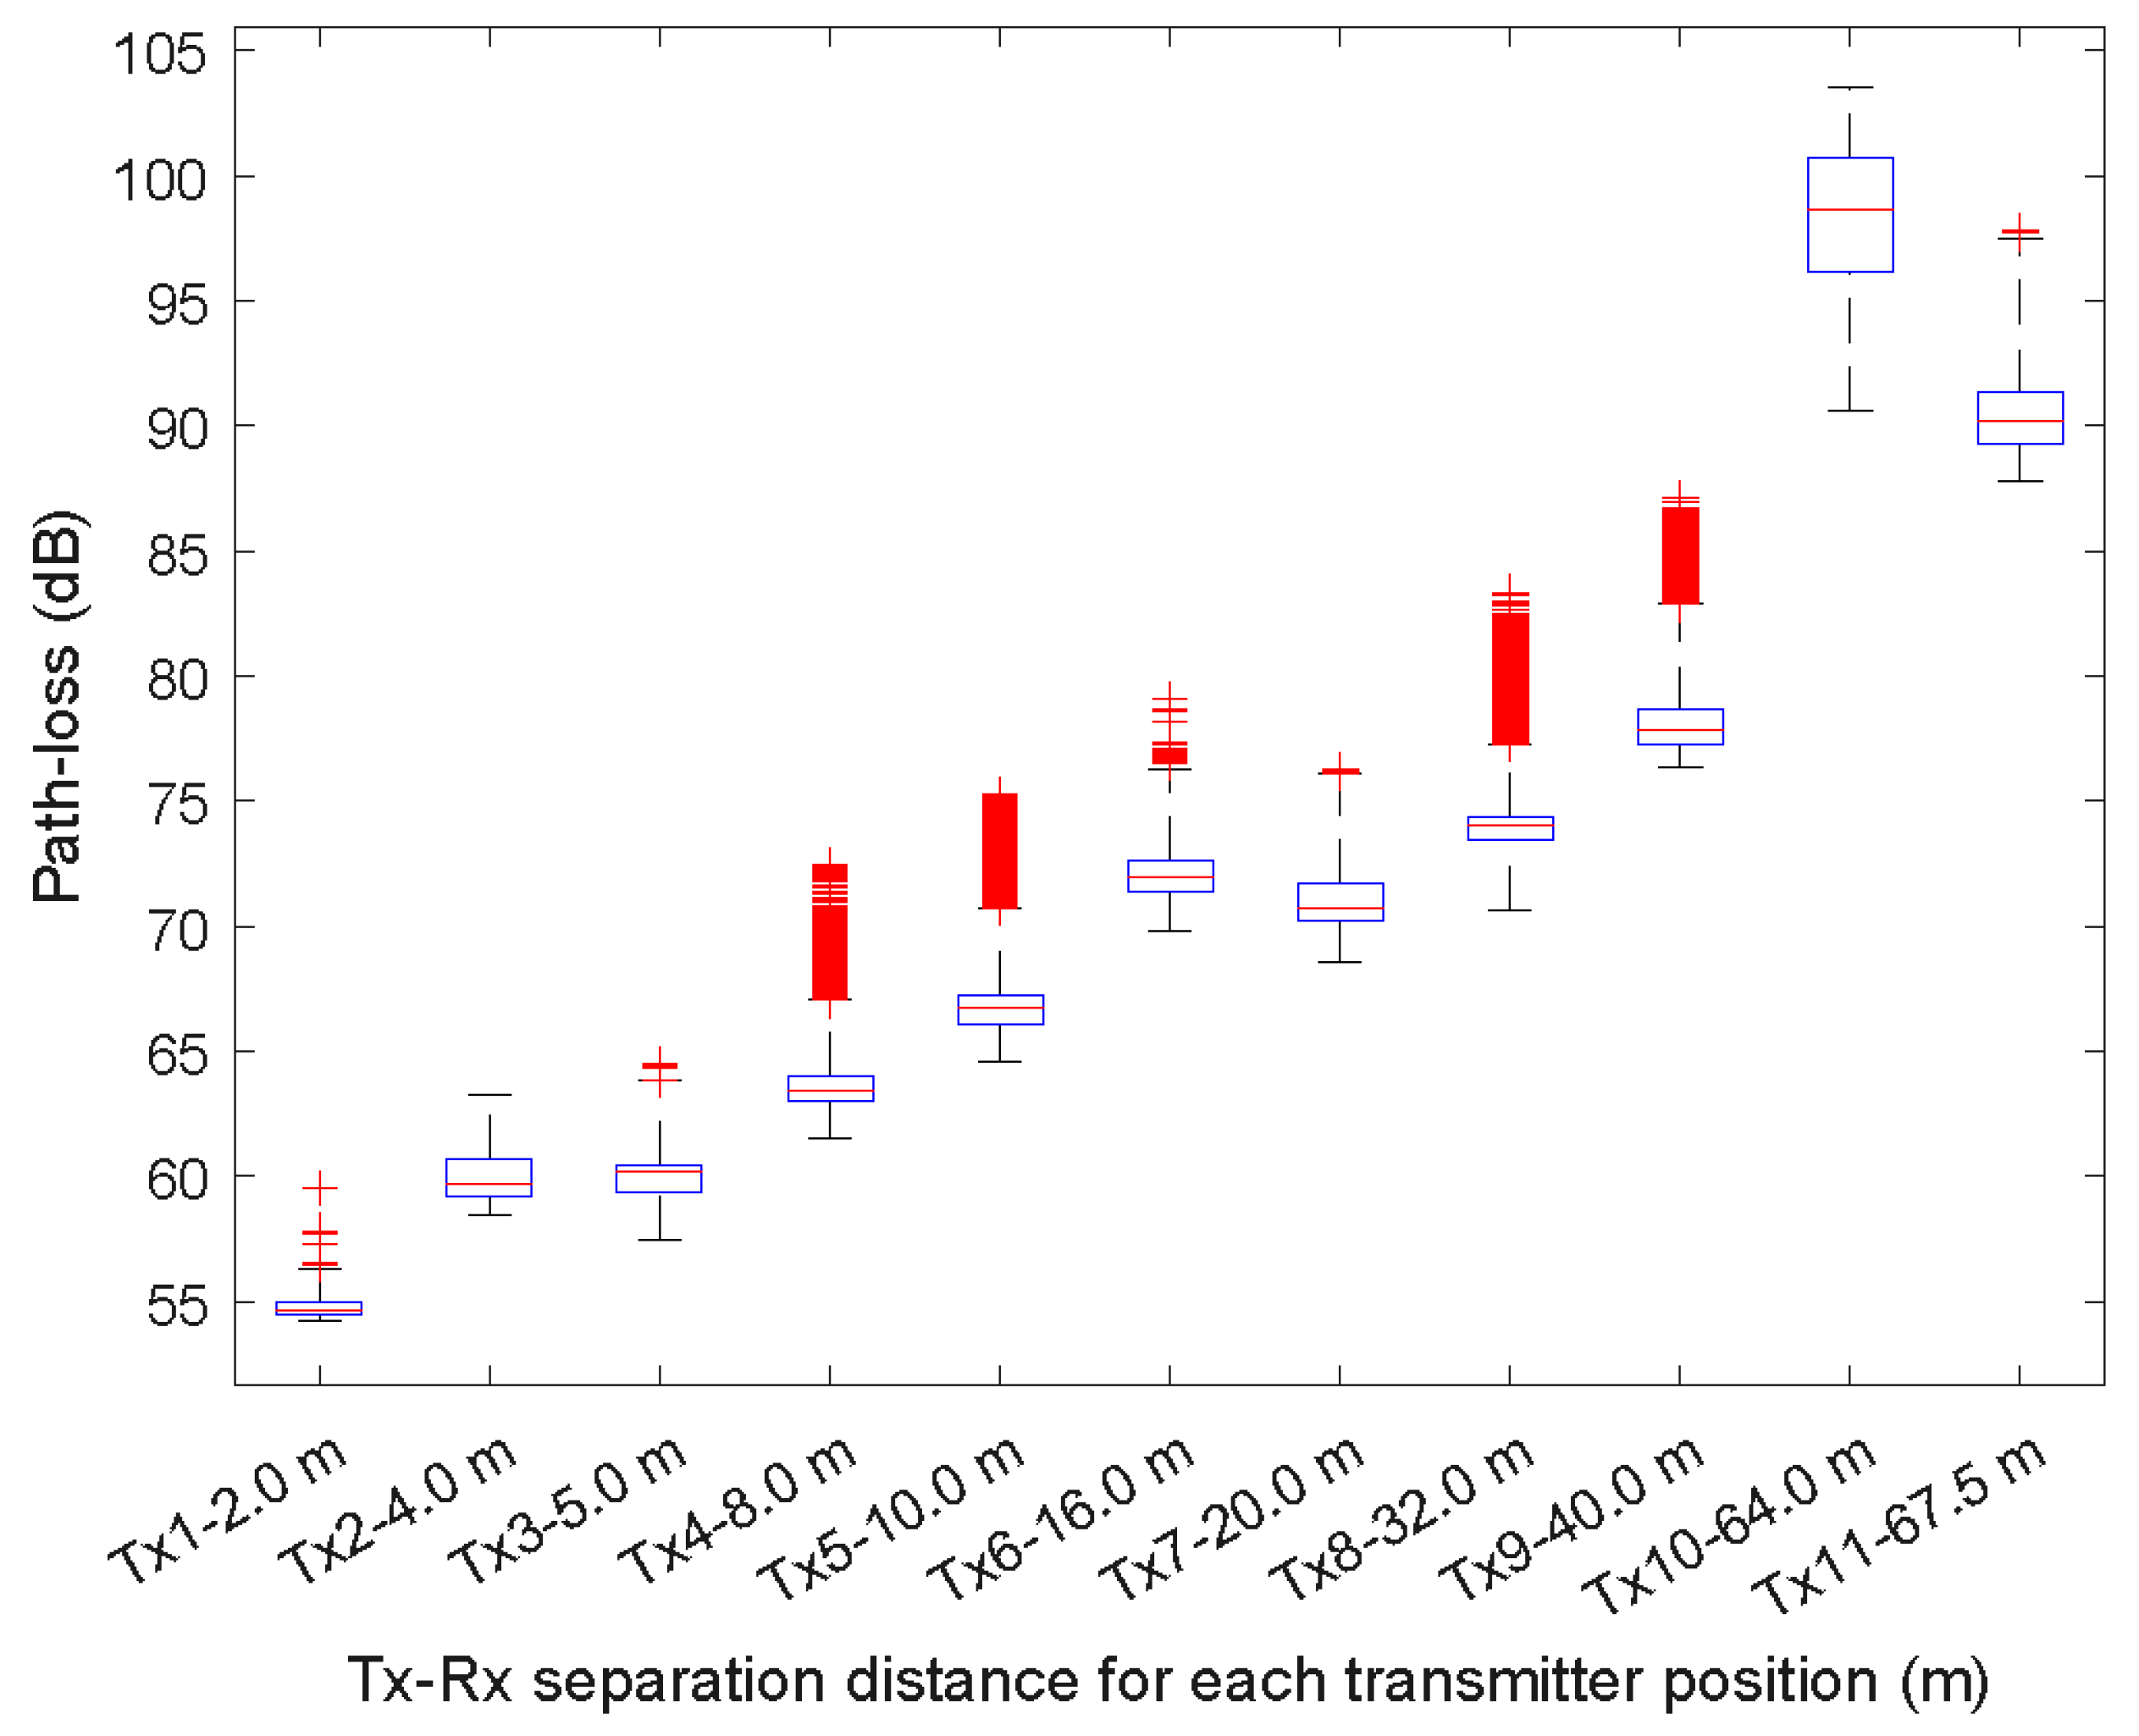
The path loss is reflected in the decay of the signal power as it travels through the communications channel from a transmitter to the receiver. As a result, the coverage area and the transmission rate are significantly affected. In this sense, the propagation models based on experimental measurements receive great attention since they allow the calculation of the propagation characteristics of wireless channels.
The value of the path loss can be calculated by knowing the transmission power, the gain of the transmission and reception antennas, and the received power level obtained by the measurements campaign. It can be shown according to the following expression:
P L d dB = P T x + G T x + G R x P R x d ,
where P T x is the transmitted power (in dBm); G T x and G R x are the transmit and receive antennas gain (in dB), respectively; and   P R x d is the received power level (in dBm). P R x d was calculated from the average of several received signal levels detected by the time channel sounder used in the measurements campaign.
This work analyzes path loss propagation in an indoor corridor environment using the CI and the FI path loss prediction models. Their parameters can be obtained from the measured data through the Minimum Mean Square Error (MMSE) approach. These models were considered in [7], like single-frequency path loss models. The path loss (in dB) given by the CI model is:
P L C I d = F S P L f c , 1   m + 10 n l o g 10 d + χ σ C I .
The term F S P L f c , 1   m = 10 l o g 10 4 π f c / c 0 2 being the free space path loss (FSPL) for a Tx-Rx separation distance equal to 1 m, (43.32 dB at f c = 3.5 GHz and 31.03 dB at f c = 850 MHz). c 0 is the speed of light; n is the path loss exponent (PLE) associated with the characteristics of the propagation environment; d is the Tx-Rx separation distance; and χ σ C I   is the shadowing factor (SF) term, which is a Gaussian distributed random variable with zero mean and standard deviation σ (in dB). In addition, the SF term describes the statistical variation in the distant-dependent mean path loss. In the FI model, the path loss (in dB) is shown through:
P L F I d = β + 10 α l o g 10 d + χ σ F I ,
where β is the offset parameter (in dB), α is the PLE, and χ σ F I   is SF, with the standard deviation σ .

4. Results

The results of the path loss measures fit for the CI and FI prediction models are illustrated in Figure 5, with red color at 850 MHz and blue color at 3.5 GHz. Similar behavior is observed in the value of the PLE n = 2.25 and β = 2.21 and n = 2.41 and β = 2.37 for the CI and FI models, respectively, at the two study frequencies 850 MHz and 3.5 GHz. In both cases, the PLE of the FI model is slightly higher.
Table 2 and Table 3 summarize the parameters and the standard deviation of the SF term σ of the FI and CI models at 850 MHz and 3.5 GHz, respectively. These parameters and their corresponding 95% confidence intervals were estimated from the measured data using the MMSE approach through the cftool function of Matlab. The PLE ranges that have been obtained for both models from 2.21 to 2.41 are larger than the free space (PLE = 2). A higher loss exponent was found for FI and CI at 3.5 GHz. It is worth noting that PLE values lower than 2 have been found in an indoor corridor environment for frequencies below 6 GHz [12,13]. For example, in [12] PLE values of 1.03 to 1.83 were measured for LOS conditions at 3.7 GHz. In [13] PLE values of 1.50 and 1.60 were measured for LOS conditions at 3.5 GHz.
Figure 6 and Figure 7 show the box plots for each Tx position at 850 MHz and 3.5 GHz, respectively. In each box, the central mark is the median, the edges of the box are the 25th and 75th percentiles and the whiskers are the most extreme values of the data points that are not outliers.
Table 4 and Table 5 summarize the statistical path loss at 850 MHz and 3.5 GHz. Note that while Figure 5 and Figure 6 show a higher number of outlier data points for the Tx-Rx separation distances of Tx1-2 m and Tx-16 m at 850 MHz and Tx4-8 m, Tx5-10 m, Tx8-32 m, and Tx9-40 m at 3.5 GHz, the number of outliers is low compared to the total number of data points obtained for each distance. For example, for the Tx4-16 m at 850 MHz, the percentage of outliers is 6.4%.
In related work, there are no studies that focus on comparing propagation aspects in the low and mid bands allocated by the FCC for 5G deployment for IoT use cases with experimental measurements. On the one hand, propagation modeling for wireless sensor network deployment has been presented in [15,16,17,18]. In [15], a measurement campaign was conducted at 868 MHz and compared with predicted path loss values from models such as the COST-231 Hata model in an urban environment. Similarly, in [16], measurement campaigns were used to obtain path loss coefficients for 2.4 GHz RF signals. In other work, ref. [17] proposed a statistical path loss characterization using measurements up to deep indoor scenarios. In [18], an algorithm called LOKO has been developed for application to current 5G (or future) deployment processes. On the other hand, work has focused on how to improve data transmission in IoT sensor networks by selecting the best cluster head node using an overlapping clustering method [19], also based on criteria such as distance or received signal strength [20] on fuzzy logic and content-based routing methods [21] or improving security algorithms [22].

5. Conclusions

This paper has put into context the use cases given by the ITU-R M.2150-1 recommendation, including eMBB, URLLC, and mMTC, which require a combination of the spectrum allocated for the IMT-2020 system (known as 5G), high, mid, and low-frequency bands, to meet the objectives set for these 5G networks, such as large bandwidth, higher data rates, massive connectivity, low end-to-end latency, low cost, and consistent quality of service, among others. It has also been described how the mid-band spectrum has great potential for connecting IoT services and applications in 5G cellular networks.
The values obtained for the PLE and their 95% confidence intervals are 2.21 (2.214–2.217) for the FI model and 2.252 (2.251–2.217) for the CI model at 850 MHz and 2.376 (2.374–2.378) for the FI model and 2.419 (2.418–2.420) for the CI model at 3.5 GHz, which are larger than the theoretical free space model (PLE = 2). This shows that the multipath effect causes a lack of constructive interference to the received power signal for this type of outdoor corridor scenario in which the measurements were collected. Also, a higher PLE was found at 3.5 GHz than at 850 MHz.
Future lines of work include performing broadband measurement campaigns, with an automated georeferencing process for applications in the Industrial IoT (IIoT) and smart transportation scenarios to generate path loss and capacity models that enable the optimal deployment of device and sensor networks in 5G-IoT ecosystems.

Author Contributions

Conceptualization, H.F., L.R. and V.M.R.P.; methodology, H.F., L.R. and V.M.R.P.; channel measurements, J.M., D.M. and H.F.; validation, H.F., L.R. and V.M.R.P.; formal analysis, J.M., D.M., H.F., L.R., V.M.R.P. and J.R.; investigation, J.M., D.M., H.F., L.R., V.M.R.P. and J.R.; resources, J.M., D.M. and H.F.; data curation, H.F., L.R. and V.M.R.P.; writing—original draft preparation, J.M., D.M., H.F., L.R., V.M.R.P. and J.R.; writing—review and editing, J.M., D.M., H.F., L.R., V.M.R.P. and J.R.; visualization, H.F., L.R., V.M.R.P. and D.M.; supervision, H.F., L.R. and V.M.R.P.; project administration, H.F., L.R. and V.M.R.P.; funding acquisition, H.F., J.M. and D.M. All authors have read and agreed to the published version of the manuscript.

Funding

This work has been funded in part by the MCIN/AEI/10.13039/501100011033/ through the I+D+i Project under Grant PID2020-119173RB-C21, by the Pedagogical and Technological University of Colombia (Project Number SGI 3159) and by the Bicentennial Doctoral Excellence Scholarship Minciencias-Program (Contract BPIN 2019000100041).

Institutional Review Board Statement

Not applicable.

Informed Consent Statement

Not applicable.

Data Availability Statement

Data are contained within the article.

Acknowledgments

The authors would like to thank Herman Esteban Fernández for his support during the writing review.

Conflicts of Interest

The authors declare no conflict of interest. The funders had no role in the design of the study; in the collection, analyses or interpretation of data; in the writing of the manuscript; or in the decision to publish the results.

References

  1. Federal Communications Commission. The FCC’s 5G FAST Plan. Available online: https://www.fcc.gov/5G (accessed on 28 May 2020).
  2. Copyright 2019 5G Americas. 5G Americas White Paper, 5G Spectrum Vision; 5G Americas: Bellevue, WA, USA, 2019. [Google Scholar]
  3. ITU. M.2150: Detailed Specifications of the Terrestrial Radio Interfaces of International Mobile Telecommunications-2020 (IMT-2020). Available online: https://www.itu.int/rec/R-REC-M.2150-1-202202-I/en (accessed on 6 June 2023).
  4. Ikpehai, A.; Adebisi, B.; Rabie, K.M.; Anoh, K.; Ande, R.E.; Hammoudeh, M.; Gacanin, H.; Mbanaso, U.M. Low-power wide area network technologies for Internet-of-Things: A comparative review. IEEE Internet Things J. 2018, 6, 2225–2240. [Google Scholar] [CrossRef]
  5. Shafique, K.; Khawaja, B.A.; Sabir, F.; Qazi, S.; Mustaqim, M. Internet of things (IoT) for next-generation smart systems: A review of current challenges, future trends and prospects for emerging 5G-IoT scenarios. IEEE Access 2020, 8, 23022–23040. [Google Scholar] [CrossRef]
  6. Rappaport, T.S.; Xing, Y.C.; MacCartney, G.R.; Molisch, A.F.; Mellios, E.; Zhang, J.H. Overview of Millimeter Wave Communications for Fifth-Generation (5G) Wireless Networks-With a Focus on Propagation Models. IEEE Trans. Antennas Propag. 2017, 65, 6213–6230. [Google Scholar] [CrossRef]
  7. Rubio, L.; Peñarrocha, V.M.R.; Cabedo-Fabres, M.; Bernardo-Clemente, B.; Reig, J.; Fernández, H.; Pérez, J.R.; Torres, R.P.; Valle, L.; Fernández, Ó. Millimeter-Wave Channel Measurements and Path Loss Characterization in a Typical Indoor Office Environment. Electronics 2023, 12, 844. [Google Scholar] [CrossRef]
  8. Al-Samman, A.M.; Rahman, T.A.; Azmi, M.H. Indoor corridor wideband radio propagation measurements and channel models for 5G millimeter wave wireless communications at 19 GHz, 28 GHz, and 38 GHz bands. Wirel. Commun. Mob. Comput. 2018, 2018, 6369517. [Google Scholar] [CrossRef]
  9. Da Silva Batalha, I.; Lopes, A.V.R.; Araújo, J.P.L.; Castro, B.L.S.; Barros, F.J.B.; Cavalcante, G.P.D.S.; Pelaes, E.G. Indoor corridor and office propagation measurements and channel models at 8, 9, 10 and 11 GHz. IEEE Access 2019, 7, 55005–55021. [Google Scholar] [CrossRef]
  10. Chizhik, D.; Du, J.; Feick, R.; Rodriguez, M.; Castro, G.; Valenzuela, R.A. Path loss and directional gain measurements at 28 GHz for non-line-of-sight coverage of indoors with corridors. IEEE Trans. Antennas Propag. 2020, 68, 4820–4830. [Google Scholar] [CrossRef]
  11. Elmezughi, M.K.; Afullo, T.J.; Oyie, N.O. Performance study of path loss models at 14, 18, and 22 GHz in an indoor corridor environment for wireless communications. SAIEE Afr. Res. J. 2021, 112, 32–45. [Google Scholar] [CrossRef]
  12. Samad, M.A.; Diba, F.D.; Kim, Y.-J.; Choi, D.-Y. Results of Large-Scale Propagation Models in Campus Corridor at 3.7 and 28 GHz. Sensors 2021, 21, 7747. [Google Scholar] [CrossRef] [PubMed]
  13. AAl-Samman, A.M.; Rahman, T.A.; Al-Hadhrami, T.; Daho, A.; Hindia, M.N.; Azmi, M.H.; Dimyati, K.; Alazab, M. Comparative Study of Indoor Propagation Model Below and Above 6 GHz for 5G Wireless Networks. Electronics 2019, 8, 44. [Google Scholar] [CrossRef]
  14. 5G Americas White Paper, Mid-Band Spectrum Update; 5G Americas: Bellevue, WA, USA, 2023.
  15. Bouzidi, M.; Mohamed, M.; Dalveren, Y.; Moldsvor, A.; Cheikh, F.A.; Derawi, M. Propagation Measurements for IQRF Network in an Urban Environment. Sensors 2022, 22, 7012. [Google Scholar] [CrossRef] [PubMed]
  16. Pal, P.; Sharma, R.P.; Tripathi, S.; Kumar, C.; Ramesh, D. 2.4 GHz RF Received Signal Strength Based Node Separation in WSN Monitoring Infrastructure for Millet and Rice Vegetation. IEEE Sens. J. 2021, 21, 18298–18306. [Google Scholar] [CrossRef]
  17. Caso, G.; Alay, Ö.; De Nardis, L.; Brunstrom, A.; Neri, M.; Di Benedetto, M.-G. Empirical Models for NB-IoT Path Loss in an Urban Scenario. IEEE Internet Things J. 2021, 8, 13774–13788. [Google Scholar] [CrossRef]
  18. Albanese, A.; Sciancalepore, V.; Banchs, A.; Costa-Pérez, X. LOKO: Localization-Aware Roll-Out Planning for Future Mobile Networks. IEEE Trans. Mob. Comput. 2023, 22, 5359–5374. [Google Scholar] [CrossRef]
  19. Akbari, M.R.; Barati, H.; Barati, A. An efficient gray system theory-based routing protocol for energy consumption management in the Internet of Things using fog and cloud computing. Computing 2022, 104, 1307–1335. [Google Scholar] [CrossRef]
  20. Akbari, M.R.; Barati, H.; Barati, A. An overlapping routing approach for sending data from things to the cloud inspired by fog technology in the large-scale IoT ecosystem. Wirel. Netw. 2022, 28, 521–538. [Google Scholar] [CrossRef]
  21. Kiamansouri, E.; Barati, H.; Barati, A. A two-level clustering based on fuzzy logic and content-based routing method in the internet of things. Peer Peer Netw. Appl. 2022, 15, 2142–2159. [Google Scholar] [CrossRef]
  22. Nezhad, M.A.; Barati, H.; Barati, A. An Authentication-Based Secure Data Aggregation Method in Internet of Things. J. Grid Comput. 2022, 20, 29. [Google Scholar] [CrossRef] [PubMed]
Figure 1. University campus IoT based on smart applications.
Sensors 23 09237 g001
Figure 2. Smart university campus scenario based on IoT and 5G.
Sensors 23 09237 g002
Figure 3. Propagation environment where the measurements were carried out.
Sensors 23 09237 g003
Figure 4. Front view of the corridor environment. The Rx and Tx positions have been indicated.
Sensors 23 09237 g004
Figure 5. Measured path loss, predicted path loss using the FI and CI models, and mean path loss at 850 MHz and 3.5 GHz.
Sensors 23 09237 g005
Figure 6. Box plots of the path loss as a function of the Tx-Rx separation distance at 850 MHz.
Sensors 23 09237 g006
Figure 7. Box plots of the path loss as a function of the Tx-Rx separation distance at 3.5 GHz.
Sensors 23 09237 g007
Table 1. A 5G use case and their corresponding spectrums and coverage range.
5G Use CasesServicesSpectrum–Coverage
eMMBAreas with limited connectivity, remote offices, teleworking, commerce, indoor environments, immersive technologies, and public transport.Low and mid bands
Medium and long range
mMTCMassive IoT: smart cities, buildings, sensor networks for agriculture, and industry.Mid band
Medium long range
URLLCAutonomous vehicles, Intelligent Transportation Systems (ITS), Vehicular-to-Everything (V2X), Industries 4.0, and smart grid.High bands
Short and medium range
Table 2. FI and CI path loss model parameters in LOS conditions at 850 MHz.
Model β β 95 % (dB) α α 95 % σ (dB)
FI31.55 (31.53–31.58)2.215 (2.214–2.217)3.959
F S P L f c , 1   m n n 95 %
CI31.032.252 (2.251–2.252)3.963
Table 3. FI and CI path loss model parameters in LOS conditions at 3.5 GHz.
Model β β 95 % (dB) α α 95 % σ (dB)
FI43.90 (43.87–43.92)2.376 (2.374–2.378)4.433
F S P L f c , 1   m n n 95 %
CI43.322.419 (2.418–2.420)4.438
Table 4. Statistical path loss at 850 MHz.
ValueTx1Tx2Tx3Tx4Tx5Tx6Tx7Tx8Tx9
Upper42.1352.7549.6367.9756.8468.9567.5974.5677.26
75th percentile41.3052.1949.1864.2154.4364.0165.1174.1476.07
Median41.1852.0349.0663.5354.1663.4364.4874.0375.81
25th percentile40.8651.9548.8462.9653.6262.3363.8773.9075.62
Lower40.0451.4548.3160.1153.0361.7063.1941.0475.32
Data points94,94594,05697,55597,53097,51997,51397,49897,52997,557
Outliers449056256200127
Table 5. Statistical path loss at 3.5 GHz.
ValueTx1Tx2Tx3Tx4Tx5Tx6Tx7Tx8Tx9Tx10Tx11
Upper56.2763.2263.8467.0270.7476.3076.0977.2982.86103.5597.45
75th percentile54.9860.6960.4763.9967.2672.6271.6974.4078.63100.7191.30
Median54.6559.6760.1463.4066.7471.9770.7274.0177.8298.6390.15
25th percentile54.5059.2159.3462.9866.1071.3670.2273.4377.2296.1289.25
Lower54.2158.4157.4661.4564.5469.7868.5570.6676.3690.5887.78
Data points97,51793,22297,57893,92294,01297,51797,51697,46297,49673,33794,340
Outliers19076532681486291480202
Disclaimer/Publisher’s Note: The statements, opinions and data contained in all publications are solely those of the individual author(s) and contributor(s) and not of MDPI and/or the editor(s). MDPI and/or the editor(s) disclaim responsibility for any injury to people or property resulting from any ideas, methods, instructions or products referred to in the content.

