
New Complementary Resonator for Permittivity- and Thickness-Based Dielectric Characterization

Abstract
:1. Introduction
2. Sensor Design
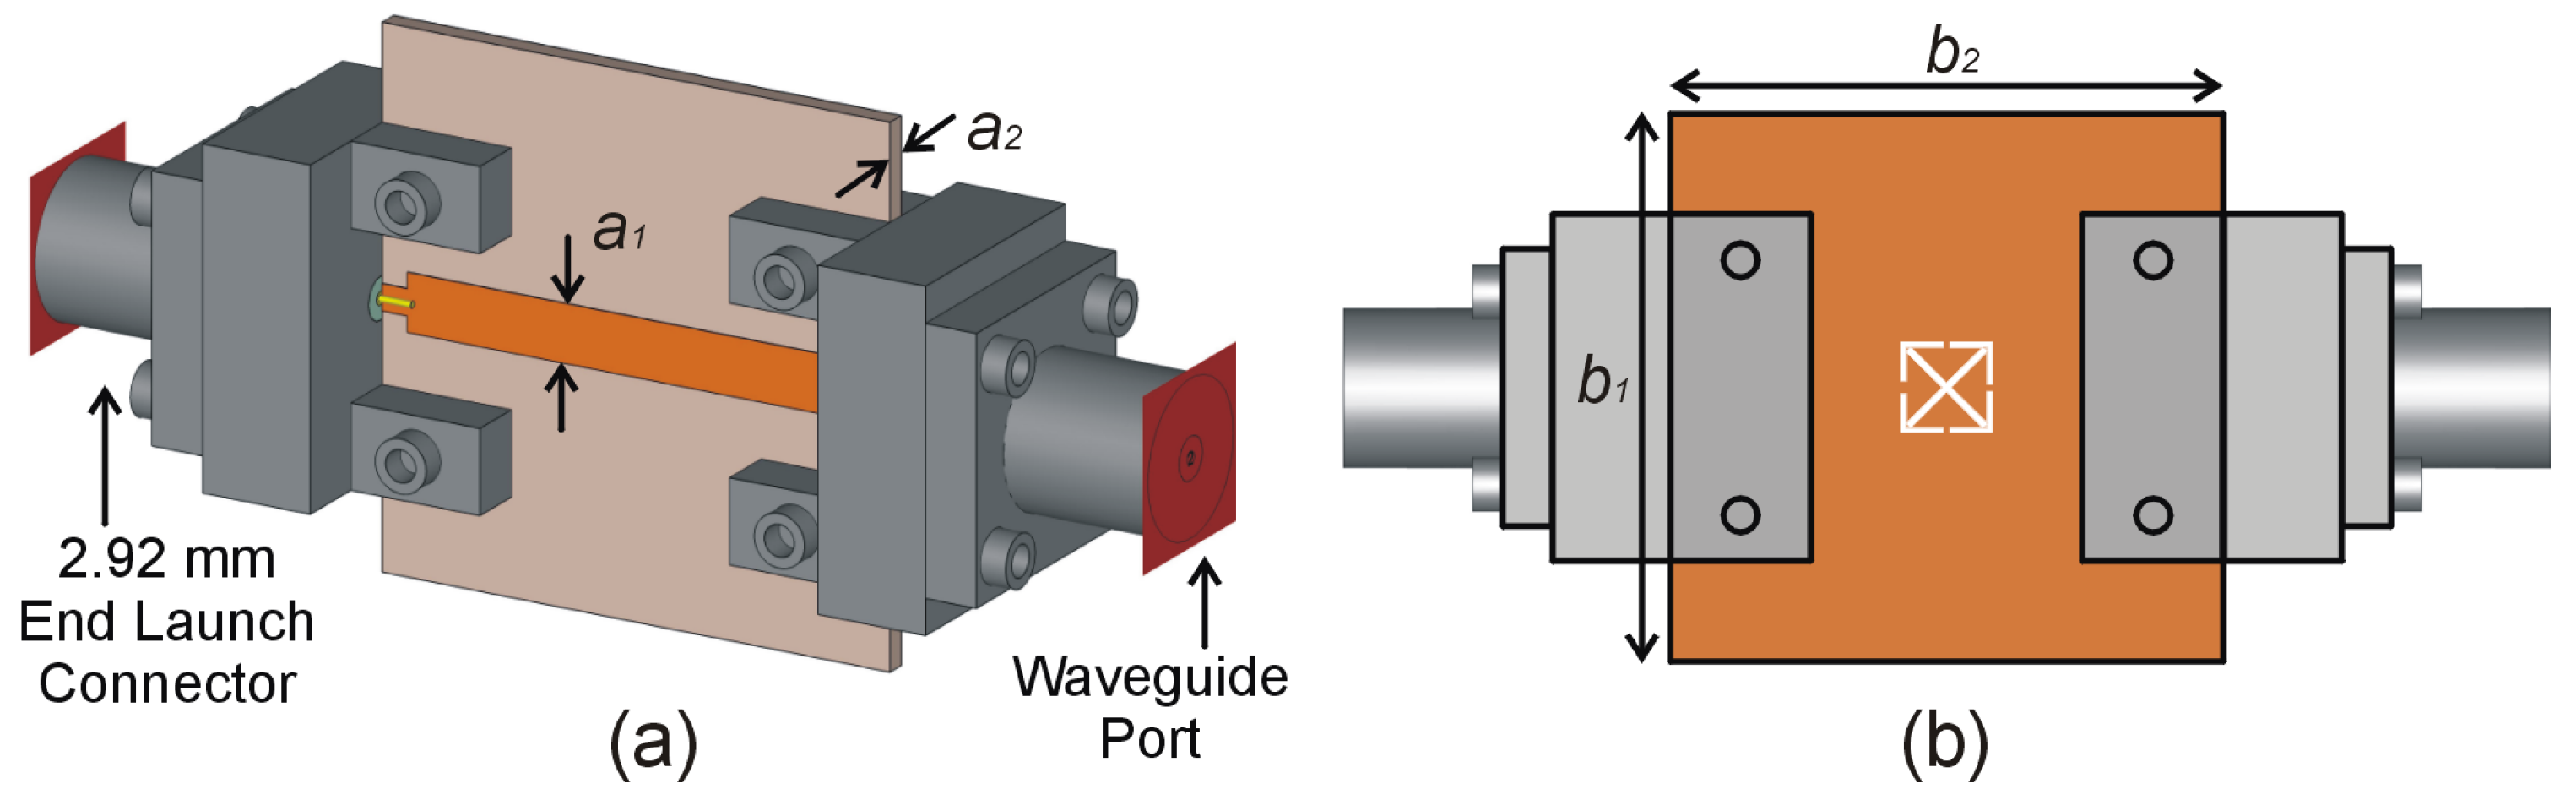
3. Fabrication and Experimental Validation
4. Sensor Calibration
5. Conclusions
Author Contributions
Funding
Institutional Review Board Statement
Informed Consent Statement
Data Availability Statement
Acknowledgments
Conflicts of Interest
References
- Khan, S.; Marwat, S.N.K.; Khan, M.A.; Ahmed, S.; Gohar, N.; Alim, M.E.; Algarni, A.D.; Elmannai, H. A self-decoupling technique to realize dense packing of antenna elements in MIMO arrays for wideband sub-6 GHz communication systems. Sensors 2023, 23, 654. [Google Scholar] [CrossRef] [PubMed]
- Cardillo, E.; Tavella, F.; Ampelli, C. Microstrip Copper nanowires antenna array for connected microwave liquid sensors. Sensors 2023, 23, 3750. [Google Scholar] [CrossRef] [PubMed]
- Monteagudo Honrubia, M.; Matanza Domingo, J.; Herraiz-Martínez, F.J.; Giannetti, R. Low-cost electronics for automatic classification and permittivity estimation of glycerin solutions using a dielectric resonator sensor and machine learning techniques. Sensors 2023, 23, 3940. [Google Scholar] [CrossRef] [PubMed]
- Pendry, J.B.; Holden, A.J.; Robbins, D.J.; Stewart, W.J. Magnetism from conductors and enhanced nonlinear phenomena. IEEE Trans. Microw. Theory Tech. 1999, 47, 2075–2084. [Google Scholar] [CrossRef]
- Falcone, F.; Lopetegi, T.; Baena, J.; Marwues, R.; Martin, F.; Sorolla, M. Effective negative-epsilon stopband microstrip lines based on complementary split ring resonators. IEEE Microw. Wirel. Comp. Lett. 2004, 14, 280–282. [Google Scholar] [CrossRef]
- Haq, T.; Ruan, C.; Zhang, X.; Kosar, A.; Ullah, S. Low cost and compact wideband microwave notch filter based on miniaturized complementary metaresonator. Appl. Phys. A 2019, 125, 662. [Google Scholar] [CrossRef]
- Zhang, J.; Li, C.; Gao, Y.; Tan, J.; Xuan, F.; Ling, X. Flexible multimode antenna sensor with strain and humidity sensing capability for structural health monitoring. Sens. Act. A Phys. 2022, 347, 113960. [Google Scholar] [CrossRef]
- Jorwal, S.; Dubey, A.; Gupta, R.; Agarwal, D. A review: Advancement in metamaterial based RF and microwave absorbers. Sens. Act. A Phys. 2023, 354, 114293. [Google Scholar] [CrossRef]
- Deepti, A.; Gangwar, D.; Singh, S.; Sharma, A.; Singh, S.P.; Lay-Ekuakille, A. Design of polarization conversion metasurface for RCS reduction and gain improvement of patch antenna for Ku-band radar sensing applications. Sens. Act. A Phys. 2021, 333, 113273. [Google Scholar] [CrossRef]
- Vélez, P.; Muñoz-Enano, J.; Grenier, K.; Mata-Contreras, J.; Dubuc, D.; Martin, F. Split ring resonator-based microwave fluidic sensors for electrolyte concentration measurements. IEEE Sens. J. 2019, 19, 2562–2569. [Google Scholar] [CrossRef]
- Acevedo-Osorio, G.; Reyes-Vera, E.; Lobato-Morales, H. Dual-band microstrip resonant sensor for dielectric measurement of liquid materials. IEEE Sens. J. 2020, 20, 13371–13378. [Google Scholar] [CrossRef]
- Yang, X.; Zhang, M.; Ren, M.; Mao, S.; Dhakal, R.; Kim, N.Y.; Cao, Y.; Li, Y.; Yao, Z. Ultra-fast and high-sensitive tacrolimus solution detection based on microwave biosensor. Sens. Actuators A Phys. 2023, 354, 114282. [Google Scholar] [CrossRef]
- Haq, T.; Ruan, C.; Zhang, X.; Ullah, S. Complementary metamaterial sensor for nondestructive evaluation of dielectric substrates. Sensors 2019, 19, 2100. [Google Scholar] [CrossRef] [PubMed]
- Lee, C.S.; Yang, C.L. Complementary split-ring resonators for measuring dielectric constants and loss tangents. IEEE Microw. Wirel. Comp. Lett. 2014, 24, 563–565. [Google Scholar] [CrossRef]
- Han, X.; Li, X.; Zhou, Y.; Ma, Z.; Peng, P.; Fu, C.; Qiao, L. Microwave sensor loaded with complementary curved ring resonator for material permittivity detection. IEEE Sens. J. 2022, 22, 20456–20463. [Google Scholar] [CrossRef]
- Lee, C.S.; Yang, C.L. Single-compound complementary split-ring resonator for simultaneously measuring the permittivity and thickness of dual-layer dielectric materials. IEEE Trans. Microw. Theory Tech. 2015, 63, 2010–2023. [Google Scholar] [CrossRef]
- Lim, S.; Kim, C.Y.; Hong, S. Simultaneous measurement of thickness and permittivity by means of the resonant frequency fitting of a microstrip line ring resonator. IEEE Microw. Wirel. Compon. Lett. 2018, 28, 539–541. [Google Scholar] [CrossRef]
- Ji, Q.; Gu, T.; Gao, Z.; Yang, M.; Yuan, Y.; Du, H.; Wan, F.; Murad, N.M.; Fontgalland, G.; Silva, H.S.; et al. CSRR DGS-based bandpass negative group delay circuit design. IEEE Access 2023, 11, 20309–20318. [Google Scholar] [CrossRef]
- Huang, X. Design of miniaturized SIW filter loaded with improved CSRR structures. Electronics 2023, 12, 3789. [Google Scholar] [CrossRef]
- Hu, K.Z.; Huang, H.Y.; Tang, M.C.; Chen, Z.; Yan, D.; Wang, P. A single-layer wideband differential-fed filtering antenna with high selectivity. IEEE Trans. Antennas Propag. 2023, 71, 4522–4527. [Google Scholar] [CrossRef]
- Bait-Suwailam, M.M. Towards monitoring and identification of red palm weevil gender using microwave CSRR-loaded TL sensors. Sensors 2023, 23, 6798. [Google Scholar] [CrossRef]
- Haq, T.; Koziel, S. Rapid design optimization and calibration of microwave sensors based on equivalent complementary resonators for high sensitivity and low fabrication tolerance. Sensors 2023, 23, 1044. [Google Scholar] [CrossRef] [PubMed]
- Alahnomi, R.A.; Zakaria, Z.; Ruslan, E.; Ab Rashid, S.R.; Mohd Bahar, A.A. High Q sensor based on symmetrical split ring resonator with spurlines for solid material detection. IEEE Sens. J. 2017, 17, 2766–2775. [Google Scholar] [CrossRef]
- Ebrahimi, A.; Scott, J.; Ghorbani, K. Dual-mode resonator for simultaneous permittivity and thickness measurement of dielectrics. IEEE Sens. J. 2020, 20, 185–192. [Google Scholar] [CrossRef]
- Liu, Q.; Deng, H.; Meng, P.; Sun, H. High sensitivity sensor loaded with octagonal spiral resonators for retrieval of solid material permittivity. IEEE Sens. J. 2021, 21, 20010–20017. [Google Scholar] [CrossRef]
- Alharbi, F.T.; Haq, M.; Udpa, L.; Deng, Y. Characterization of conductor-backed dielectric substrates using a novel resonance-based method. IEEE Sens. J. 2022, 22, 2099–2109. [Google Scholar] [CrossRef]
- Varshney, P.K.; Kapoor, A.; Akhtar, M.J. Highly sensitive ELC resonator based differential sensor. IEEE Trans. Instrum. Meas. 2021, 70, 8004710. [Google Scholar] [CrossRef]
- Haq, T.; Koziel, S. Inverse modeling and optimization of CSRR-based microwave sensors for industrial applications. IEEE Trans. Microw. Theory Tech. 2022, 70, 4796–4804. [Google Scholar] [CrossRef]


| Geometry of Structure | Fundamental Resonant Frequency (GHz/dB) | Quality Factor Unloaded | Resonant Frequency Due to Interaction with MUT | Frequency Shift (GHz) |
|---|---|---|---|---|
| CSSRR | 8.6/−26.7 | 39 | 7.4/−27.5 | 1.2 |
| M1 | 11.5/−25.6 | 41 | 9.8/−24.5 | 1.7 |
| M2 | 9.1/−19.3 | 65 | 7.8/−16.3 | 1.3 |
| M3 | 10/−23.6 | 46 | 8.5/−30.1 | 1.5 |
| M4 | 12.9/−16.5 | 27 | 11.1/−14.1 | 1.8 |
| CCAR (Pre-optimized) | 13.2/−31.3 | 120 | 11.2/−32.5 | 2 |
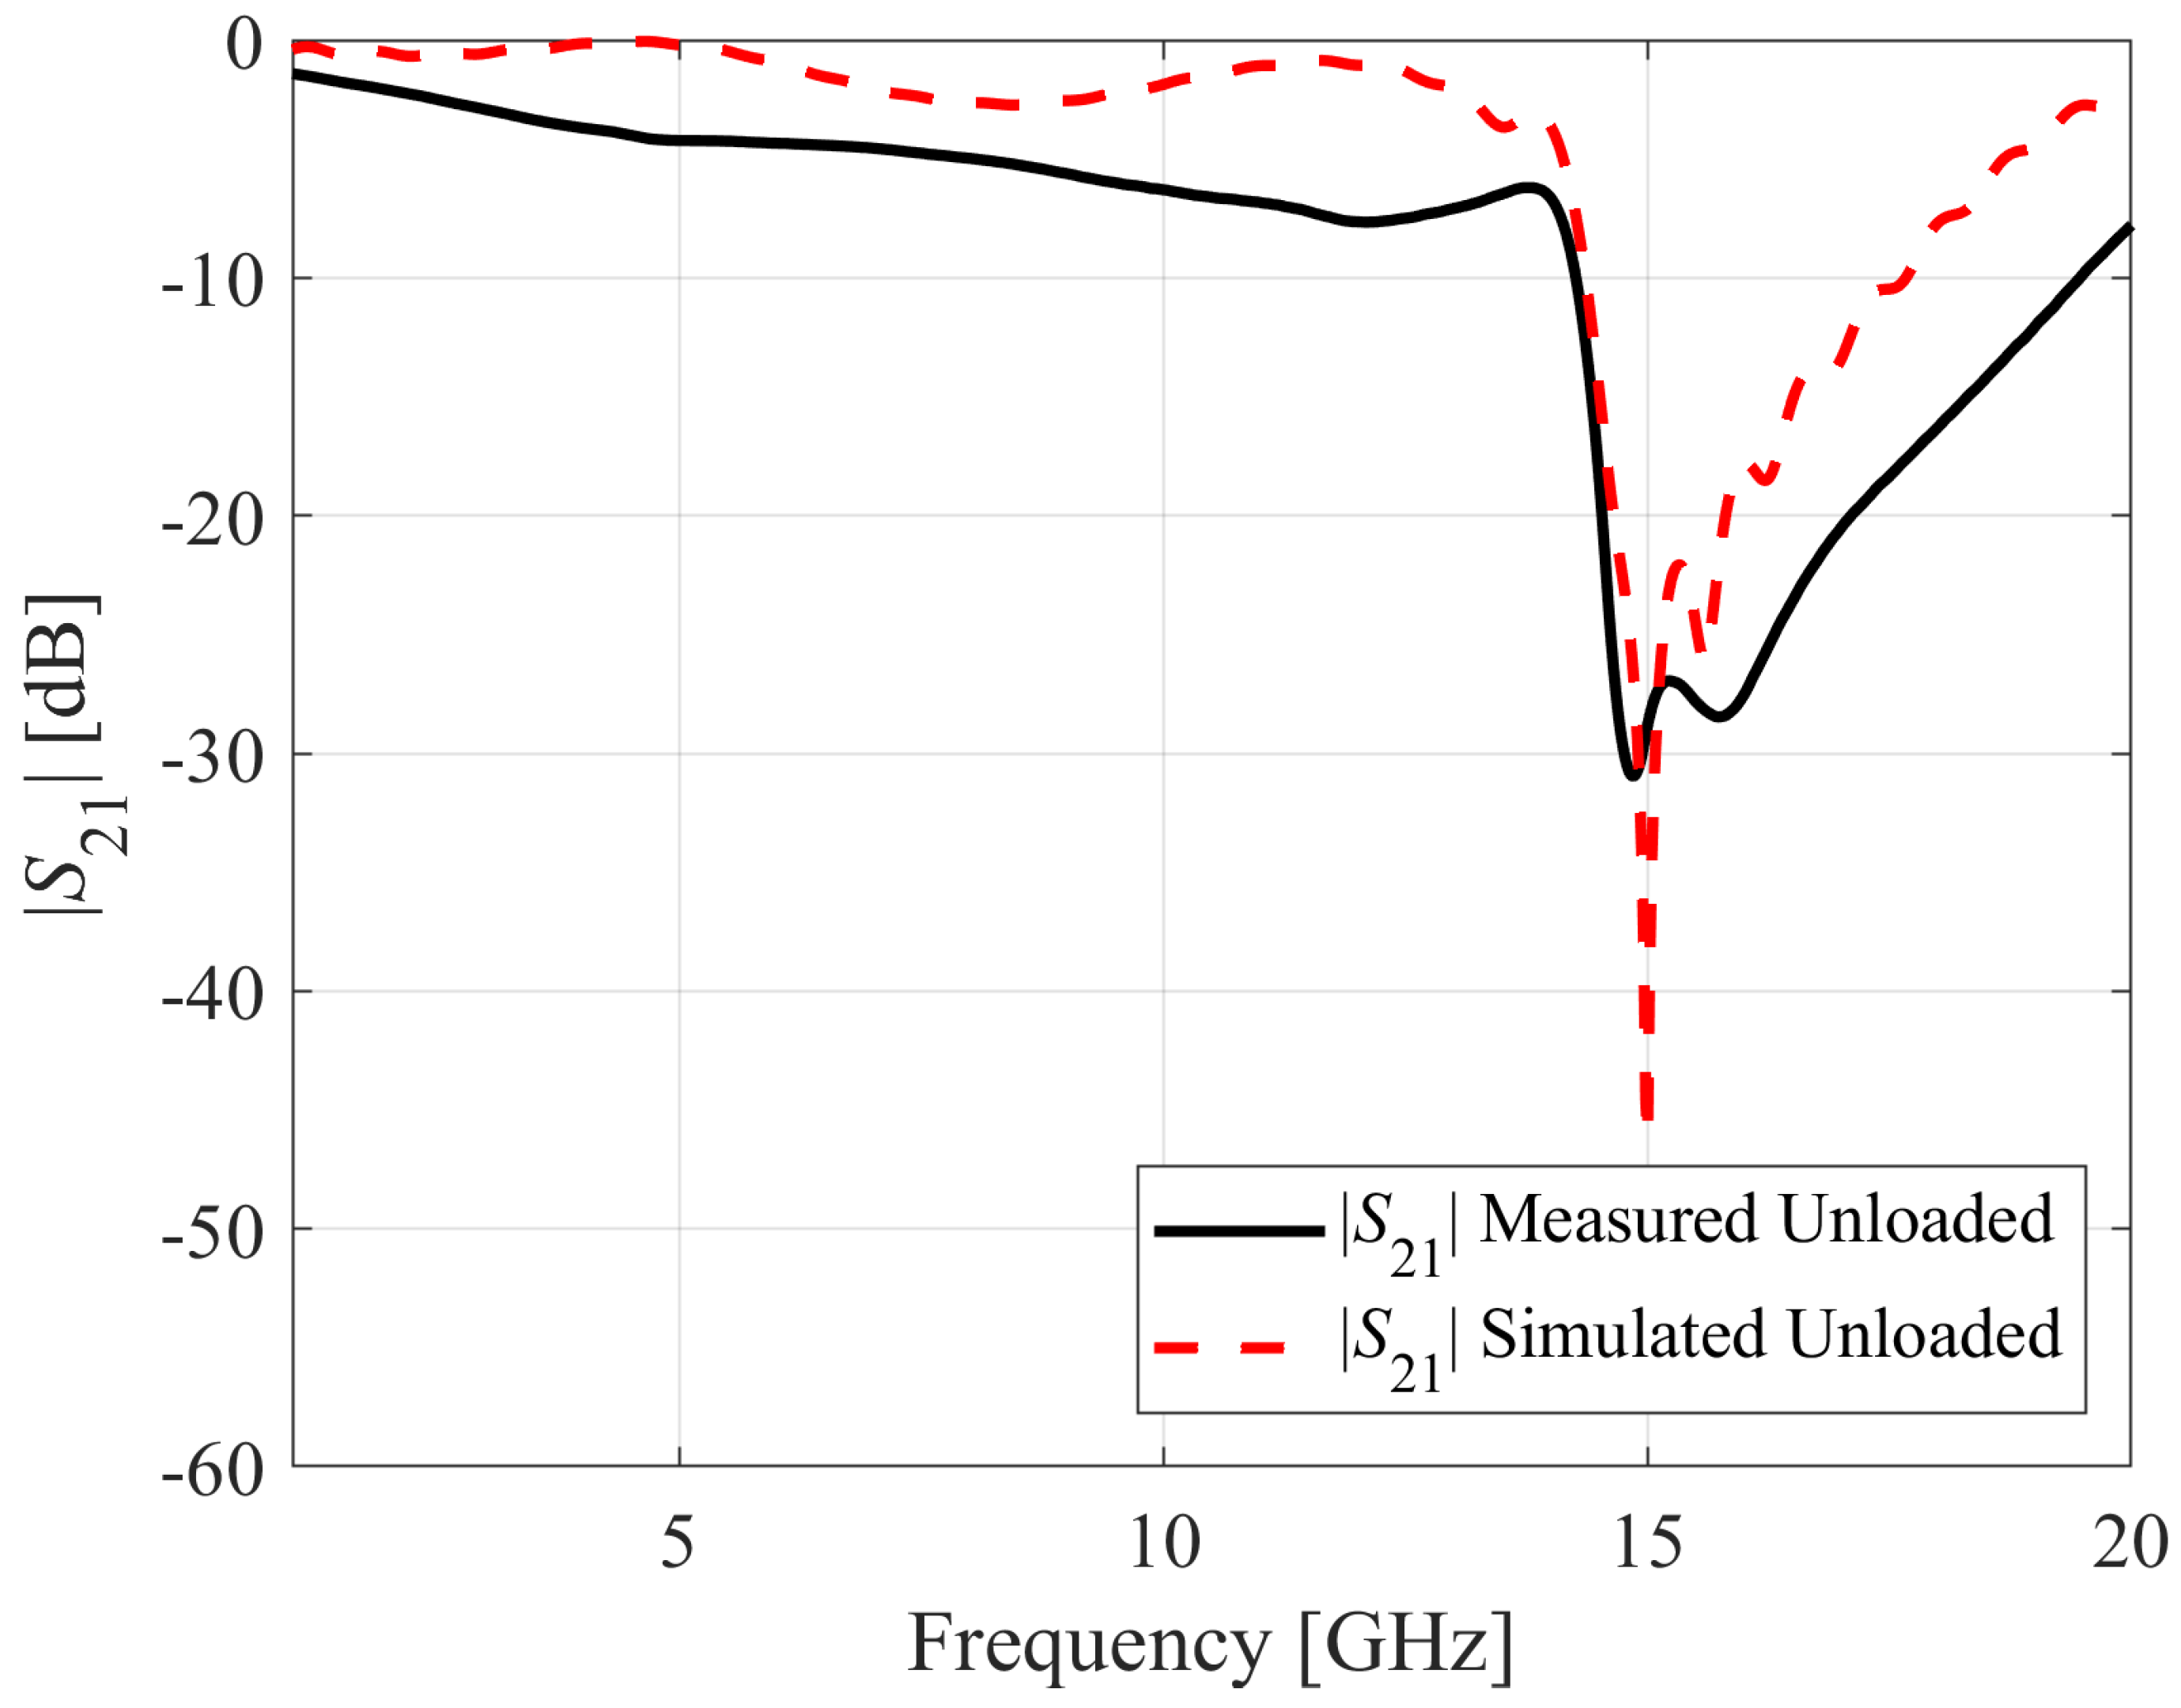
| CCAR (Optimized) | 15/−46.2 | 136 | 12.6/−31.1 | 2.4 |
| MUT | Relative Permittivity | Thickness (mm) | Average Resonant Frequency f0 (GHz) | Standard Deviation of Resonant Frequency (GHz) |
|---|---|---|---|---|
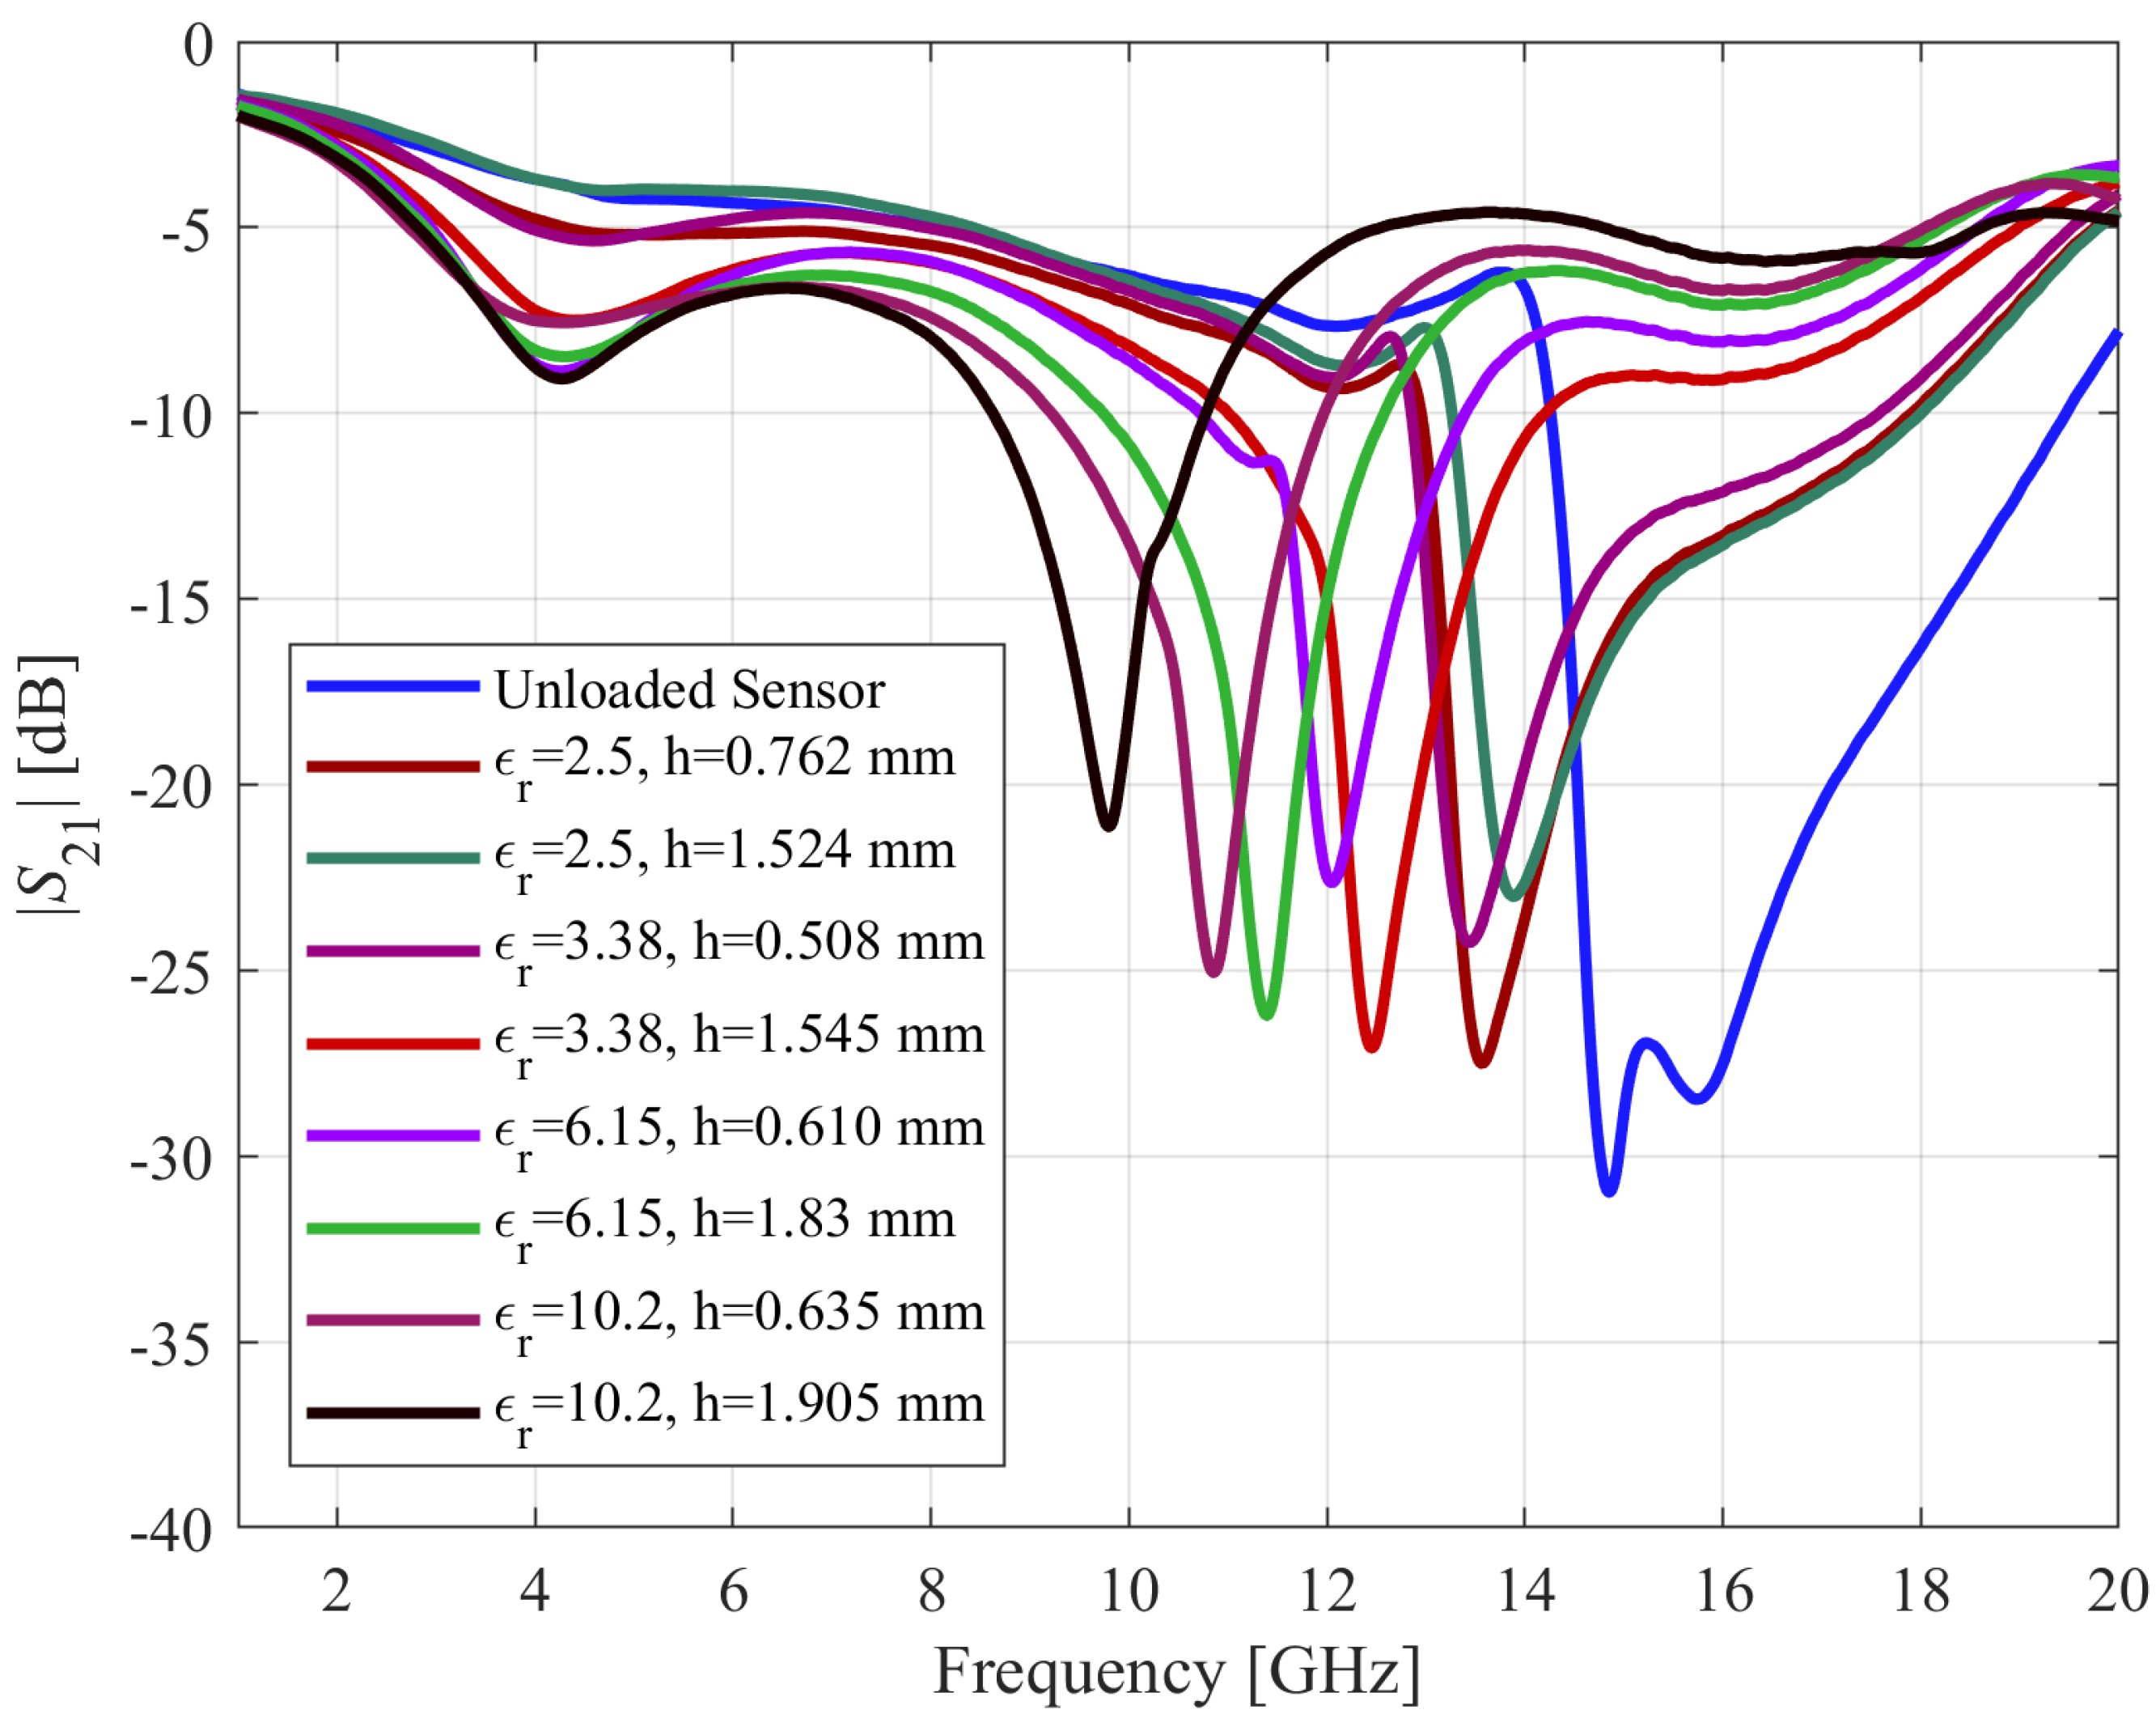
| AD250C | 2.5 | 0.762 | 13.73 | 0.16 |
| AD250C | 2.5 | 1.524 | 14.08 | 0.23 |
| RO4003C | 3.38 | 0.508 | 13.11 | 0.35 |
| RO4003C | 3.38 | 1.545 | 12.50 | 0.23 |
| RO4360 | 6.15 | 0.610 | 12.48 | 0.33 |
| RO4360 | 6.15 | 1.83 | 11.60 | 0.16 |
| RO3010 | 10.2 | 0.635 | 10.36 | 0.45 |
| RO3010 | 10.2 | 1.905 | 9.64 | 0.20 |
| MUT | Nominal Relative Permittivity | Sample Thickness (mm) | Measured Resonant Frequency f0 (GHz) | Model-Predicted Permittivity (GHz) | Actual Prediction Error # | Estimated Maximum Prediction Error $ |
|---|---|---|---|---|---|---|
| AD300C | 2.97 | 1.524 | 13.41 | 2.73 | 0.24 [8%] | 0.31 |
| RO4003C | 3.38 | 0.813 | 13.52 | 3.28 | 0.10 [3%] | 0.30 |
| RF-35 | 3.5 | 0.762 | 13.47 | 3.39 | 0.11 [3%] | 0.31 |
| FR-4 | 4.3 | 1.524 | 12.49 | 4.34 | 0.04 [1%] | 0.37 |
| RO4360 | 6.15 | 1.22 | 11.81 | 6.06 | 0.07 [1%] | 0.42 |
| RO3010 | 10.2 | 1.27 | 9.87 | 10.75 | 0.55 [5%] | 0.55 |
| Ref. | Resonator | Resonant Frequency (GHz) | Characterization Based on | Material under Test | Calibration Model | Relative Sensitivity |
|---|---|---|---|---|---|---|
| [23] | Symmetrical Split Ring Resonator | 2.22 | Permittivity | Rogers5880, Rogers 4350, FR4 | Curve Fitting | 1.51 |
| [24] | Magnetic Resonator | 1.65 | Permittivity & Thickness | Rogers5880, Rogers 3006, Rogers 6010 | No | 3.19 |
| [25] | Octagonal Spiral Resonator | 2.48 | Permittivity | PTFE, Rogers RO4350, F4BTM | Curve Fitting | 4.61 |
| [26] | Complementary Split Ring Resonator | 4.1 | Permittivity | Conductor Backed Dielectric | No | 4.74 |
| [27] | Electric Resonator | 3.364 | Permittivity & Thickness | Teflon, Polyethylene, Plexiglas, PVC, Dry Wood | Linear Fitting | 4.91 |
| [28] | Complementary Split Ring Resonator | 14.45 | Permittivity | TLY-5, AD300, RO4535, FR4 | Inverse Regression Model | 5.41 |
| This Work | Complementary Crossed Arrows Resonator | 14.85 | Permittivity & Thickness | AD250C RO4003, FR4, R04360, RO3010 | Inverse Regression Model | 5.74 |
Disclaimer/Publisher’s Note: The statements, opinions and data contained in all publications are solely those of the individual author(s) and contributor(s) and not of MDPI and/or the editor(s). MDPI and/or the editor(s) disclaim responsibility for any injury to people or property resulting from any ideas, methods, instructions or products referred to in the content. |
© 2023 by the authors. Licensee MDPI, Basel, Switzerland. This article is an open access article distributed under the terms and conditions of the Creative Commons Attribution (CC BY) license (https://creativecommons.org/licenses/by/4.0/).
Share and Cite
Haq, T.; Koziel, S. New Complementary Resonator for Permittivity- and Thickness-Based Dielectric Characterization. Sensors 2023, 23, 9138. https://doi.org/10.3390/s23229138
Haq T, Koziel S. New Complementary Resonator for Permittivity- and Thickness-Based Dielectric Characterization. Sensors. 2023; 23(22):9138. https://doi.org/10.3390/s23229138
Chicago/Turabian StyleHaq, Tanveerul, and Slawomir Koziel. 2023. "New Complementary Resonator for Permittivity- and Thickness-Based Dielectric Characterization" Sensors 23, no. 22: 9138. https://doi.org/10.3390/s23229138