

Thermal Image Super-Resolution Based on Lightweight Dynamic Attention Network for Infrared Sensors

Abstract
:1. Introduction
- Aiming at the problem of the low perception quality of civilian LR uncooled infrared sensors, we propose a CNN-based dynamic attention network to super-resolve LR thermal images. The proposed network outperforms compared models with more parameters while maintaining a lightweight structure, showing the potential to be deployed on a handheld thermal imaging camera devices with limited computing power. We train the proposed network with a mixture of data augmentation methods, and experiments show that multiple pixel domain data augmentation methods can effectively improve the ISR performance.
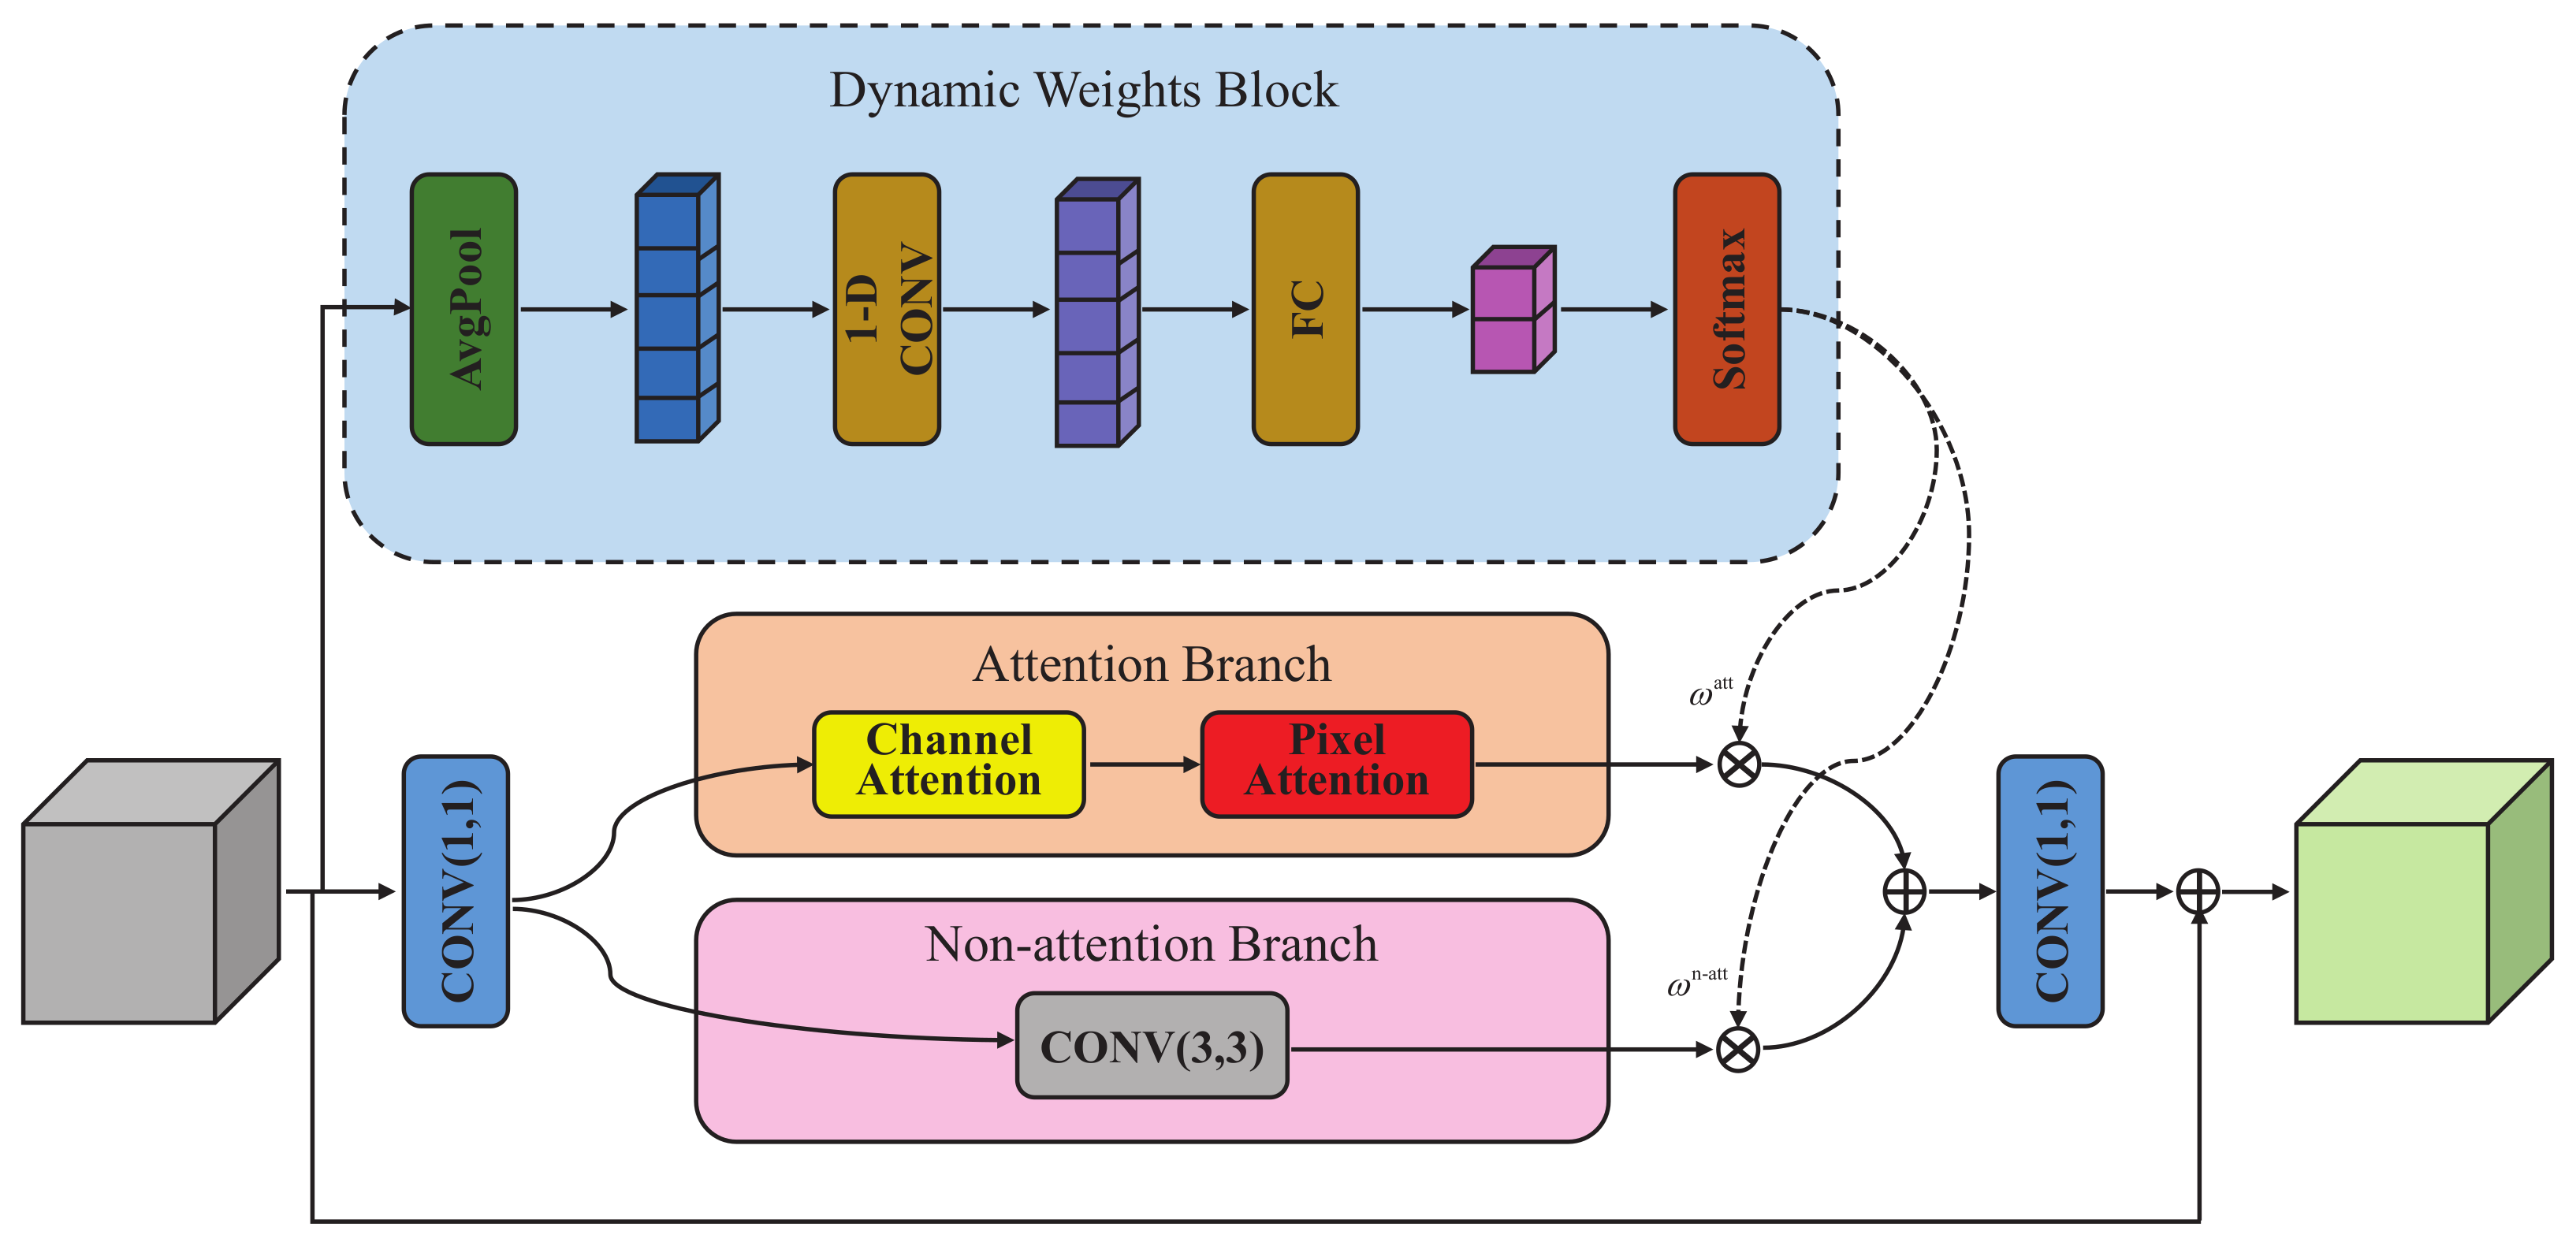
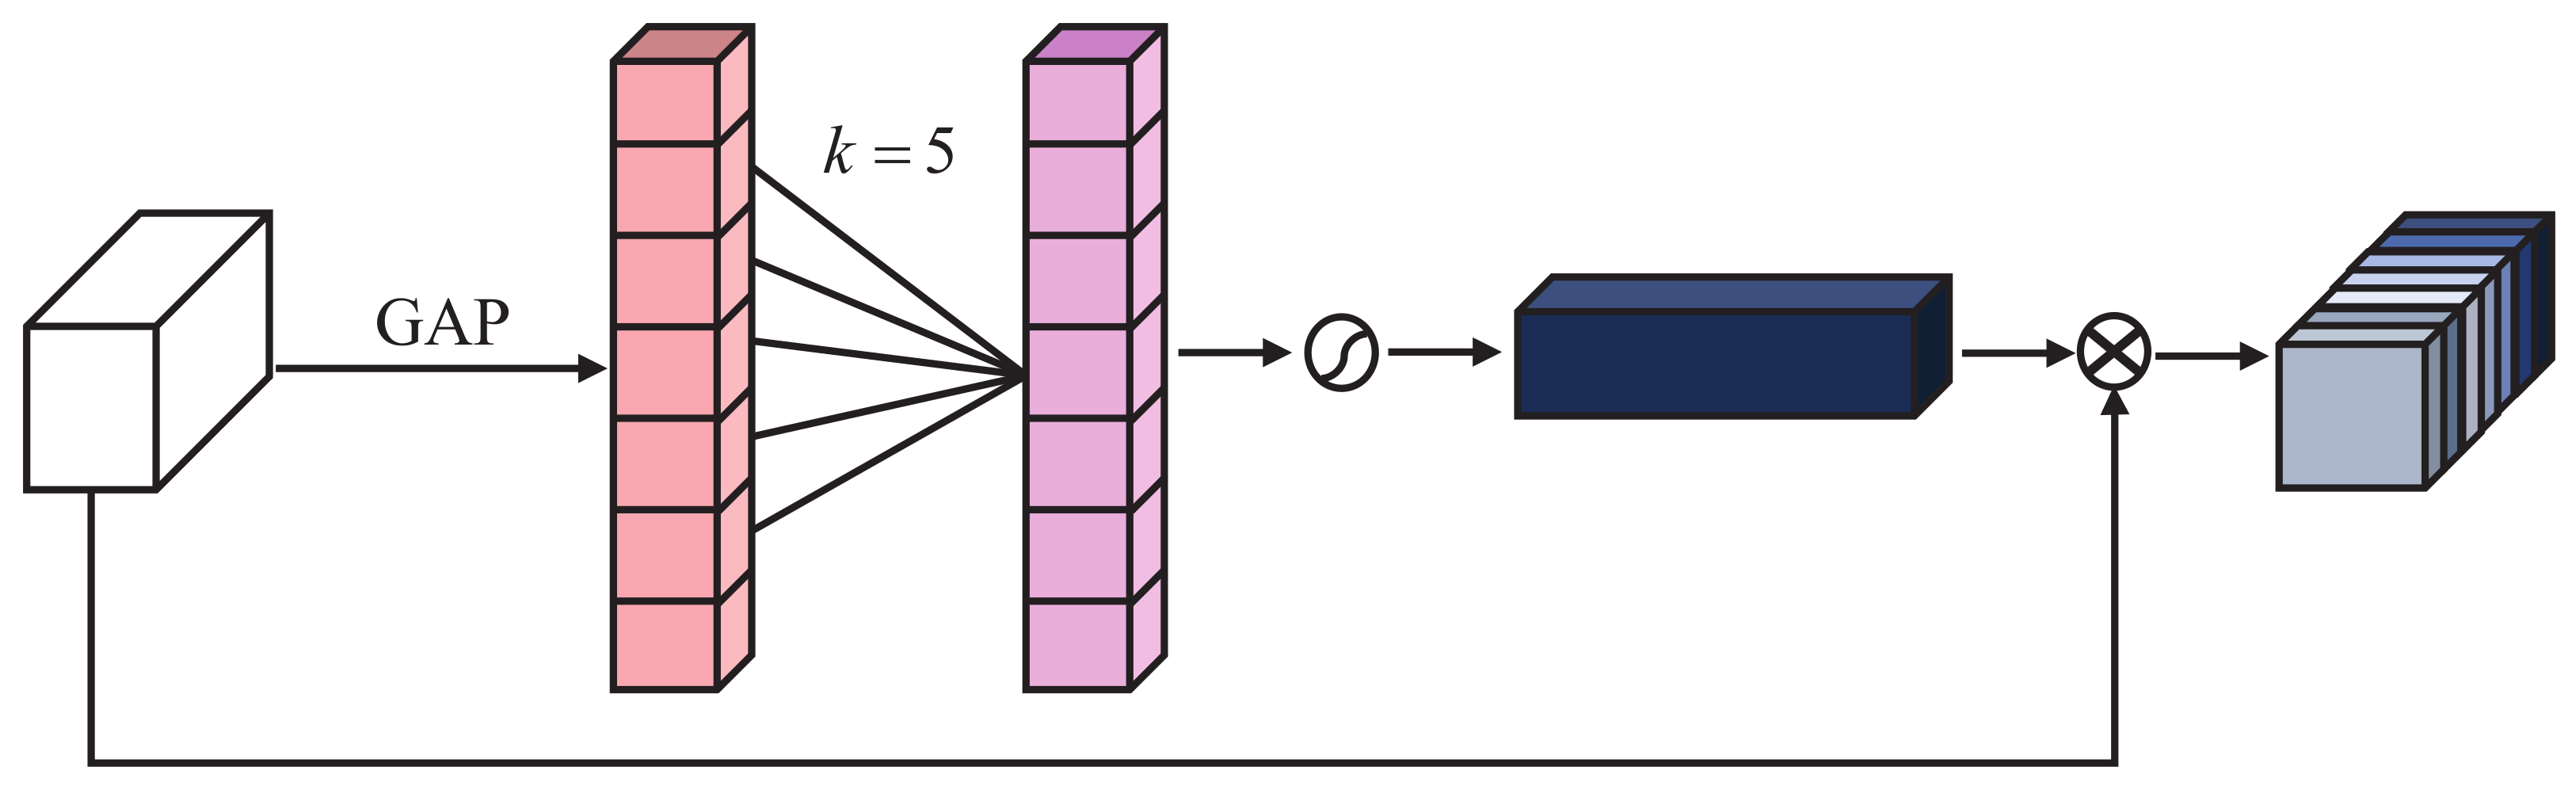
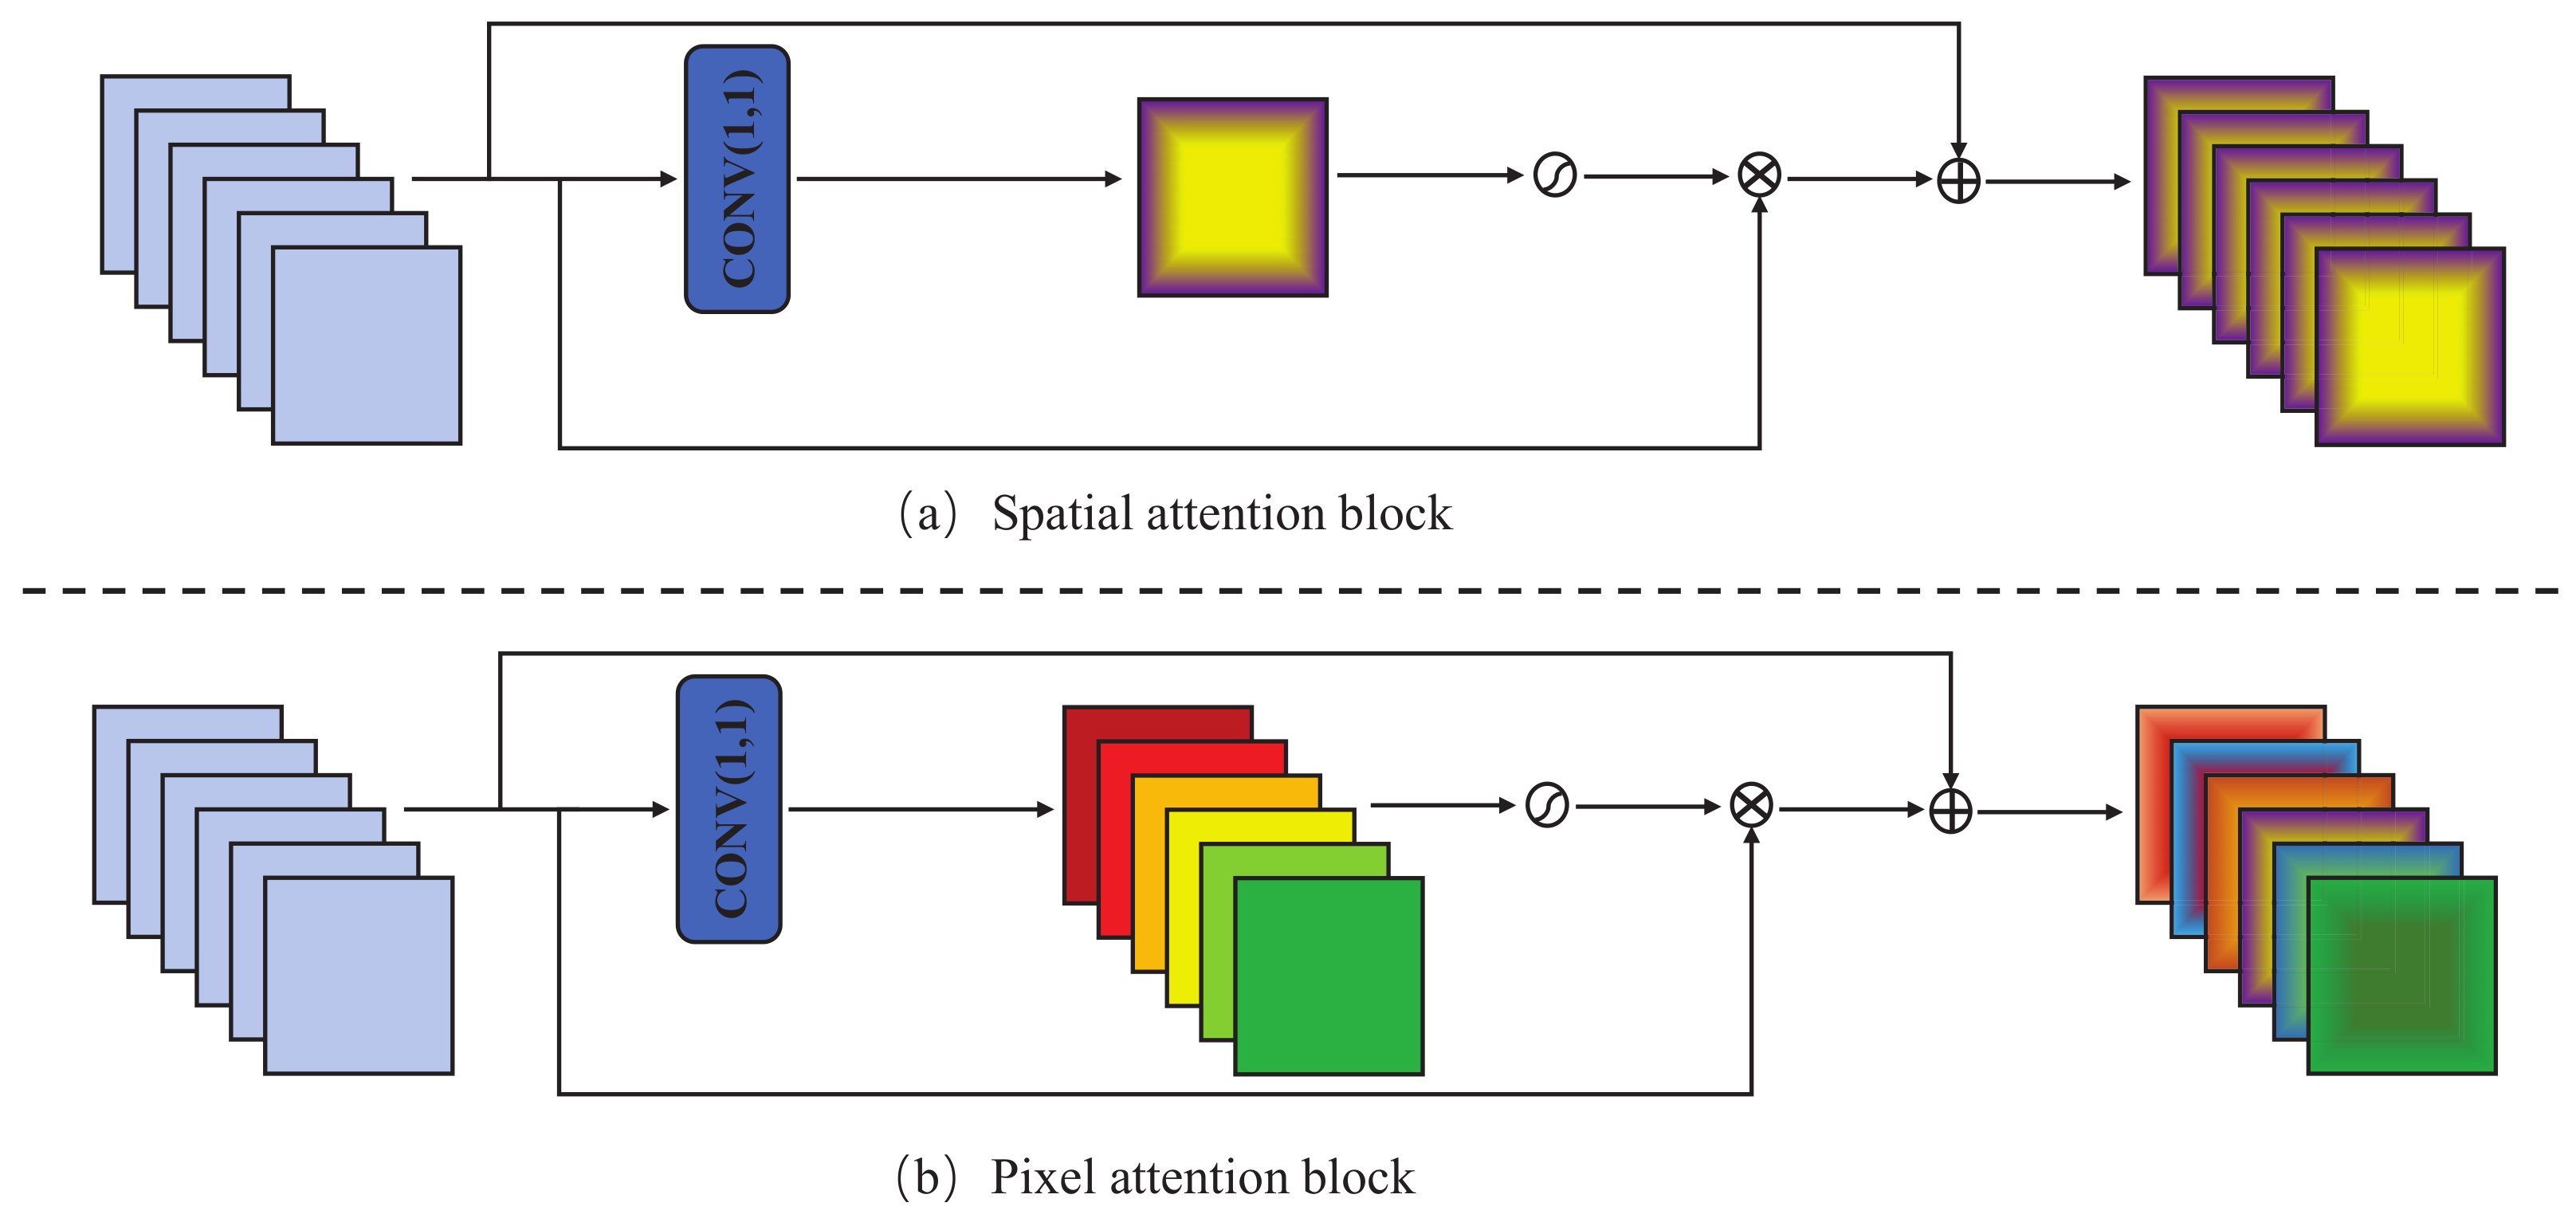
- We propose a lightweight DAB. DAB at different stages dynamically reweights the attention and non-attention branches according to the input feature maps. Furthermore, our proposed attention branch consists of an efficient CA block and a residual pixel attention block; the latter differs from existing SA mechanisms that only generate 2D attention maps but use 3D attention maps to enhance spatial features.
- Qualitative and quantitative results on multiple datasets demonstrate that the proposed network can effectively improve thermal image resolution while recovering visually pleasing high-frequency details. Specifically, the proposed network achieves the highest performance metrics on the public testing dataset with ×3 scale factor. And compared to the second-best model , the scope of parameters is only 34% of latter (i.e., 0.34 M vs. 1.0 M).
2. Related Work
2.1. CNN-Based Image Super-Resolution
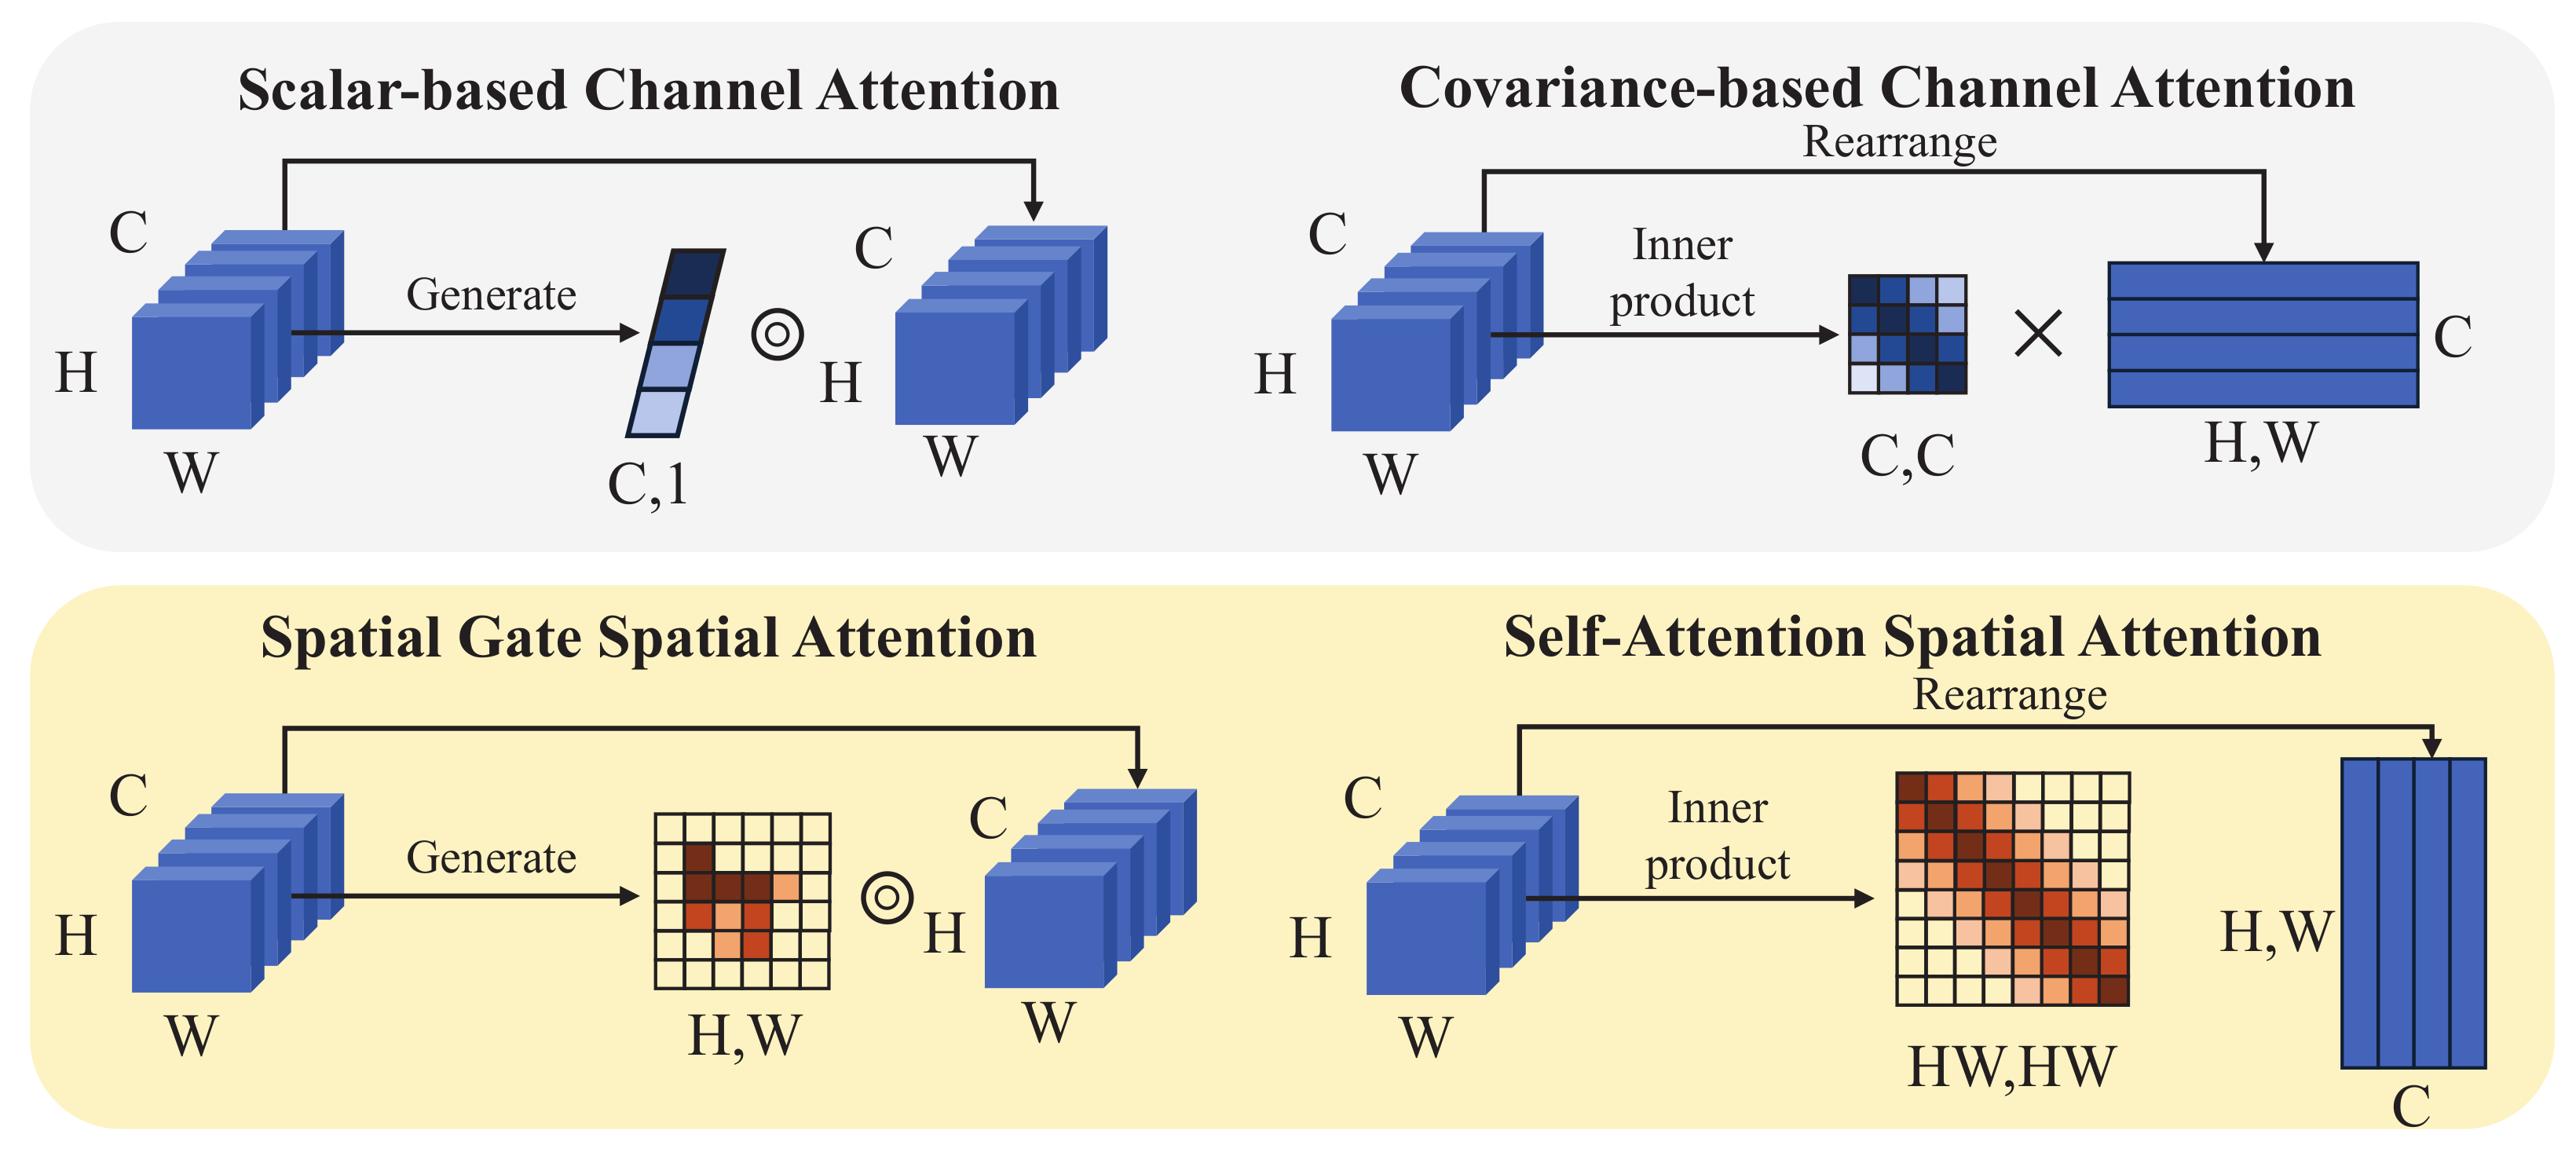
2.2. Attention Mechanisms in Image Super-Resolution
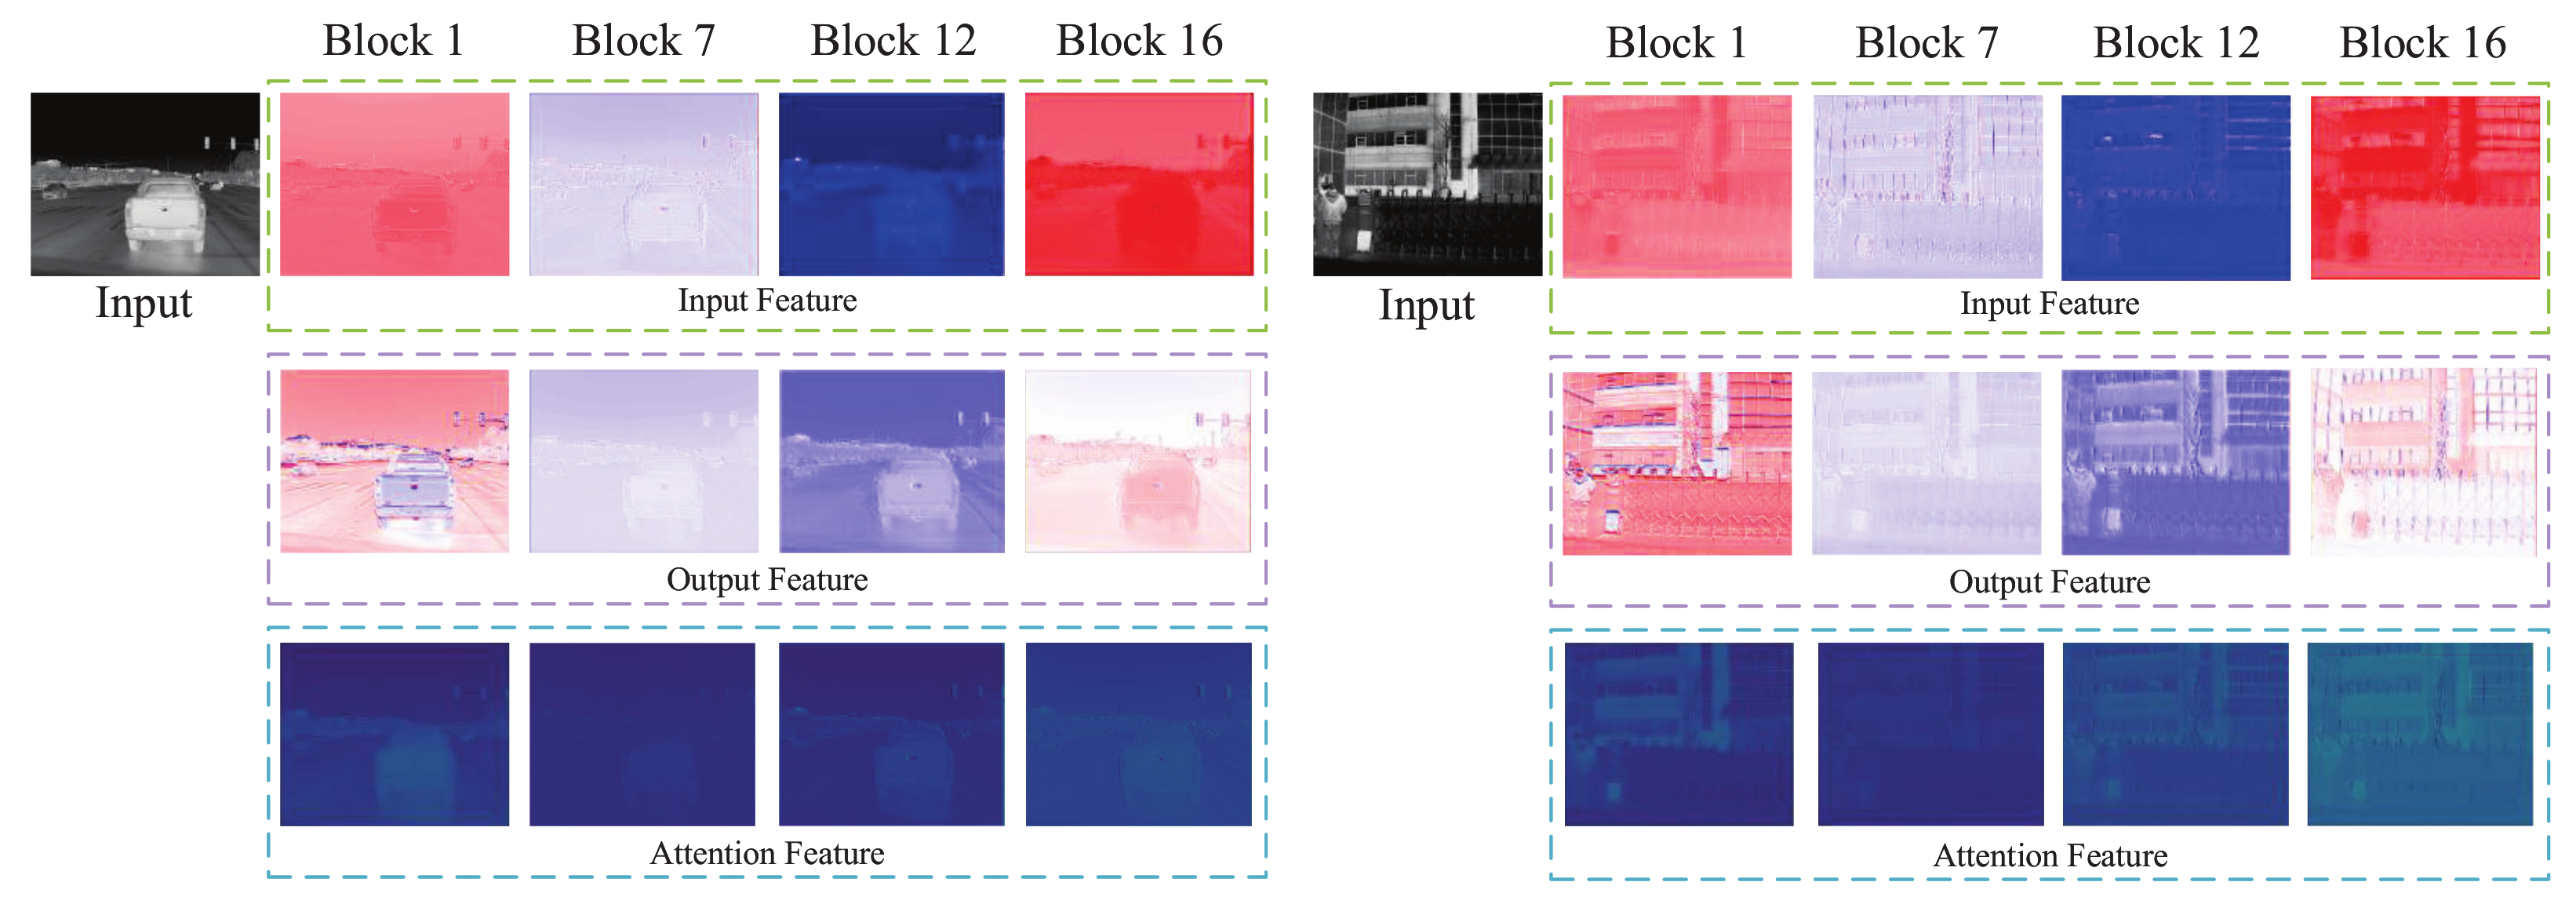
3. Motivation
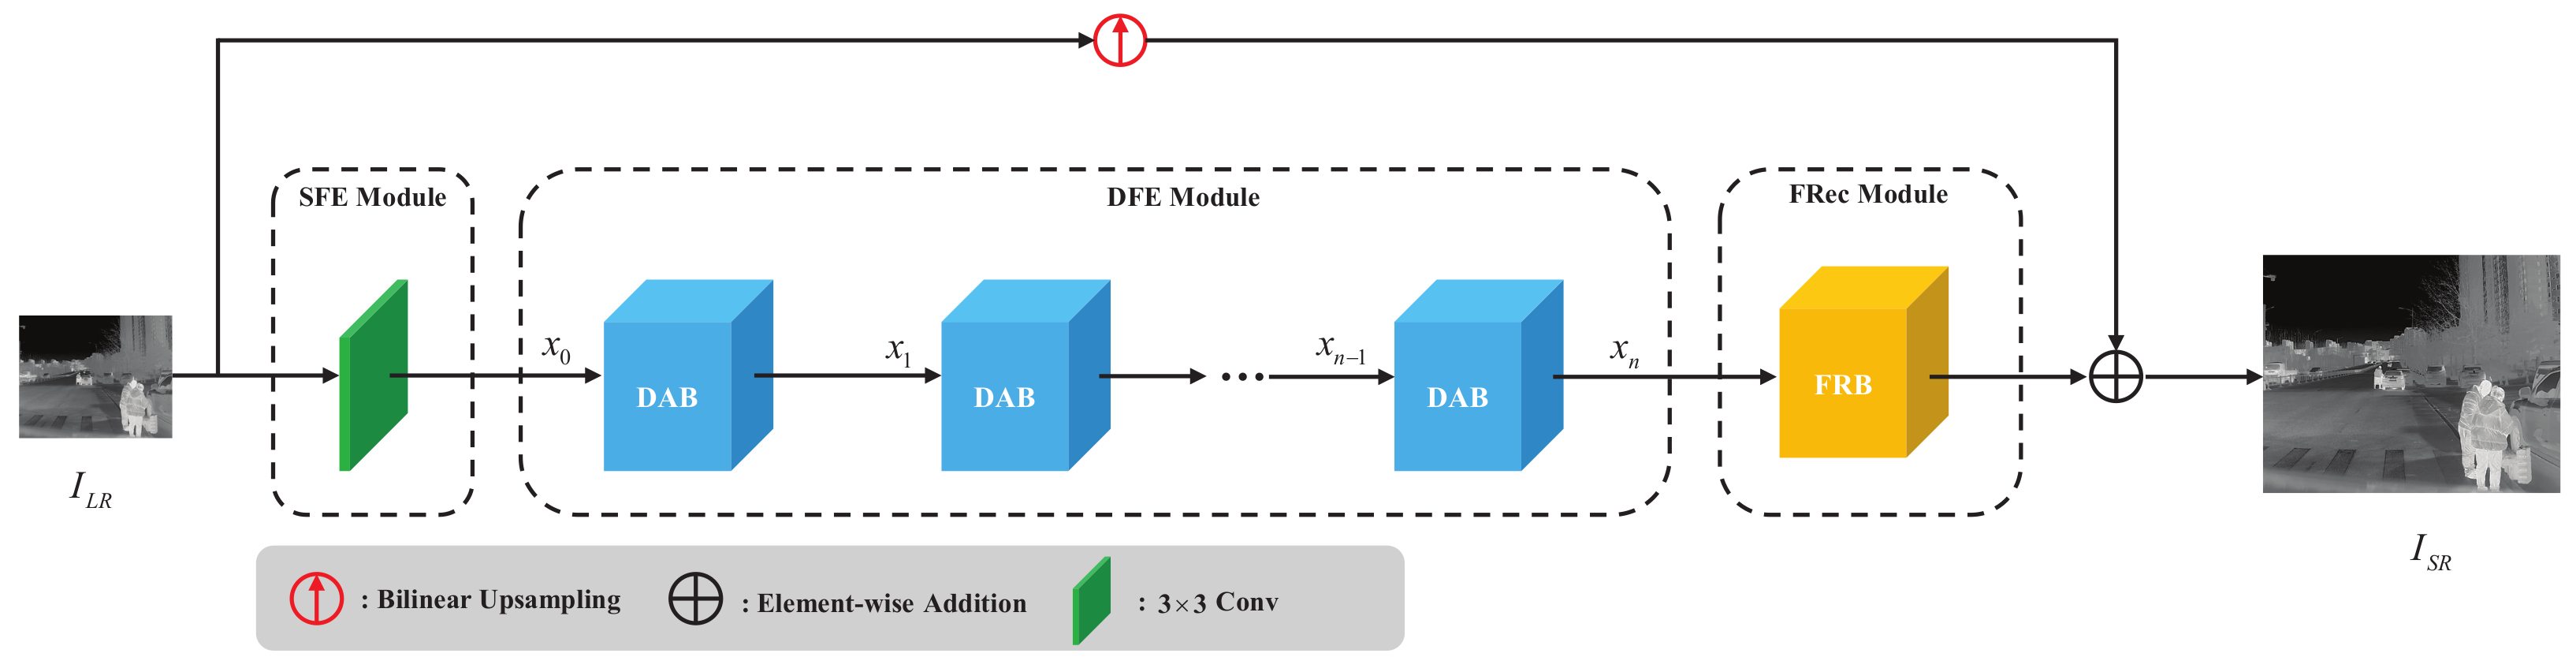
4. Proposed Method
- (1)
- Shallow feature extraction (SFE) module. The input LR thermal image first passes through an SFE module consisting of a 3 × 3 convolution kernel to extract low-level features. Our experiments show that using a single 3 × 3 convolution is a acceptable balance between performance and parameters.
- (2)
- Deep feature extraction (DFE) module. The output of the SFE module is used to extract deeper features through the DFE module. As a key component of LDASRNet, the DFE module consists of K dynamic attention blocks for dynamically enhancing high-frequency feature extraction according to the input feature maps.
- (3)
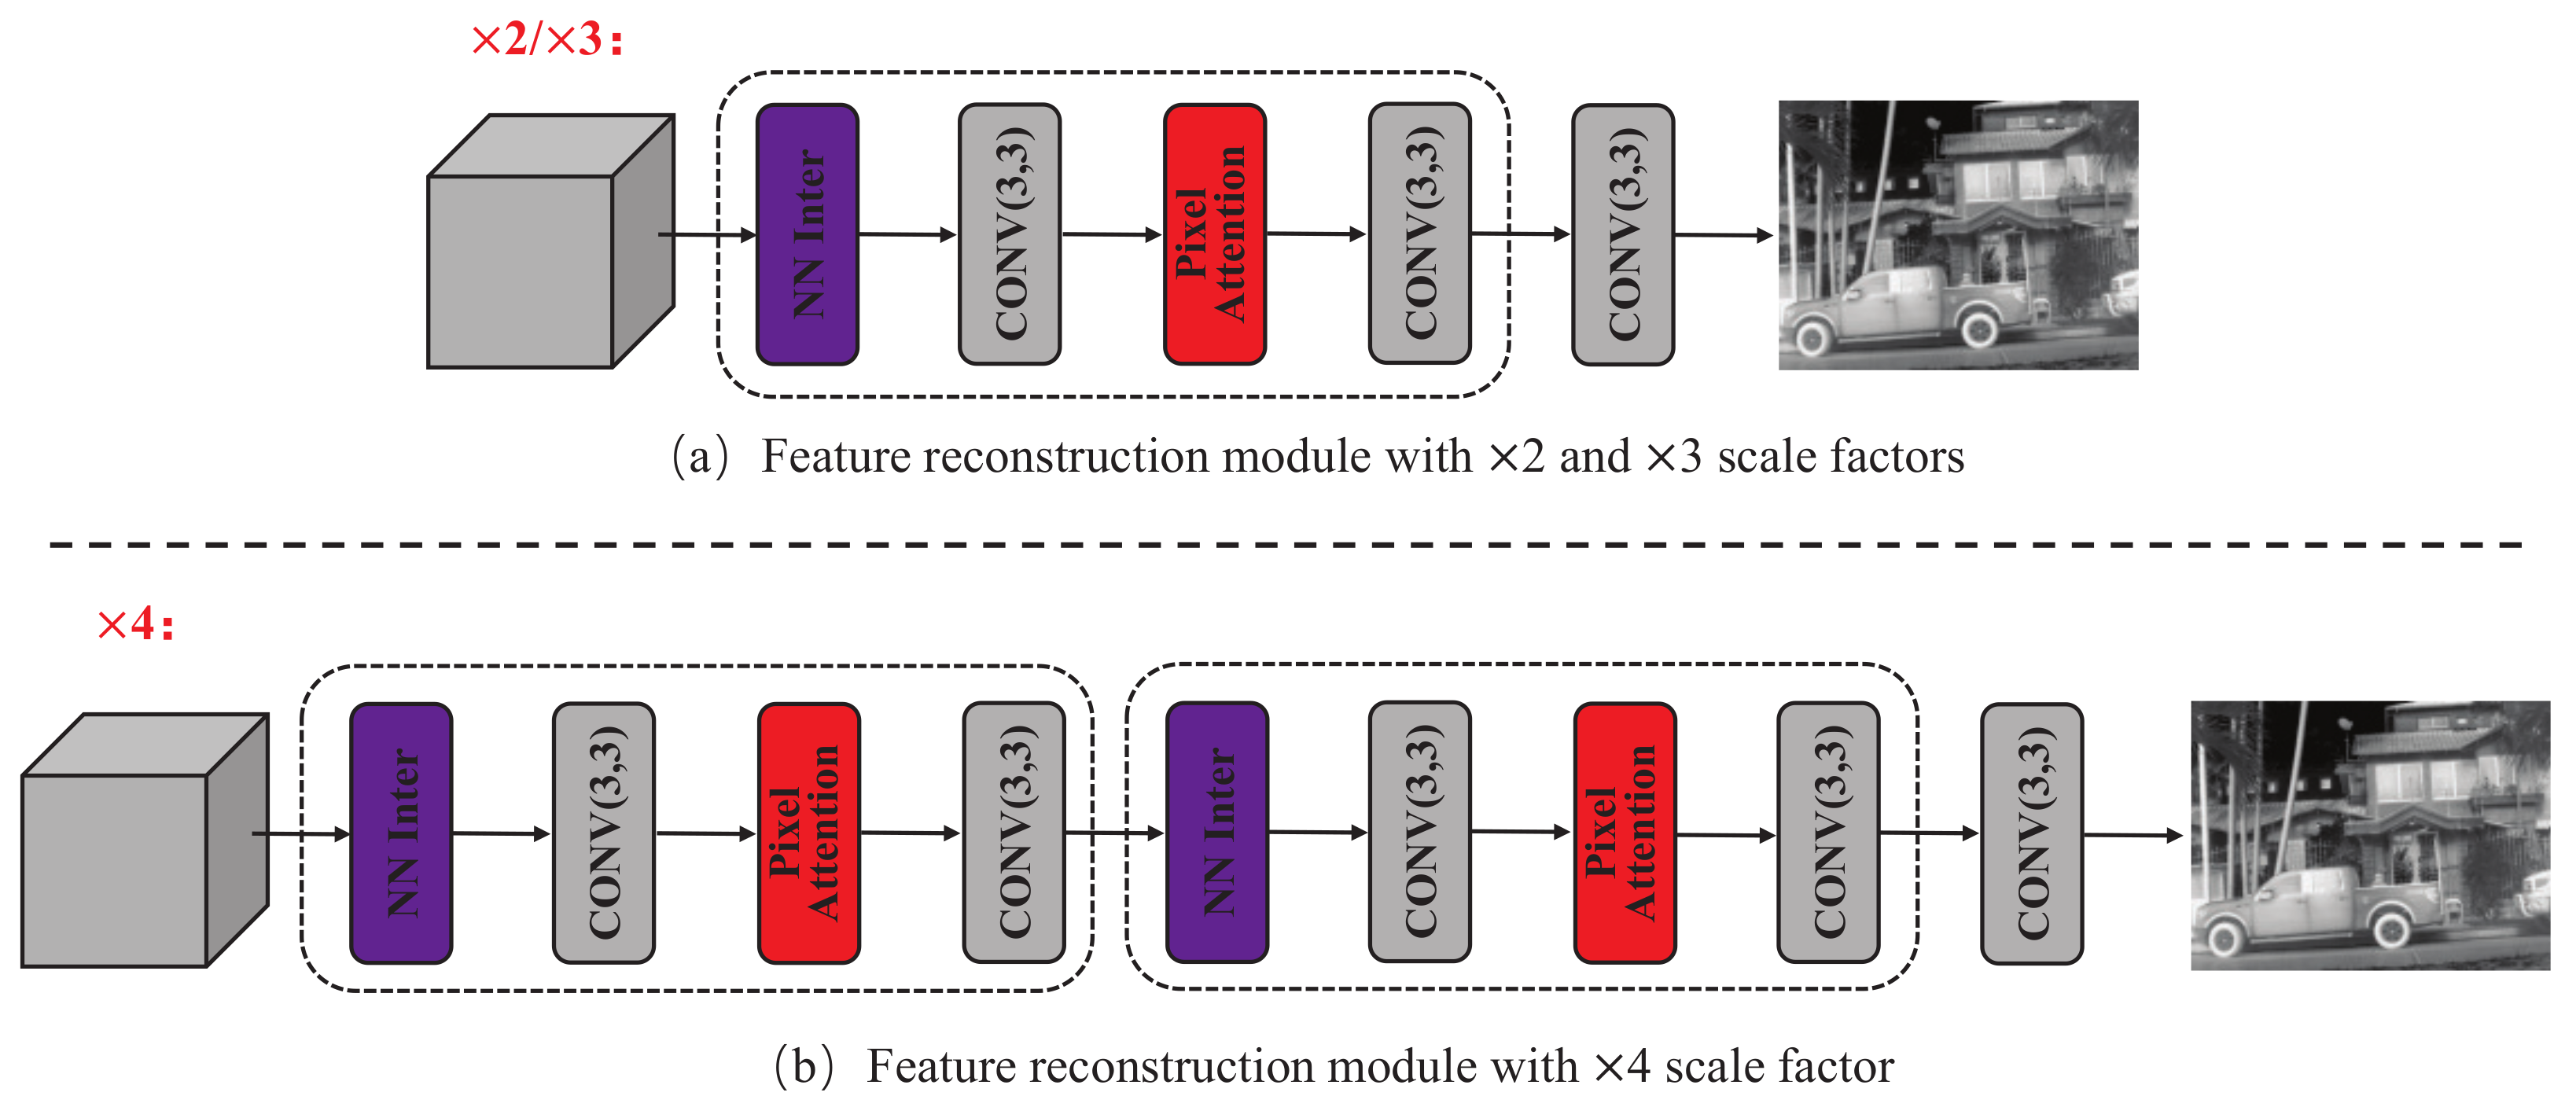
- Feature reconstruction (FRec) module. The FRec module constructs the outputs of the DFE module into the final HR thermal image. Due to the lower LR spatial resolution of the ×4 scale factor compared to the ×2 and ×3 scale factors, reconstruction is more difficult. We designed two types of FRec modules specifically for the ×2/×3 and ×4 scale factors, respectively.
4.1. Shallow Feature Extraction Module
4.2. Deep Feature Extraction Module
4.2.1. Dynamic Weights Block
4.2.2. Attention Branch
4.2.3. Non-Attention Branch
4.3. Feature Reconstruction Module
5. Experimental Analysis
5.1. Training and Testing Datasets
5.2. Evaluation Metrics
5.3. Data Augmentation Method
5.4. Implementation Details
5.5. Ablation Experiments
5.6. Quantitative Experiments
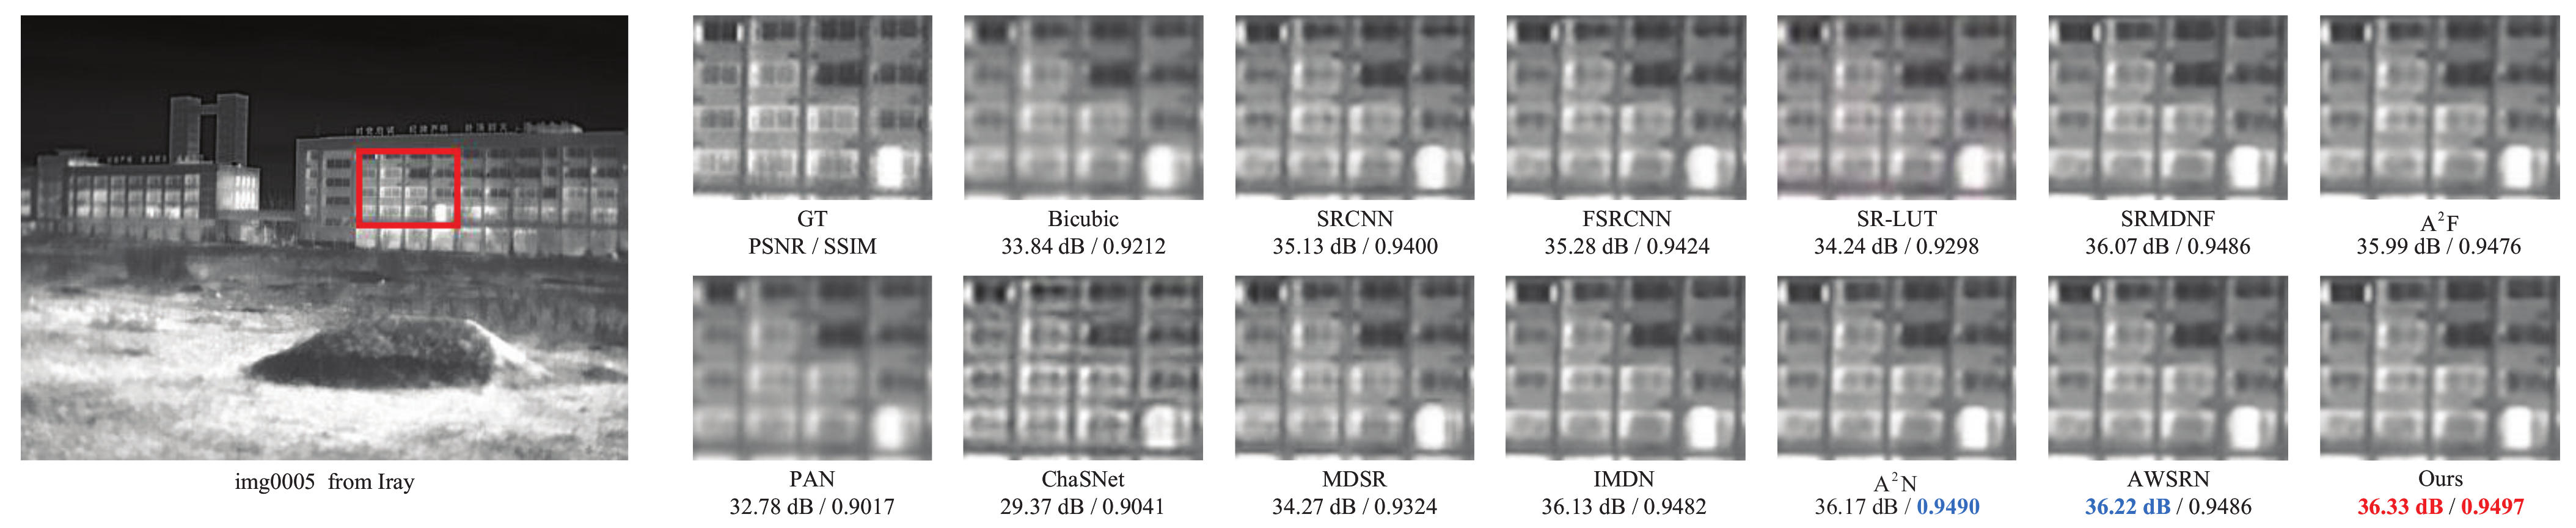
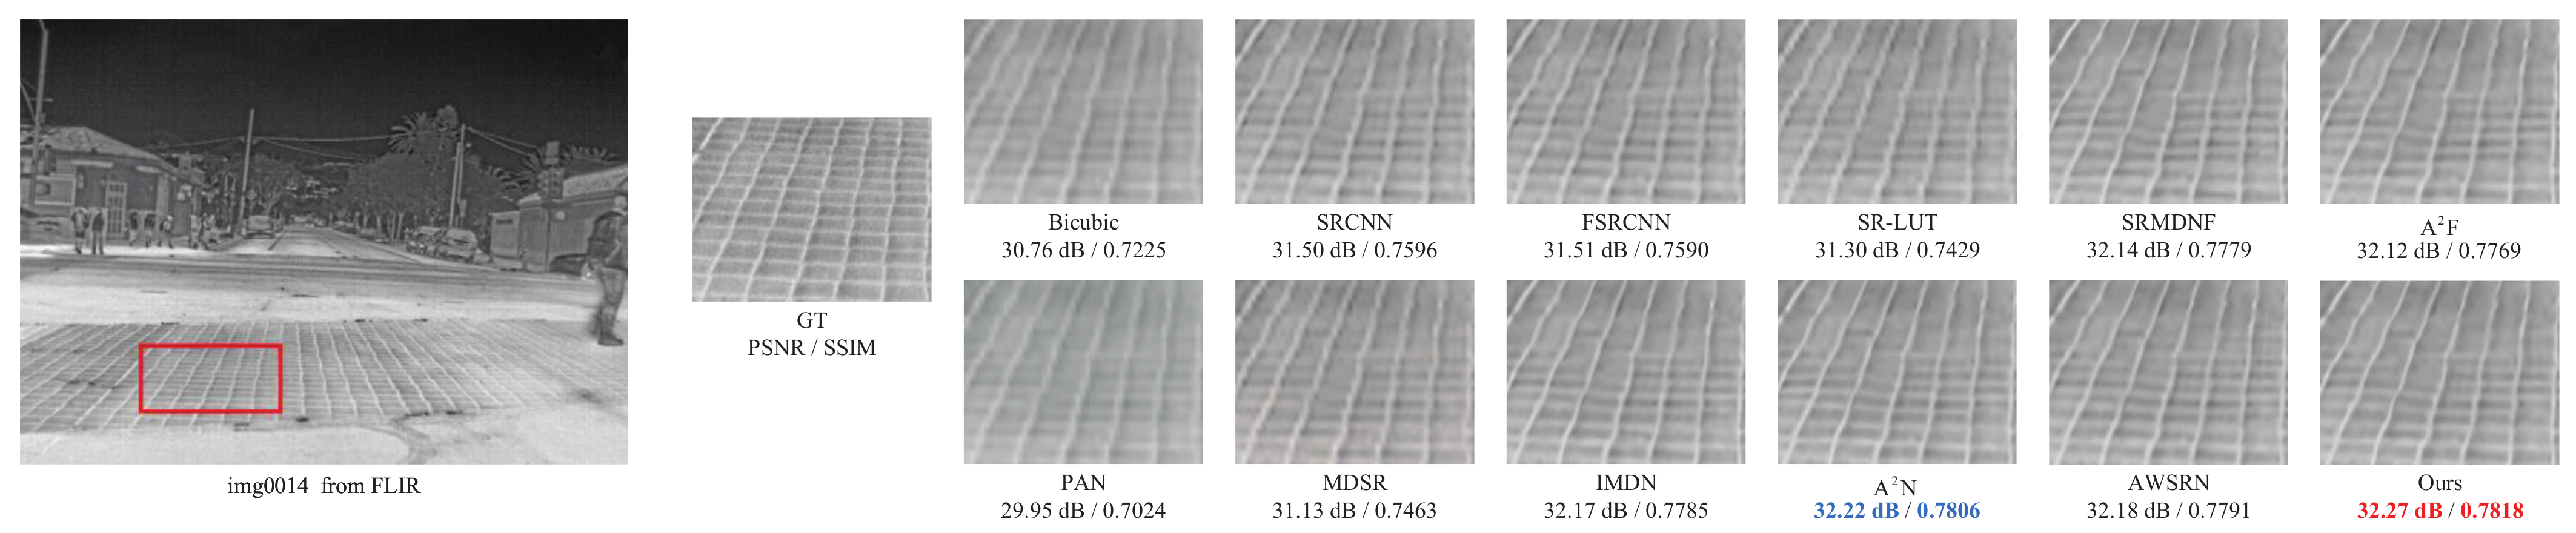
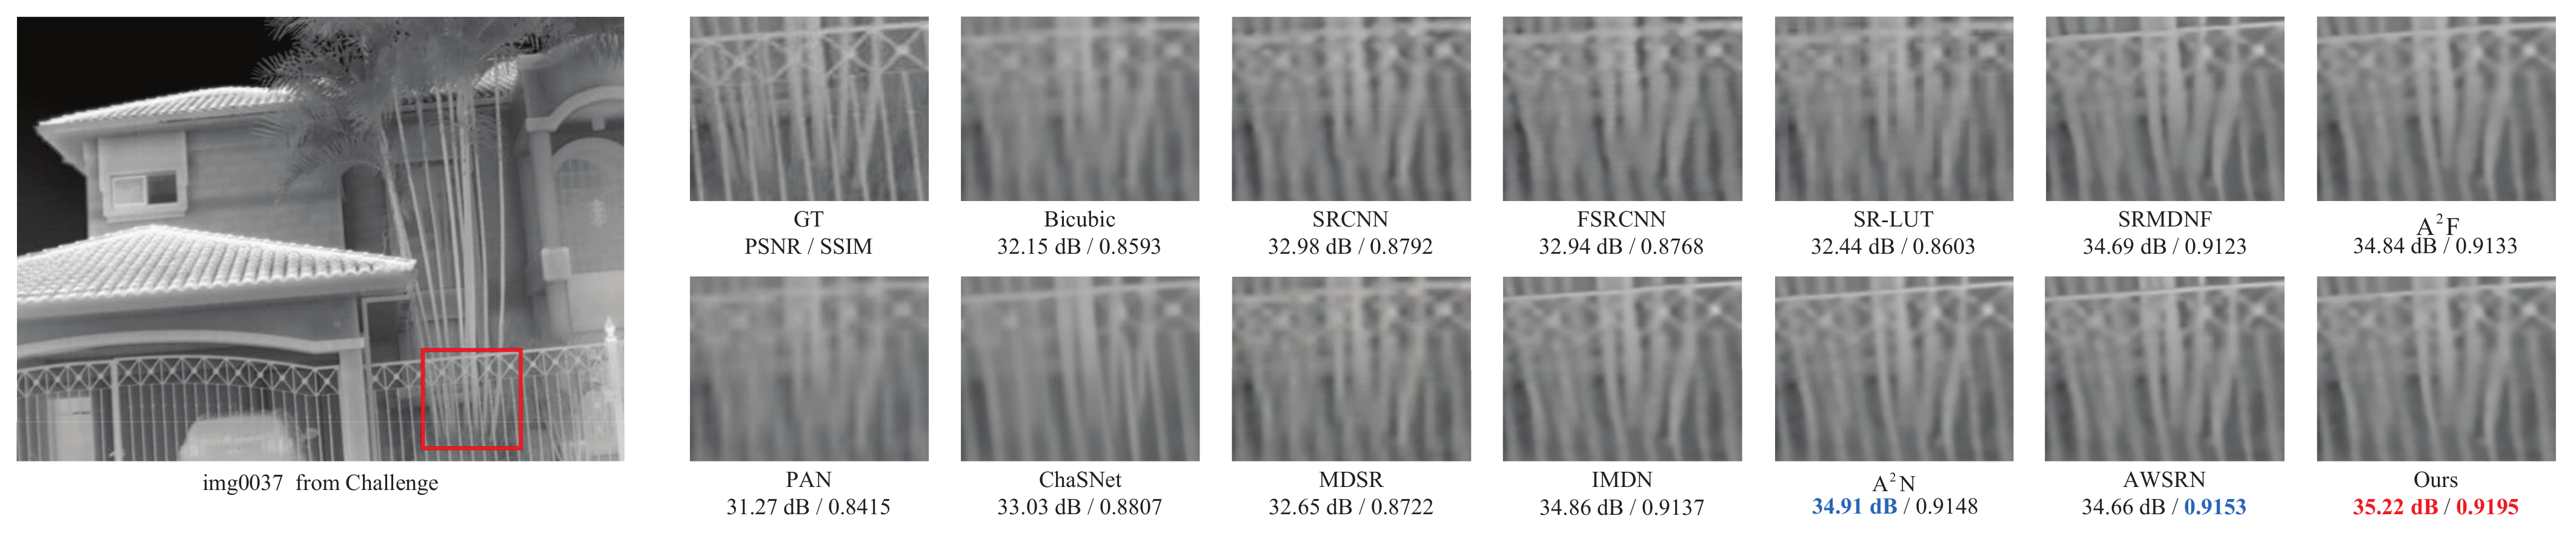
5.7. Qualitative Experiments
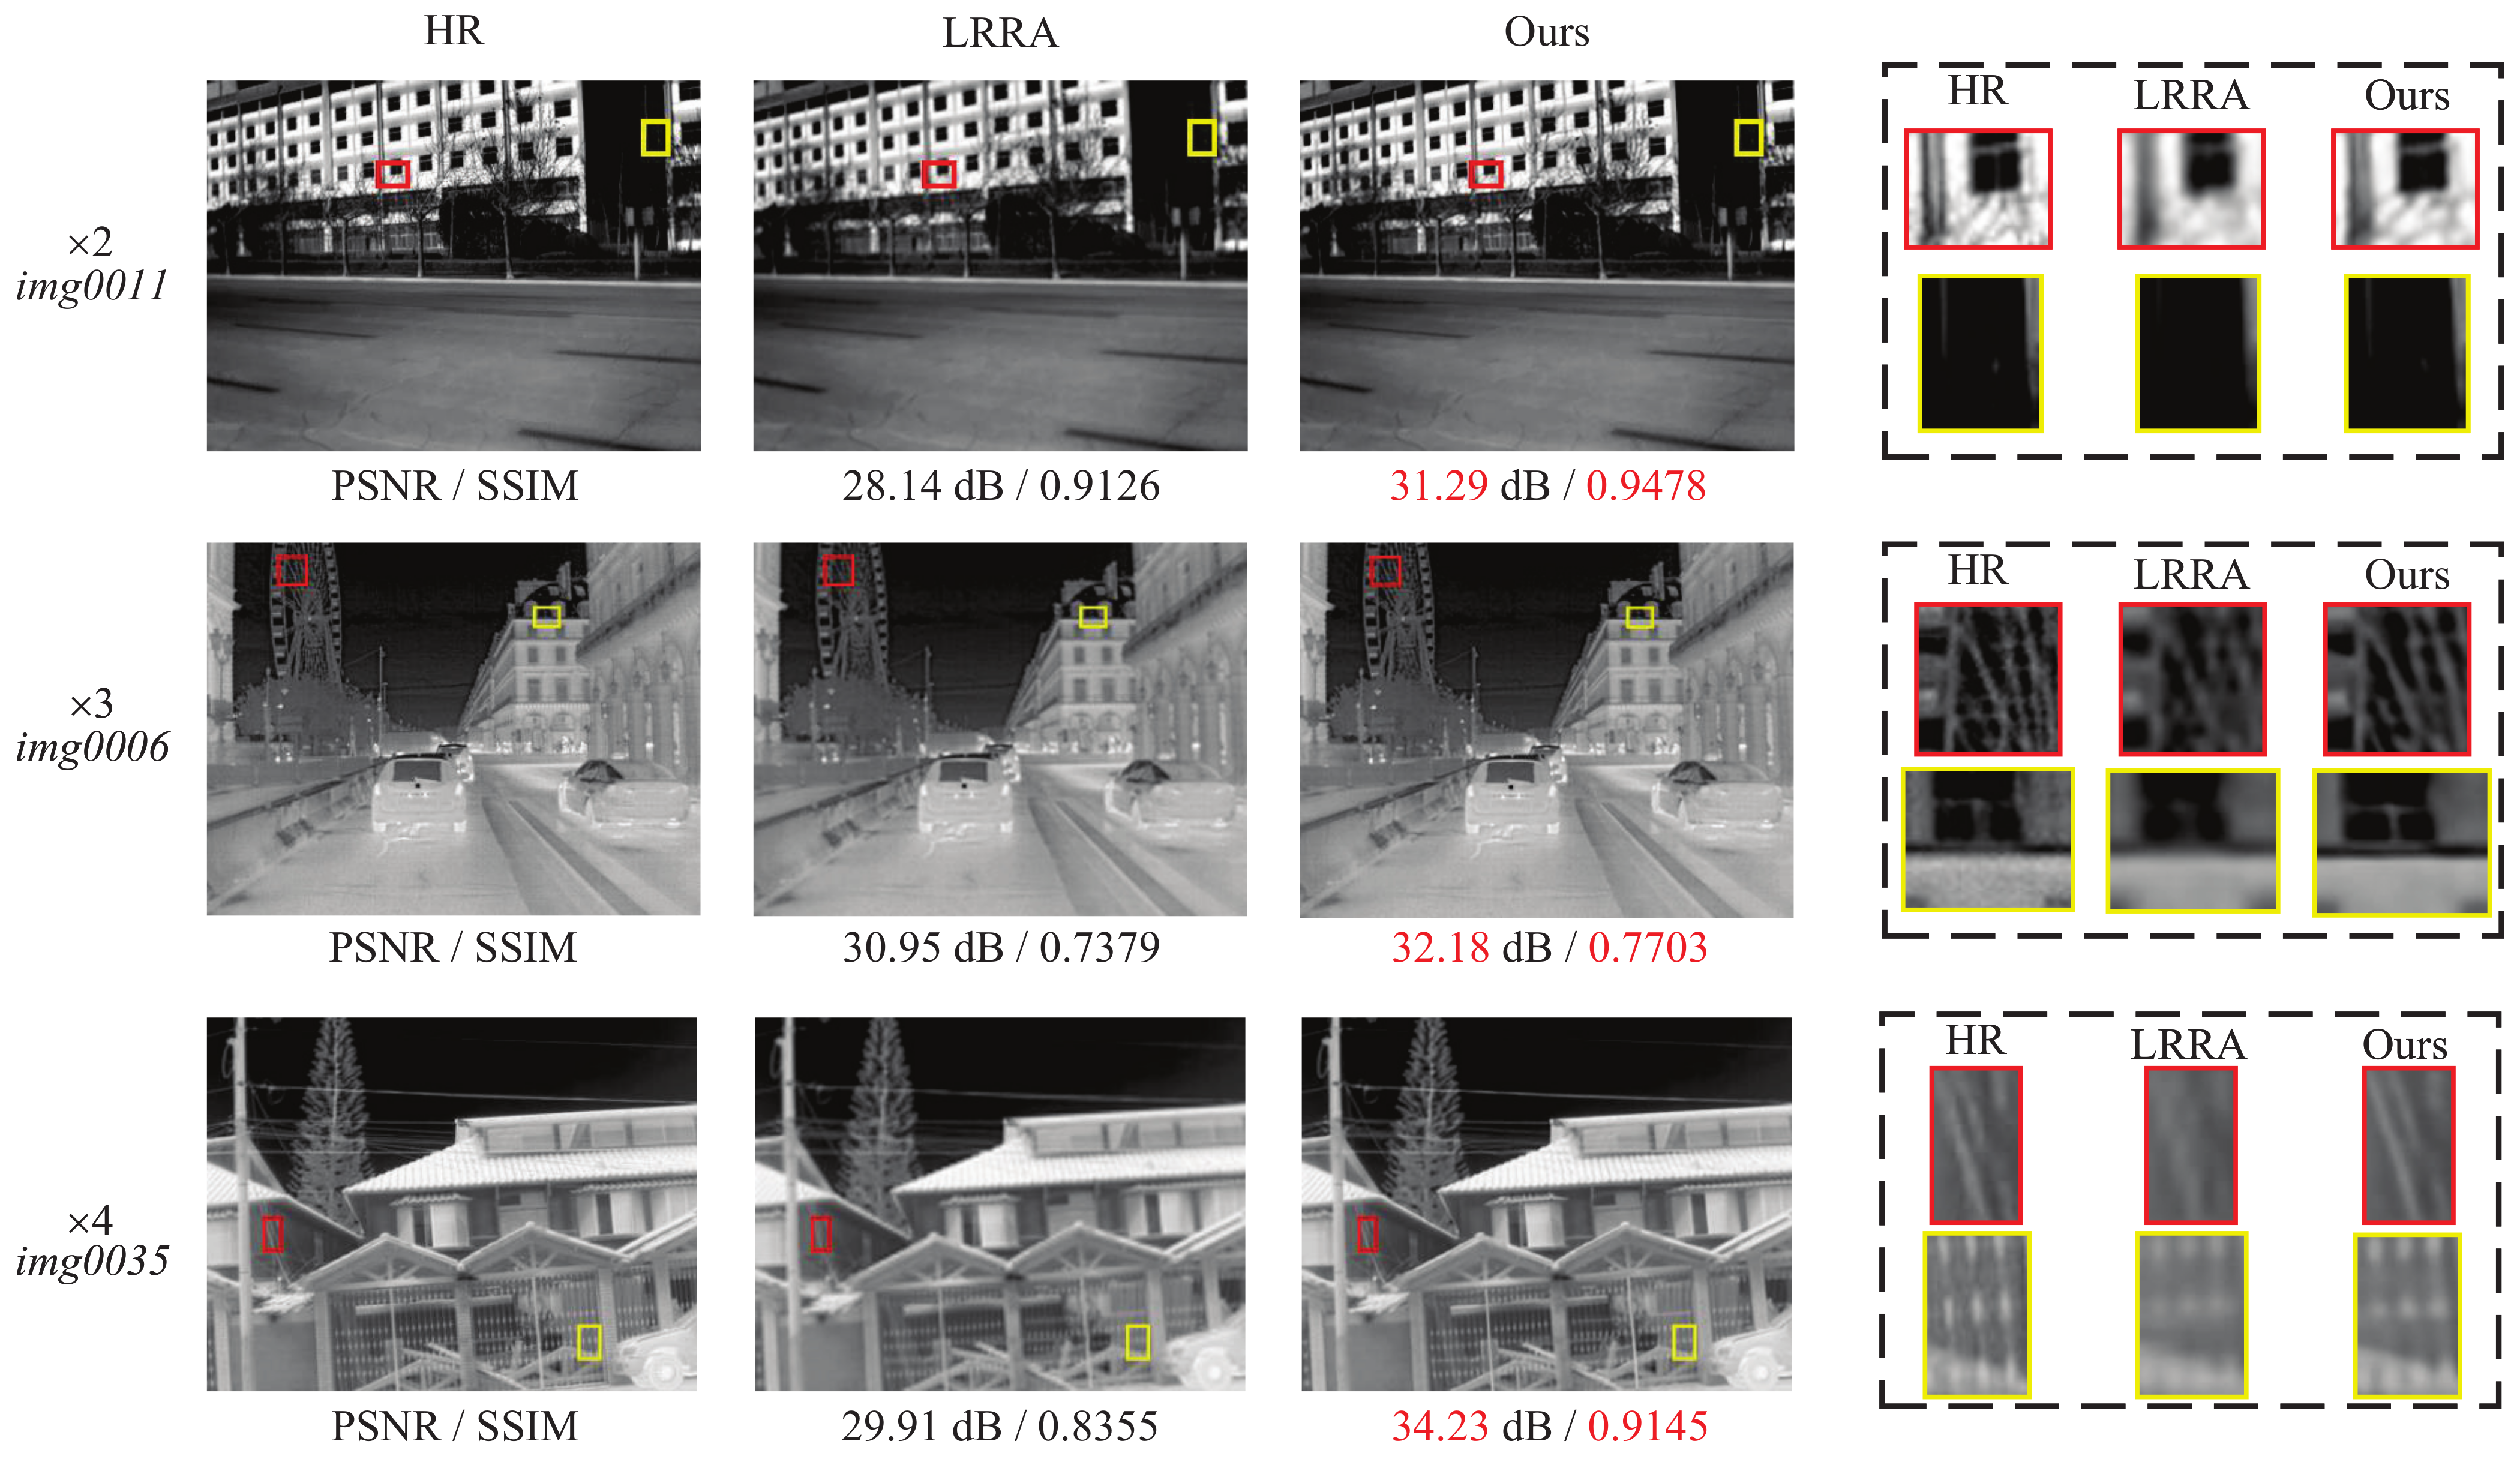
5.8. Compare with Lucy–Richardson–Rosen Algorithm
6. Conclusions
Author Contributions
Funding
Institutional Review Board Statement
Informed Consent Statement
Data Availability Statement
Conflicts of Interest
References
- Zhang, H.; Hu, Y.; Yan, M.; Ma, B. Thermal image super-resolution via multi-path residual attention network. Signal Image Video Process. 2023, 17, 2073–2081. [Google Scholar] [CrossRef]
- Chudasama, V.; Patel, H.; Prajapati, K.; Upla, K.P.; Ramachandra, R.; Raja, K.; Busch, C. Therisurnet—A computationally efficient thermal image super-resolution network. In Proceedings of the IEEE/CVF Conference on Computer Vision and Pattern Recognition Workshops, Seattle, WA, USA, 13–19 June 2020; pp. 86–87. [Google Scholar]
- Wang, Z.; Chen, J.; Hoi, S.C. Deep learning for image super-resolution: A survey. IEEE Trans. Pattern Anal. Mach. Intell. 2020, 43, 3365–3387. [Google Scholar] [CrossRef] [PubMed]
- Park, S.C.; Park, M.K.; Kang, M.G. Super-resolution image reconstruction: A technical overview. IEEE Signal Process. Mag. 2003, 20, 21–36. [Google Scholar] [CrossRef]
- Li, X.; Orchard, M.T. New edge-directed interpolation. IEEE Trans. Image Process. 2001, 10, 1521–1527. [Google Scholar]
- Zhang, L.; Wu, X. An edge-guided image interpolation algorithm via directional filtering and data fusion. IEEE Trans. Image Process. 2006, 15, 2226–2238. [Google Scholar] [CrossRef] [PubMed]
- Mishiba, K.; Suzuki, T.; Ikehara, M. Edge-adaptive image interpolation using constrained least squares. In Proceedings of the 2010 IEEE International Conference on Image Processing, Hong Kong, China, 26–29 September 2010; pp. 2837–2840. [Google Scholar]
- Dong, W.; Zhang, L.; Shi, G.; Wu, X. Nonlocal back-projection for adaptive image enlargement. In Proceedings of the 2009 16th IEEE International Conference on Image Processing (ICIP), Cairo, Egypt, 7–10 November 2009; pp. 349–352. [Google Scholar]
- Hardie, R.C.; Barnard, K.J.; Armstrong, E.E. Joint MAP registration and high-resolution image estimation using a sequence of undersampled images. IEEE Trans. Image Process. 1997, 6, 1621–1633. [Google Scholar] [CrossRef] [PubMed]
- Hardie, R.C.; Barnard, K.J.; Bognar, J.G.; Armstrong, E.E.; Watson, E.A. High-resolution image reconstruction from a sequence of rotated and translated frames and its application to an infrared imaging system. Opt. Eng. 1998, 37, 247–260. [Google Scholar]
- Bishara, W.; Su, T.W.; Coskun, A.F.; Ozcan, A. Lensfree on-chip microscopy over a wide field-of-view using pixel super-resolution. Opt. Express 2010, 18, 11181–11191. [Google Scholar] [CrossRef] [PubMed]
- Bishara, W.; Sikora, U.; Mudanyali, O.; Su, T.W.; Yaglidere, O.; Luckhart, S.; Ozcan, A. Holographic pixel super-resolution in portable lensless on-chip microscopy using a fiber-optic array. Lab Chip 2011, 11, 1276–1279. [Google Scholar] [CrossRef] [PubMed]
- Greenbaum, A.; Ozcan, A. Maskless imaging of dense samples using pixel super-resolution based multi-height lensfree on-chip microscopy. Opt. Express 2012, 20, 3129–3143. [Google Scholar] [CrossRef]
- Yang, J.; Wright, J.; Huang, T.S.; Ma, Y. Image super-resolution via sparse representation. IEEE Trans. Image Process. 2010, 19, 2861–2873. [Google Scholar] [CrossRef] [PubMed]
- Dong, C.; Loy, C.C.; He, K.; Tang, X. Image super-resolution using deep convolutional networks. IEEE Trans. Pattern Anal. Mach. Intell. 2015, 38, 295–307. [Google Scholar] [CrossRef]
- Dong, C.; Loy, C.C.; Tang, X. Accelerating the super-resolution convolutional neural network. In Proceedings of the European Conference on Computer Vision, Amsterdam, The Netherlands, 11–14 October 2016; Springer: Berlin/Heidelberg, Germany, 2016; pp. 391–407. [Google Scholar]
- Zou, L.; Xu, S.; Zhu, W.; Huang, X.; Lei, Z.; He, K. Improved Generative Adversarial Network for Super-Resolution Reconstruction of Coal Photomicrographs. Sensors 2023, 23, 7296. [Google Scholar] [CrossRef]
- Chen, H.; Gu, J.; Zhang, Z. Attention in attention network for image super-resolution. arXiv 2021, arXiv:2104.09497. [Google Scholar]
- Paszke, A.; Gross, S.; Chintala, S.; Chanan, G.; Yang, E.; DeVito, Z.; Lin, Z.; Desmaison, A.; Antiga, L.; Lerer, A. Automatic Differentiation in Pytorch. Available online: https://openreview.net/forum?id=BJJsrmfCZ (accessed on 22 October 2023).
- Park, J.; Woo, S.; Lee, J.Y.; Kweon, I.S. Bam: Bottleneck attention module. arXiv 2018, arXiv:1807.06514. [Google Scholar]
- Wang, H.; Chen, X.; Ni, B.; Liu, Y.; Liu, J. Omni Aggregation Networks for Lightweight Image Super-Resolution. In Proceedings of the IEEE/CVF Conference on Computer Vision and Pattern Recognition, Vancouver, BC, Canada, 17–24 June 2023; pp. 22378–22387. [Google Scholar]
- Woo, S.; Park, J.; Lee, J.Y.; Kweon, I.S. Cbam: Convolutional block attention module. In Proceedings of the European Conference on Computer Vision (ECCV), Munich, Germany, 8–14 September 2018; pp. 3–19. [Google Scholar]
- Hu, Y.; Li, J.; Huang, Y.; Gao, X. Channel-wise and spatial feature modulation network for single image super-resolution. IEEE Trans. Circuits Syst. Video Technol. 2019, 30, 3911–3927. [Google Scholar] [CrossRef]
- Zhang, Y.; Li, K.; Li, K.; Wang, L.; Zhong, B.; Fu, Y. Image super-resolution using very deep residual channel attention networks. In Proceedings of the European Conference on Computer Vision (ECCV), Munich, Germany, 8–14 September 2018; pp. 286–301. [Google Scholar]
- He, K.; Zhang, X.; Ren, S.; Sun, J. Deep residual learning for image recognition. In Proceedings of the IEEE Conference on Computer Vision and Pattern Recognition, Las Vegas, NV, USA, 27–30 June 2016; pp. 770–778. [Google Scholar]
- Lim, B.; Son, S.; Kim, H.; Nah, S.; Lee, K.M. Enhanced Deep Residual Networks for Single Image Super-Resolution. In Proceedings of the 2017 IEEE Conference on Computer Vision and Pattern Recognition Workshops (CVPRW), Honolulu, HI, USA, 21–26 July 2017; pp. 1132–1140. [Google Scholar]
- Hu, J.; Shen, L.; Sun, G. Squeeze-and-excitation networks. In Proceedings of the IEEE Conference on Computer Vision and Pattern Recognition, Salt Lake City, UT, USA, 18–23 June 2018; pp. 7132–7141. [Google Scholar]
- Zhang, Y.; Li, K.; Li, K.; Zhong, B.; Fu, Y. Residual non-local attention networks for image restoration. arXiv 2019, arXiv:1903.10082. [Google Scholar]
- Chen, L.; Chu, X.; Zhang, X.; Sun, J. Simple baselines for image restoration. In Proceedings of the European Conference on Computer Vision, Tel Aviv, Israel, 23–27 October 2022; Springer: Berlin/Heidelberg, Germany, 2022; pp. 17–33. [Google Scholar]
- Yang, J.; Li, C.; Dai, X.; Gao, J. Focal modulation networks. Adv. Neural Inf. Process. Syst. 2022, 35, 4203–4217. [Google Scholar]
- Krizhevsky, A.; Sutskever, I.; Hinton, G.E. Imagenet classification with deep convolutional neural networks. Adv. Neural Inf. Process. Syst. 2012, 25, 84–90. [Google Scholar] [CrossRef]
- Kim, J.; Lee, J.K.; Lee, K.M. Accurate Image Super-Resolution Using Very Deep Convolutional Networks. In Proceedings of the 2016 IEEE Conference on Computer Vision and Pattern Recognition (CVPR), Las Vegas, NV, USA, 27–30 June 2016; pp. 1646–1654. [Google Scholar]
- Ledig, C.; Theis, L.; Huszár, F.; Caballero, J.; Cunningham, A.; Acosta, A.; Aitken, A.; Tejani, A.; Totz, J.; Wang, Z.; et al. Photo-realistic single image super-resolution using a generative adversarial network. In Proceedings of the IEEE Conference on Computer Vision and Pattern Recognition, Honolulu, HI, USA, 21–26 July 2017; pp. 4681–4690. [Google Scholar]
- Zhang, Y.; Tian, Y.; Kong, Y.; Zhong, B.; Fu, Y. Residual dense network for image super-resolution. In Proceedings of the IEEE Conference on Computer Vision and Pattern Recognition, Salt Lake City, UT, USA, 18–23 June 2018; pp. 2472–2481. [Google Scholar]
- Niu, B.; Wen, W.; Ren, W.; Zhang, X.; Yang, L.; Wang, S.; Zhang, K.; Cao, X.; Shen, H. Single image super-resolution via a holistic attention network. In Proceedings of the Computer Vision—ECCV 2020: 16th European Conference, Glasgow, UK, 23–28 August 2020; Proceedings, Part XII 16; Springer: Berlin/Heidelberg, Germany, 2020; pp. 191–207. [Google Scholar]
- Dai, T.; Cai, J.; Zhang, Y.; Xia, S.T.; Zhang, L. Second-order attention network for single image super-resolution. In Proceedings of the IEEE/CVF Conference on Computer Vision and Pattern Recognition, Long Beach, CA, USA, 15–20 June 2019; pp. 11065–11074. [Google Scholar]
- Liu, D.; Wen, B.; Fan, Y.; Loy, C.C.; Huang, T.S. Non-local recurrent network for image restoration. Adv. Neural Inf. Process. Syst. 2018, 31, 1680–1689. [Google Scholar]
- Mei, Y.; Fan, Y.; Zhou, Y. Image super-resolution with non-local sparse attention. In Proceedings of the IEEE/CVF Conference on Computer Vision and Pattern Recognition, Nashville, TN, USA, 20–25 June 2021; pp. 3517–3526. [Google Scholar]
- Choi, Y.; Kim, N.; Hwang, S.; Kweon, I.S. Thermal image enhancement using convolutional neural network. In Proceedings of the 2016 IEEE/RSJ International Conference on Intelligent Robots and Systems (IROS), Daejeon, Republic of Korea, 9–14 October 2016; pp. 223–230. [Google Scholar]
- Marivani, I.; Tsiligianni, E.; Cornelis, B.; Deligiannis, N. Multimodal image super-resolution via deep unfolding with side information. In Proceedings of the 2019 27th European Signal Processing Conference (EUSIPCO), A Coruna, Spain, 2–6 September 2019; pp. 1–5. [Google Scholar]
- Rivadeneira, R.E.; Suárez, P.L.; Sappa, A.D.; Vintimilla, B.X. Thermal image superresolution through deep convolutional neural network. In Proceedings of the Image Analysis and Recognition: 16th International Conference (ICIAR 2019), Waterloo, ON, Canada, 27–29 August 2019; Proceedings, Part II 16; Springer: Berlin/Heidelberg, Germany, 2019; pp. 417–426. [Google Scholar]
- Bhattacharya, P.; Riechen, J.; Zölzer, U. Infrared Image Enhancement in Maritime Environment with Convolutional Neural Networks. In Proceedings of the VISIGRAPP (4: VISAPP), Madeira, Portugal, 27–29 January 2018; pp. 37–46. [Google Scholar]
- He, Z.; Tang, S.; Yang, J.; Cao, Y.; Yang, M.Y.; Cao, Y. Cascaded deep networks with multiple receptive fields for infrared image super-resolution. IEEE Trans. Circuits Syst. Video Technol. 2018, 29, 2310–2322. [Google Scholar] [CrossRef]
- Prajapati, K.; Chudasama, V.; Patel, H.; Sarvaiya, A.; Upla, K.P.; Raja, K.; Ramachandra, R.; Busch, C. Channel split convolutional neural network (ChaSNet) for thermal image super-resolution. In Proceedings of the IEEE/CVF Conference on Computer Vision and Pattern Recognition, Nashville, TN, USA, 20–25 June 2021; pp. 4368–4377. [Google Scholar]
- Goodfellow, I.; Pouget-Abadie, J.; Mirza, M.; Xu, B.; Warde-Farley, D.; Ozair, S.; Courville, A.; Bengio, Y. Generative adversarial nets. Adv. Neural Inf. Process. Syst. 2014, 27, 2672–2680. [Google Scholar]
- Liu, S.; Yang, Y.; Li, Q.; Feng, H.; Xu, Z.; Chen, Y.; Liu, L. Infrared image super resolution using gan with infrared image prior. In Proceedings of the 2019 IEEE 4th International Conference on Signal and Image Processing (ICSIP), Wuxi, China, 19–21 July 2019; pp. 1004–1009. [Google Scholar]
- Rivadeneira, R.E.; Sappa, A.D.; Vintimilla, B.X. Thermal Image Super-resolution: A Novel Architecture and Dataset. In Proceedings of the VISIGRAPP (4: VISAPP), Valletta, Malta, 27–29 February 2020; pp. 111–119. [Google Scholar]
- Zhu, J.Y.; Park, T.; Isola, P.; Efros, A.A. Unpaired image-to-image translation using cycle-consistent adversarial networks. In Proceedings of the IEEE International Conference on Computer Vision, Venice, Italy, 22–29 October 2017; pp. 2223–2232. [Google Scholar]
- Zamir, S.W.; Arora, A.; Khan, S.; Hayat, M.; Khan, F.S.; Yang, M.H. Restormer: Efficient transformer for high-resolution image restoration. In Proceedings of the IEEE/CVF Conference on Computer Vision and Pattern Recognition, New Orleans, LA, USA, 18–24 June 2022; pp. 5728–5739. [Google Scholar]
- Vaswani, A.; Shazeer, N.; Parmar, N.; Uszkoreit, J.; Jones, L.; Gomez, A.N.; Kaiser, Ł.; Polosukhin, I. Attention is all you need. Adv. Neural Inf. Process. Syst. 2017, 30, 6000–6010. [Google Scholar]
- Lu, Z.; Li, J.; Liu, H.; Huang, C.; Zhang, L.; Zeng, T. Transformer for single image super-resolution. In Proceedings of the IEEE/CVF Conference on Computer Vision and Pattern Recognition, New Orleans, LA, USA, 18–24 June 2022; pp. 457–466. [Google Scholar]
- Nair, V.; Hinton, G.E. Rectified linear units improve restricted boltzmann machines. In Proceedings of the 27th International Conference on Machine Learning (ICML-10), Haifa, Israel, 21–24 June 2010; pp. 807–814. [Google Scholar]
- Wang, Q.; Wu, B.; Zhu, P.; Li, P.; Zuo, W.; Hu, Q. ECA-Net: Efficient channel attention for deep convolutional neural networks. In Proceedings of the IEEE/CVF Conference on Computer Vision and Pattern Recognition, Seattle, WA, USA, 13–19 June 2020; pp. 11534–11542. [Google Scholar]
- Zhao, H.; Kong, X.; He, J.; Qiao, Y.; Dong, C. Efficient image super-resolution using pixel attention. In Proceedings of the Computer Vision—ECCV 2020 Workshops, Glasgow, UK, 23–28 August 2020; Proceedings, Part III 16; Springer: Berlin/Heidelberg, Germany, 2020; pp. 56–72. [Google Scholar]
- Rivadeneira, R.E.; Sappa, A.D.; Vintimilla, B.X.; Bin, D.; Ruodi, L.; Shengye, L.; Zhong, Z.; Liu, X.; Jiang, J.; Wang, C. Thermal Image Super-Resolution Challenge Results-PBVS 2023. In Proceedings of the IEEE/CVF Conference on Computer Vision and Pattern Recognition, Vancouver, BC, Canada, 17–24 June 2023; pp. 470–478. [Google Scholar]
- Yoo, J.; Ahn, N.; Sohn, K.A. Rethinking data augmentation for image super-resolution: A comprehensive analysis and a new strategy. In Proceedings of the IEEE/CVF Conference on Computer Vision and Pattern Recognition, Seattle, WA, USA, 13–19 June 2020; pp. 8375–8384. [Google Scholar]
- DeVries, T.; Taylor, G.W. Improved regularization of convolutional neural networks with cutout. arXiv 2017, arXiv:1708.04552. [Google Scholar]
- Yun, S.; Han, D.; Oh, S.J.; Chun, S.; Choe, J.; Yoo, Y. Cutmix: Regularization strategy to train strong classifiers with localizable features. In Proceedings of the IEEE/CVF International Conference on Computer Vision, Seoul, Republic of Korea, 27 October–2 November 2019; pp. 6023–6032. [Google Scholar]
- Zhang, H.; Cisse, M.; Dauphin, Y.N.; Lopez-Paz, D. Mixup: Beyond empirical risk minimization. arXiv 2017, arXiv:1710.09412. [Google Scholar]
- Loshchilov, I.; Hutter, F. Decoupled weight decay regularization. arXiv 2017, arXiv:1711.05101. [Google Scholar]
- Kingma, D.P.; Ba, J. Adam: A method for stochastic optimization. arXiv 2014, arXiv:1412.6980. [Google Scholar]
- Jo, Y.; Kim, S.J. Practical Single-Image Super-Resolution Using Look-Up Table. In Proceedings of the IEEE/CVF Conference on Computer Vision and Pattern Recognition, Nashville, TN, USA, 20–25 June 2021; pp. 691–700. [Google Scholar]
- Tai, Y.; Yang, J.; Liu, X. Image super-resolution via deep recursive residual network. In Proceedings of the IEEE Conference on Computer Vision and Pattern Recognition, Honolulu, HI, USA, 21–26 July 2017; pp. 3147–3155. [Google Scholar]
- Wang, X.; Wang, Q.; Zhao, Y.; Yan, J.; Fan, L.; Chen, L. Lightweight single-image super-resolution network with attentive auxiliary feature learning. In Proceedings of the Asian Conference on Computer Vision, Kyoto, Japan, 30 November–4 December 2020. [Google Scholar]
- Wang, C.; Li, Z.; Shi, J. Lightweight image super-resolution with adaptive weighted learning network. arXiv 2019, arXiv:1904.02358. [Google Scholar]
- Hui, Z.; Gao, X.; Yang, Y.; Wang, X. Lightweight image super-resolution with information multi-distillation network. In Proceedings of the 27th ACM International Conference on Multimedia, Nice, France, 21–25 October 2019; pp. 2024–2032. [Google Scholar]
- Zhang, K.; Zuo, W.; Zhang, L. Learning a single convolutional super-resolution network for multiple degradations. In Proceedings of the IEEE Conference on Computer Vision and Pattern Recognition, Salt Lake City, UT, USA, 18–23 June 2018; pp. 3262–3271. [Google Scholar]
- Ahn, N.; Kang, B.; Sohn, K.A. Fast, accurate, and lightweight super-resolution with cascading residual network. In Proceedings of the European Conference on Computer Vision (ECCV), Munich, Germany, 8–14 September 2018; pp. 252–268. [Google Scholar]
- Anand, V.; Han, M.; Maksimovic, J.; Ng, S.H.; Katkus, T.; Klein, A.; Bambery, K.; Tobin, M.J.; Vongsvivut, J.; Juodkazis, S. Single-shot mid-infrared incoherent holography using Lucy-Richardson-Rosen algorithm. Opto-Electron. Sci. 2022, 1, 210006-1. [Google Scholar]
- Jayavel, A.; Gopinath, S.; Periyasamy Angamuthu, P.; Arockiaraj, F.G.; Bleahu, A.; Xavier, A.P.I.; Smith, D.; Han, M.; Slobozhan, I.; Ng, S.H.; et al. Improved Classification of Blurred Images with Deep-Learning Networks Using Lucy-Richardson-Rosen Algorithm. Photonics 2023, 10, 396. [Google Scholar] [CrossRef]


| Attention Module Index | PSNR↑ | SSIM↑ |
|---|---|---|
| None | 32.95 | 0.8078 |
| All | 33.24 | 0.8099 |
| 32.95 | 0.8078 | |
| 33.24 | 0.8099 | |
| 33.20 | 0.8089 |
| Image Resolution | Camera Model | FOV | Focal Length | Pixel Size | Spectral Range | Operating Temperature Range |
|---|---|---|---|---|---|---|
| Low (LR) | Axis Domo P1290 | 35.4 | 4 mm | 12 m | 8–14 m | −30–55 C |
| Mid (MR) | Axis Q2901-E | 35 | 9 mm | 17 m | 8–14 m | −40–60 C |
| High (HR) | FC-632O FLIR | 32 | 19 mm | 17 m | 7–13.5 m | −50–70 C |
| Phase | Subdataset | Resolution | Amount |
|---|---|---|---|
| Training | Domo | 160 × 120 | 951 |
| Axis | 320 × 240 | ||
| Flir | 640 × 480 | ||
| Testing | Domo | 160 × 120 | 50 |
| Axis | 320 × 240 | ||
| Flir | 640 × 480 |
| Data Augmentation Method | PSNR↑ | SSIM↑ |
|---|---|---|
| LDASRNet w/o MoDA (Baseline) | 36.52 (+0.00) | 0.9291 (+0.0000) |
| LDASRNet w/CutOut | 36.62 (+0.10) | 0.9300 (+0.0009) |
| LDASRNet w/CutMix | 36.63 (+0.11) | 0.9303 (+0.0012) |
| LDASRNet w/Mixup | 36.61 (+0.09) | 0.9300 (+0.0009) |
| LDASRNet w/CutMixup | 36.64 (+0.12) | 0.9309 (+0.0018) |
| LDASRNet w/RGB permute | 36.61 (+0.09) | 0.9299 (+0.0008) |
| LDASRNet w/Blend | 36.60 (+0.08) | 0.9298 (+0.0007) |
| LDASRNet w/CutBlur | 36.64 (+0.12) | 0.9310 (+0.0019) |
| LDASRNet w/MoDA (Our) | 36.65 (+0.13) | 0.9312 (+0.0021) |
| Adam | AdamW | MoDA | Challenge Dataset | FLIR Dataset | Iray Dataset | |||
|---|---|---|---|---|---|---|---|---|
| PSNR↑ | SSIM↑ | PSNR↑ | SSIM↑ | PSNR↑ | SSIM↑ | |||
| √ | 44.18 | 0.9774 | 35.29 | 0.8583 | 33.26 | 0.9358 | ||
| √ | 44.20 | 0.9788 | 35.33 | 0.9376 | ||||
| √ | √ | 44.33 | 0.9785 | 35.44 | 0.8689 | 33.40 | 0.9384 | |
| √ | √ | 44.34 | 0.9870 | 35.48 | 0.8683 | 33.48 | 0.9466 | |
| Path | Path Fusion | Params (K) | Metric | |||||||
|---|---|---|---|---|---|---|---|---|---|---|
| Non-Attention | Attention | Addition | Concatenation | Adaptive-Weight | LDANet (1 × 1 conv) | LDANet (3 × 3 conv) | PSNR↑ | |||
| Single Path | LDASRNet w/Non-Attention | √ | 323.299 | 36.37 | ||||||
| LDASRNet w/Attention | √ | 119.187 | 36.14 | |||||||
| Two Paths w/o DAB | LDASRNet w/Addition | √ | √ | √ | 349.587 | 36.50 | ||||
| LDASRNet w/Concatenation | √ | √ | √ | 375.187 | 36.47 | |||||
| LDASRNet w/Adaptive-Weight | √ | √ | √ | 349.587 | 36.46 | |||||
| LDASRNet | LDASRNet w/Fewer Channels | √ | √ | √ | 232.811 | 36.58 | ||||
| LDASRNet-T | √ | √ | √ | 146.131 | 36.60 | |||||
| LDASRNet | √ | √ | √ | 350.931 | 36.65 | |||||
| Settings | Params (K) | Metric | Gains from DAB | ||||
|---|---|---|---|---|---|---|---|
| Non-Attention | CAB | PAB | C-P AB | DAB | PSNR↑ | PSNR↑ | |
| √ | √ | 323.347 | 36.40 | – | |||
| √ | 119.187 | 36.17 | – | ||||
| √ | √ | 349.587 | 36.53 | – | |||
| √ | √ | 349.539 | 36.51 | – | |||
| √ | √ | √ | 324.691 | 36.38 | +0.02 | ||
| √ | √ | 120.531 | 36.19 | −0.02 | |||
| √ | √ | √ | 350.883 | 36.60 | +0.09 | ||
| √ | √ | √ | 350.931 | 36.65 | +0.12 | ||
| Scale | Size Scope | Network | Prams | Testing Datasets | ||
|---|---|---|---|---|---|---|
| Challenge | FLIR | Iray | ||||
| ≤1 M | FSRCNN | 0.012 M | 42.11/0.9841/0.0010T | 34.95/0.8637/0.0010T | 32.20/0.9361/0.0003T | |
| SR-LUT | 0.017 M | 41.23/0.9783/0.0039T | 34.49/0.8563/0.0041T | 30.96/0.9200/0.0014T | ||
| SRCNN | 0.057 M | 39.22/0.9790/0.0176T | 34.79/0.8607/0.0187T | 31.83/0.9314/0.0063T | ||
| PAN | 0.1 M | 39.06/0.9649/0.0142T | 33.25/0.8205/0.0152T | 28.85/0.8804/0.0051T | ||
| DRRN | 0.3 M | 43.44/0.9848/0.8161T | 35.34/0.8663/0.8705T | 32.92/0.9423/0.2938T | ||
| 0.3 M | 44.26/0.9868/0.0236T | 35.43/0.8676/0.0251T | 33.25/0.9451/0.0085T | |||
| AWSRN-S | 0.4 M | 43.89/0.9861/0.0304T | 35.38/0.8670/0.0324T | 33.03/0.9438/0.0109T | ||
| IMDN | 0.7 M | 44.12/0.9861/0.0015T | 35.46/0.8672/0.0016T | 33.36/0.9451/0.0006T | ||
| VDSR | 0.7 M | 43.77/0.9868/0.2042T | 35.36/0.8679/0.2178T | 32.89/0.9438/0.0735T | ||
| 1.0 M | 44.23/0.9867/0.0826T | 35.47/0.8679/0.0881T | 33.28/0.9450/0.0297T | |||
| Ours | 0.34 M | 44.34/0.9870/0.0295T | 35.48/0.8683/0.0315T | 33.48/0.9466/0.0106T | ||
| <7 M | AWSRN | 1.4 M | 44.38/0.9871/0.1068T | 35.53/0.8680/0.1140T | 33.60/0.9474/0.0385T | |
| SRMDNF † | 1.5 M | 44.14/0.9869/0.1146T | 35.41/0.8671/0.1222T | 33.18/0.9445/0.0412T | ||
| CARN † | 1.6 M | 43.97/0.9867/0.0743T | 35.43/0.8676/0.0792T | 33.35/0.9459/0.0267T | ||
| ChaSNet † | 3.2 M | 32.73/0.9564/0.2433T | 30.27/0.8184/0.2592T | 25.93/0.8580/0.0876T | ||
| MPRANet | 4.4 M | 45.50/0.9903/0.3892T | 35.88/0.8857/0.4152T | 33.99/0.9537/0.1401T | ||
| MDSR † | 6.5 M | 40.66/0.9804/0.4993T | 34.40/0.8573/0.5325T | 30.49/0.9168/0.0799T | ||
| >10 M | RCAN | 15.4 M | 44.50/0.9873/1.1766T | 35.63/0.8697/1.2708T | 33.91/0.9496/0.4289T | |
| EDSR | 40.7 M | 44.44/0.9872/3.1282T | 35.56/0.8687/3.3368T | 33.81/0.9490/1.1261T | ||
| ≤1 M | FSRCNN | 0.012 M | 37.68/0.9487/0.0004T | 32.15/0.7958/0.0003T | 28.29/0.8562/0.0002T | |
| SR-LUT | 0.017 M | 37.12/0.9410/0.0017T | 32.14/0.7858/0.0019T | 27.79/0.8415/0.0006T | ||
| SRCNN | 0.057 M | 37.68/0.9505/0.0176T | 32.54/0.7980/0.0186T | 28.32/0.8584/0.0063T | ||
| PAN | 0.1 M | 35.00/0.9249/0.0089T | 31.08/0.7582/0.0094T | 26.43/0.8038/0.0032T | ||
| DRRN | 0.3 M | 38.78/0.9586/0.8148T | 33.07/0.8075/0.8657T | 29.22/0.8811/0.2938T | ||
| 0.3 M | 39.38/0.9617/0.0105T | 33.15/0.8082/0.0112T | 29.39/0.8848/0.0038T | |||
| AWSRN-S | 0.5 M | 38.97/0.9549/0.0162T | 33.05/0.8067/0.0172T | 29.19/0.8819/0.0058T | ||
| IMDN | 0.7 M | 39.38/0.9621/0.0007T | 33.17/0.8082/0.0008T | 29.34/0.8858/0.0003T | ||
| VDSR | 0.7 M | 38.76/0.9594/0.2039T | 35.03/0.8075/0.2166T | 29.17/0.8814/0.0735T | ||
| 1.0 M | 39.44/0.9620/0.0392T | 33.17/0.8086/0.0417T | 29.41/0.8854/0.0141T | |||
| Ours | 0.34 M | 39.56/0.9628/0.0157T | 33.24/0.8099/0.0167T | 29.50/0.8873/0.0057T | ||
| <7 M | AWSRN | 1.5 M | 39.60/0.9630/0.05101T | 33.24/0.8103/0.0532T | 29.64/0.8912/0.0181T | |
| SRMDNF † | 1.5 M | 39.14/0.9603/0.0514T | 33.10/0.8075/0.0546T | 29.33/0.8841/0.0185T | ||
| CARN † | 1.6 M | 39.31/0.9617/0.0395T | 33.18/0.8092/0.0420T | 29.49/0.8878/0.0143T | ||
| ChaSNet | – | – | – | – | ||
| MPRANet | 4.4 M | 40.72/0.9741/0.2113T | 33.34/0.8190/0.2245T | 30.62/0.9092/0.0762T | ||
| MDSR | 6.7 M | 36.67/0.9942/0.1365T | 32.00/0.7881/0.1456T | 27.40/0.8361/0.0463T | ||
| >10 M | RCAN | 15.6 M | 39.87/0.9646/0.5287T | 33.33/0.8120/0.5617T | 30.00/0.8966/0.1906T | |
| EDSR | 43.7 M | 39.76/0.9640/1.4899T | 33.30/0.8118/1.5830T | 24.73/0.6140/0.5372T | ||
| ≤1 M | FSRCNN | 0.012 M | 35.11/0.9102/0.0002T | 31.01/0.7439/0.0003T | 26.58/0.7922/0.0001T | |
| SR-LUT | 0.017 M | 34.59/0.8994/0.0010T | 30.64/0.7308/0.0011T | 26.10/0.7748/0.0003T | ||
| SRCNN | 0.057 M | 35.05/0.9107/0.0175T | 30.96/0.7435/0.0187T | 26.45/0.7901/0.0063T | ||
| PAN | 0.2 M | 33.18/0.8813/0.0071T | 29.79/0.7029/0.0075T | 24.97/0.7353/0.0025T | ||
| DRRN | 0.3 M | 35.97/0.9139/0.8161T | 31.48/0.7574/0.8705T | 27.14/0.8176/0.2938T | ||
| 0.3 M | 36.45/0.9289/0.0060T | 31.59/0.7603/0.0064T | 27.36/0.8266/0.0022T | |||
| AWSRN-S | 0.6 M | 36.21/0.9263/0.0112T | 31.51/0.7585/0.0120T | 27.21/0.8210/0.0040T | ||
| IMDN | 0.7 M | 36.51/0.9290/0.0005T | 31.62/0.7607/0.0005T | 27.31/0.8275/0.0002T | ||
| VDSR | 0.7 M | 35.98/0.9249/0.2042T | 31.46/0.7579/0.2178T | 27.15/0.8197/0.0735T | ||
| 1.0 M | 36.40/0.9280/0.0242T | 31.58/0.7592/0.0258T | 27.23/0.8233/0.0087T | |||
| Ours | 0.35 M | 36.65/0.9312/0.0109T | 31.68/0.7625/0.0116T | 27.35/0.8296/0.0039T | ||
| <7 M | AWSRN † | 1.6 M | 36.37/0.9316/0.0304T | 31.67/0.7630/0.0324T | 27.53/0.8343/0.0109T | |
| SRMDNF † | 1.5 M | 36.25/0.9270/0.0294T | 31.53/0.7591/0.0314T | 27.33/0.8260/0.0106T | ||
| CARN † | 1.6 M | 36.48/0.9296/0.0303T | 31.63/0.7616/0.0323T | 27.40/0.8292/0.0109T | ||
| ChaSNet † | 14.5 M | 34.49/0.8957/0.2769T | 30.55/0.7162/0.2954T | 26.25/0.7722/0.0997T | ||
| MPRANet | 4.41 M | 36.95/0.9365/0.1494T | 31.92/0.7700/0.1593T | 27.82/0.8488/0.0538T | ||
| MDSR † | 6.7 M | 34.23/0.9032/0.1366T | 30.51/0.7336/0.1456T | 27.40/0.8361/0.0492T | ||
| >10 M | RCAN | 15.6 M | 36.94/0.9244/0.2978T | 31.74/0.7647/0.3177T | 27.72/0.8407/0.1072T | |
| EDSR | 43.7 M | 36.81/0.9331/1.4899T | 33.30/0.8118/1.5830T | 27.70/0.7922/0.5372T | ||
| Model | Bicubic | FSRCNN | SR-LUT | SRCNN | PAN | IMDN | AWSRN | SRMDNF | ChaSNet | MDSR | Ours | ||
|---|---|---|---|---|---|---|---|---|---|---|---|---|---|
| EPI↑ | 0.7549 | 0.8069 | 0.6820 | 0.7743 | 0.7587 | 0.8456 | 0.8442 | 0.8470 | 0.8478 | 0.8428 | 0.7502 | 0.7517 | 0.8497 |
| Scale | Method | Testing Datasets | ||
|---|---|---|---|---|
| Challenge | FLIR | Iray | ||
| LRRA | 37.27/0.9673 | 31.64/0.7901 | 32.35/0.9119 | |
| Ours | 44.34/0.9870 | 35.48/0.8683 | 33.48/0.9466 | |
| LRRA | 33.16/0.9086 | 29.36/0.6867 | 28.30/0.8563 | |
| Ours | 39.56/0.9628 | 33.24/0.8099 | 29.50/0.8873 | |
| LRRA | 30.42/0.8452 | 27.80/0.6060 | 26.37/0.7883 | |
| Ours | 36.65/0.9312 | 31.68/0.7625 | 27.35/0.8296 | |
Disclaimer/Publisher’s Note: The statements, opinions and data contained in all publications are solely those of the individual author(s) and contributor(s) and not of MDPI and/or the editor(s). MDPI and/or the editor(s) disclaim responsibility for any injury to people or property resulting from any ideas, methods, instructions or products referred to in the content. |
© 2023 by the authors. Licensee MDPI, Basel, Switzerland. This article is an open access article distributed under the terms and conditions of the Creative Commons Attribution (CC BY) license (https://creativecommons.org/licenses/by/4.0/).
Share and Cite
Zhang, H.; Hu, Y.; Yan, M. Thermal Image Super-Resolution Based on Lightweight Dynamic Attention Network for Infrared Sensors. Sensors 2023, 23, 8717. https://doi.org/10.3390/s23218717
Zhang H, Hu Y, Yan M. Thermal Image Super-Resolution Based on Lightweight Dynamic Attention Network for Infrared Sensors. Sensors. 2023; 23(21):8717. https://doi.org/10.3390/s23218717
Chicago/Turabian StyleZhang, Haikun, Yueli Hu, and Ming Yan. 2023. "Thermal Image Super-Resolution Based on Lightweight Dynamic Attention Network for Infrared Sensors" Sensors 23, no. 21: 8717. https://doi.org/10.3390/s23218717