
Interface Design of Head-Worn Display Application on Condition Monitoring in Aviation

Abstract
:1. Introduction
2. Materials and Methods
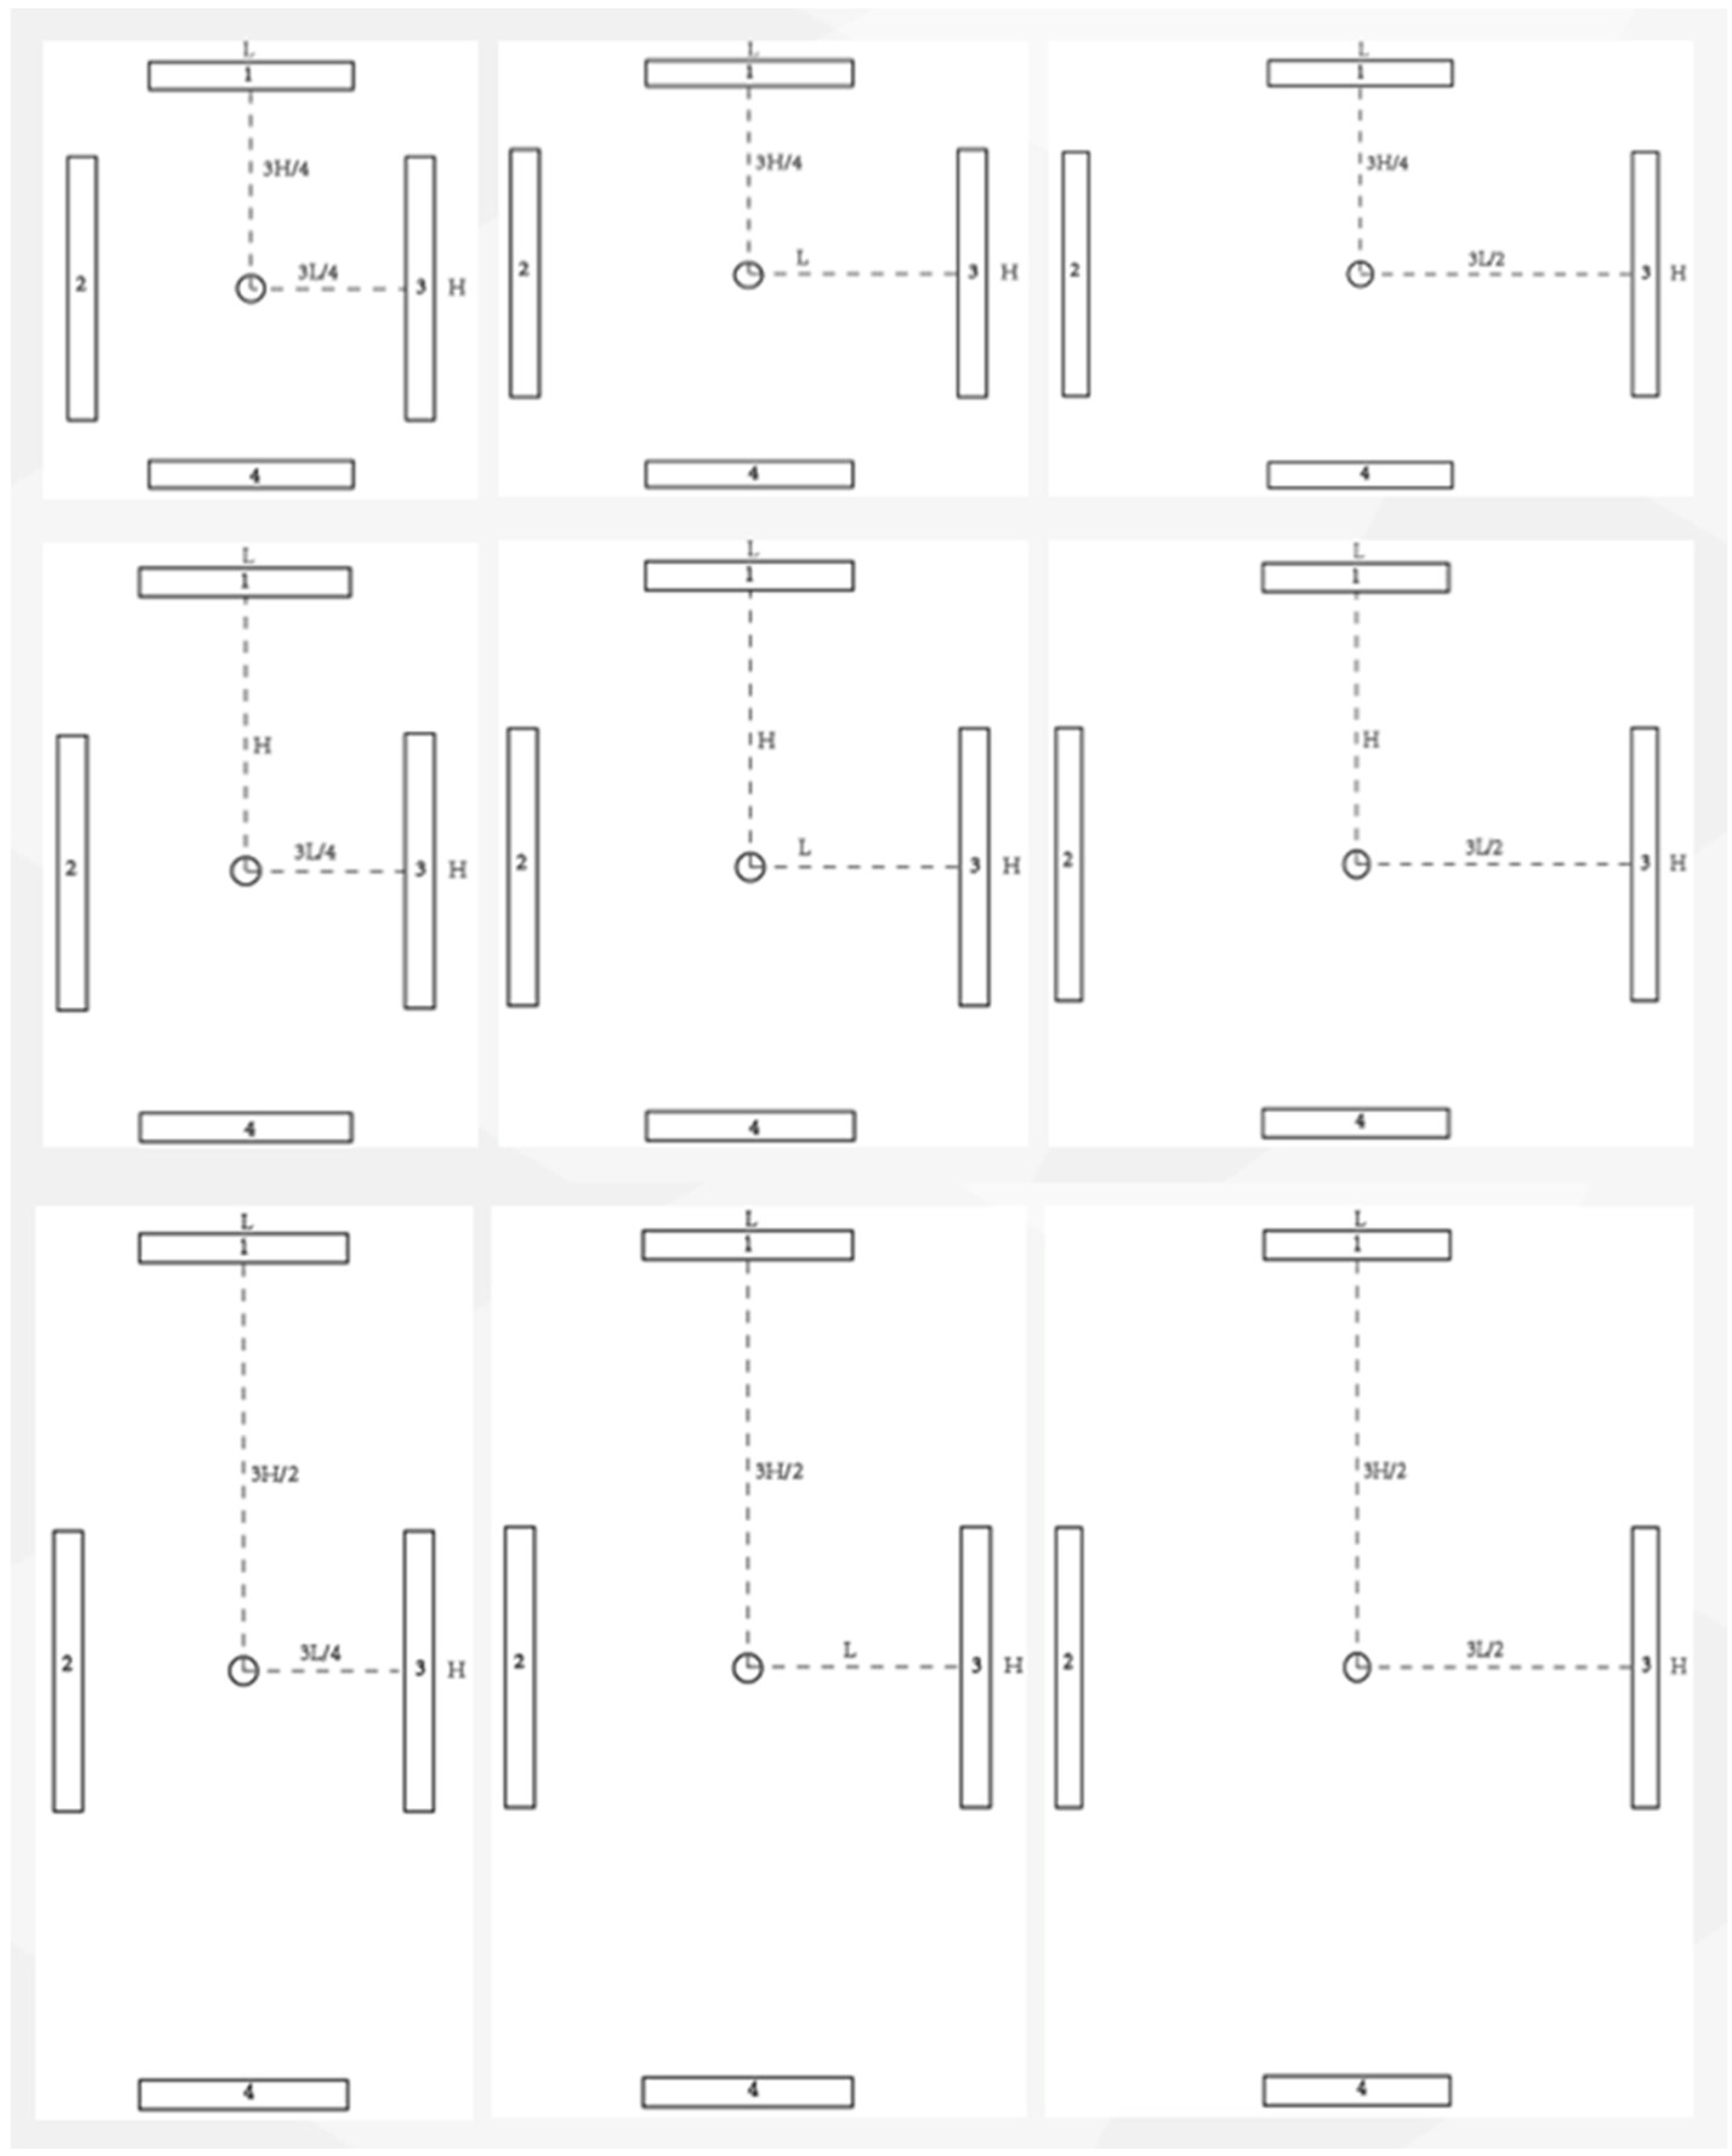
2.1. Experimental Design
2.2. Participants
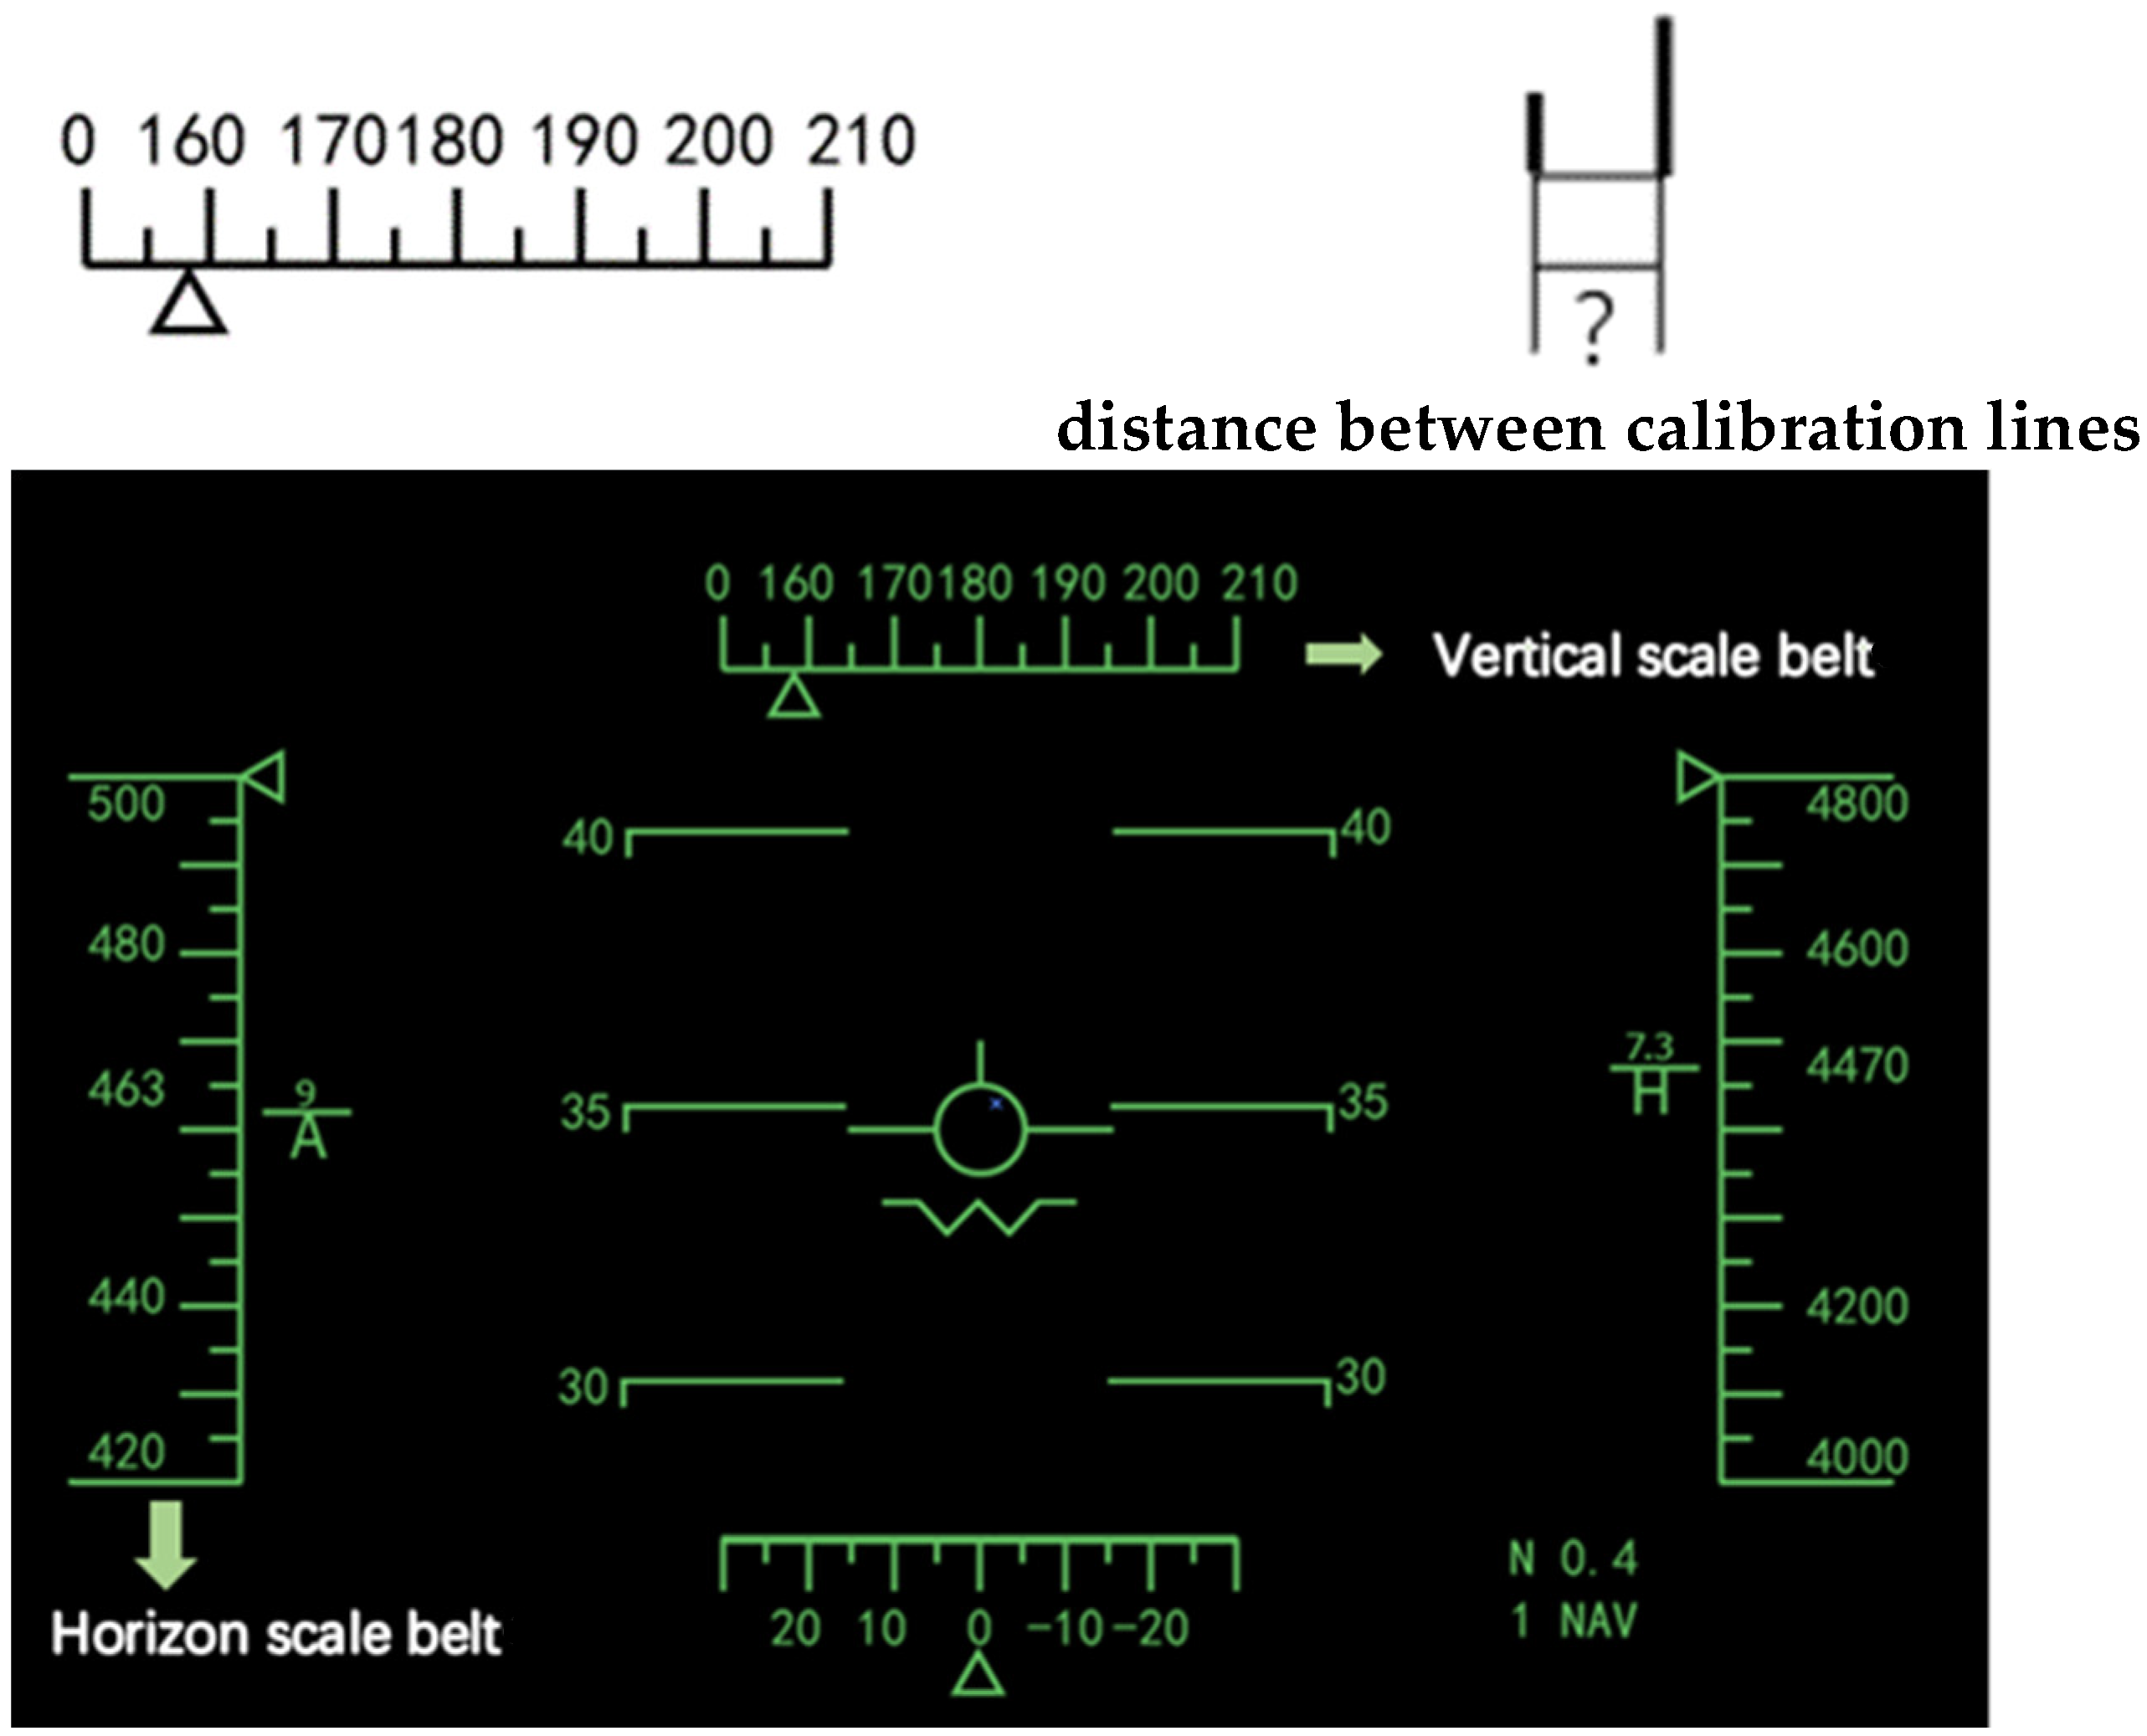
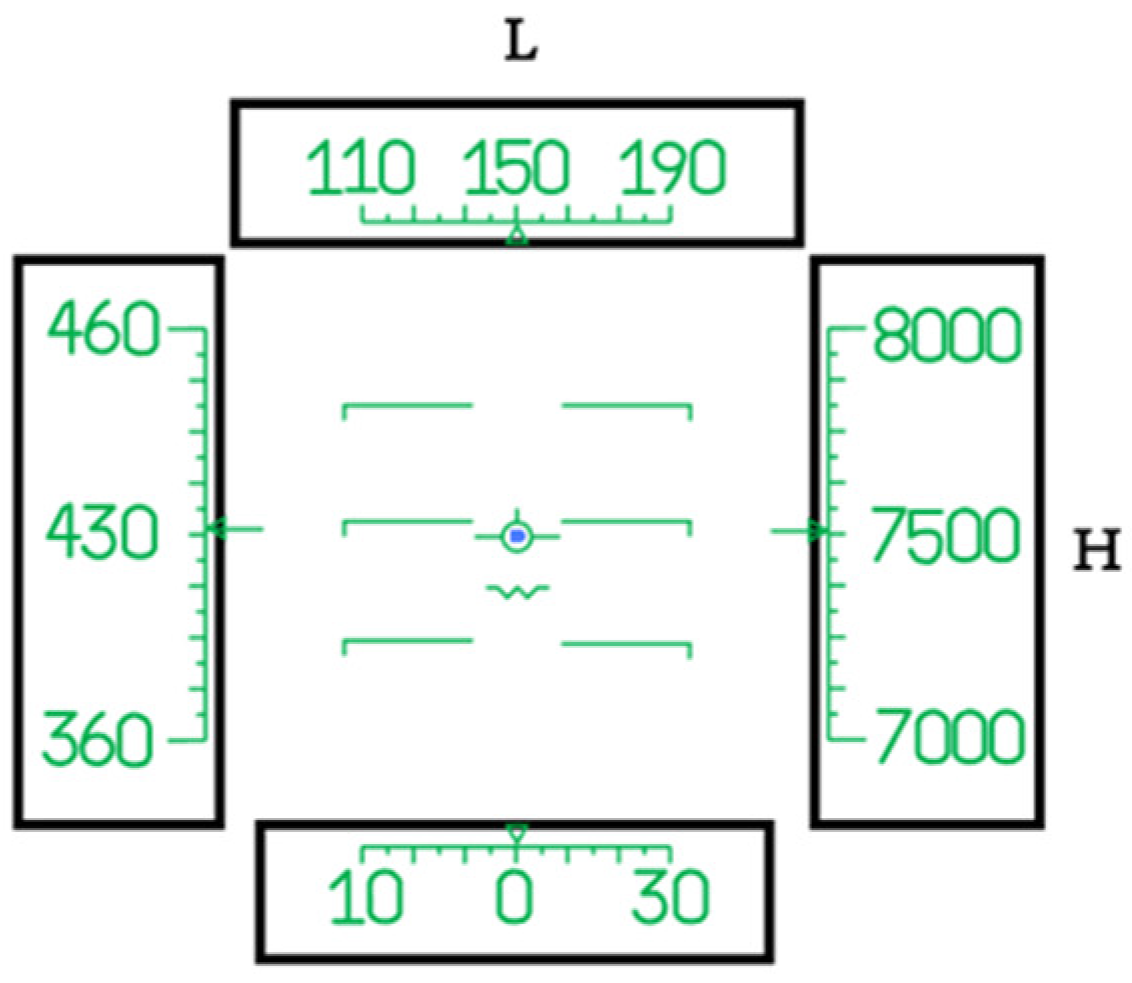
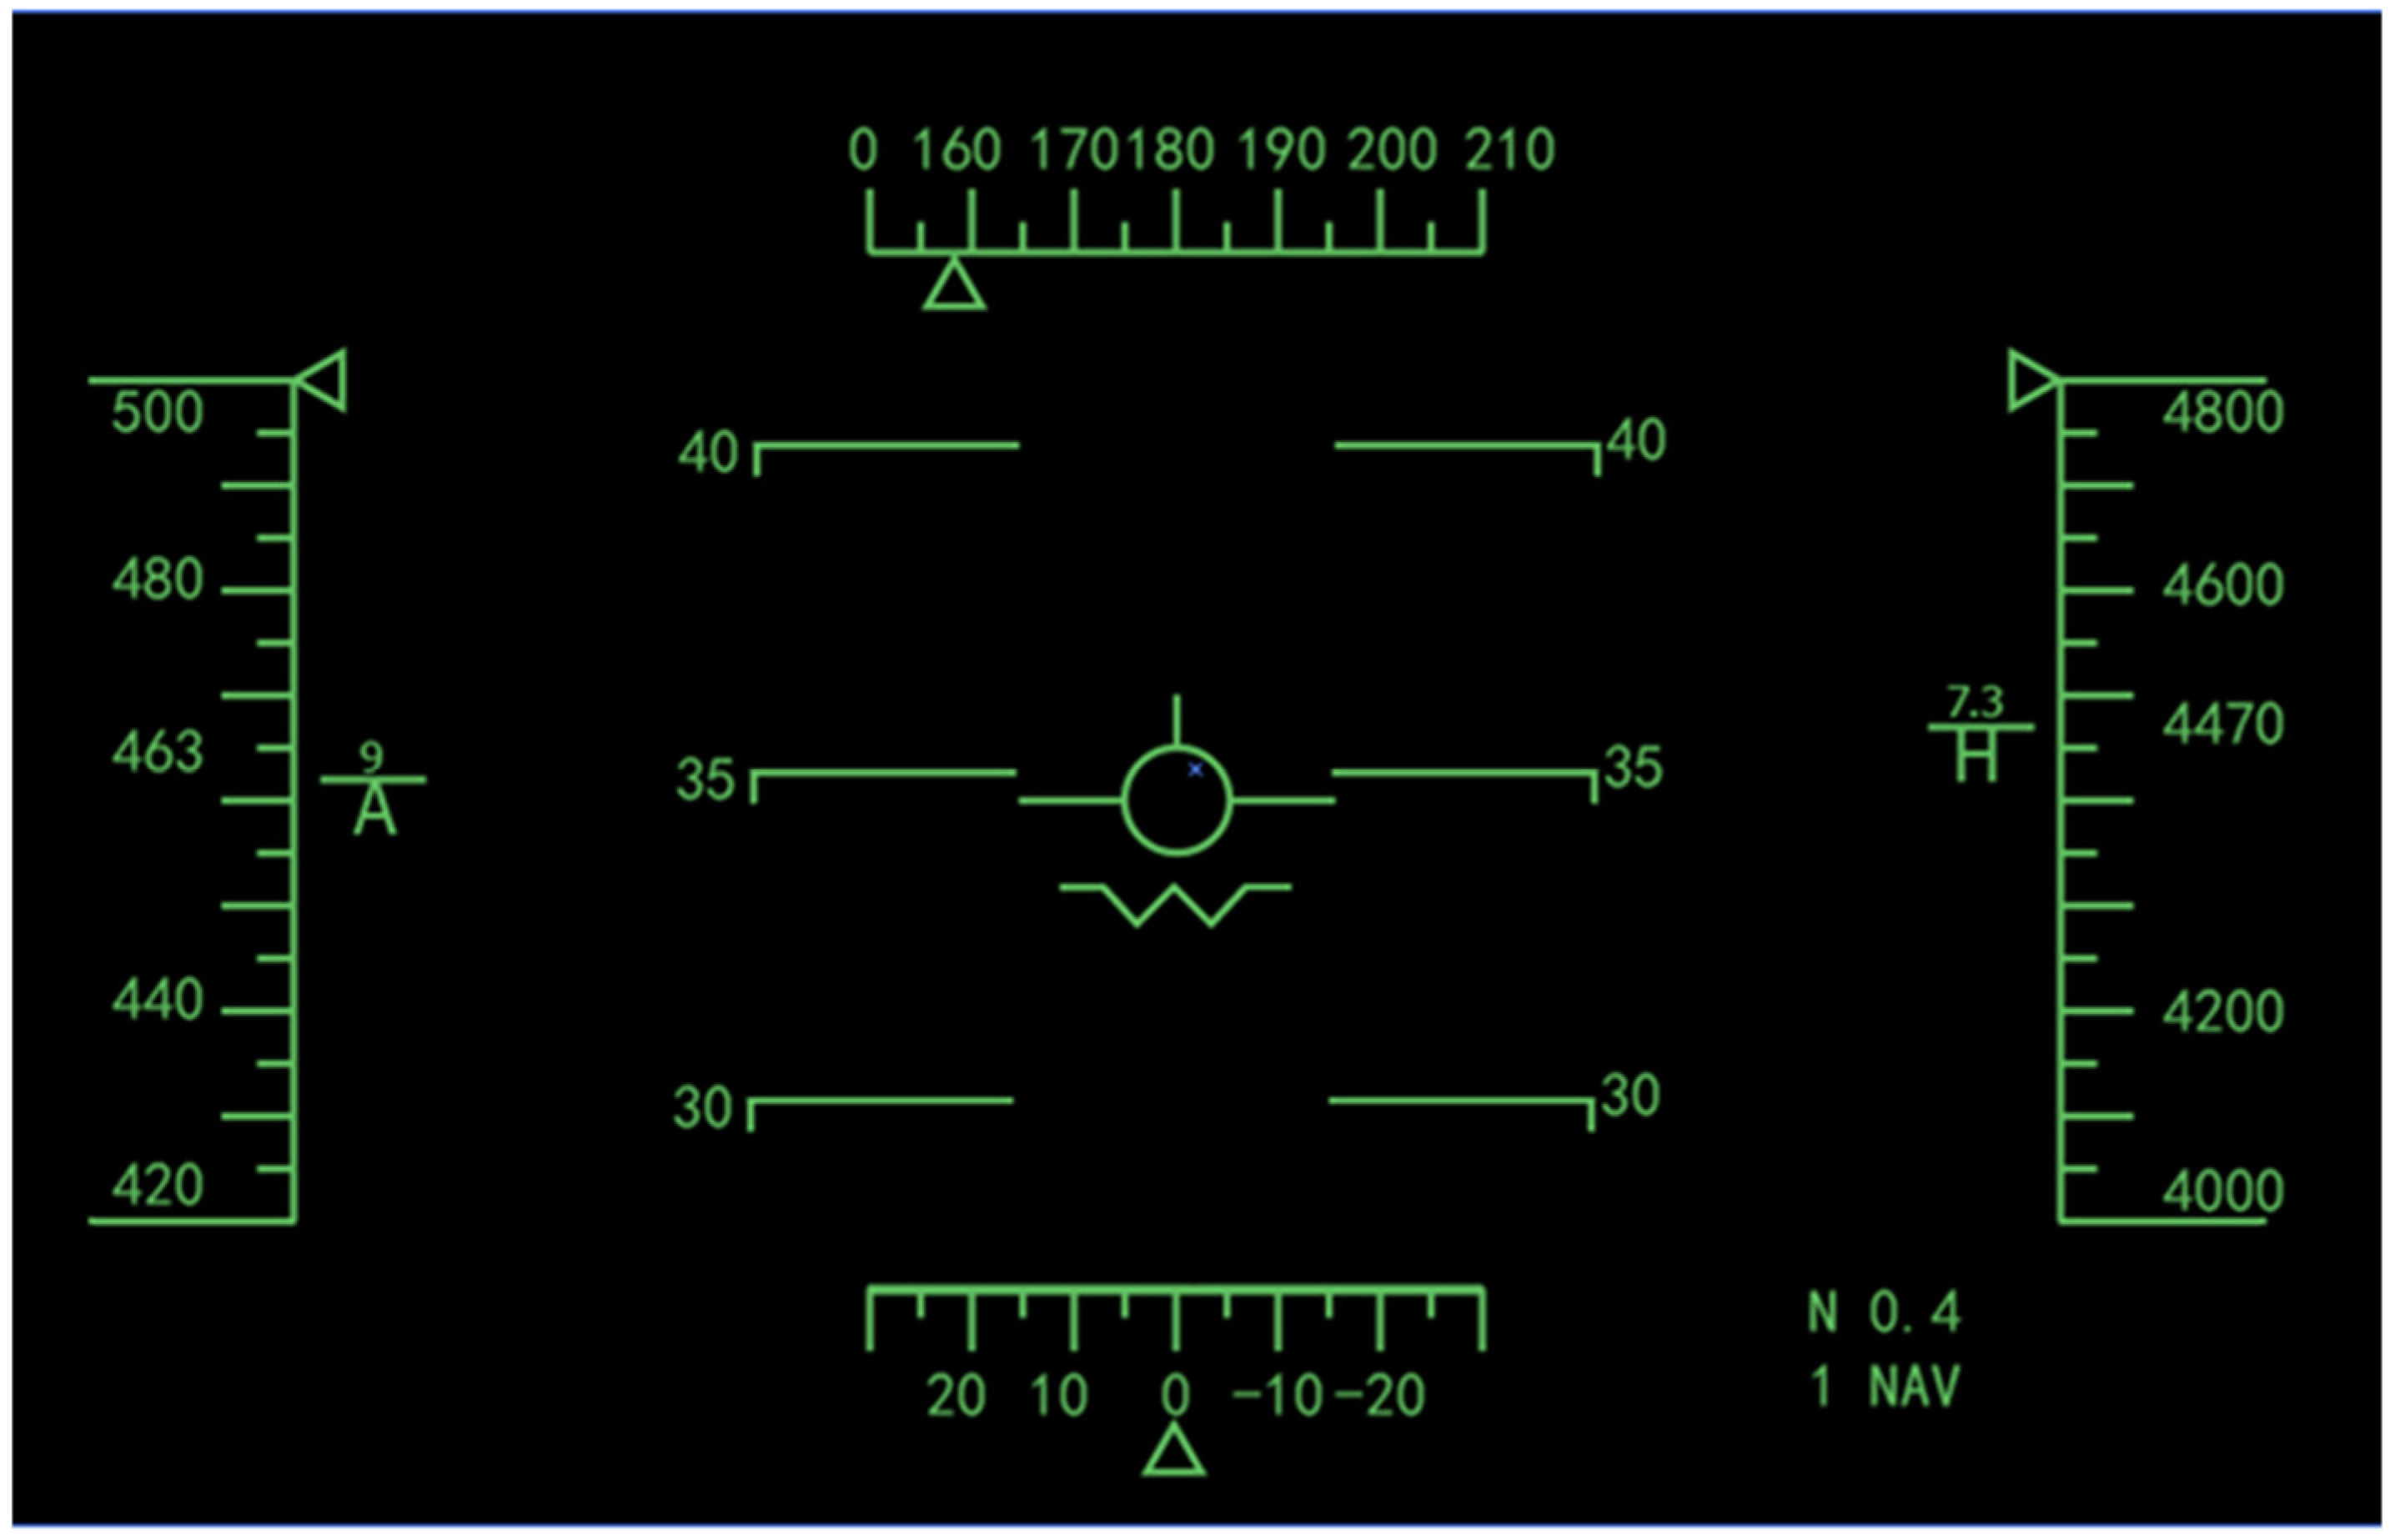
2.3. Materials
2.4. Procedures
2.5. Data Analysis
3. Results
3.1. Performance
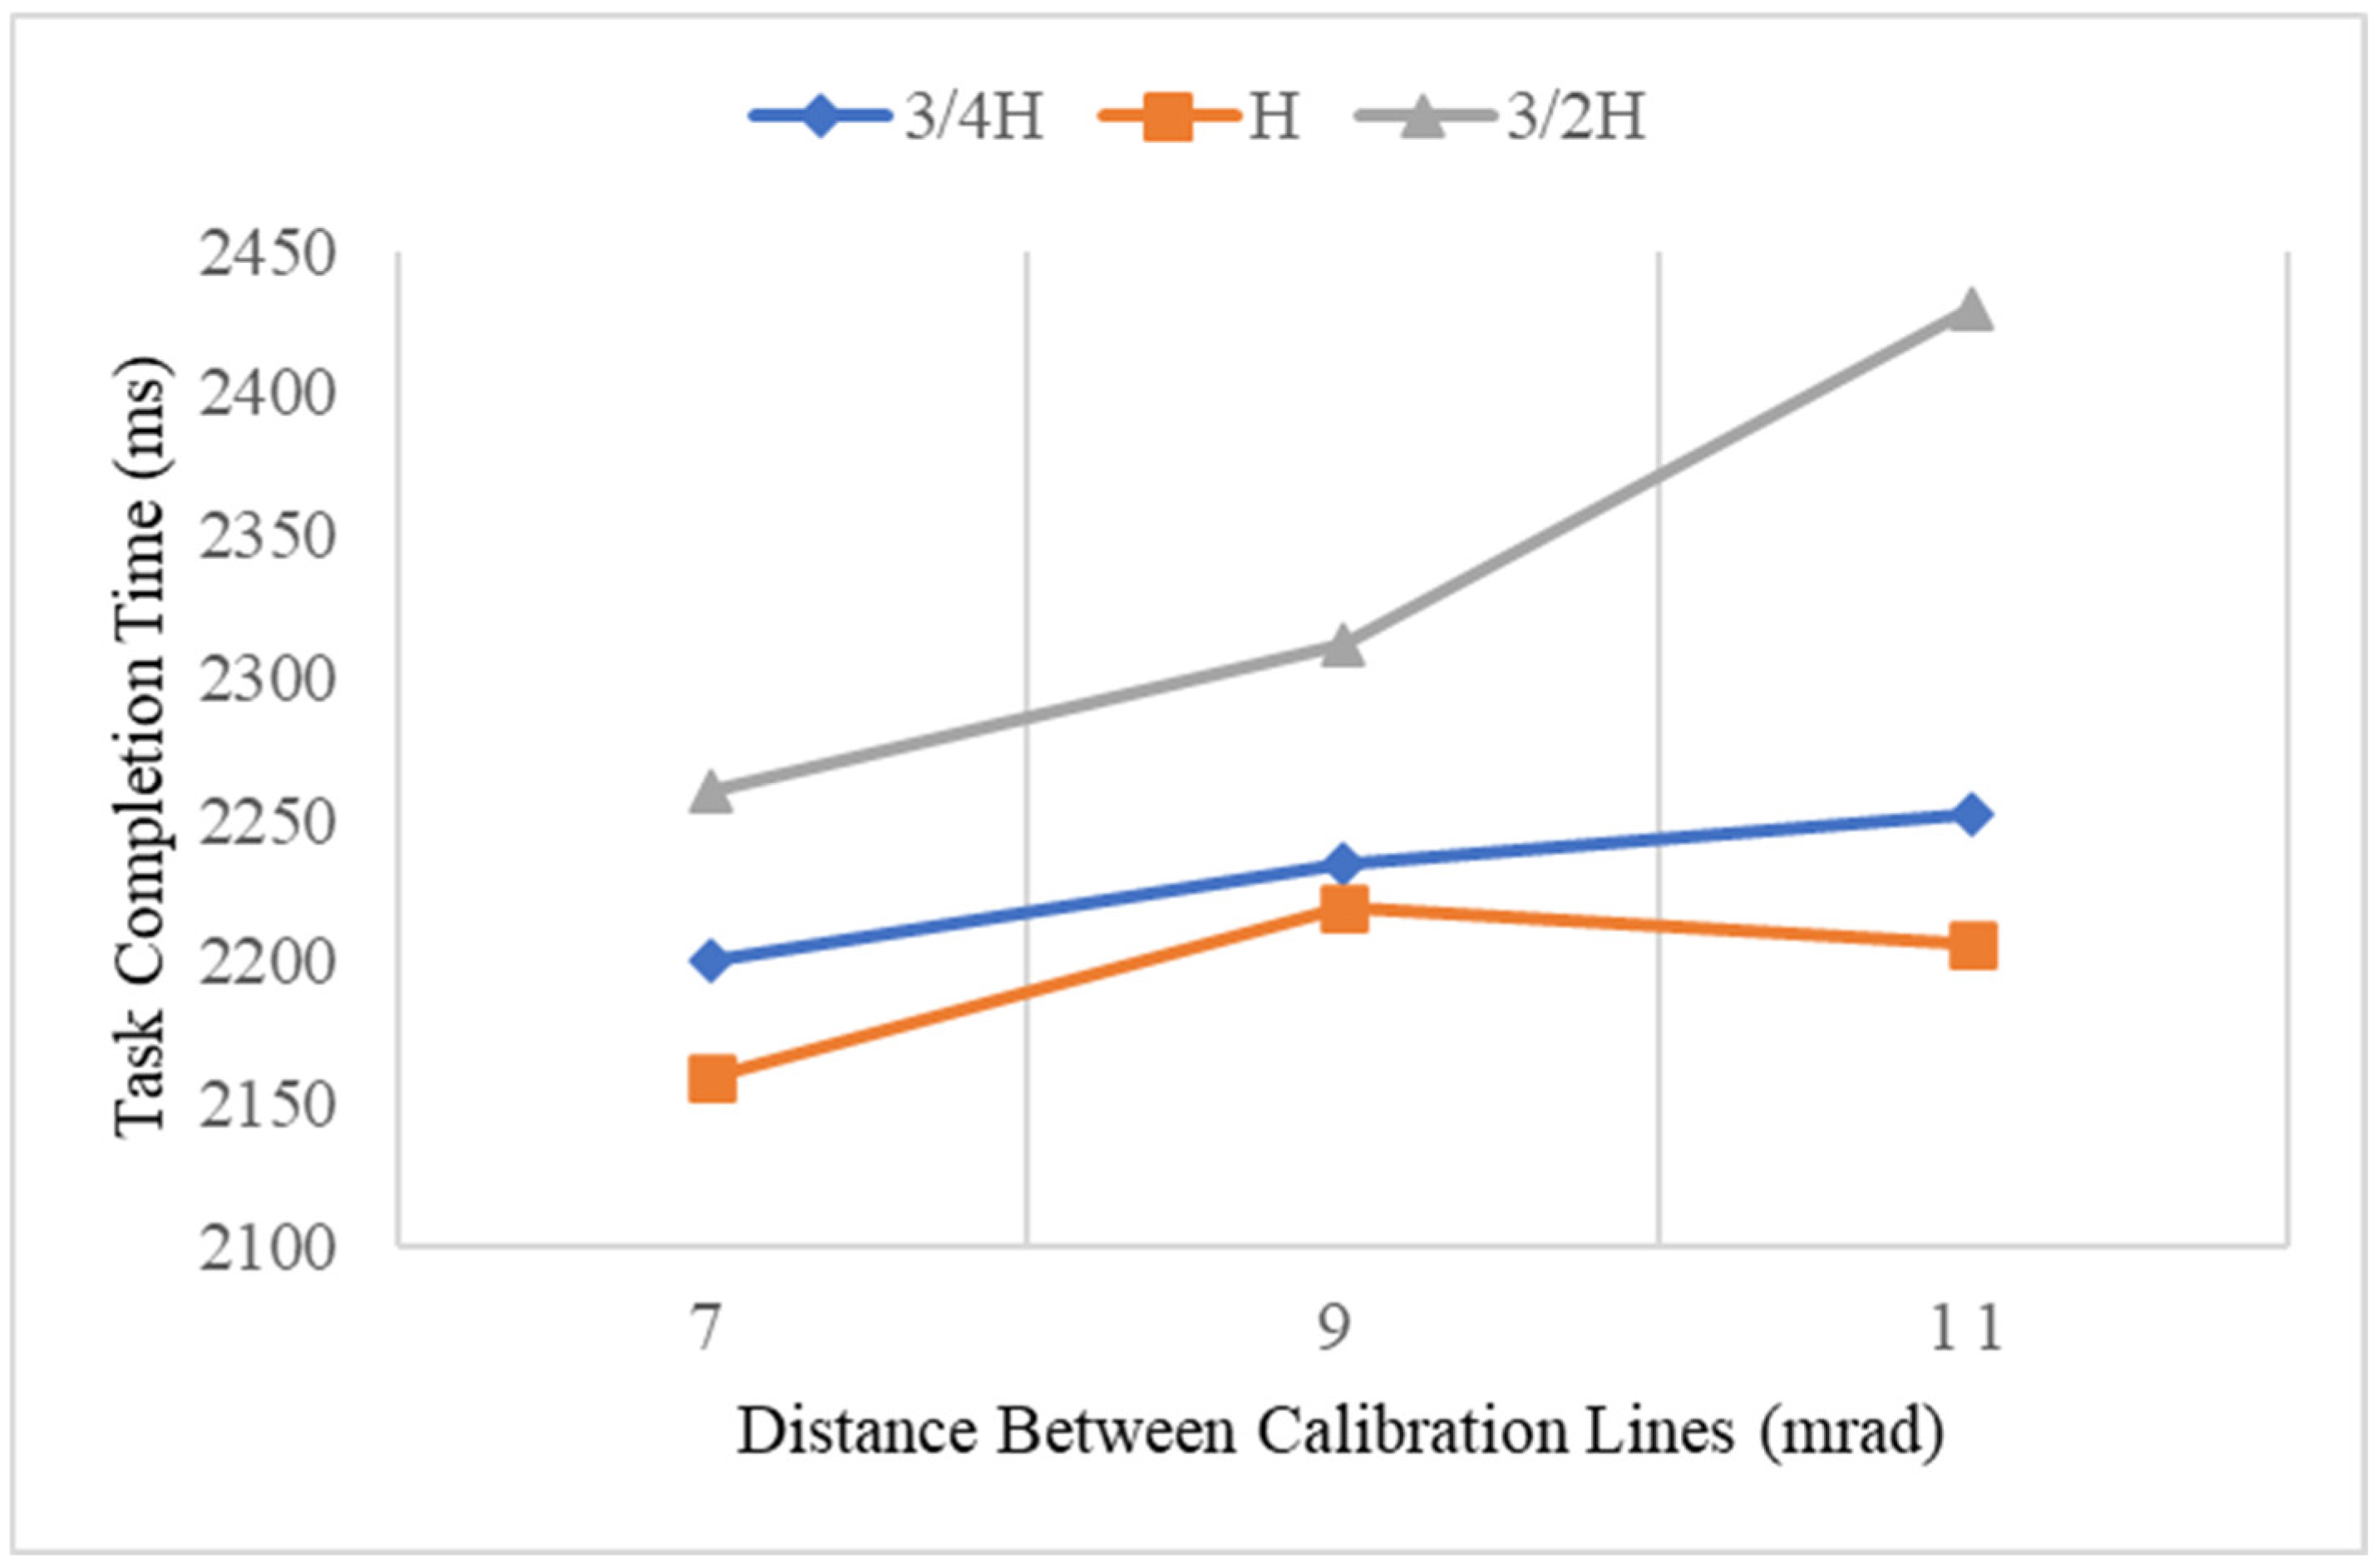
3.1.1. Task Completion Time
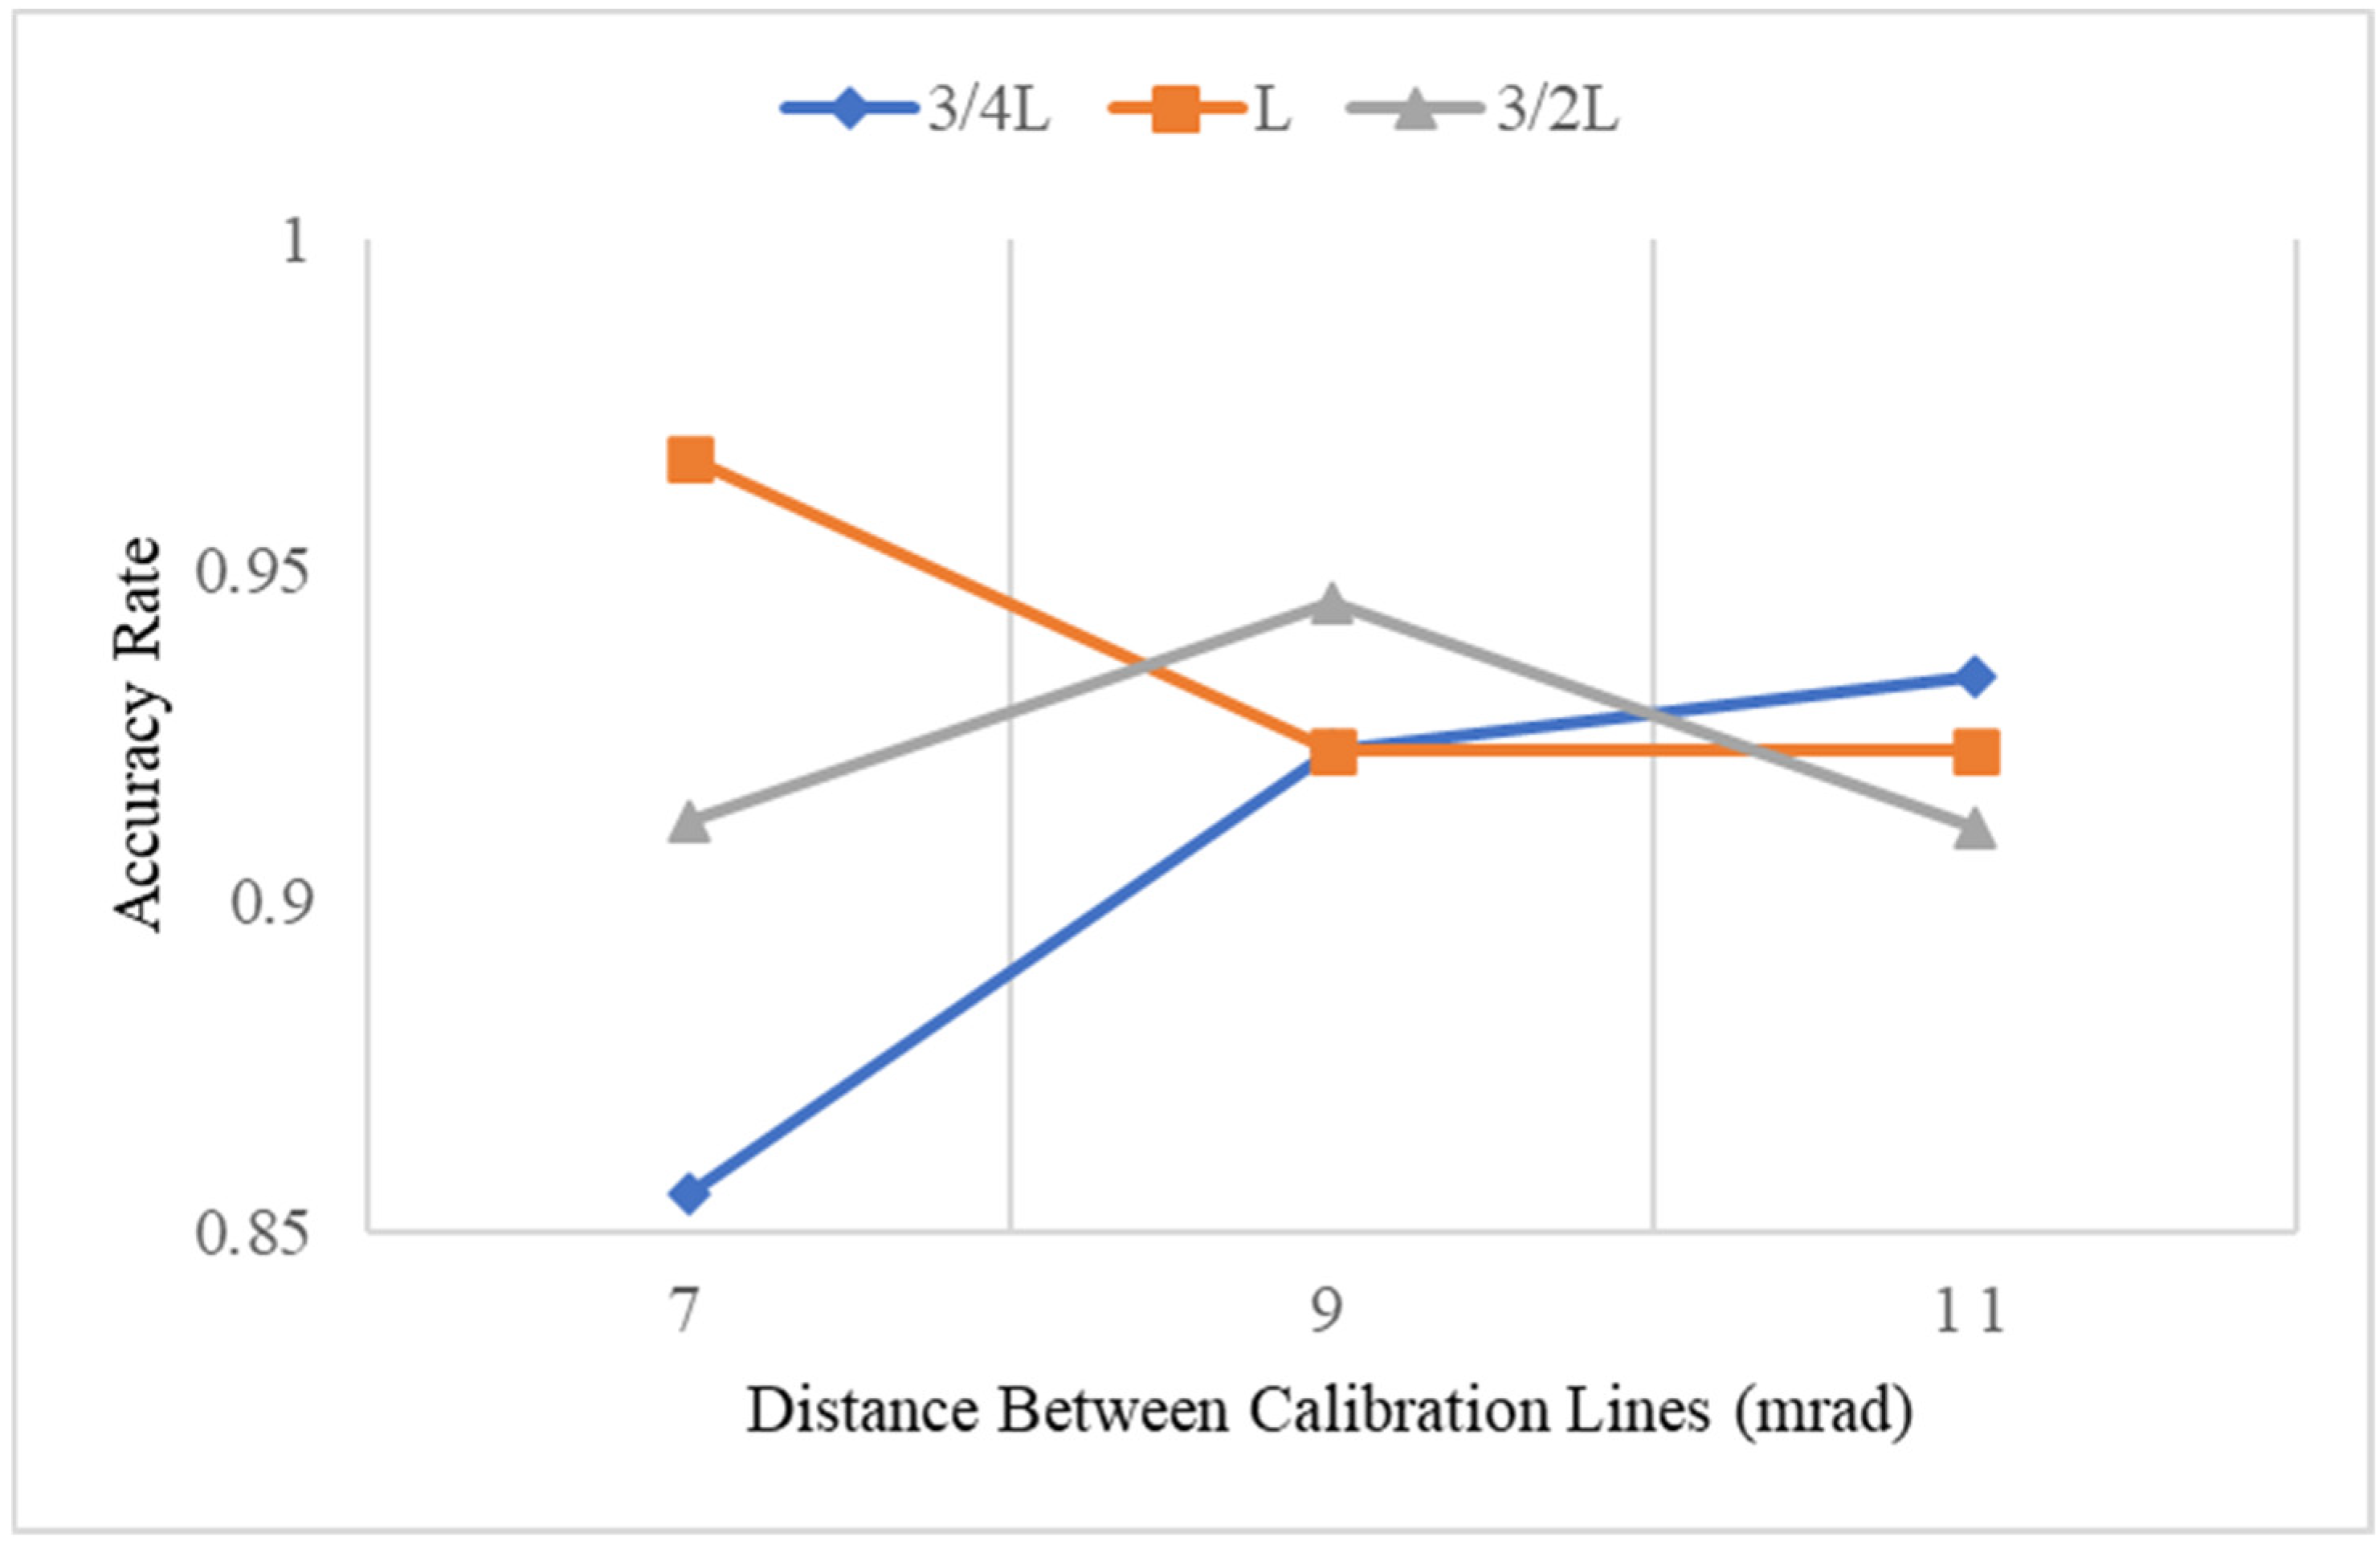
3.1.2. Task Accuracy Rate
3.2. User Preferences
4. Discussion
4.1. Discussion on HUDs and HWDs
4.2. Discussion of Scale Belt Layout of HWDs
5. Conclusions
Author Contributions
Funding
Institutional Review Board Statement
Informed Consent Statement
Data Availability Statement
Conflicts of Interest
References
- Winterbottom, M.D.; Patterson, R.; Pierce, B.J.; Taylor, A. Visual suppression of monocularly presented symbology against a fused background in a simulation and training environment. In Proceedings of the SPIE 6224—Helmet- and Head-Mounted Displays XI: Technologies and Applications, Orlando, FL, USA, 17–21 April 2006; pp. 12–21. [Google Scholar]
- Pascale, M.T.; Penelope, S.; David, L.; Ismail, M.; Nicola, S.; Loeb, R.G. Detection of visual stimuli on monocular peripheral head-worn displays. Appl. Ergon. 2018, 73, 167–173. [Google Scholar] [CrossRef] [PubMed] [Green Version]
- Chihara, T.; Seo, A. Evaluation of physical workload affected by mass and center of mass of head-mounted display. Appl. Ergon. 2018, 68, 204–212. [Google Scholar] [CrossRef] [PubMed] [Green Version]
- Winterbottom, M.D.; Patterson, R.; Pierce, B.J.; Covas, C.M.; Winner, J. Depth of Focus and Visual Recognition of Imagery Presented on Simultaneously Viewed Displays: Implications for Head-Mounted Displays. Hum. Factors J. Hum. Factors Ergon. Soc. 2007, 49, 907–919. [Google Scholar] [CrossRef] [PubMed]
- Posselt, B.N.; Winterbottom, M. Are new vision standards and tests needed for military aircrew using 3d stereo helmet-mounted displays? BMJ Mil. Health 2020, 167, 442–445. [Google Scholar] [CrossRef] [PubMed]
- Becker, S.I. The role of target–distractor relationships in guiding attention and the eyes in visual search. J. Exp. Psychol. Gen. 2010, 139, 247–265. [Google Scholar] [CrossRef] [PubMed] [Green Version]
- Kim, S.; Nussbaum, M.A.; Gabbard, J.L. Influences of augmented reality head-worn display type and user interface design on performance and usability in simulated warehouse order picking. Appl. Ergon. 2019, 74, 186–193. [Google Scholar] [CrossRef] [PubMed]
- Viertler, F.; Hajek, M. Evaluation of visual augmentation methods for rotorcraft pilots in degraded visual environments. J. Am. Helicopter Soc. 2017, 62, 1–11. [Google Scholar] [CrossRef]
- Sheedy, J.; Bergstrom, N. Performance and comfort on near eye computer displays. Optom. Vis. Sci. 2002, 79, 306–312. [Google Scholar] [CrossRef] [Green Version]
- Hakkinen, J. Avirtual Display for Mobile Use. In SID Symposium Digest 35; Society for Information Display: San Jose, CA, USA, 2004; pp. 1586–1589. [Google Scholar]
- Kooi, F.L. Visual strain: A comparison of monitors and head-mounted displays. In Proceedings of the SPIE—The International Society for Optical Engineering, San Jose, CA, USA, 10–12 February 1997; Volume 2949, pp. 162–171. [Google Scholar]
- Melzer, J.E.; Marasco, P.L.; Havig, P.R. Human-machine interface issues in the use of helmet-mounted displays in short conjugate simulators. In Proceedings of the SPIE—The International Society for Optical Engineering, Bellingham WA, USA, 25–29 April 2011; Volume 8041. [Google Scholar]
- Wenzel, B.; Castillo, A.; Baker, G. Assessment of the Virtual Environment Safe-for-Maintenance Trainer (VEST) (Tech. Rep. AFRL-HE-AZ-TP-2002-0011); Air Force Research Laboratory, Human Effectiveness Directorate: Mesa, AZ, USA, 2002. [Google Scholar]
- Patterson, R.; Winterbottom, M.D.; Pierce, B.J. Perceptual issues in the use of head mounted visual displays. Hum. Factors 2006, 48, 555–573. [Google Scholar] [CrossRef]
- Patterson, R.; Winterbottom, M.D.; Pierce, B.J.; Fox, R. Binocular rivalry and head worn displays. Hum. Factors 2007, 49, 1083–1096. [Google Scholar] [CrossRef]
- Draper, M.; Viirre, E.; Furness, T.; Gawron, V. Effects of image scale and system time delay on simulator sickness within head-coupled virtual environments. Hum. Factors 2001, 43, 129–146. [Google Scholar] [CrossRef] [PubMed]
- Rash, C.E.; McLean, W.E.; Mora, J.C.; Ledford, M.H.; Mozo, B.T. Design Issues for Helmet-Mounted Display Systems for Rotary-Wing Aviation; Army Aeromedical Research Unit: Fort Rucker, AL, USA, 1998. [Google Scholar]
- Van Orden, K.F.; Divita, J.; Shim, M.J. Redundant use of luminance and flashing with shape and color as highlighting codes in symbolic displays. Hum. Factors 1993, 35, 195–204. [Google Scholar] [CrossRef] [PubMed]
- Wickens, C.D.; Andre, A.D. Proximity compatibility and information display: Effects of color, space, and object display on information integration. Hum. Factors 1990, 32, 61–77. [Google Scholar] [CrossRef] [PubMed]
- Zhu, Y. The Ergonomic Study of Belt Graduation Display in Aircraft Cockpit. J. Suzhou Univ. (Nat. Sci.) 1996, 12, 89–94. [Google Scholar]
- He, B.; Wang, J.; Cheng, M.; Jiao, S. A Study of Scale Mark Dimensions, Separation and Reading Distance of Panel Instrument Dial. Acta Psychologica Sin. 1966, 10, 59–70. [Google Scholar]
- Xiong, D.; Guo, X.; Yi, L. Experimental study on ergonomics of fighter cockpit head up display heading scale belt display position. In Proceedings of the Chinese Man Machine Environment System Engineering Conference, Beijing, China, 22–27 July 2007; Chinese Society of Systems Engineering: Beijing, China, 2007. [Google Scholar]
- Guo, X.; Xiong, D.; Xiong, Y.; Yi, L.; Ma, X. Effects of the display formats on pilots’ cognitive performance with head-up display velocity, height and heading information in fighter. Chin. J. Aerosp. Med. 2007, 18, 84–90. [Google Scholar]
- Polys, N.F.; Bowman, D.A. Desktop Information-Rich Virtual Environment: Challenges and Techniques. Virtual Real. 2004, 8, 41–54. [Google Scholar] [CrossRef] [Green Version]
- Polys, N.F.; Kim, S.; Bowman, D.A. Effects of Information Layout, Screen Size, and Field of View on User Performance in Information-rich Virtual Environments; John Wiley & Sons, Ltd.: Hoboken, NJ, USA, 2005; pp. 46–55. [Google Scholar]
- Sedighi, A.; Rashedi, E.; Nussbaum, M.A. A head-worn display (“smart glasses”) has adverse impacts on the dynamics of lateral position control during gait. Gait Posture 2020, 81, 126–130. [Google Scholar] [CrossRef]
- Shao, J.; Yan, K.; Yao, J. Experimental study on visual search for aiming symbols in head-mounted AR system interface. J. Southeast Univ. (Nat. Sci. Ed.) 2020, 50, 20–25. [Google Scholar]
- Wu, X.; Xue, C.; Tang, W.; Shao, J. Experimental study on visual limitation experiment of goal-seeking in radar situation-interface. J. Southeast Univ. (Nat. Sci. Ed.) 2014, 44, 1166–1170. [Google Scholar]
- Zhu, F.; Yang, L.; Ji, B. Effect of Spatial Attributes of Display Interface on Eye Control Interaction. Space Med. Med. Eng. 2020, 33, 491–496. [Google Scholar]
- Chen, Z.; Rau, P.L.; Chen, C. The effects of human finger and Chinese character on Chinese handwriting performance on mobile touch devices. Hum. Factors 2014, 56, 553–568. [Google Scholar] [CrossRef] [PubMed]
- Chourasia, A.O.; Wiegmann, D.A.; Chen, K.B.; Irwin, C.B.; Sesto, M.E. Effect of sitting or standing on touch screen performance and touch characteristics. Hum. Factors 2013, 55, 789–802. [Google Scholar] [CrossRef] [PubMed]
- Colle, H.; Hiszem, K. Standing at a kiosk: Effects of key size and spacing on touch screen numeric keypad performance and user preference. Ergonomics 2004, 47, 1406–1423. [Google Scholar] [CrossRef] [PubMed]
- Zhou, J.; Liu, H.; Sun, Y.; Wang, C.; Chen, K. Self-Healing Titanium Dioxide Nanocapsules-Graphene/Multi-Branched Polyurethane Hybrid Flexible Film with Multifunctional Properties toward Wearable Electronics. Adv. Funct. Mater. 2021, 31, 2011133. [Google Scholar] [CrossRef]
- Liu, H.; Ni, Y.; Hu, J.; Jin, Y.; Gu, P.; Qiu, H.; Chen, K. Self-Healing and Antibacterial Essential Oil-Loaded Mesoporous Silica/Polyacrylate Hybrid Hydrogel for High-Performance Wearable Body-Strain Sensing. ACS Appl. Mater. Interfaces 2022, 14, 18. [Google Scholar] [CrossRef]


| Independent Variables | Task Completion Time (ms) | ANOVA | ||
|---|---|---|---|---|
| Descriptive Analysis | ||||
| Mean | SE | F Value | p-Value | |
| Display condition | 187.420 | p < 0.001 | ||
| HWD | 2241.65 | 22.64 | ||
| HUD | 2707.79 | 24.53 | ||
| Distance between calibration lines (mrad) | 0.239 | 0.790 | ||
| 7 | 2201.61 | 106.17 | ||
| 9 | 2244.07 | 113.78 | ||
| 11 | 2279.26 | 112.81 | ||
| Layouts of vertical calibration scale belts | 10.834 | 0.001 | ||
| 3H/4 | 2225.90 | 116.00 | ||
| H | 2117.22 | 98.33 | ||
| 3H/2 | 2381.82 | 118.43 | ||
| Layouts of horizonal calibration scale belts | 2.270 | 0.080 | ||
| 3L/4 | 2228.38 | 107.66 | ||
| L | 2217.61 | 115.51 | ||
| 3L/2 | 2278.95 | 109.59 | ||
| Source | F | p-Value |
|---|---|---|
| Distance between calibration lines | 0.239 | 0.790 |
| Layouts of vertical calibration scale belts | 10.834 | <0.001 |
| Layouts of horizonal calibration scale belts | 0.633 | 0.543 |
| Distance between calibration lines × Layouts of horizonal calibration scale belts | 2.27 | 0.080 |
| Distance between calibration lines × Layouts of vertical calibration scale belts | 0.258 | 0.903 |
| Layouts of horizonal calibration scale belts × Layouts of vertical calibration scale belts | 0.458 | 0.766 |
| Distance between calibration lines × Layouts of horizonal calibration scale belts × Layouts of vertical calibration scale belts | 1.028 | 0.423 |
| Independent Variables | Task Accuracy Rate | ANOVA | ||
|---|---|---|---|---|
| Descriptive Analysis | ||||
| Mean | SE | F Value | p-Value | |
| Display condition | 28.823 | <0.001 | ||
| HWD | 0.922 | 0.006 | ||
| HUD | 0.876 | 0.007 | ||
| Distance between calibration lines (mrad) | 1.168 | 0.318 | ||
| 7 | 0.912 | 0.029 | ||
| 9 | 0.930 | 0.024 | ||
| 11 | 0.923 | 0.029 | ||
| Layouts of vertical calibration scale belts | 2.421 | 0.098 | ||
| 3H/4 | 0.901 | 0.031 | ||
| H | 0.938 | 0.023 | ||
| 3H/2 | 0.926 | 0.028 | ||
| Layouts of horizonal calibration scale belts | 3.317 | <0.001 | ||
| 3L/4 | 0.904 | 0.032 | ||
| L | 0.938 | 0.023 | ||
| 3L/2 | 0.923 | 0.027 | ||
| Source | F | p-Value |
|---|---|---|
| Distance between calibration lines | 4.851 | 0.021 |
| Layouts of vertical calibration scale belts | 48.236 | <0.001 |
| Layouts of horizonal calibration scale belts | 6.659 | <0.001 |
| Distance between calibration lines × Layouts of horizonal calibration scale belts | 3.430 | 0.018 |
| Distance between calibration lines × Layouts of vertical calibration scale belts | 8.857 | <0.001 |
| Layouts of horizonal calibration scale belts × Layouts of vertical calibration scale belts | 3.360 | 0.020 |
| Distance between calibration lines × Layouts of horizonal calibration scale belts × Layouts of vertical calibration scale belts | 1.356 | 0.231 |
| Independent Variables | User Preference | ANOVA | ||
|---|---|---|---|---|
| Descriptive Analysis | ||||
| Mean | (SE) | F Value | p-Value | |
| Distance between calibration lines (mrad) | 15.606 | <0.001 | ||
| 7 | 5.93 | 0.247 | ||
| 9 | 5.76 | 0.212 | ||
| 11 | 5.16 | 0.259 | ||
| Layouts of vertical calibration scale belts | 21.484 | <0.001 | ||
| 3H/4 | 6.17 | 0.233 | ||
| H | 6.64 | 0.230 | ||
| 3H/2 | 4.07 | 0.254 | ||
| Layouts of horizonal calibration scale belts | 155.477 | <0.001 | ||
| 3L/4 | 5.20 | 0.225 | ||
| L | 5.94 | 0.245 | ||
| 3L/2 | 5.71 | 0.247 | ||
Disclaimer/Publisher’s Note: The statements, opinions and data contained in all publications are solely those of the individual author(s) and contributor(s) and not of MDPI and/or the editor(s). MDPI and/or the editor(s) disclaim responsibility for any injury to people or property resulting from any ideas, methods, instructions or products referred to in the content. |
© 2023 by the authors. Licensee MDPI, Basel, Switzerland. This article is an open access article distributed under the terms and conditions of the Creative Commons Attribution (CC BY) license (https://creativecommons.org/licenses/by/4.0/).
Share and Cite
Zhang, X.; Cheng, J.; Xue, H.; Chen, S. Interface Design of Head-Worn Display Application on Condition Monitoring in Aviation. Sensors 2023, 23, 736. https://doi.org/10.3390/s23020736
Zhang X, Cheng J, Xue H, Chen S. Interface Design of Head-Worn Display Application on Condition Monitoring in Aviation. Sensors. 2023; 23(2):736. https://doi.org/10.3390/s23020736
Chicago/Turabian StyleZhang, Xiaoyan, Jia’ao Cheng, Hongjun Xue, and Siyu Chen. 2023. "Interface Design of Head-Worn Display Application on Condition Monitoring in Aviation" Sensors 23, no. 2: 736. https://doi.org/10.3390/s23020736