
Impact of Glass Irradiation on Laser-Induced Breakdown Spectroscopy Data Analysis
 ,
,
Abstract
:1. Introduction
2. Materials and Methods
2.1. Method and Calculation Details
2.1.1. Single-Line Effects
2.1.2. Multi-Line Effects
2.2. Experiment
2.2.1. LIBS Data Collection
2.2.2. Absorption Measurements
3. Results
4. Discussion
Author Contributions
Funding
Institutional Review Board Statement
Informed Consent Statement
Data Availability Statement
Acknowledgments
Conflicts of Interest
Abbreviations
| NIR | Near infrared |
| UV | Ultraviolet |
| LIBS | Laser-induced breakdown spectroscopy |
| SNR | Signal-to-noise ratio |
| HWHM | Half-width at half-maximum |
| FWHM | Full-width at half-maximum |
| Nd:YAG | Neodymium-doped yttrium aluminum garnet |
| ppm | Parts per million |
| ppb | Parts per billion |
References
- Williams, A.; Phongikaroon, S. Laser-induced Breakdown Spectroscopy (LIBS) Measurement of Uranium in Molten Salt. Appl. Spectrosc. 2018, 72, 1029–1039. [Google Scholar] [CrossRef] [PubMed]
- Burger, M.; Garrett, L.; Burak, A.; Petrov, V.; Manera, A.; Sabharwall, P.; Sun, X.; Jovanovic, I. Trace xenon detection in helium Via Laser-Induc. Breakdown Spectrosc. J. Anal. At. Spectrom. 2021, 36, 824–828. [Google Scholar] [CrossRef]
- Andrews, H.; Myhre, K. Quantification of Lanthanides in a Molten Salt Surrogate Off-Gas Stream Using Laser-Induced Breakdown Spectroscopy. Appl. Spectrosc. 2022, 76, 877–886. [Google Scholar] [CrossRef] [PubMed]
- Andrews, H.; MacFarlane, J.; Myhre, K. Monitoring Noble Gases (Xe and Kr) and Aerosols (Cs and Rb) in a Molten Salt Reactor Surrogate Off-Gas Stream Using Laser-Induced Breakdown Spectroscopy (LIBS). Appl. Spectrosc. 2022, 76, 988–997. [Google Scholar] [CrossRef] [PubMed]
- Lee, Y.; Yoon, S.; Kim, N.; Kang, D.; Kim, H.; Yang, W.; Burger, M.; Jovanovic, I.; Choi, S. In-situ measurement of Ce concentration in high-temperature molten salts using acoustic-assisted laser-induced breakdown spectroscopy with gas protective layer. Nucl. Eng. Technol. 2022. in-press. [Google Scholar] [CrossRef]
- Cremers, D.; Radziemski, L. Handbook of Laser-Induced Breakdown Spectroscopy; John Wiley & Sons: Hoboken, NJ, USA, 2013. [Google Scholar]
- Russo, R.; Mao, X.; Gonzalez, J.; Zorba, V.; Yoo, J. Laser Ablation in Analytical Chemistry. Anal. Chem. 2013, 85, 6162–6177. [Google Scholar] [CrossRef]
- Rusak, D.; Castle, B.; Smith, B.; Winefordner, J. Fundamentals and Applications of Laser-Induced Breakdown Spectroscopy. Crit. Rev. Anal. Chem. 1997, 27, 257–290. [Google Scholar] [CrossRef]
- Sabharwall, P.; Weaver, K.; Anand, N.; Ellis, C.; Sun, X.; Choi, H.; Chen, D.; Christensen, R.; Fronk, B.; Gess, J.; et al. Preconceptual Design of Multifunctional Gas-Cooled Cartridge Loop for the Versatile Test Reactor: Instrumentation and Measurement—Part II. Nucl. Sci. Eng. 2022, 196, 215–233. [Google Scholar] [CrossRef]
- Primak, W.; Edwards, E. Radiation-induced dilations in vitreous silica. Phys. Rev. 1962, 128, 2580–2588. [Google Scholar] [CrossRef]
- Primak, W.; Luthra, J. Radiation induced expansion and increase in refractive index of magnesium oxide; evidence for the F center. Phys. Rev. 1966, 39, 5651–5658. [Google Scholar]
- Sharma, G.; Thind, K.; Manupriya; Klare, H.; Narang, S.; Gerward, L.; Dangwal, V. Effects of gamma-ray irradiation on optical properties of ZnO-PbO-B2O3 glasses. Nucl. Instrum. Methods Phys. Res. B 2006, 243, 345–348. [Google Scholar] [CrossRef]
- Morgan, B.; Van Zile, M.; Sabharwall, P.; Burger, M.; Jovanovic, I. Gamma-radiation-induced negative nonlinear absorption in quartz glass. Opt. Mater. Express 2022, 12, 1188–1197. [Google Scholar] [CrossRef]
- Saeki, M.; Iwanade, A.; Ito, C.; Wakaida, I.; Thornton, B.; Sakka, T.; Ohba, H. Development of a fiber-coupled laser-induced breakdown spectroscopy instrument for analysis of underwater debris in a nuclear reactor core. J. Nucl. Sci. Technol. 2014, 51, 930–938. [Google Scholar] [CrossRef] [Green Version]
- Nakanishi, R.; Saeki, M.; Wakaida, I.; Ohba, H. Detection of Gadolinium in Surrogate Nuclear Fuel Debris Using Fiber-Optic Laser-Induced Breakdown Spectroscopy Under Gamma Irradiation. Appl. Sci. 2020, 10, 8985. [Google Scholar] [CrossRef]
- Morgan, B.; Van Zile, M.; Petrie, C.; Sabharwall, P.; Burger, M.; Jovanovic, I. Optical Absorption of Fused Silica and Sapphire Exposed to Neutron and Gamma Radiation with Simultaneous Thermal Annealing. J. Nucl. Mater. 2022, 570, 153945. [Google Scholar] [CrossRef]
- Yoo, J.; Seo, C.; Kim, E.; Lee, H. A conceptual study of pyroprocessing for recovering actinides from spent oxide fuels. Nucl. Eng. Technol. 2008, 40, 581–592. [Google Scholar] [CrossRef] [Green Version]
- Davies, J.; Vaughan, J. A New Tabulation of the Voigt Profile. Astrophys. J. 1963, 137, 1302–1305. [Google Scholar] [CrossRef]
- Whiting, E. An empirical approximation to the Voigt profile. J. Quant. Spectrosc. Radiat. Transf. 1968, 8, 1379–1384. [Google Scholar] [CrossRef]
- Griem, H. Principles of Plasma Spectroscopy; Cambridge University Press: New York, NY, USA, 1997. [Google Scholar]
- El Haddad, J.; Canioni, L.; Bousquet, B. Good practices in LIBS analysis: Review and advices. Spectrochim. Acta B At. Spectrosc. 2014, 101, 171–182. [Google Scholar] [CrossRef] [Green Version]
- Essien, M.; Radziemski, L.; Sneddon, J. Detection of cadmium, lead and zinc in aerosols by laser-induced breakdown spectrometry. J. Anal. At. Spectrom. 1988, 3, 985–988. [Google Scholar] [CrossRef]
- Joseph, M.; Xu, N.; Majidi, V. Time-resolved emission characteristics and temperature profiles of laser-induced plasmas in helium. Spectromchim. Acta B At. Spectrosc. 1994, 49, 89–103. [Google Scholar] [CrossRef]
- Aragón, C.; Peñalba, F.; Aguilera, J. Spatial characterization of laser-induced plasmas: Distributions of neutral atom and ion densities. Appl. Phys. A 2004, 79, 1145–1148. [Google Scholar] [CrossRef]
- Yalçin, Ş.C.D.; Smith, G.; Faris, G. Influence of ambient conditions on the laser air spark. Appl. Phys. B 1999, 68, 121–130. [Google Scholar]
- Aguilera, J.; Aragón, C. Mult-element Saha-Boltzmann and Boltzmann plots in laser-induced plasmas. Spectrochim. Acta B At. Spectrosc. 2007, 62, 378–385. [Google Scholar] [CrossRef]
- Cristoforetti, G.; De Giacomo, A.; Dell’Aglio, M.; Legnaioli, S.; Tognoni, E.; Palleschi, V.; Omenetto, N. Local Thermodynamic Equilibrium in Laser-Induced Breakdown Spectroscopy: Beyond the McWhirter criterion. Spectrochim. Acta B At. Spectrosc. 2010, 65, 86–95. [Google Scholar] [CrossRef]
- Konjević, N.; Dimitrijevic, M.; Wiese, W. Experimental Stark Widths and Shifts for Spectral Lines and Neutral Atoms (A Critical Review of Selected Data For the Period 1976 to 1982. J. Phys. Chem. Ref. Data 1984, 13, 619–647. [Google Scholar] [CrossRef] [Green Version]
- pact broadening effect in CP stars: The case of La II, La III, Eu II, and Eu III lines. A&A 1999, 350, 719–724.
- Konjević, N.; Lesage, A.; Fuhr, J.; Wiese, W. Experimental Stark Widths and Shifts for Spectral Lines of Neutral and Ionized Atoms (A Critical Review of Selected Data for the Period 1989 Through 2000. J. Phys. Chem. 2002, 31, 819–927. [Google Scholar] [CrossRef]
- Konjević, N. Plasma broadening and shifting of non-hydrogenic spectral lines: Present status and applications. Phys. Rep. 1999, 316, 339–401. [Google Scholar] [CrossRef]
- Sun, L.; Yu, H. Correction of self-absorption in calibration-free laser-induced breakdown spectroscopy by an internal reference method. Talanta 2009, 79, 288–395. [Google Scholar] [CrossRef] [Green Version]
- Hutchinson, I. Principles of Plasma Diagnostics, 2nd ed.; Cambridge University Press: New York, NY, USA, 2002. [Google Scholar]
- Sabbagh, J.; Sadeghi, N. Experimental transition probabilities of some Xe(I) lines. J. Quant. Spectrosc. Radiat. Transf. 1977, 17, 297–301. [Google Scholar] [CrossRef]
- Shuker, R.; Binur, Y.; Szöke, A. Studies of afterglow in noble-gas mixtures: A model for energy transfer in He/Xe. Phys. Rev. A 1975, 12, 515. [Google Scholar] [CrossRef]
- Fuhr, J.; Wiese, W. CRC Handbook of Chemistry and Physics, 79th ed.; CRC Press: Boca Raton, FL, USA, 1998. [Google Scholar]
- Hahn, D.; Omenetto, N. Laser-Induced Breakdown Spectroscopy (LIBS), Part I: Review of Basic Diagnostics and Plasma-Particle Interactions: Still-Challenging Issues within the Analytical Plasma Community. Appl. Spectrosc. 2010, 64, 335A–366A. [Google Scholar] [CrossRef] [PubMed]
- Xiao, X.; Le Berre, S.; Fobar, D.; Burger, M.; Skrodzki, P.; Hartig, K.; Motta, A.; Jovanovic, I. Measurement of chlorine concentration on steel surfaces via fiber-optic laser-induced breakdown spectroscopy in double-pulse configuration. Spectrochim. Acta B At. Spectrosc. 2018, 141, 44–52. [Google Scholar] [CrossRef]
- Fobar, D.; Xiao, X.; Burger, M.; Le Berre, S.; Motta, A.; Jovanovic, I. Robotic delivery of laser-induced breakdown spectroscopy for sensitive chlorine measurement in dry cask storage systems. Prog. Nucl. Energy 2018, 109, 188–194. [Google Scholar] [CrossRef]


| Spectral Line | Irradiation Condition | Shots for 3 |
|---|---|---|
| Xe I, 828.0 nm | Unirradiated | 1 ± 1 |
| Infrasil Irradiation | 2 ± 2 | |
| Infrasil n Irradiation | 4 ± 2 | |
| Sapphire Irradiation | 1 ± 1 | |
| Sapphire n Irradiation | 1 ± 1 | |
| Xe II, 484.4 nm | Unirradiated | 1 ± 1 |
| Infrasil Irradiation | 2 ± 2 | |
| Infrasil n Irradiation | 17 ± 5 | |
| Sapphire Irradiation | 1 ± 1 | |
| Sapphire n Irradiation | 5 ± 3 | |
| Eu I, 462.7 nm | Unirradiated | 4 ± 2 |
| Infrasil Irradiation | 5 ± 3 | |
| Infrasil n Irradiation | 50 ± 7 | |
| Sapphire Irradiation | 5 ± 3 | |
| Sapphire n Irradiation | 13 ± 4 | |
| Eu II, 281.4 nm | Unirradiated | 6 ± 3 |
| Infrasil Irradiation | 36 ± 6 | |
| Infrasil n Irradiation | 131 ± 12 | |
| Sapphire Irradiation | 17 ± 5 | |
| Sapphire n Irradiation | 141 ± 12 |
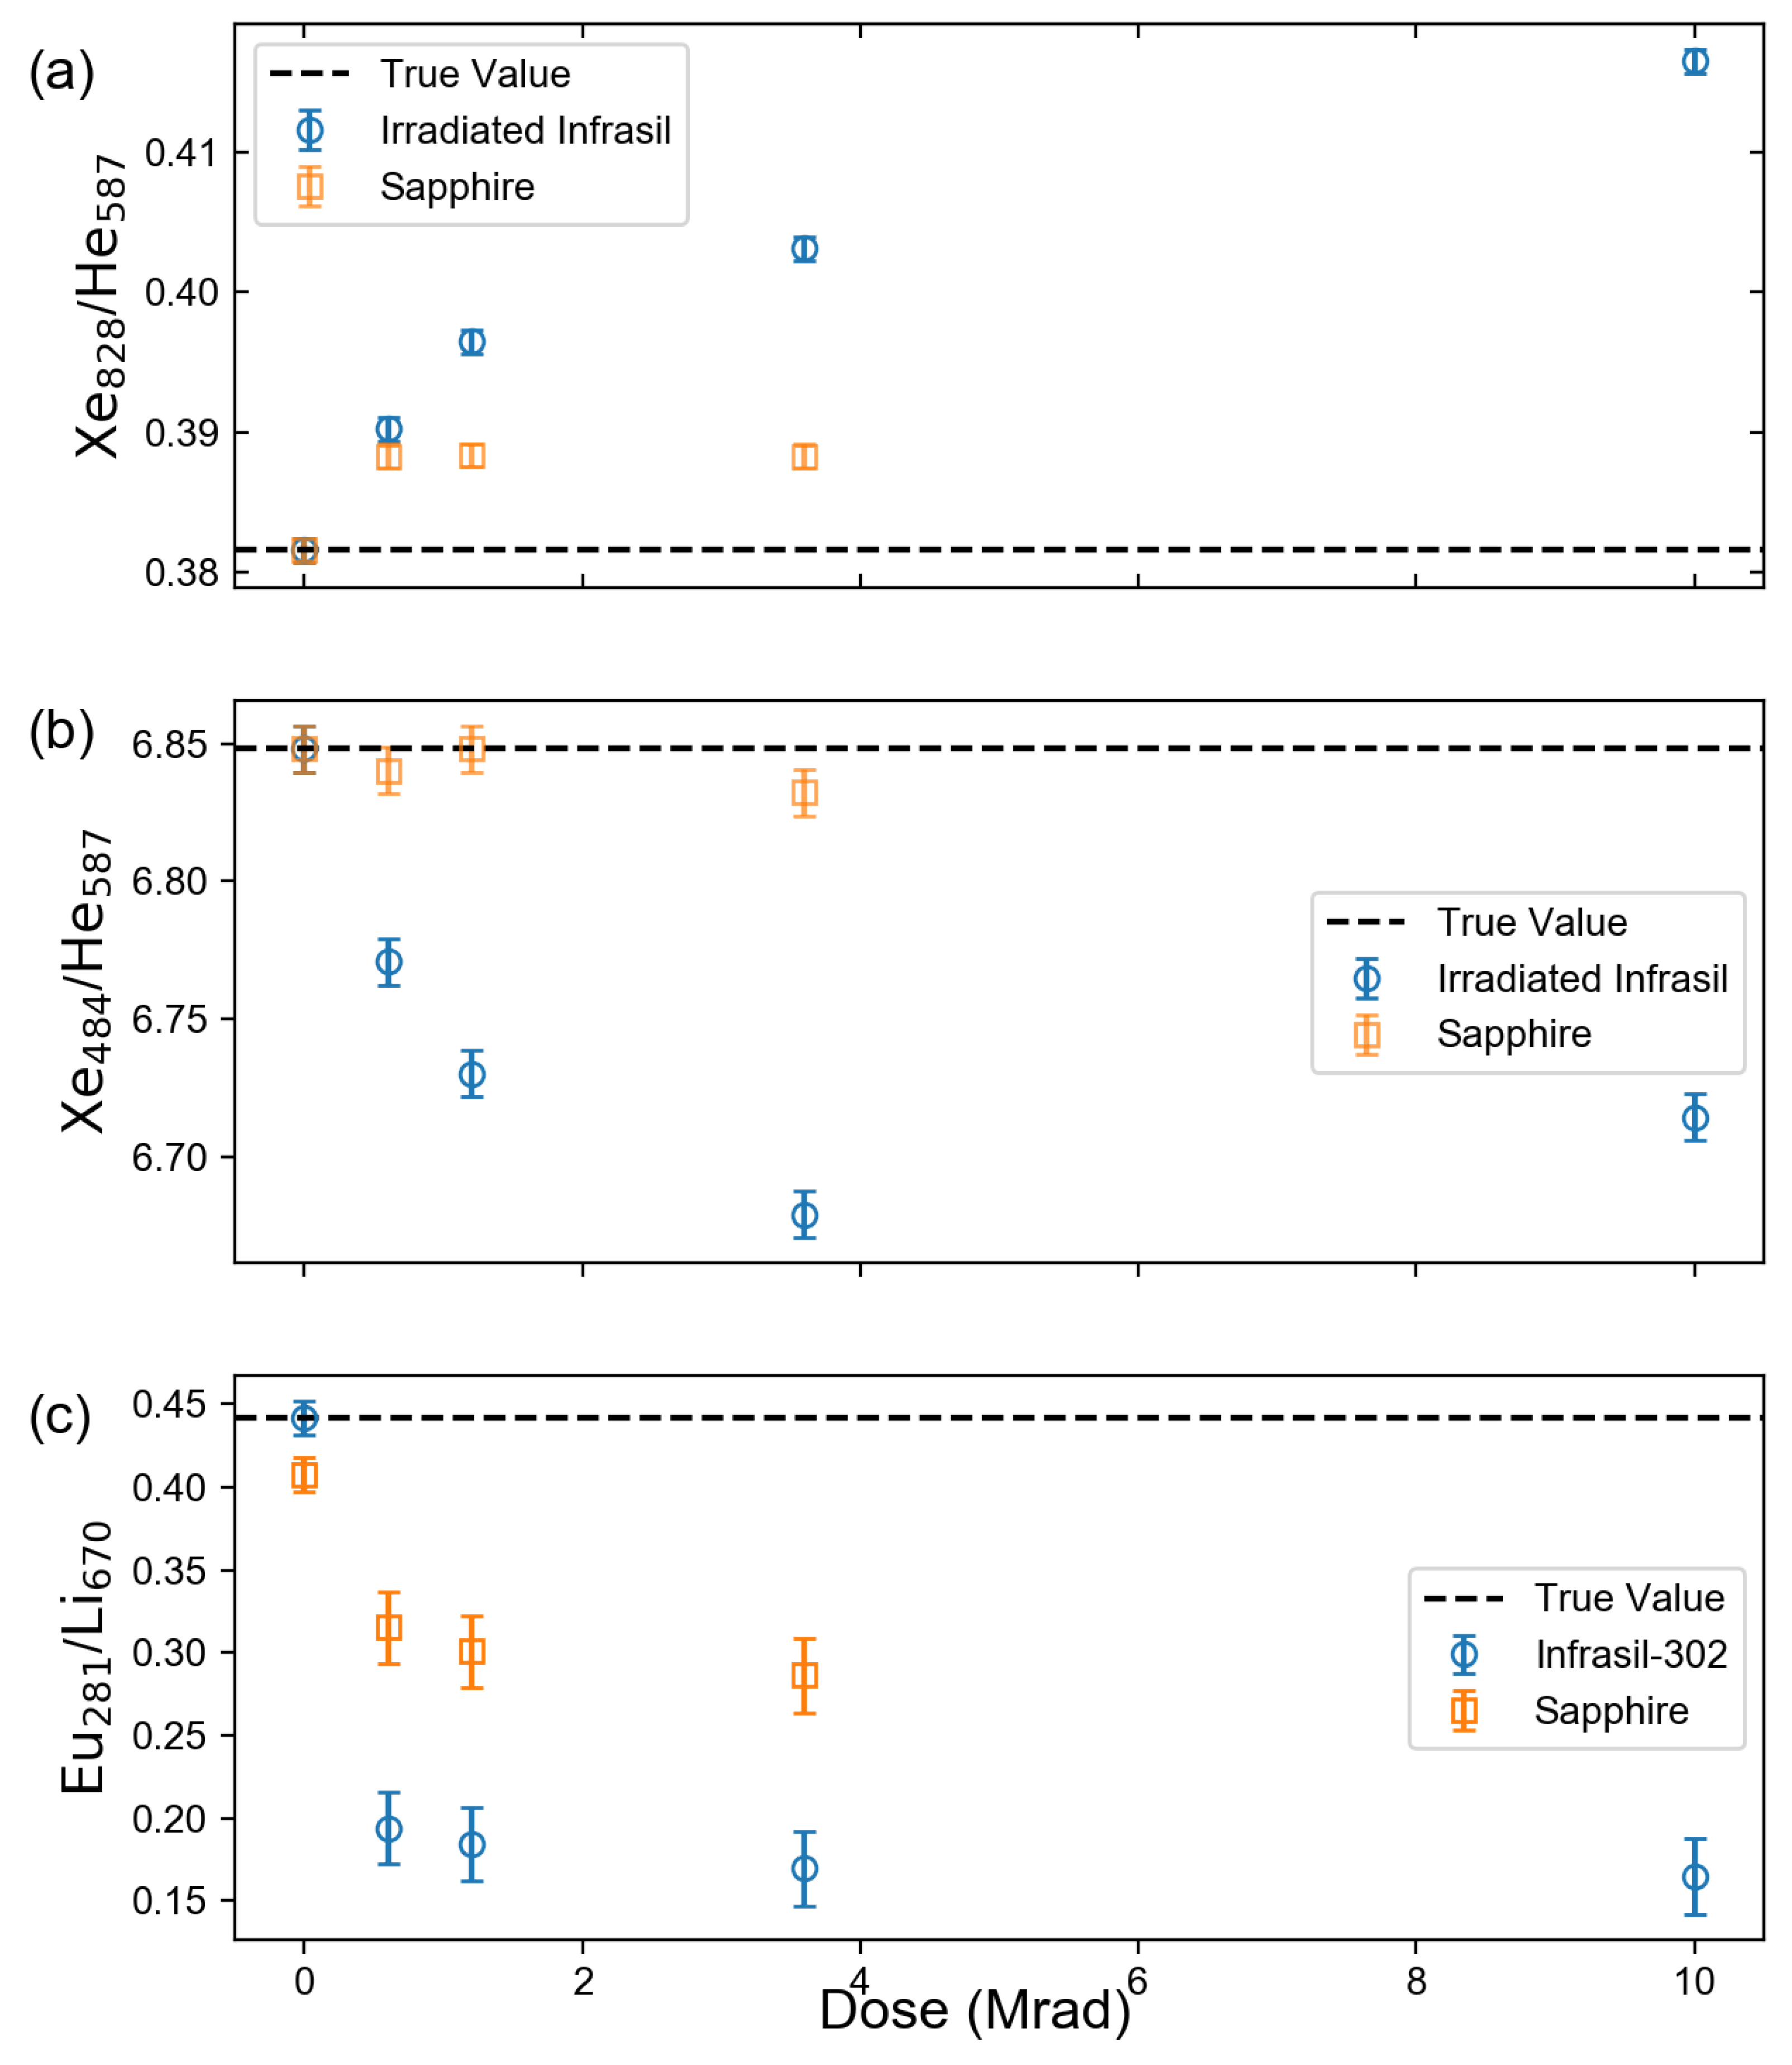
| Sample | Fluence (n/cm2) | I828/I587 | I484/I587 | I281/I670 |
|---|---|---|---|---|
| Infrasil-302 | 0 (Unirradiated) | 0.382 ± 0.0008 | 6.74 ± 0.008 | 0.571 ± 0.01 |
| 3.4 × 10¹⁶ | 0.497 ± 0.0008 | 7.24 ± 0.009 | 0.248 ± 0.008 | |
| 1.7 × 10¹⁷ | 1.45 ± 0.0009 | 9.46 ± 0.009 | 0.123 ± 0.004 | |
| Sapphire | 0 (Unirradiated) | 0.382 ± 0.0008 | 6.84 ± 0.008 | 0.513 ± 0.01 |
| 3.4 × 10¹⁶ | 0.509 ± 0.0008 | 6.51 ± 0.007 | 0.340 ± 0.009 | |
| 1.7 × 10¹⁷ | 6.93 ± 0.007 | 4.57 ± 0.009 | 0.129 ± 0.004 |
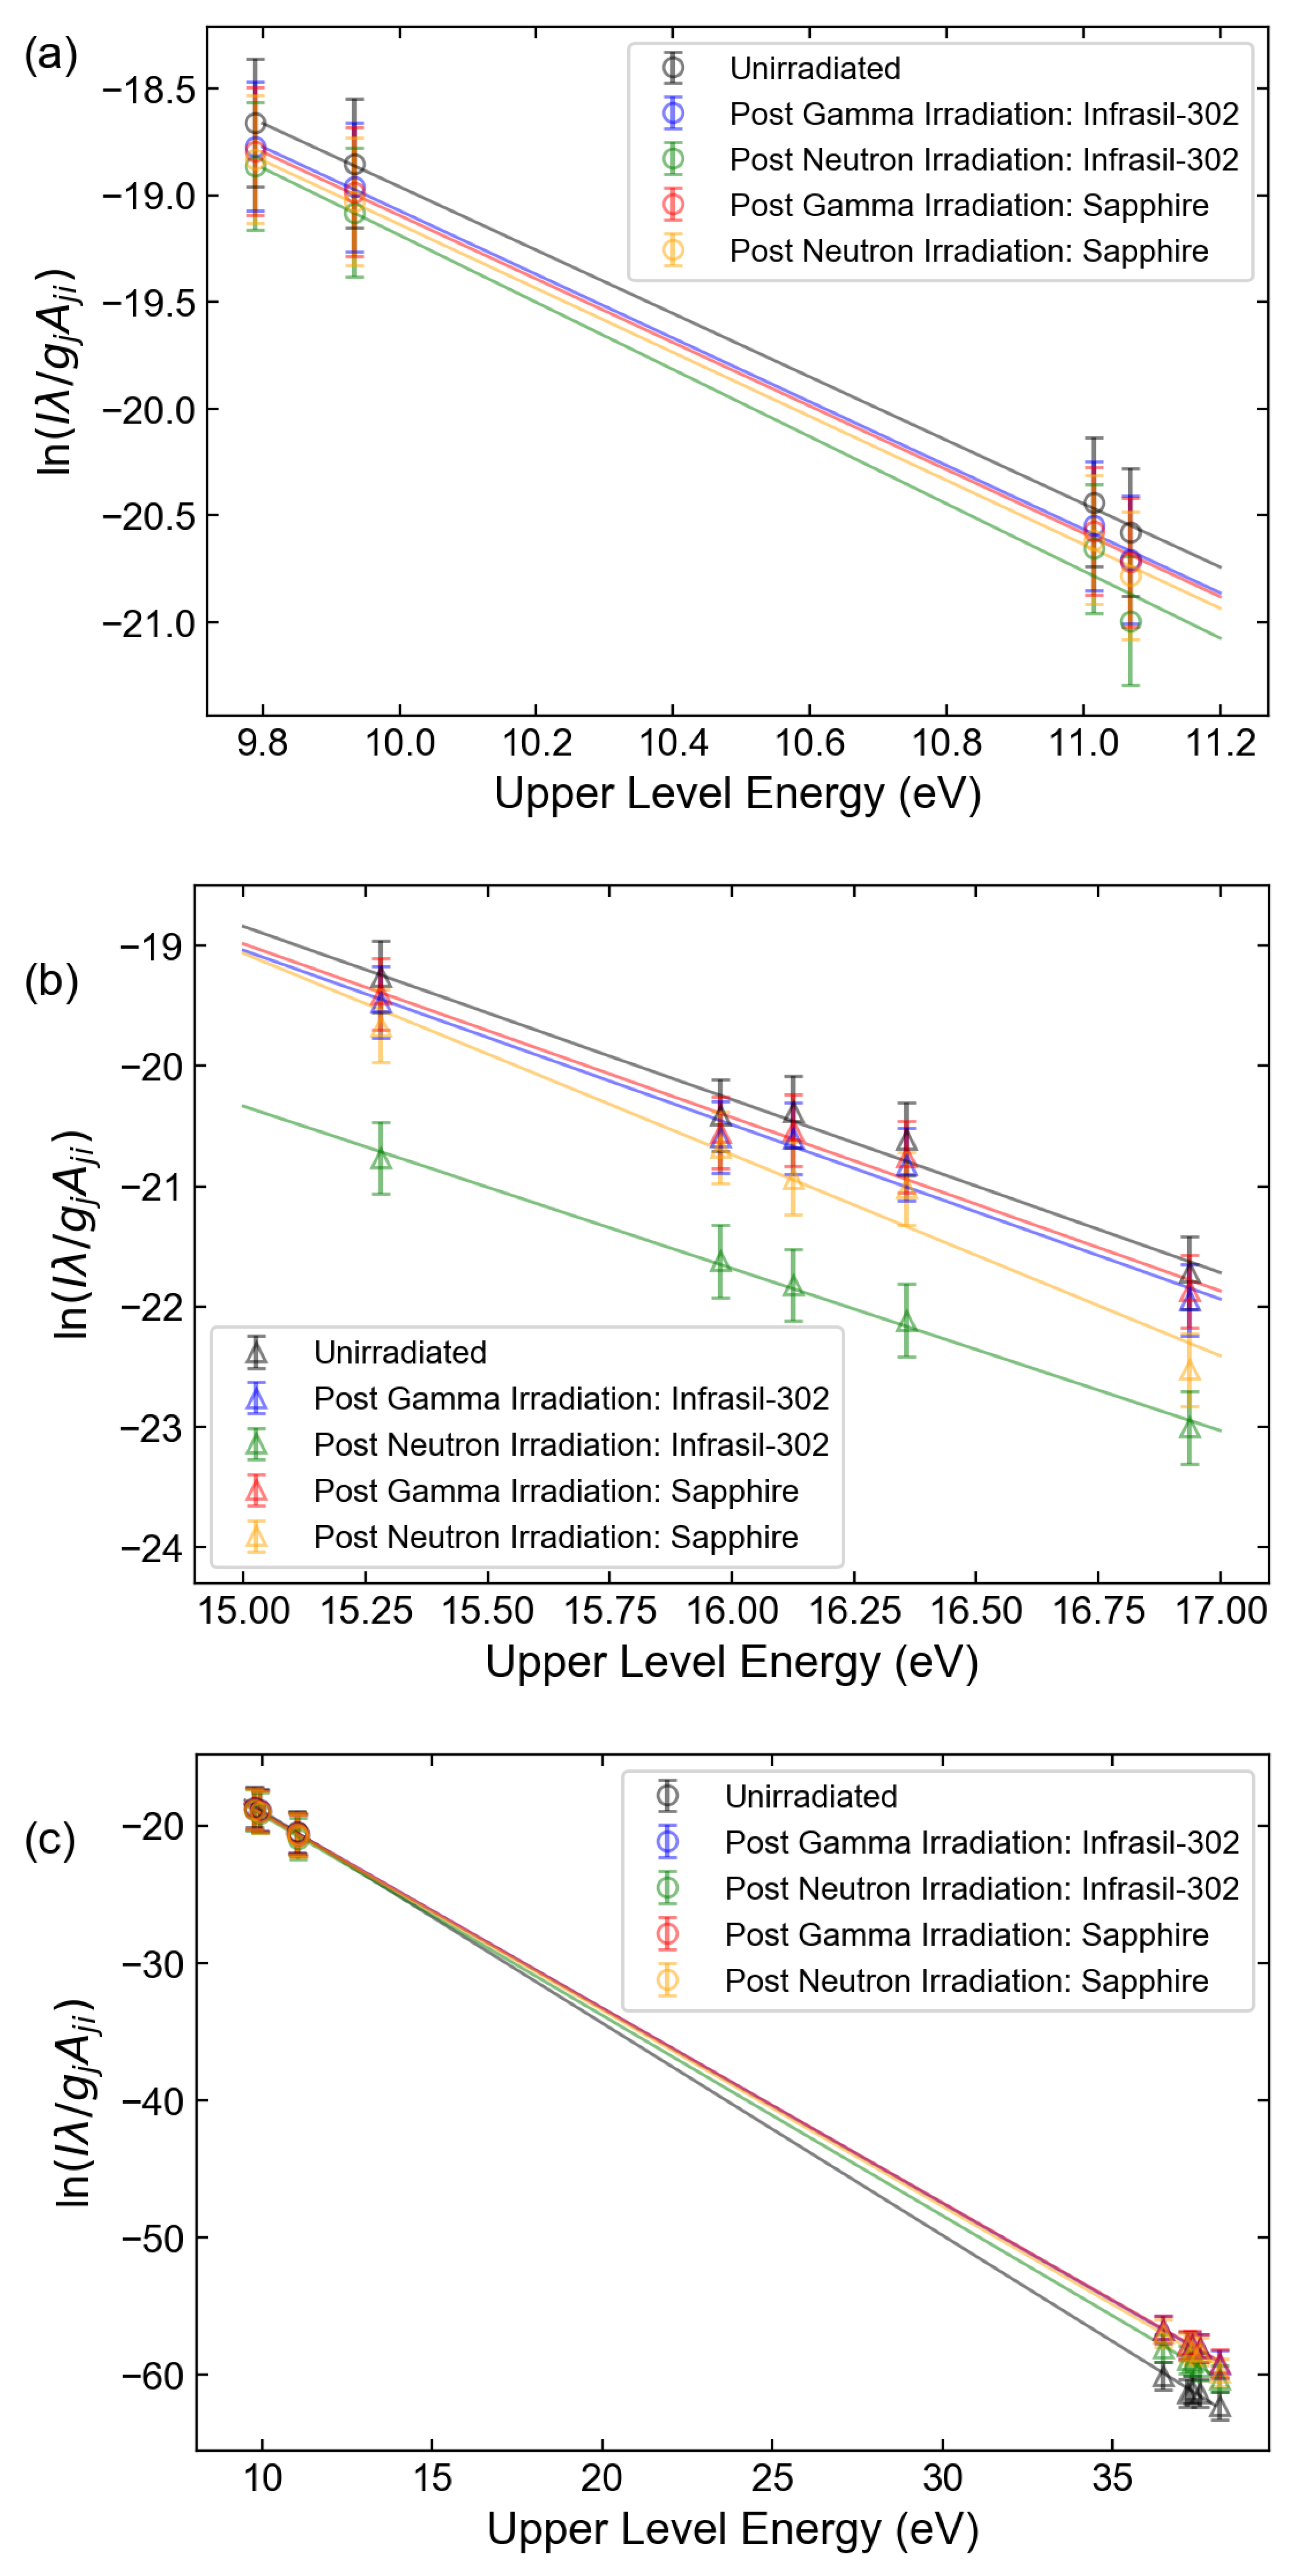
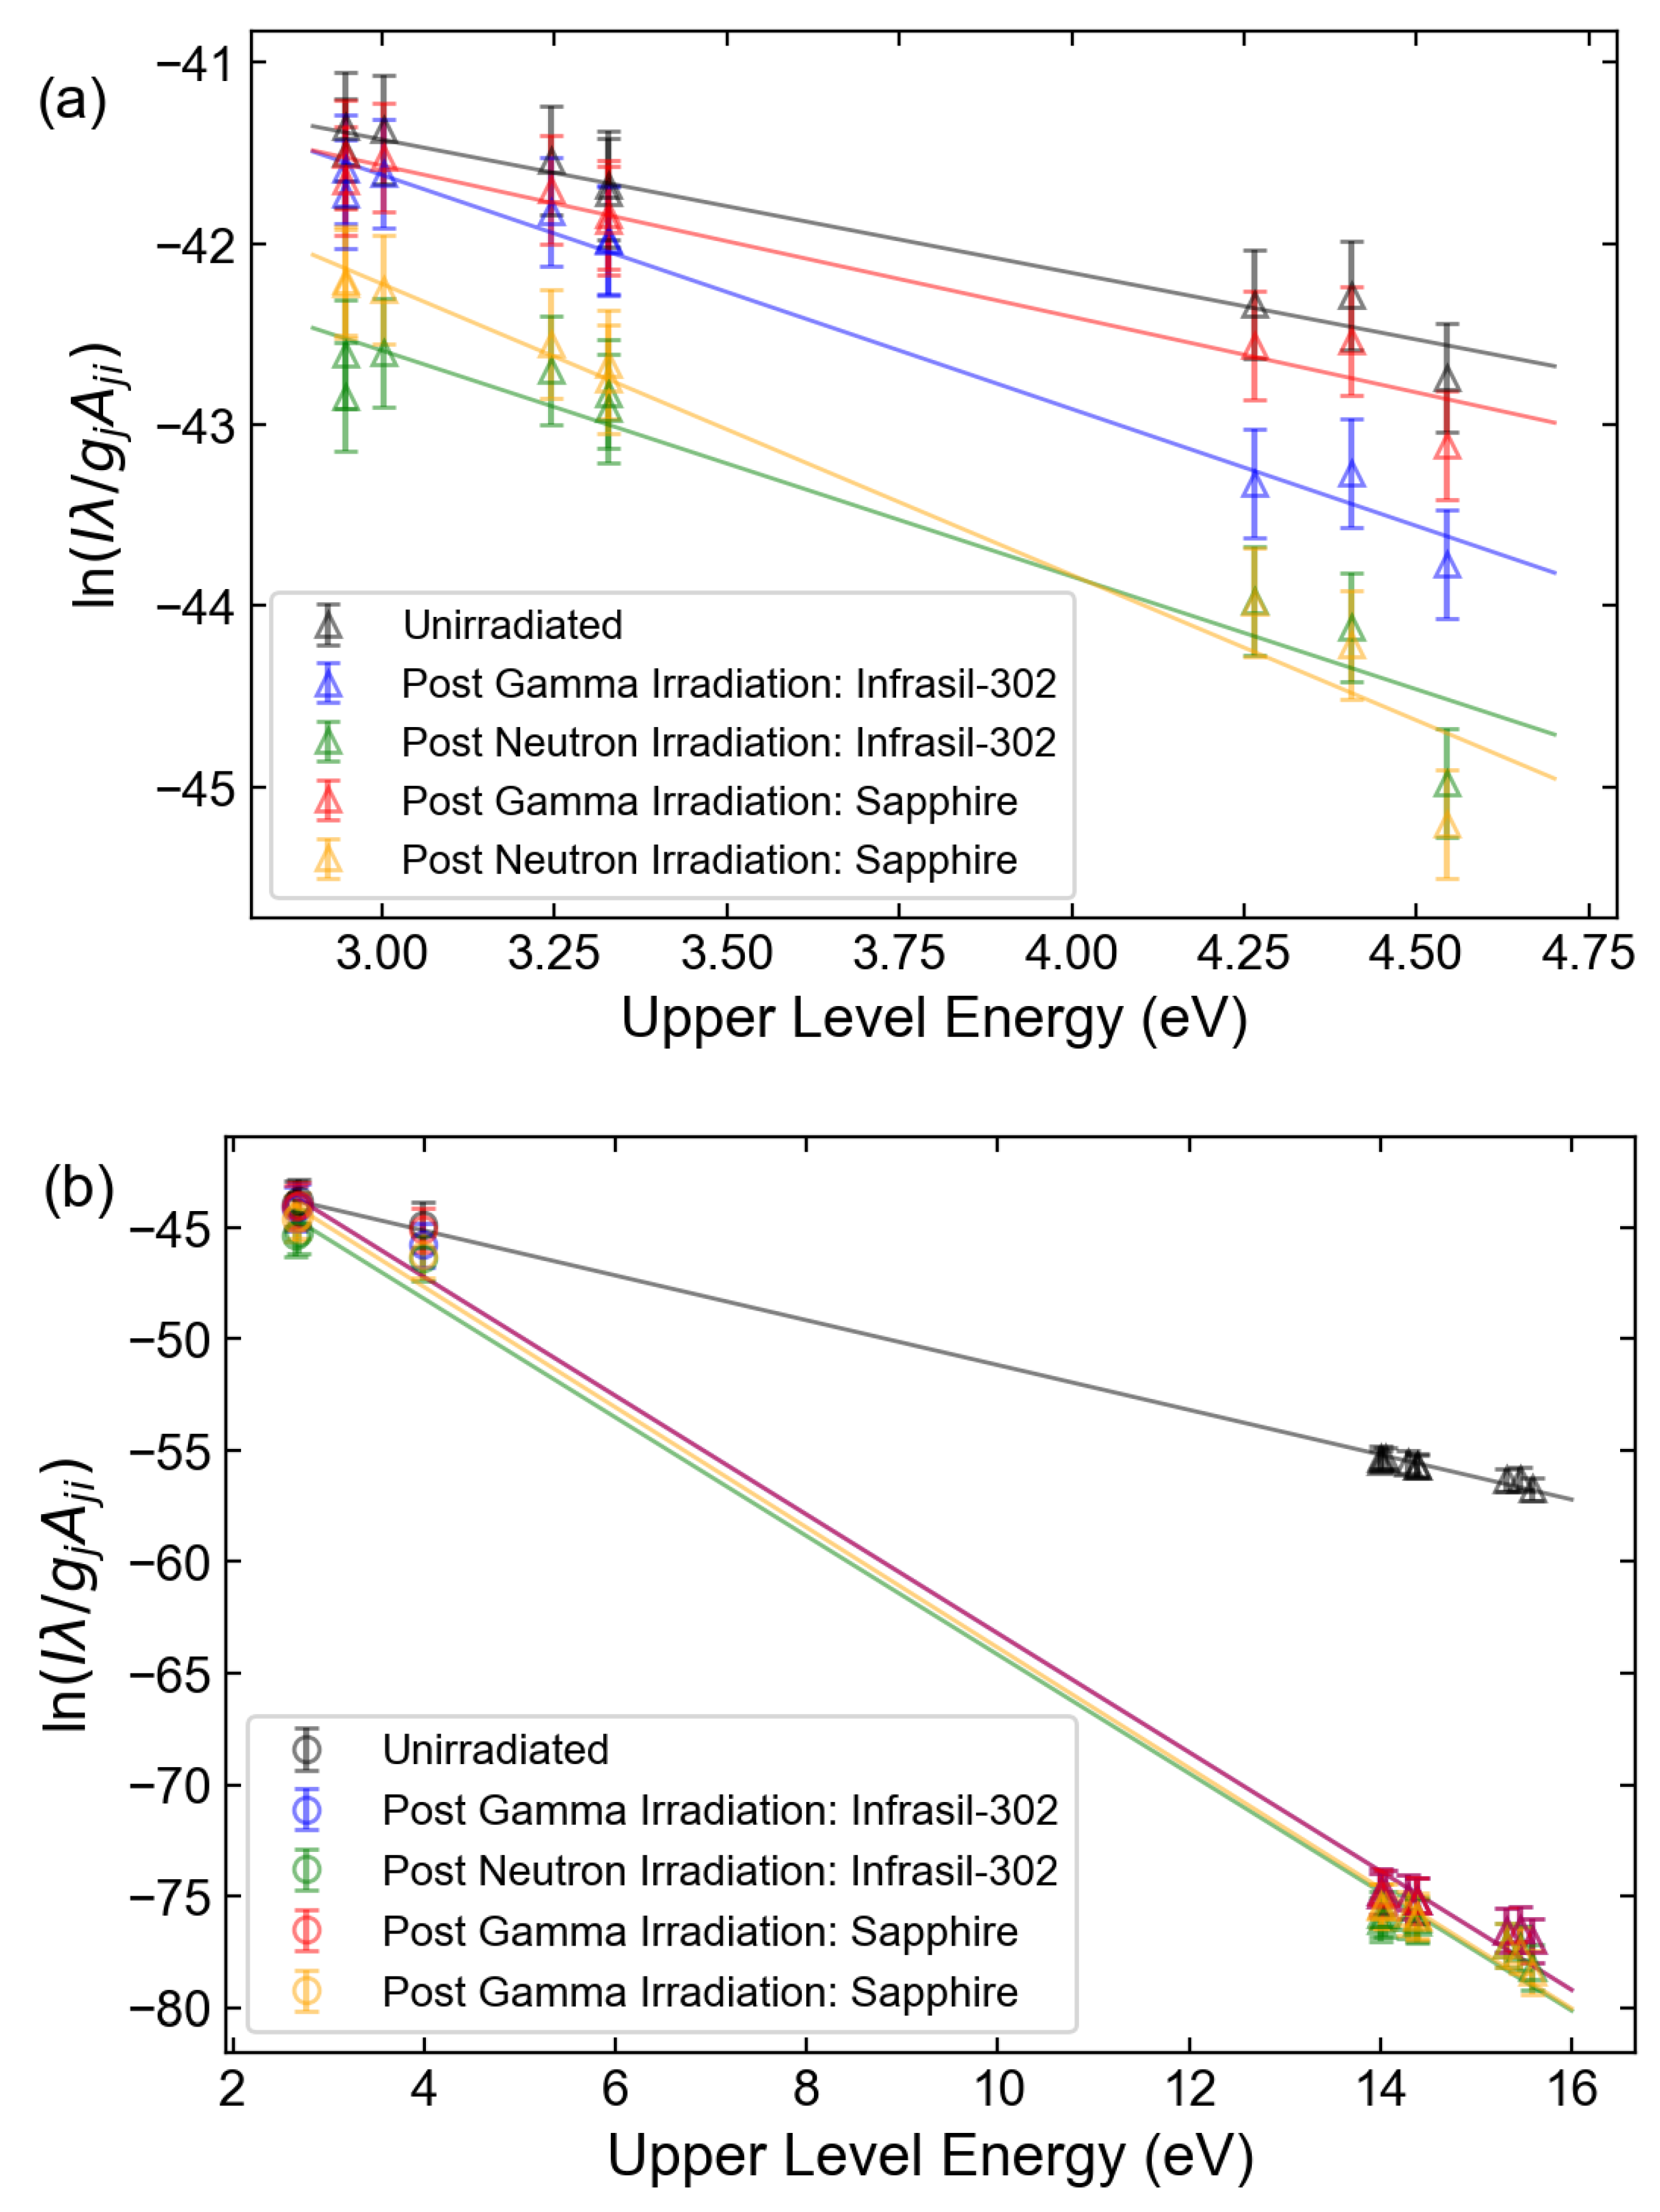
| Species | Wavelength | Einstein Coeff. | Lower Level | Upper Level | ||
|---|---|---|---|---|---|---|
| (nm) | () | Degeneracy | Energy (eV) | Degeneracy | Energy (eV) | |
| Xe I | 764.202 | 2.1 | 1 | 9.4472 | 3 | 11.0691 |
| 828.012 | 3.69 | 3 | 8.4365 | 1 | 9.9335 | |
| 834.682 | 4.2 | 3 | 9.5697 | 5 | 11.0547 | |
| 840.919 | 0.306 | 5 | 8.3153 | 3 | 9.7893 | |
| Xe II | 433.052 | 14 | 6 | 14.0737 | 8 | 16.9360 |
| 484.433 | 11 | 6 | 11.5390 | 8 | 14.0977 | |
| 487.650 | 6.3 | 6 | 13.5841 | 8 | 16.1259 | |
| 526.044 | 2.2 | 2 | 12.9254 | 4 | 15.2816 | |
| 526.195 | 8.5 | 4 | 14.0009 | 4 | 16.3565 | |
| 627.082 | 1.8 | 4 | 14.0009 | 6 | 15.9775 | |
| Eu I | 311.143 | 3.3 | 8 | 0.0000 | 10 | 3.9836 |
| 462.720 | 15.6 | 8 | 0.0000 | 8 | 2.6787 | |
| 466.188 | 15.2 | 8 | 0.0000 | 6 | 2.6588 | |
| Eu II | 272.778 | 6.5 | 9 | 0.0000 | 11 | 4.5439 |
| 281.393 | 5.5 | 9 | 0.0000 | 9 | 4.4048 | |
| 290.668 | 4.1 | 9 | 0.0000 | 7 | 4.2643 | |
| 372.490 | 4.5 | 9 | 0.0000 | 9 | 3.3276 | |
| 381.967 | 12.7 | 9 | 0.0000 | 11 | 3.2450 | |
| 397.190 | 8.9 | 7 | 0.2070 | 9 | 3.3276 | |
| 412.770 | 6.8 | 9 | 0.0000 | 9 | 3.0014 | |
| 420.505 | 7.1 | 9 | 0.0000 | 7 | 2.9476 | |
| 452.257 | 0.99 | 7 | 0.2070 | 7 | 2.9476 | |
| Method | Irradiation Condition | Temperature (K) | R2 |
|---|---|---|---|
| Xe I Boltzmann | Unirradiated | 7810 ± 390 | 0.9993 |
| Infrasil Irradiation | 7770 ± 390 | 0.9990 | |
| Infrasil n Irradiation | 7370 ± 410 | 0.9909 | |
| Sapphire Irradiation | 7800 ± 390 | 0.9992 | |
| Sapphire n Irradiation | 7740 ± 400 | 0.9987 | |
| Xe II Boltzmann | Unirradiated | 8000 ± 610 | 0.9779 |
| Infrasil Irradiation | 8000 ± 850 | 0.9755 | |
| Infrasil n Irradiation | 8600 ± 890 | 0.9960 | |
| Sapphire Irradiation | 8000 ± 840 | 0.9759 | |
| Sapphire n Irradiation | 6900 ± 880 | 0.9603 | |
| Eu II Boltzmann | Unirradiated | 15800 ± 400 | 0.9551 |
| Infrasil Irradiation | 8900 ± 400 | 0.9813 | |
| Infrasil n Irradiation | 9300 ± 600 | 0.9164 | |
| Sapphire Irradiation | 13900 ± 400 | 0.9473 | |
| Sapphire n Irradiation | 7200 ± 800 | 0.9557 | |
| Xe Saha-Boltzmann | Unirradiated | 7900 ± 350 | 0.9983 |
| Infrasil Irradiation | 8100 ± 460 | 0.9981 | |
| Infrasil n Irradiation | 7660 ± 500 | 0.9978 | |
| Sapphire Irradiation | 8000 ± 410 | 0.9981 | |
| Sapphire n Irradiation | 8100 ± 490 | 0.9981 | |
| Eu Saha-Boltzmann | Unirradiated | 15200 ± 400 | 0.9986 |
| Infrasil Irradiation | 4400 ± 500 | 0.9958 | |
| Infrasil n Irradiation | 4300 ± 400 | 0.9947 | |
| Sapphire Irradiation | 4400 ± 500 | 0.9926 | |
| Sapphire n Irradiation | 4300 ± 400 | 0.9969 |
Disclaimer/Publisher’s Note: The statements, opinions and data contained in all publications are solely those of the individual author(s) and contributor(s) and not of MDPI and/or the editor(s). MDPI and/or the editor(s) disclaim responsibility for any injury to people or property resulting from any ideas, methods, instructions or products referred to in the content. |
© 2023 by the authors. Licensee MDPI, Basel, Switzerland. This article is an open access article distributed under the terms and conditions of the Creative Commons Attribution (CC BY) license (https://creativecommons.org/licenses/by/4.0/).
Share and Cite
Garrett, L.J.; Morgan, B.W.; Burger, M.; Lee, Y.; Kim, H.; Sabharwall, P.; Choi, S.; Jovanovic, I. Impact of Glass Irradiation on Laser-Induced Breakdown Spectroscopy Data Analysis. Sensors 2023, 23, 691. https://doi.org/10.3390/s23020691
Garrett LJ, Morgan BW, Burger M, Lee Y, Kim H, Sabharwall P, Choi S, Jovanovic I. Impact of Glass Irradiation on Laser-Induced Breakdown Spectroscopy Data Analysis. Sensors. 2023; 23(2):691. https://doi.org/10.3390/s23020691
Chicago/Turabian StyleGarrett, Londrea J., Bryan W. Morgan, Miloš Burger, Yunu Lee, Hyeongbin Kim, Piyush Sabharwall, Sungyeol Choi, and Igor Jovanovic. 2023. "Impact of Glass Irradiation on Laser-Induced Breakdown Spectroscopy Data Analysis" Sensors 23, no. 2: 691. https://doi.org/10.3390/s23020691