

SSA Net: Small Scale-Aware Enhancement Network for Human Pose Estimation

Abstract
:1. Introduction
- This article proposes a new network structure SSA Net, the most important feature of this network is that it focuses on the performance of small-scale persons and solves the problem of unbalanced scale perception of mainstream models.
- This article proposes the TDAA module in SSA Net, which can effectively improve the expression ability of small-scale person features and thus improve the prediction accuracy of small-scale persons.
- This article proposes a coordinate vector regression method, which is better than the heatmap method in terms of both prediction accuracy and speed for small-scale persons.
- SSA Net achieves significant performance improvements over mainstream heatmap methods on the COCO Validation and COCO test dev datasets, as well as competitive results on the MPII Validation dataset.
2. Related Work
2.1. Regression Based Methods
2.2. 2D Heatmap-Based Methods
2.3. Heatmap Limits Small-Scale Persons
2.4. 1D Vector Based Method
3. Proposed Method
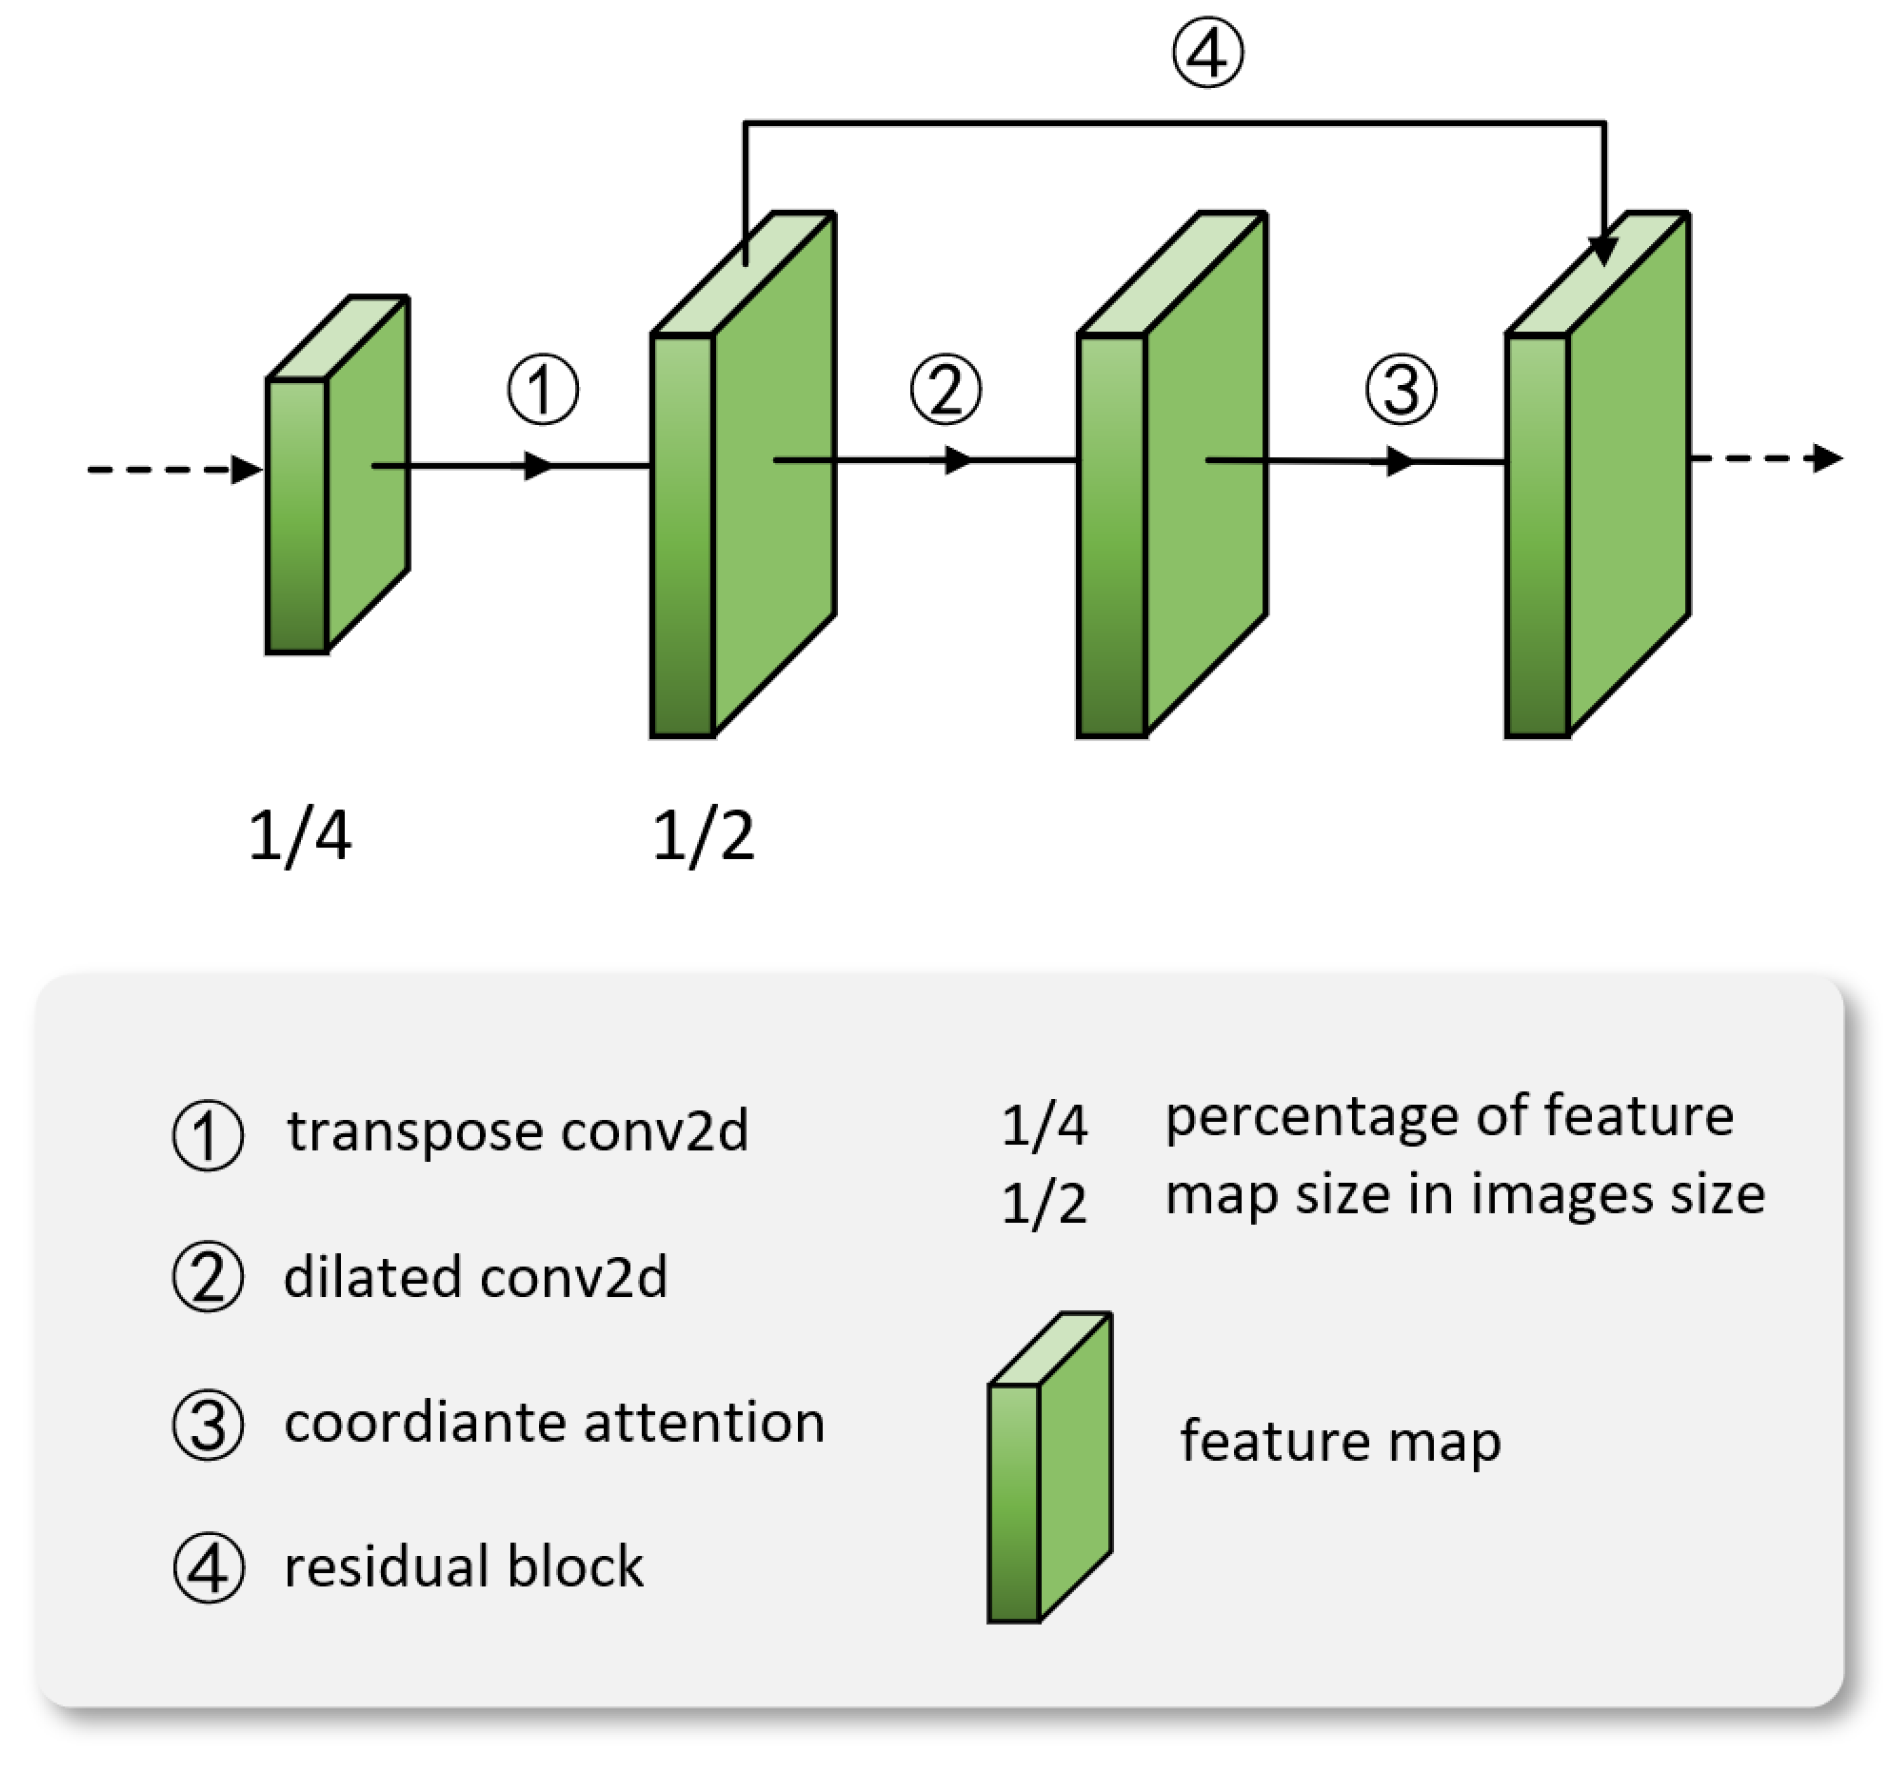
3.1. Feature Extractor
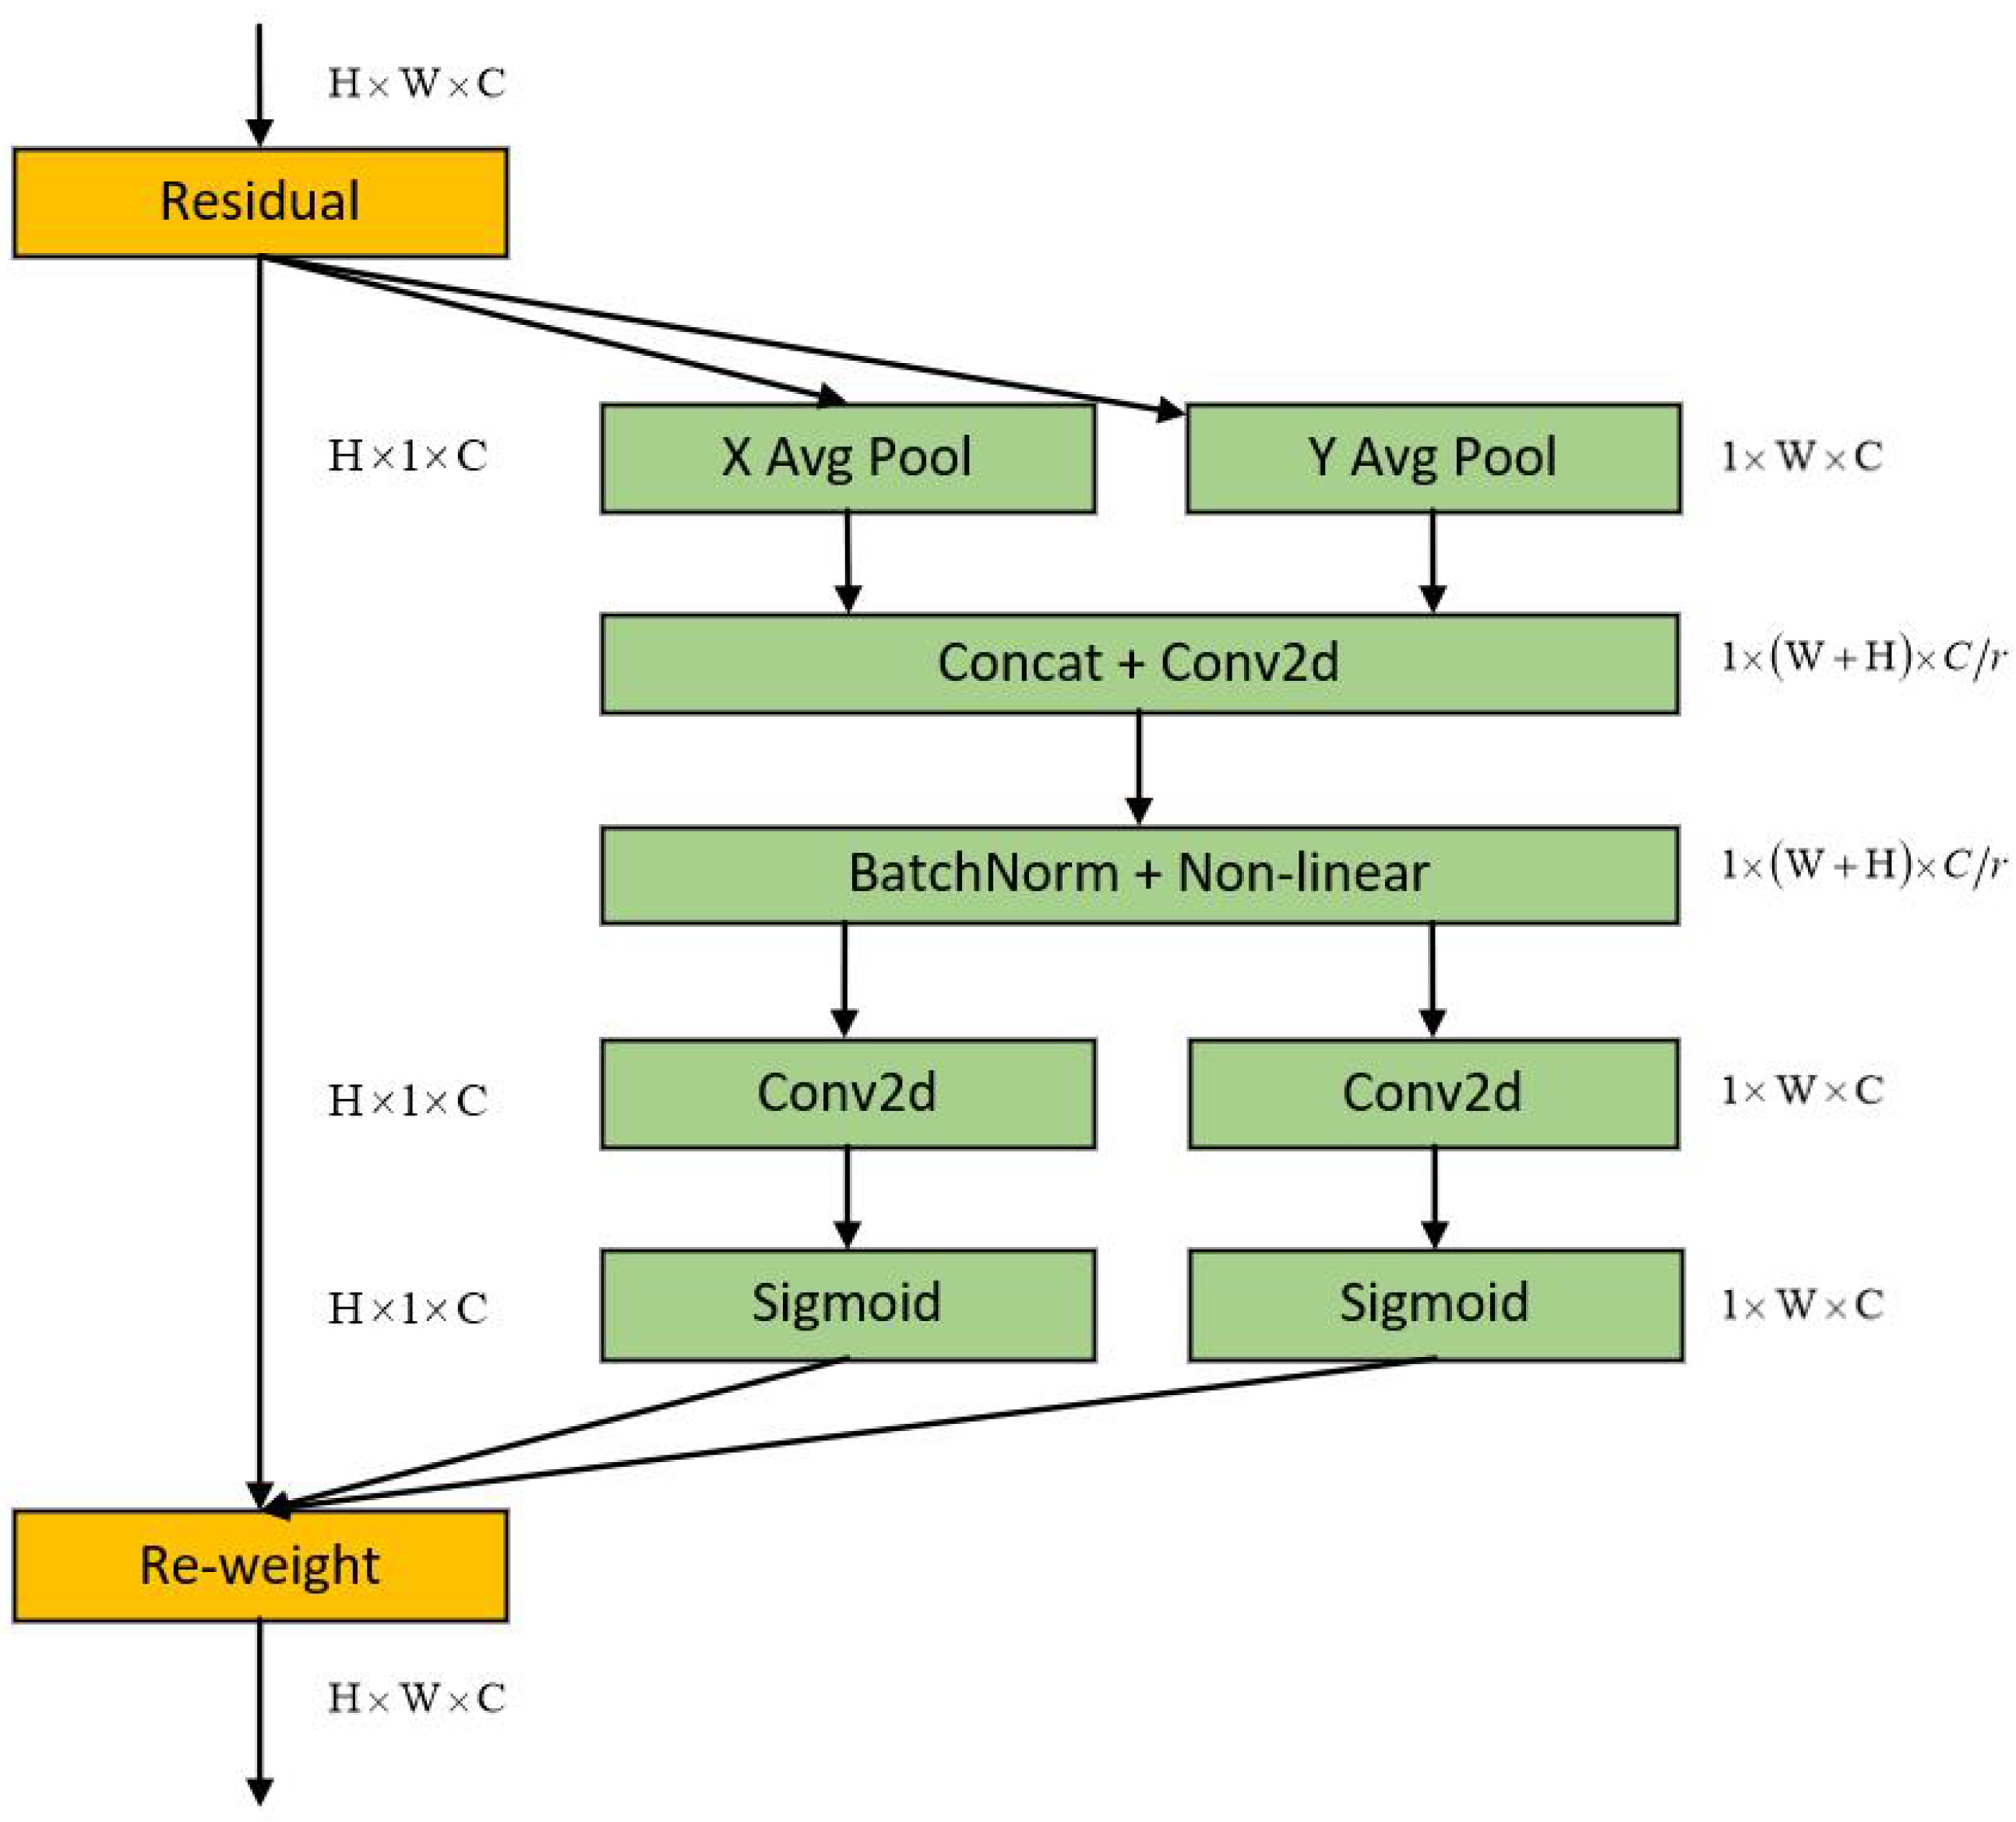
3.2. TDAA Module
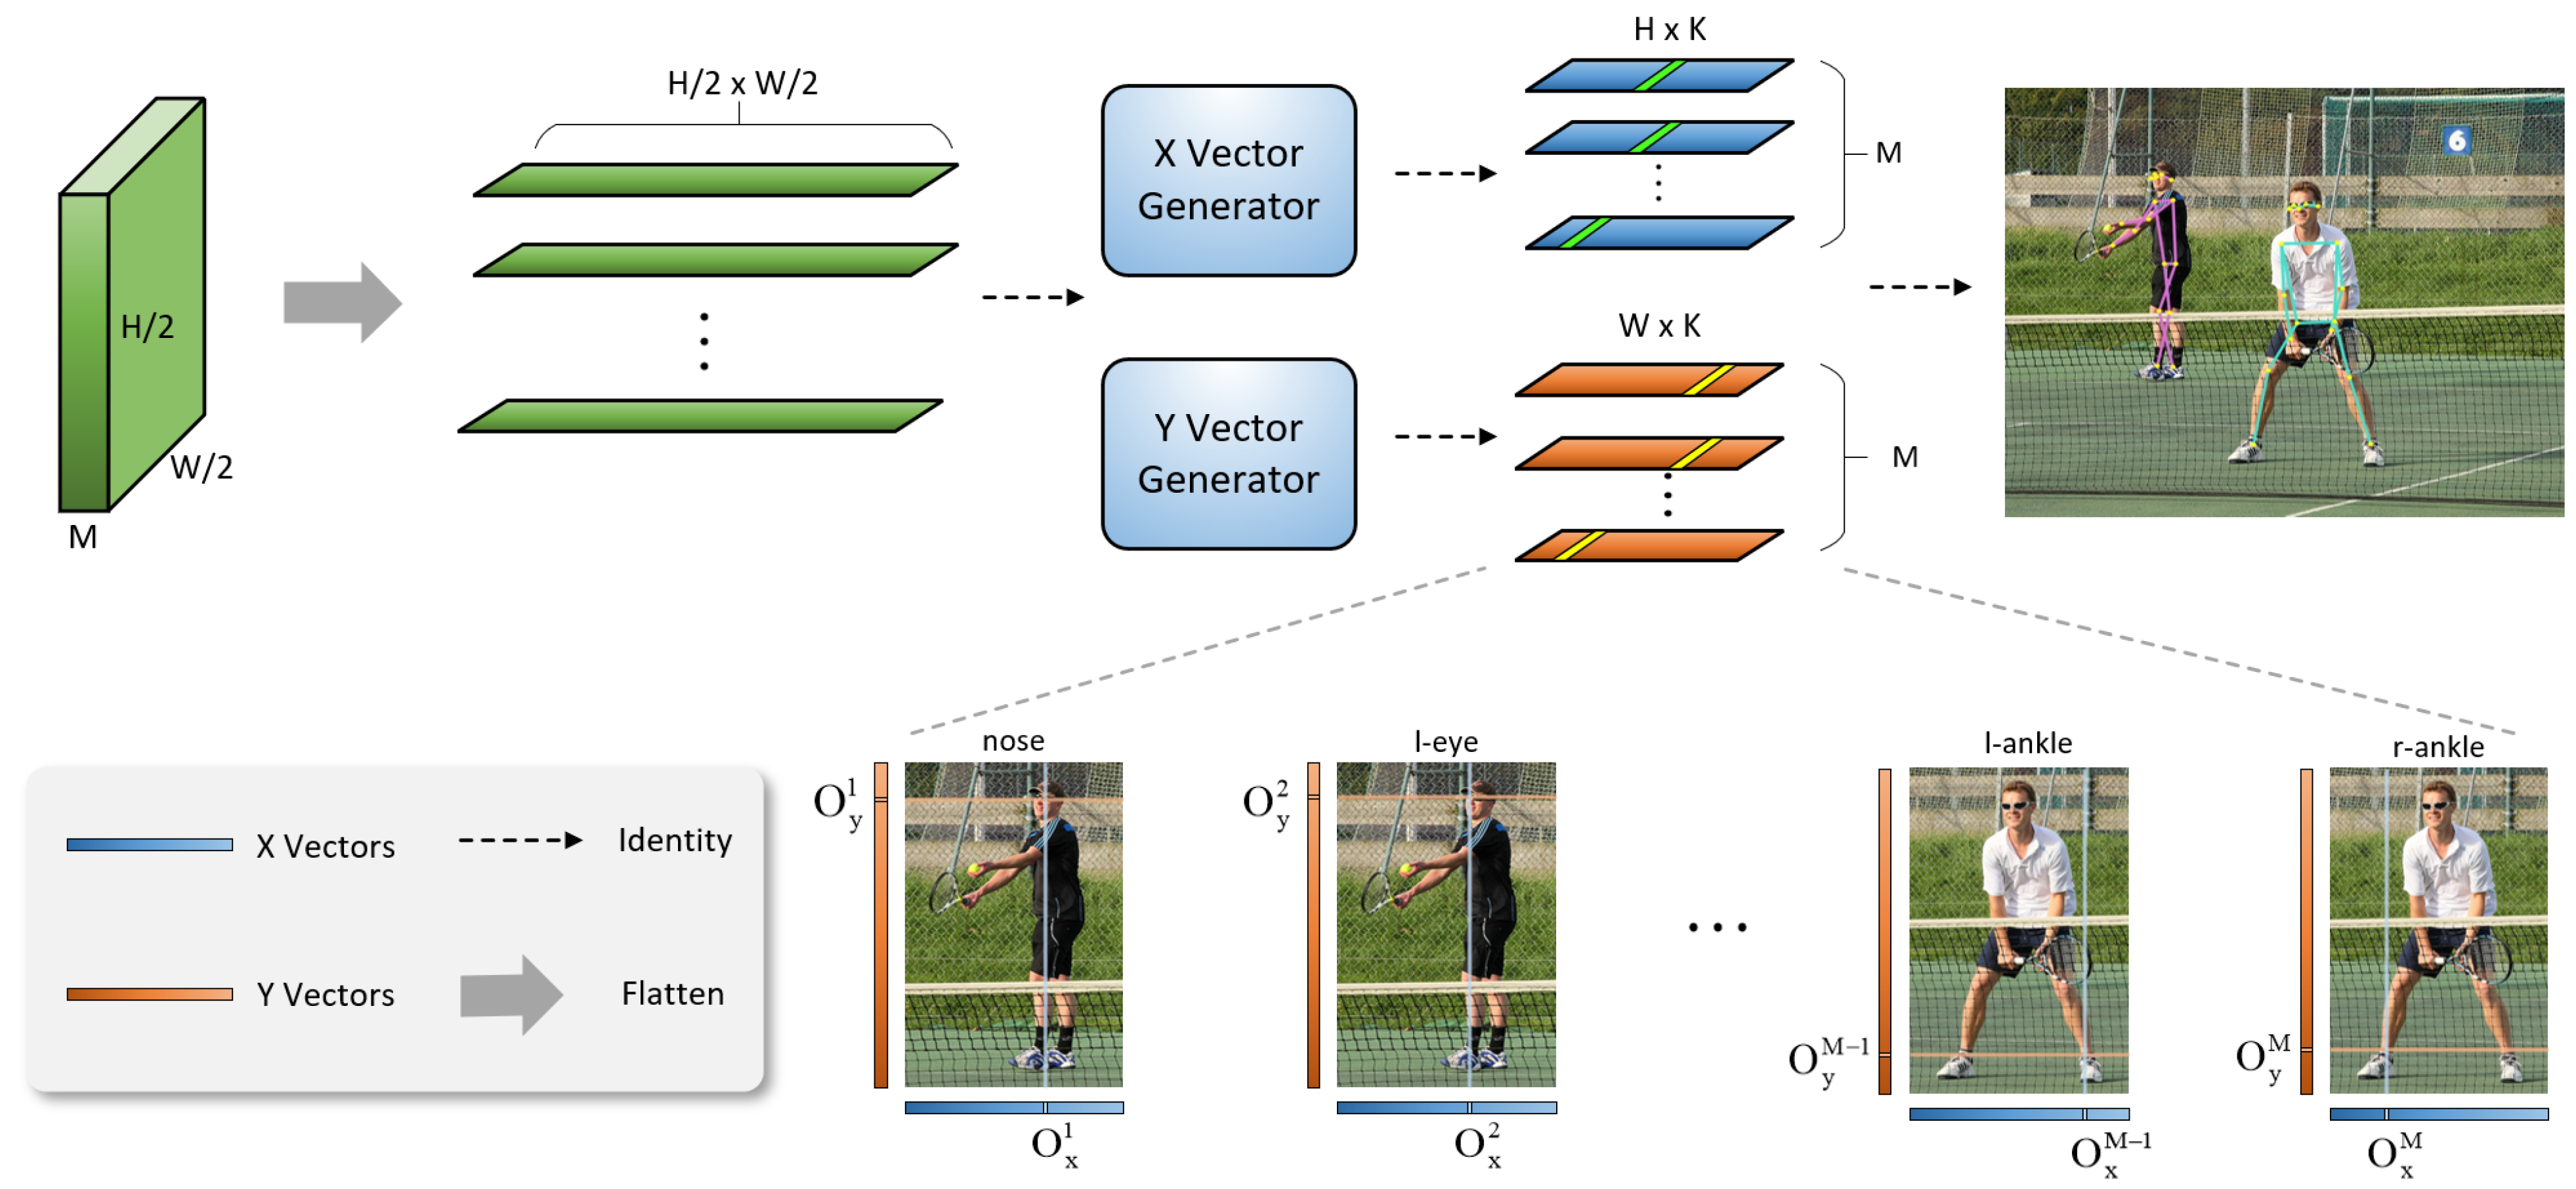
3.3. CVR Module
4. Experiments
4.1. Experimental Details
4.1.1. COCO Dataset
4.1.2. Tiny Validation Dataset
4.1.3. MPII Dataset
4.1.4. Experimental Environment
4.2. Experimental Results
4.2.1. Results on Tiny Validation Dataset
4.2.2. Results on COCO Validation Dataset
4.2.3. Results on COCO Test Dev Dataset
4.2.4. Results on MPII Dataset
4.2.5. Qualitative Experimental Results
4.3. Ablation Experiments
4.3.1. Ablation Experiment of TDAA Module
4.3.2. Ablation Experiment of TDAA and CVR Module
4.3.3. Ablation Experiment of CVR Module
5. Conclusions
Author Contributions
Funding
Institutional Review Board Statement
Informed Consent Statement
Data Availability Statement
Conflicts of Interest
References
- Pham, H.H.; Salmane, H.; Khoudour, L.; Crouzil, A.; Velastin, S.A.; Zegers, P. A Unified Deep Framework for Joint 3D Pose Estimation and Action Recognition from a Single RGB Camera. Sensors 2020, 20, 1825. [Google Scholar] [CrossRef] [PubMed]
- Neili Boualia, S.; Essoukri Ben Amara, N. Deep Full-Body HPE for Activity Recognition from RGB Frames Only. Informatics 2021, 8, 2. [Google Scholar] [CrossRef]
- Lin, F.-C.; Ngo, H.-H.; Dow, C.-R.; Lam, K.-H.; Le, H.L. Student Behavior Recognition System for the Classroom Environment Based on Skeleton Pose Estimation and Person Detection. Sensors 2021, 21, 5314. [Google Scholar] [CrossRef] [PubMed]
- Patil, A.K.; Balasubramanyam, A.; Ryu, J.Y.; Chakravarthi, B.; Chai, Y.H. An Open-Source Platform for Human Pose Estimation and Tracking Using a Heterogeneous Multi-Sensor System. Sensors 2021, 21, 2340. [Google Scholar] [CrossRef] [PubMed]
- Kim, M.; Lee, S. Fusion Poser: 3D Human Pose Estimation Using Sparse IMUs and Head Trackers in Real Time. Sensors 2022, 22, 4846. [Google Scholar] [CrossRef] [PubMed]
- Guidolin, M.; Menegatti, E.; Reggiani, M. UNIPD-BPE: Synchronized RGB-D and Inertial Data for Multimodal Body Pose Estimation and Tracking. Data 2022, 7, 79. [Google Scholar] [CrossRef]
- Shao, M.Y.; Vagg, T.; Seibold, M.; Doughty, M. Towards a Low-Cost Monitor-Based Augmented Reality Training Platform for At-Home Ultrasound Skill Development. J. Imaging 2022, 8, 305. [Google Scholar] [CrossRef] [PubMed]
- Basiratzadeh, S.; Lemaire, E.D.; Baddour, N. A Novel Augmented Reality Mobile-Based Application for Biomechanical Measurement. BioMed 2022, 2, 255–269. [Google Scholar] [CrossRef]
- Park, Y.J.; Ro, H.; Lee, N.K.; Han, T.-D. Deep-cARe: Projection-Based Home Care Augmented Reality System with Deep Learning for Elderly. Appl. Sci. 2019, 9, 3897. [Google Scholar] [CrossRef]
- Li, Y.; Yang, S.; Liu, P.; Zhang, S.; Wang, Y.; Wang, Z. SimCC: A Simple Coordinate Classification Perspective for Human Pose Estimation. In Proceedings of the Computer Vision–ECCV 2022: 17th European Conference, Tel Aviv, Israel, 23–27 October 2022; pp. 89–106. [Google Scholar]
- Hou, Q.; Zhou, D.; Feng, J. Coordinate attention for efficient mobile network design. In Proceedings of the IEEE/CVF Conference on Computer Vision and Pattern Recognition, Online, 19–25 June 2021; pp. 13713–13722. [Google Scholar]
- Toshev, A.; Szegedy, C. Deeppose: Human pose estimation via deep neural networks. In Proceedings of the IEEE/CVF Conference on Computer Vision and Pattern Recognition, Columbus, OH, USA, 23–28 June 2014; pp. 1653–1660. [Google Scholar]
- Li, S.; Zhang, H.; Ma, H.; Feng, J.; Jiang, M. CSIT: Channel Spatial Integrated Transformer for human pose estimation. IET Image Process. 2023, 17, 3002–3011. [Google Scholar] [CrossRef]
- Tian, Z.; Chen, H.; Shen, C. Directpose: Direct end-to-end multi-person pose estimation. arXiv 2019, arXiv:1911.07451. [Google Scholar]
- Sun, X.; Xiao, B.; Wei, F.; Liang, S.; Wei, Y. Integral human pose regression. In Proceedings of the European Conference on Computer Vision, Munich, Germany, 8–14 September 2018; pp. 529–545. [Google Scholar]
- Sun, X.; Shang, J.; Liang, S.; Wei, Y. Compositional human pose regression. In Proceedings of the IEEE International Conference on Computer Vision, Venice, Italy, 22–29 October 2017; pp. 2602–2611. [Google Scholar]
- Nie, X.; Feng, J.; Zhang, J.; Yan, S. Single-stage multi-person pose machines. In Proceedings of the IEEE/CVF International Conference on Computer Vision, Seoul, Republic of Korea, 27 October–2 November 2019; pp. 6951–6960. [Google Scholar]
- Li, J.; Bian, S.; Zeng, A.; Wang, C.; Pang, B.; Liu, W.; Lu, C. Human pose regression with residual log-likelihood estimation. In Proceedings of the IEEE/CVF International Conference on Computer Vision, Montreal, ON, Canada, 10–17 October 2021; pp. 11025–11034. [Google Scholar]
- Andriluka, M.; Pishchulin, L.; Gehler, P.; Schiele, B. 2d human pose estimation: New benchmark and state of the art analysis. In Proceedings of the IEEE Conference on computer Vision and Pattern Recognition, Columbus, OH, USA, 23–28 June 2014; pp. 3686–3693. [Google Scholar]
- Zhang, F.; Zhu, X.; Ye, M. Fast human pose estimation. In Proceedings of the IEEE/CVF conference on computer vision and pattern recognition, Long Beach, CA, USA, 16–20 June 2019; pp. 3517–3526. [Google Scholar]
- Zhang, F.; Zhu, X.; Dai, H.; Ye, M.; Zhu, C. Distribution-aware coordinate representation for human pose estimation. In Proceedings of the IEEE Conference on Computer Vision and Pattern Recognition, Seattle, WA, USA, 14–19 June 2020; pp. 7093–7102. [Google Scholar]
- Li, W.; Wang, Z.; Yin, B.; Peng, Q.; Du, Y.; Xiao, T.; Sun, J. Rethinking on multi-stage networks for human pose estimation. arXiv 2019, arXiv:1901.00148. [Google Scholar]
- Cai, Y.; Wang, Z.; Luo, Z.; Yin, B.; Du, A.; Wang, H.; Sun, J. Learning delicate local representations for multi-person pose estimation. In Proceedings of the Computer Vision–ECCV 2020: 16th European Conference, Glasgow, UK, 23–28 August 2020; pp. 455–472. [Google Scholar]
- Newell, A.; Yang, K.; Deng, J. Stacked hourglass networks for human pose estimation. In Proceedings of the Computer Vision–ECCV 2016: 14th European Conference, Amsterdam, The Netherlands, 11–14 October 2016; pp. 483–499. [Google Scholar]
- Sun, K.; Xiao, B.; Liu, D.; Wang, J. Deep high-resolution representation learning for human pose estimation. In Proceedings of the IEEE/CVF Conference on Computer Vision and Pattern Recognition, Long Beach, CA, USA, 16–20 June 2019; pp. 5693–5703. [Google Scholar]
- Xiao, B.; Wu, H.; Wei, Y. Simple baselines for human pose estimation and tracking. In Proceedings of the European Conference on Computer Vision, Munich, Germany, 8–14 September 2018; pp. 466–481. [Google Scholar]
- Yang, S.; Quan, Z.; Nie, M.; Yang, W. Transpose: Keypoint localization via transformer. In Proceedings of the IEEE/CVF International Conference on Computer Vision, Montreal, ON, Canada, 10–17 October 2021; pp. 11802–11812. [Google Scholar]
- Li, J.; Chen, T.; Shi, R.; Lou, Y.; Li, Y.L.; Lu, C. Transpose: Keypoint localization via transformer. Localization with sampling-argmax. In In Proceedings of the Advances in Neural Information Processing Systems, Online, 6–14 December 2021; Volume 34, pp. 27236–27248. [Google Scholar]
- Nibali, A.; He, Z.; Morgan, S.; Prendergast, L. Numerical coordinate regression with convolutional neural networks. arXiv 2018, arXiv:1801.07372. [Google Scholar]
- Tompson, J.J.; Jain, A.; LeCun, Y.; Bregler, C. Joint training of a convolutional network and a graphical model for human pose estimation. arXiv 2014. [Google Scholar] [CrossRef]
- Cheng, B.; Xiao, B.; Wang, J.; Shi, H.; Huang, T.S.; Zhang, L. Higherhrnet: Scale-aware representation learning for bottom-up human pose estimation. In Proceedings of the IEEE/CVF Conference on Computer Vision and Pattern Recognition, Seattle, MA, USA, 14–19 June 2020; pp. 5386–5395. [Google Scholar]
- Luo, Z.; Wang, Z.; Huang, Y.; Wang, L.; Tan, T.; Zhou, E. Rethinking the heatmap regression for bottom-up human pose estimation. In Proceedings of the IEEE/CVF Conference on Computer Vision and Pattern Recognition, Online, 19–25 June 2021; pp. 13264–13273. [Google Scholar]
- Geng, Z.; Sun, K.; Xiao, B.; Zhang, Z.; Wang, J. Bottom-up human pose estimation via disentangled keypoint regression. In Proceedings of the IEEE/CVF Conference on Computer Vision and Pattern Recognition, Online, 19–25 June 2021; pp. 14676–14686. [Google Scholar]
- Yin, S.; Wang, S.; Chen, X.; Chen, E.; Liang, C. Attentive one-dimensional heatmap regression for facial landmark detection and tracking. In Proceedings of the 28th ACM International Conference on Multimedia, Seattle, MA, USA, 12–16 October 2020; pp. 538–546. [Google Scholar]
- Xiong, Y.; Zhou, Z.; Dou, Y.; Su, Z. Gaussian vector: An efficient solution for facial landmark detection. In Proceedings of the Asian Conference on Computer Vision, Kyoto, Japan, 30 November–4 December 2020. [Google Scholar]
- Mao, W.; Ge, Y.; Shen, C.; Tian, Z.; Wang, X.; Wang, Z. Tfpose: Direct human pose estimation with transformers. arXiv 2021, arXiv:2103.15320. [Google Scholar]
- Li, K.; Wang, S.; Zhang, X.; Xu, Y.; Xu, W.; Tu, Z. Pose recognition with cascade transformers. In Proceedings of the IEEE/CVF Conference on Computer Vision and Pattern Recognition, Online, 19–25 June 2021; pp. 1944–1953. [Google Scholar]
- He, K.; Gkioxari, G.; Dollár, P.; Girshick, R. Mask r-cnn. In Proceedings of the IEEE International Conference on Computer Vision, Venice, Italy, 22–29 October 2017; pp. 2961–2969. [Google Scholar]
- Cao, Z.; Simon, T.; Wei, S.E.; Sheikh, Y. Realtime multi-person 2D pose estimation using part affinity fields. In Proceedings of the IEEE Conference on Computer Vision and Pattern Recognition, Honolulu, HI, USA, 21–26 July 2017; pp. 7291–7299. [Google Scholar]
- Papandreou, G.; Zhu, T.; Kanazawa, N.; Toshev, A.; Tompson, J.; Bregler, C.; Murphy, K. Towards accurate multi-person pose estimation in the wild. In Proceedings of the IEEE Conference on Computer Vision and Pattern Recognition, Venice, Italy, 22–29 October 2017; pp. 4903–4911. [Google Scholar]
- Newell, A.; Huang, Z.; Deng, J. Associative embedding: End-to-end learning for joint detection and grouping. In Proceedings of the Advances in Neural Information Processing Systems, Long Beach, CA, USA, 4–9 December 2017; Volume 30. [Google Scholar]
- Kocabas, M.; Karagoz, S.; Akbas, E. Multiposenet: Fast multi-person pose estimation using pose residual network. In Proceedings of the European Conference on Computer Vision, Munich, Germany, 8–14 September 2018; pp. 417–433. [Google Scholar]
- Fang, H.S.; Xie, S.; Tai, Y.W.; Lu, C. Rmpe: Regional multi-person pose estimation. In Proceedings of the IEEE International Conference on Computer Vision, Venice, Italy, 22–29 October 2017; pp. 2334–2343. [Google Scholar]
- Chen, Y.; Wang, Z.; Peng, Y.; Zhang, Z.; Yu, G.; Sun, J. Cascaded pyramid network for multi-person pose estimation. In Proceedings of the IEEE Conference on Computer Vision and Pattern Recognition, Salt Lake City, TX, USA, 18–22 June 2018; pp. 7103–7112. [Google Scholar]
- Huang, S.; Gong, M.; Tao, D. A coarse-fine network for keypoint localization. In Proceedings of the IEEE International Conference on Computer Vision, Venice, Italy, 22–29 October 2017; pp. 3028–3037. [Google Scholar]
- Zhou, X.; Wang, D.; Krähenbühl, P. Objects as points. arXiv 2019, arXiv:1904.07850. [Google Scholar]
- Wei, F.; Sun, X.; Li, H.; Wang, J.; Lin, S. Point-set anchors for object detection, instance segmentation and pose estimation. In Proceedings of the Computer Vision–ECCV2020: 16th European Conference, Glasgow, UK, 23–28 August 2020; pp. 527–544. [Google Scholar]
- Wei, S.E.; Ramakrishna, V.; Kanade, T.; Sheikh, Y. Convolutional pose machines. In Proceedings of the IEEE conference on Computer Vision and Pattern Recognition, Las Vegas, NV, USA, 26 June–1 July 2016; pp. 4724–4732. [Google Scholar]


| Hardware | CPU | Intel(R) Xeon(R) E5-2678 @2.50 GHz × 48 |
| GPU | NVIDIA GeForce RTX 3090 24 G × 8 | |
| Software | OS | Linux Ubuntu 20.04.5 LTS |
| Python Version | Python 3.7.0 | |
| Pytorch Version | Pytorch 1.13.1 | |
| Cuda Version | Cuda11.6 + Cudnn8.3.2 |
| Method | Backbone | Input Size | (%) |
|---|---|---|---|
| DEKR [33] | HRNetW48 | 512 | 51.8 (↓20.5) |
| HrHRNet [31] | HRNetW32 | 512 | 46.8 (↓19.7) |
| SWAHR [32] | HRNetW32 | 512 | 49.7 (↓18.2) |
| SWAHR [32] | HRNetW48 | 640 | 56.7 (↓15.3) |
| SimCC [10] | HRNetW48 | 256 | 62.1 (↓13.8) |
| SSA Net | HRNetW48 | 256 | 69.8 (↓7.6) |
| Method | Backbone | Input Size | #Params | ||
|---|---|---|---|---|---|
| SimpleBaseline [26] | ResNet50 | 256 × 192 | 34.0 M | 70.4 | 67.1 |
| SimpleBaseline [26] | ResNet101 | 256 × 192 | 53.0 M | 71.4 | 68.1 |
| SimpleBaseline [26] | ResNet152 | 256 × 192 | 68.6 M | 72.0 | 68.7 |
| TFPose [36] | ResNet50 | 384 × 288 | - | 72.4 | - |
| PRTR [37] | ResNet101 | 512 × 348 | 60.4 M | 72.0 | 67.3 |
| PRTR [37] | HRNetW32 | 384 × 288 | 57.2 M | 73.1 | 68.8 |
| PRTR [37] | HRNetW32 | 512 × 348 | 57.2 M | 73.3 | 69.0 |
| HRNet-W32 [25] | HRNetW32 | 256 × 192 | 28.5 M | 74.5 | 70.8 |
| HRNet-W48 [25] | HRNetW48 | 256 × 192 | 63.6 M | 75.1 | 71.5 |
| SimCC [10] | HRNetW48 | 256 × 192 | 66.3 M | 75.9 | - |
| SSA Net | HRNetW48 | 256 × 192 | 59.8 M | 77.4 | 74.5 |
| Method | Backbone | GFLOPs | Input Size | |||||
|---|---|---|---|---|---|---|---|---|
| Heatmap Based Method | ||||||||
| Mask-RCNN [38] | ResNet-50-FRN | - | - | 63.1 | 87.3 | 68.7 | 57.8 | 71.4 |
| CMU-Pose [39] | VGG-19 | - | - | 64.2 | 86.2 | 70.1 | 61.0 | 68.8 |
| G-RMI [40] | ResNet-101 | - | 352 × 257 | 64.9 | 85.5 | 71.3 | 62.3 | 70.0 |
| AE [41] | Hourglass | - | 512 × 512 | 65.5 | 86.8 | 72.3 | 60.6 | 72.6 |
| MultiPoseNet [42] | - | - | 480 × 480 | 69.6 | 86.3 | 76.6 | 65.0 | 76.3 |
| RMPE [43] | PyraNet | 26.7 | 320 × 256 | 72.3 | 89.2 | 79.1 | 68.0 | 78.6 |
| CPN [44] | ResNet-Inception | 29.2 | 384 × 288 | 72.1 | 91.4 | 80.0 | 68.7 | 77.2 |
| CPF [45] | - | - | - | 72.6 | 86.1 | 69.7 | 78.3 | 64.1 |
| SimpleBaline [26] | ResNet-152 | 35.6 | 384 × 288 | 73.7 | 91.9 | 81.1 | 70.3 | 80.0 |
| HRNet-W32 [25] | HRNet-W32 | 16.0 | 384 × 288 | 74.9 | 92.5 | 82.8 | 71.3 | 80.9 |
| SimpleBaline [26] | ResNet-50 | 20.0 | 384 × 288 | 71.5 | 91.1 | 78.7 | 67.8 | 78.0 |
| HRNet-W48 [25] | HRNet-W48 | 14.6 | 256 × 192 | 74.2 | 92.4 | 82.4 | 70.9 | 79.7 |
| HRNet-W48 [25] | HRNet-W48 | 32.9 | 384 × 288 | 75.5 | 92.5 | 83.3 | 71.9 | 81.5 |
| TransPose-H [27] | HRNet-W48 + Trans | 21.8 | 256 × 192 | 75.0 | 92.3 | 82.3 | 71.3 | 81.1 |
| Regression Based Method | ||||||||
| SPM [17] | Hourglass | - | - | 66.9 | 88.5 | 72.9 | 62.6 | 73.1 |
| DeepPose [12] | ResNet-101 | 7.7 | 256 × 192 | 57.4 | 86.5 | 64.2 | 55.0 | 62.8 |
| DeepPose [12] | ResNet-152 | 11.3 | 256 × 192 | 59.3 | 87.6 | 66.7 | 56.8 | 64.9 |
| CenterNet [46] | Hourglass | - | - | 63.0 | 86.8 | 69.6 | 58.9 | 70.4 |
| DirectPose [14] | ResNet-50 | - | - | 62.2 | 86.4 | 68.2 | 56.7 | 69.8 |
| PointSetNet [47] | HRNet-W48 | - | - | 68.7 | 89.9 | 76.3 | 64.8 | 75.3 |
| Integral Pose [15] | ResNet-101 | 11.0 | 256 × 256 | 67.8 | 88.2 | 74.8 | 63.9 | 74.0 |
| TFPose [36] | ResNet-50 + Trans | 20.4 | 384 × 288 | 72.2 | 90.9 | 80.1 | 69.1 | 78.8 |
| PRTR [37] | HRNet-W48 + Trans | - | - | 64.9 | 87.0 | 71.7 | 60.2 | 72.5 |
| PRTR [37] | HRNet-W48 + Trans | 21.6 | 384 × 288 | 71.7 | 90.6 | 79.6 | 67.6 | 78.4 |
| PRTR [37] | HRNet-W48 + Trans | 37.8 | 512 × 384 | 72.1 | 90.4 | 79.6 | 68.1 | 79.0 |
| SimCC baseline [10] | - | 20.2 | 384 × 288 | 72.7 | 91.2 | 80.1 | 69.2 | 78.0 |
| SSA Net | HRNet-W48 | 14.7 | 256 × 192 | 75.8 | 92.1 | 83.6 | 73.5 | 82.1 |
| Method | Hea | Sho | Elb | Wri | Hip | Kne | Ank | Mean |
|---|---|---|---|---|---|---|---|---|
| Hmp.Based | ||||||||
| SimpleBaseline-R50 [26] | 96.4 | 95.3 | 89.0 | 83.2 | 88.4 | 84.0 | 79.6 | 88.5 |
| SimpleBaseline-R101 [26] | 96.9 | 95.9 | 89.5 | 84.4 | 88.4 | 84.5 | 80.7 | 89.1 |
| SimpleBaseline-R152 [26] | 97.0 | 95.9 | 90.0 | 85.0 | 89.2 | 85.3 | 81.3 | 89.6 |
| CPM [48] | 96.2 | 95.0 | 87.5 | 82.2 | 87.6 | 82.7 | 78.4 | 87.7 |
| HRNetW48 [25] | 96.9 | 95.9 | 90.6 | 85.8 | 88.7 | 86.6 | 82.6 | 90.1 |
| Reg.Based | ||||||||
| Integral [15] | - | - | - | - | - | - | - | 87.3 |
| PRTR-R101 [37] | 96.3 | 95.0 | 88.3 | 82.4 | 88.1 | 83.6 | 77.4 | 87.9 |
| PRTR-R152 [37] | 96.4 | 94.9 | 88.4 | 82.6 | 88.6 | 84.1 | 78.4 | 88.2 |
| SSA Net | 97.0 | 96.0 | 90.5 | 86.1 | 89.6 | 86.3 | 83.2 | 90.3 |
| Method | T | D | A1 | A2 | |
|---|---|---|---|---|---|
| method 1 | 75.8 | ||||
| method 2 | √ | 76.5 (↓0.7%) | |||
| method 3 | √ | 76.1 (↓0.3%) | |||
| method 4 | √ | 76.9 (↓1.1%) | |||
| method 5 | √ | √ | √ | 77.2 (↓1.4%) | |
| SSA Net | √ | √ | √ | √ | 77.4 (↓1.6%) |
| Method | TDAA | Heatmap | CVR | |
|---|---|---|---|---|
| method 1 | √ | 73.1 | ||
| method 2 | √ | 75.8 | ||
| method 3 | √ | √ | 75.2 | |
| method 4 | √ | √ | 77.4 |
| Method | Backbone | #Params | SimCC | CVR | |
|---|---|---|---|---|---|
| method 1 | HRNetW48 | 66.3 M | √ | 75.9 | |
| method 2 | HRNetW48 | 59.8 M | √ | 75.8 |
Disclaimer/Publisher’s Note: The statements, opinions and data contained in all publications are solely those of the individual author(s) and contributor(s) and not of MDPI and/or the editor(s). MDPI and/or the editor(s) disclaim responsibility for any injury to people or property resulting from any ideas, methods, instructions or products referred to in the content. |
© 2023 by the authors. Licensee MDPI, Basel, Switzerland. This article is an open access article distributed under the terms and conditions of the Creative Commons Attribution (CC BY) license (https://creativecommons.org/licenses/by/4.0/).
Share and Cite
Li, S.; Zhang, H.; Ma, H.; Feng, J.; Jiang, M. SSA Net: Small Scale-Aware Enhancement Network for Human Pose Estimation. Sensors 2023, 23, 7299. https://doi.org/10.3390/s23177299
Li S, Zhang H, Ma H, Feng J, Jiang M. SSA Net: Small Scale-Aware Enhancement Network for Human Pose Estimation. Sensors. 2023; 23(17):7299. https://doi.org/10.3390/s23177299
Chicago/Turabian StyleLi, Shaohua, Haixiang Zhang, Hanjie Ma, Jie Feng, and Mingfeng Jiang. 2023. "SSA Net: Small Scale-Aware Enhancement Network for Human Pose Estimation" Sensors 23, no. 17: 7299. https://doi.org/10.3390/s23177299