
Satellite Video Moving Vehicle Detection and Tracking Based on Spatiotemporal Characteristics
Abstract
:1. Introduction
2. Related Work
2.1. Traditional Background Subtraction
2.2. Detection Methods Based on Road Constraints
2.3. Data Association
3. Methods
3.1. Constraint Construction Based on the Spatiotemporal Domain
3.2. Moving Vehicle Detection
3.3. Inter-Frame Vehicle Association
4. Results
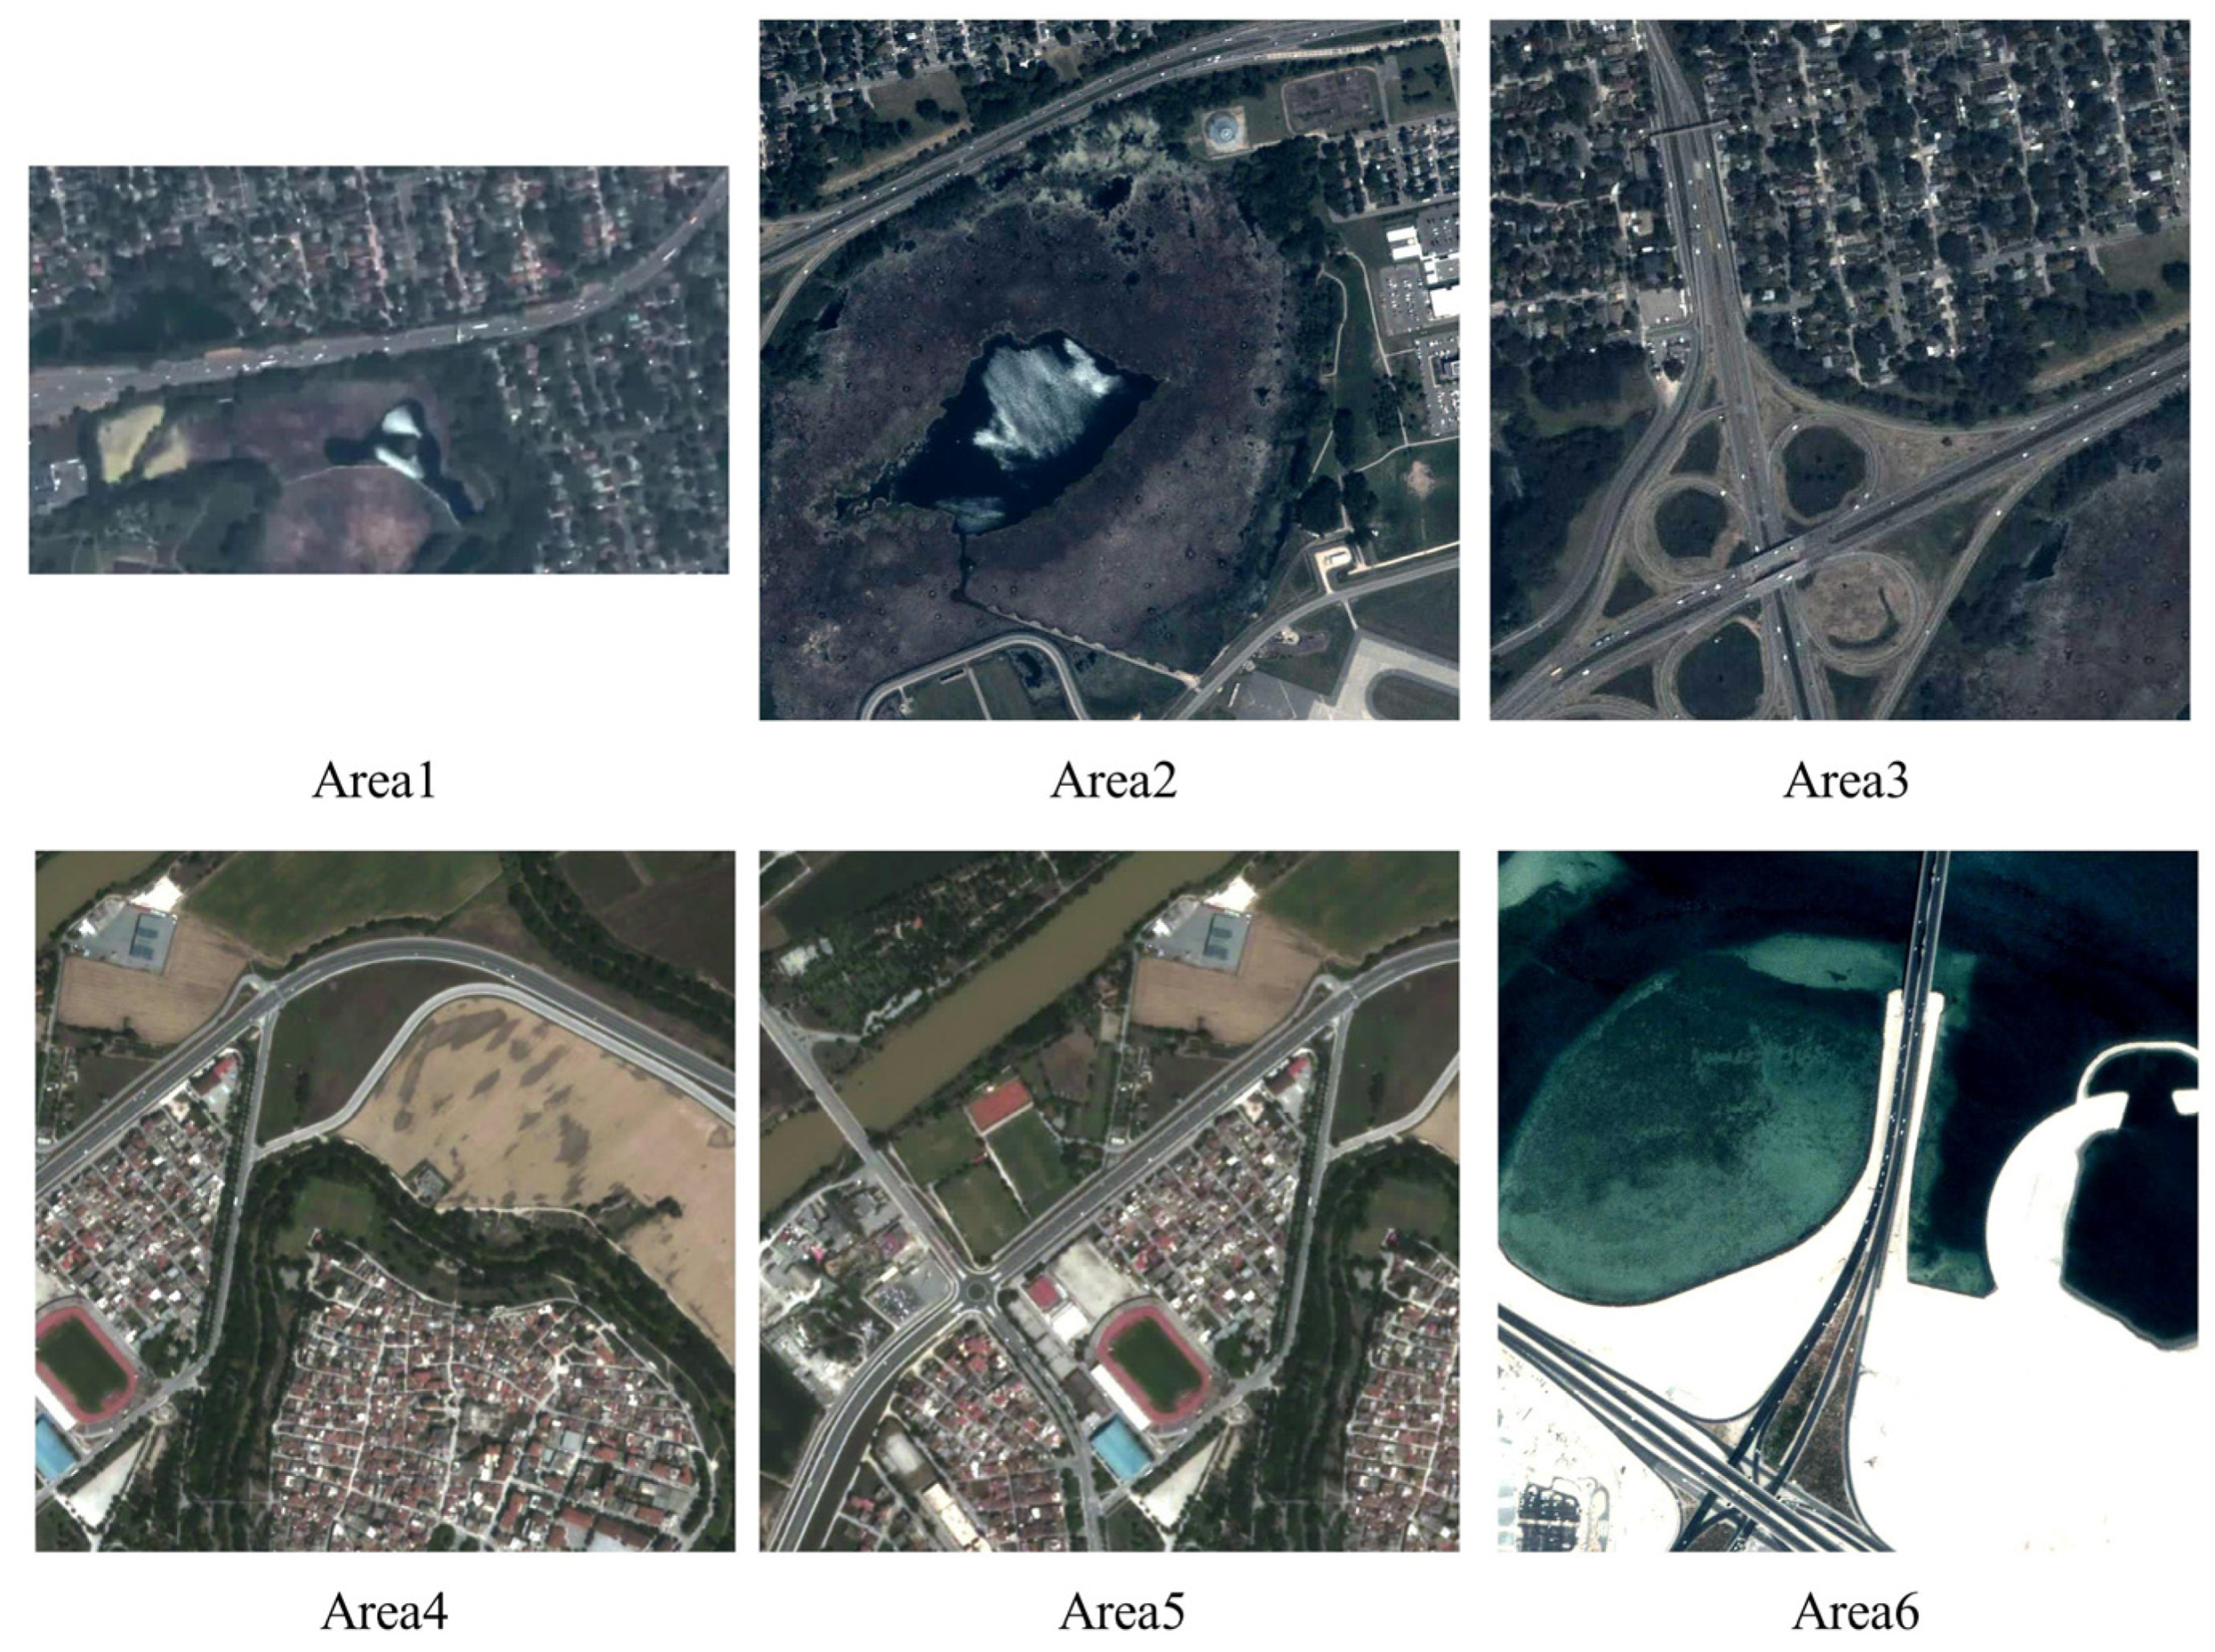
4.1. Test Data
4.2. Evaluation Indicators
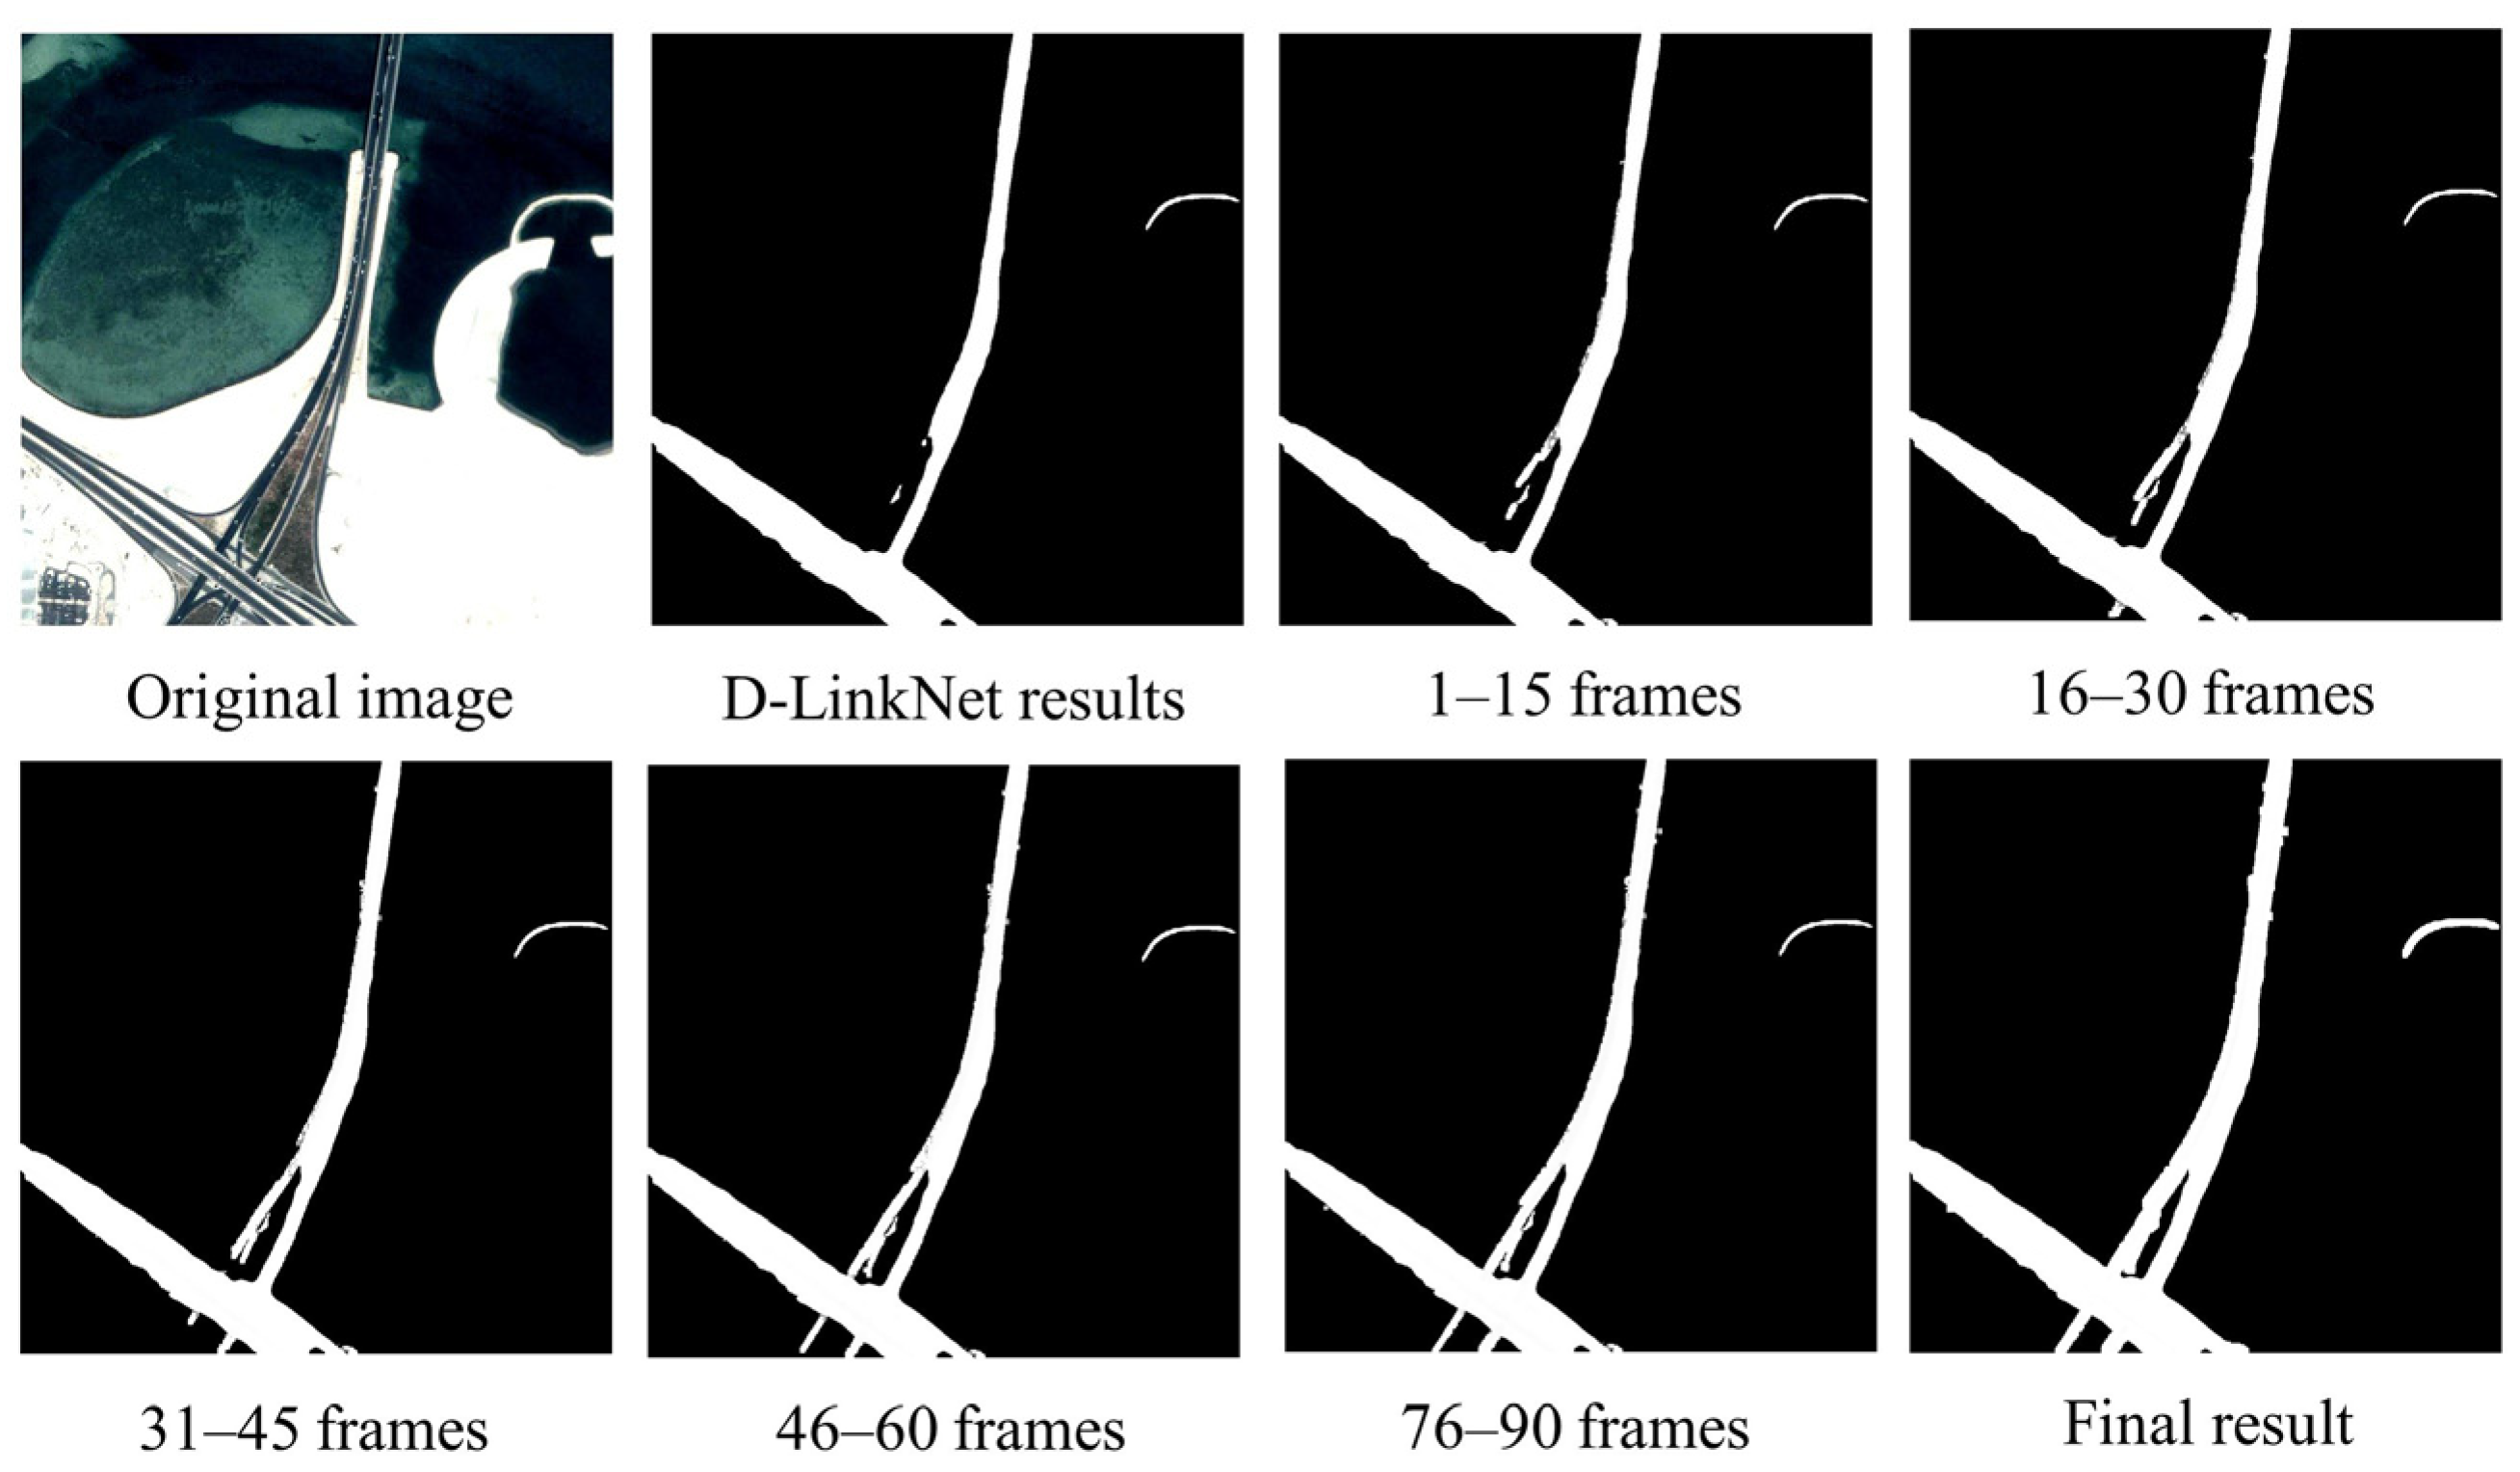
4.3. Constraint Construction Validation Tests
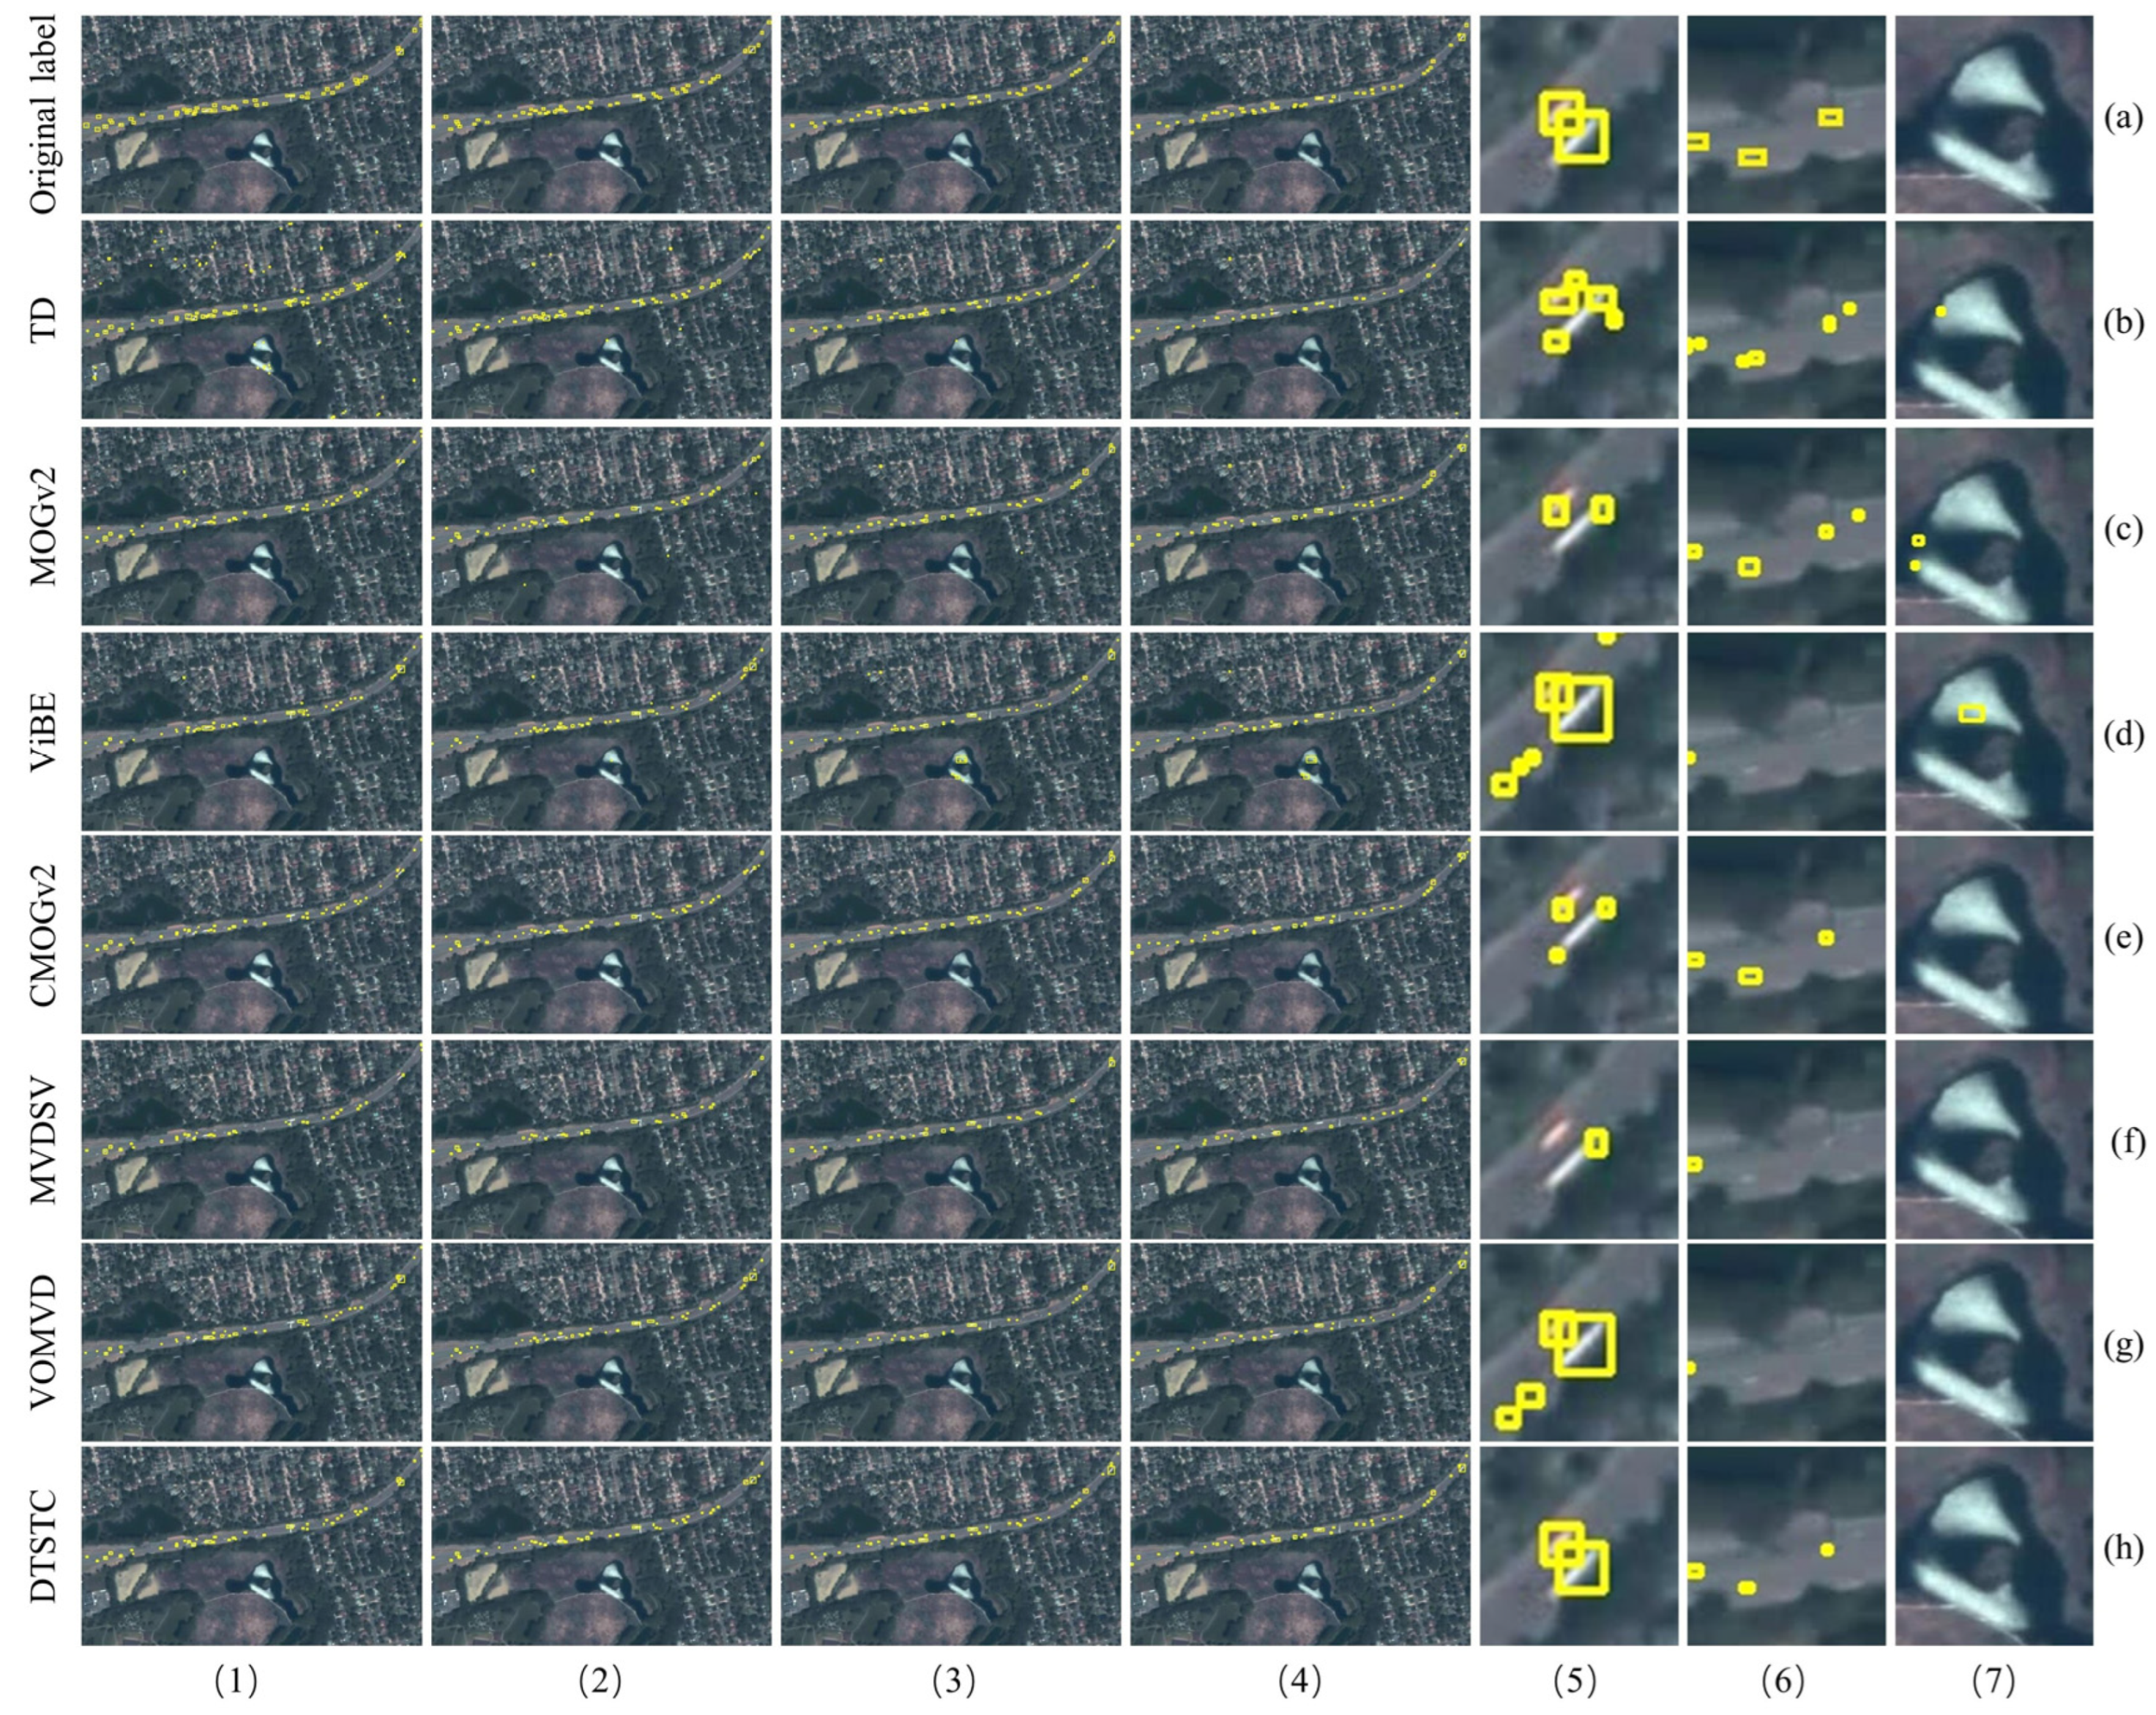
4.4. Comparative Testing and Quantitative Analysis of Moving Vehicle Inspection
4.5. Moving Vehicle Tracking Test
5. Conclusions
Author Contributions
Funding
Informed Consent Statement
Data Availability Statement
Conflicts of Interest
References
- Shao, J.; Du, B.; Wu, C.; Pingkun, Y. PASiam: Predicting attention inspired Siamese network, for space-borne satellite video tracking. In Proceedings of the 2019 IEEE International Conference on Multimedia and Expo (ICME), Shanghai, China, 8–12 July 2019. [Google Scholar] [CrossRef]
- Ahmadi, S.A.; Ghorbanian, A.; Mohammadzadeh, A. Moving vehicle detection, tracking and traffic parameter estimation from a satellite video: A perspective on a smarter city. Int. J. Remote Sens. 2019, 40, 8379–8394. [Google Scholar] [CrossRef]
- Hu, Z.; Yang, D.; Zhang, K.; Chen, Z. Object tracking in satellite videos based on convolutional regression network with appearance and motion features. IEEE J. Sel. Top. Appl. Earth Obs. Remote Sens. 2020, 13, 783–793. [Google Scholar] [CrossRef]
- Xuan, S.; Li, S.; Han, M.; Wan, X.; Xia, G. Object tracking in satellite videos by improved correlation filters with motion estimations. IEEE Trans. Geosci. Remote Sens. 2020, 58, 1074–1086. [Google Scholar] [CrossRef]
- Ao, W.; Fu, Y.; Hou, X.; Xu, F. Needles in a haystack: Tracking city-scale moving vehicles from continuously moving satellite. IEEE Trans. Image Process. 2019, 29, 1944–1957. [Google Scholar] [CrossRef] [PubMed]
- Kang, J.; Wang, G.; He, G.; Wang, H.; Yin, R.; Jiang, W.; Zhang, Z. Moving vehicle detection for remote sensing satellite video. J. Remote Sens. 2020, 24, 1099–1107. [Google Scholar] [CrossRef]
- Lei, J.-F.; Dong, Y.-X.; Sui, H.-G. Detection of tiny-moving vehicles in satellite video based on priori-significance. Opt. Precis. Eng. 2021, 29, 130–141. [Google Scholar] [CrossRef]
- Lu, M.; Li, F.; Zhang, N.; Yang, X.; Lu, X.; Xin, L.; Liu, Y. Moving vehicle detection of video satellite based on vibe and object-oriented classification. Chin. Space Sci. Technol. 2022, 42, 141. [Google Scholar] [CrossRef]
- Yin, Z.; Tang, Y. Analysis of traffic flow in urban area for satellite video. In Proceedings of the IGARSS, Waikoloa, HI, USA, 26 September–2 October 2020. [Google Scholar] [CrossRef]
- Bewley, A.; Ge, Z.; Ott, L.; Ramos, F.; Upcroft, B. Simple online and realtime tracking. In Proceedings of the IEEE International Conference on Image Processing (ICIP), Phoenix, AZ, USA, 25–28 September 2016. [Google Scholar] [CrossRef] [Green Version]
- Zhou, H.; Ouyang, W.; Cheng, J.; Wang, X.; Li, H. Deep continuous conditional random fields with asymmetric inter-object constraints for online multi-object tracking. IEEE Trans. Circuits Syst. For Video Technol. 2019, 29, 1011–1022. [Google Scholar] [CrossRef] [Green Version]
- Shan, C.; Wei, C.; Deng, B.; Huang, J.; Hua, X.-S.; Cheng, X.; Liang, K. Tracklets predicting based adaptive graph tracking. arXiv 2020, arXiv:2010.09015. [Google Scholar] [CrossRef]
- Yu, F.; Li, W.; Li, Q.; Liu, Y.; Shi, X.; Yan, J. POI: Multiple object tracking with high performance detection and appearance feature. In Proceedings of the Computer Vision–ECCV 2016 Workshops, Amsterdam, The Netherlands, 8–10 October, 15–16 October 2016; Hua, G., Jégou, H., Eds.; Springer International Publishing: Cham, Switzerland, 2016; Volume 2016, pp. 36–42. [Google Scholar] [CrossRef] [Green Version]
- Lee, S.; Kim, E. Multiple object tracking via feature pyramid Siamese networks. IEEE Access 2019, 7, 8181–8194. [Google Scholar] [CrossRef]
- Liu, Y.; Geng, L.; Zhang, W.; Gong, Y. Survey of Video Based Small Target Detection. Available online: https://www.semanticscholar.org/paper/Survey-of-Video-Based-Small-Target-Detection-Liu-Geng/be65c197d5a72b7a3154e97ecb73c8f7abab0479 (accessed on 27 May 2023).
- Kalsotra, R.; Arora, S. Background subtraction for moving object detection: Explorations of recent developments and challenges. Vis. Comput. 2022, 38, 4151–4178. [Google Scholar] [CrossRef]
- Kaewtrakulpong, P.; Bowden, R. An improved adaptive background mixture model for real-time tracking with shadow detection. In Video-Based Surveillance Systems: Computer Vision and Distributed Processing; Remagnino, P., Jones, G.A., Paragios, N., Regazzoni, C.S., Eds.; Springer: Boston, MA, USA, 2022; Volume 2002, pp. 135–144. [Google Scholar] [CrossRef] [Green Version]
- Barnich, O.; Van Droogenbroeck, M. ViBE: A powerful random technique to estimate the background in video sequences. In Proceedings of the IEEE International Conference on Acoustics, Speech and Signal Processing, Taipei, Taiwan, 19–24 April 2009. [Google Scholar] [CrossRef] [Green Version]
- Liu, K.; Zhang, J. Moving Object Detection Based on Improved Vibe Algorithm. In Proceedings of the Real-Time Image Processing and Deep Learning 2021, Online Only, 12–17 April 2021; Volume 11736, p. 117360N. [Google Scholar] [CrossRef]
- Shu, M.; Zhong, Y.; Lv, P. Small moving vehicle detection via local enhancement fusion for satellite video. Int. J. Remote Sens. 2021, 42, 7189–7214. [Google Scholar] [CrossRef]
- Liu, J.; Guo, G. Pseudolinear kalman filters for target tracking using hybrid measurements. Signal Process. 2021, 188, 108206. [Google Scholar] [CrossRef]
- Maity, M.; Banerjee, S.; Sinha Chaudhuri, S. Faster R-CNN and YOLO based vehicle detection: A survey. In Proceedings of the 5th International Conference on Computing Methodologies and Communication (ICCMC), Erode, India, 8–10 April 2021. [Google Scholar] [CrossRef]
- Wang, Y.; Kitani, K.; Weng, X. Joint object detection and multi-object tracking with graph neural networks. In Proceedings of the IEEE International Conference on Robotics and Automation (ICRA), Xi’an, China, 30 May–5 June 2021. [Google Scholar] [CrossRef]
- Lit, Z.; Cai, S.; Wang, X.; Shao, H.; Niu, L.; Xue, N. Multiple object tracking with GRU association and kalman prediction. In Proceedings of the International Joint Conference on Neural Networks (IJCNN), Shenzhen, China, 18–22 July 2021. [Google Scholar] [CrossRef]
- Li, X.; Li, A. An Improved Image Enhancement Method Based on Lab Color Space Retinex Algorithm. In Proceedings of the Tenth International Conference on Graphics and Image Processing (ICGIP 2018), Chengdu, China, 12–14 December 2018; Volume 11069, p. 110692N. [Google Scholar] [CrossRef]
- Koonce, B. ResNet 34. In Convolutional Neural Networks with Swift for Tensorflow; Image Recognition and Dataset Categorization; Apress: Berkeley, CA, USA, 2021; pp. 51–61. [Google Scholar] [CrossRef]
- Yin, Q.; Hu, Q.; Liu, H.; Zhang, F.; Wang, Y.; Lin, Z.; An, W.; Guo, Y. Detecting and tracking small and dense moving objects in satellite videos: A benchmark. IEEE Trans. Geosci. Remote Sens. 2022, 60, 1–18. [Google Scholar] [CrossRef]
- Yin, X.X.; Sun, L.; Fu, Y.; Lu, R.; Zhang, Y. U-net-based medical image segmentation. J. Healthc. Eng. 2022, 2022, 4189781. [Google Scholar] [CrossRef] [PubMed]
- Zhou, L.; Zhang, C.; Wu, M. D-Linknet: Linknet with Pretrained Encoder and Dilated Convolution for High Resolution Satellite Imagery Road Extraction. In Proceedings of the 2018 IEEE/CVF Conference on Computer Vision and Pattern Recognition Workshops (CVPRW), Salt Lake City, UT, USA, 18–22 June 2018. [Google Scholar] [CrossRef]


| Test Data | Area 1 | Area 2 | Area 3 | Area 4 | Area 5 | Area 6 | |
|---|---|---|---|---|---|---|---|
| TD | P (%) | 72.56 | 38.81 | 67.21 | 56.72 | 68.35 | 24.52 |
| r (%) | 89.45 | 77.88 | 96.01 | 89.21 | 86.08 | 91.22 | |
| F (%) | 79.90 | 51.65 | 78.80 | 68.63 | 74.73 | 39.49 | |
| MOGv2 | P (%) | 68.70 | 36.06 | 67.43 | 61.13 | 69.61 | 39.40 |
| r (%) | 80.40 | 67.81 | 95.63 | 89.70 | 83.70 | 82.67 | |
| F (%) | 73.63 | 46.52 | 78.85 | 71.31 | 74.72 | 51.24 | |
| ViBE | P (%) | 81.47 | 38.33 | 91.59 | 63.38 | 72.24 | 72.85 |
| r (%) | 75.78 | 71.84 | 86.16 | 70.66 | 65.61 | 82.74 | |
| F (%) | 78.23 | 49.42 | 88.74 | 66.02 | 68.52 | 77.36 | |
| CMOGv2 | P (%) | 93.17 | 92.50 | 87.51 | 94.77 | 87.44 | 93.76 |
| r (%) | 80.40 | 67.48 | 85.88 | 87.79 | 83.70 | 82.67 | |
| F (%) | 85.88 | 77.63 | 86.79 | 91.04 | 85.16 | 87.85 | |
| MVDSV | P (%) | 98.37 | 87.94 | 81.37 | 90.08 | 84.41 | 89.40 |
| r (%) | 55.43 | 51.48 | 79.03 | 75.93 | 61.77 | 80.28 | |
| F (%) | 70.59 | 64.67 | 80.02 | 81.57 | 71.05 | 83.96 | |
| VOMVD | P (%) | 94.80 | 96.45 | 86.82 | 92.21 | 91.26 | 80.43 |
| r (%) | 75.78 | 71.83 | 86.17 | 70.66 | 65.61 | 82.73 | |
| F (%) | 84.00 | 82.31 | 85.82 | 79.65 | 75.99 | 81.35 | |
| DTSTC | P (%) | 98.86 | 96.01 | 91.69 | 99.99 | 91.84 | 88.75 |
| r (%) | 84.00 | 79.24 | 96.05 | 92.44 | 87.26 | 97.15 | |
| F (%) | 90.03 | 86.80 | 93.28 | 95.96 | 89.22 | 92.47 | |
| Test Data | Method | IDFN | IDFP | IDTP | IDS | MOTA (%) | IDF1 (%) |
|---|---|---|---|---|---|---|---|
| Area 1 | CMOGv2_D | 100 | 6 | 329 | 4 | 74.71 | 86.13 |
| C_SORT | 67 | 2 | 366 | 3 | 83.44 | 91.38 | |
| DTSTC | 62 | 0 | 373 | 1 | 85.52 | 92.33 | |
| Area 2 | CMOGv2_D | 117 | 15 | 239 | 9 | 61.99 | 78.36 |
| C_SORT | 121 | 18 | 232 | 3 | 61.72 | 76.94 | |
| DTSTC | 111 | 15 | 245 | 2 | 65.49 | 79.55 | |
| Area 3 | CMOGv2_D | 44 | 0 | 75 | 3 | 60.50 | 77.32 |
| C_SORT | 0 | 0 | 119 | 0 | 100.00 | 100.00 | |
| DTSTC | 0 | 0 | 119 | 0 | 100.00 | 100.00 | |
| Area 4 | CMOGv2_D | 109 | 33 | 241 | 12 | 59.79 | 77.24 |
| C_SORT | 36 | 22 | 325 | 2 | 84.33 | 91.80 | |
| DTSTC | 36 | 2 | 345 | 2 | 89.56 | 94.78 | |
| Area 5 | CMOGv2_D | 218 | 6 | 166 | 12 | 39.49 | 59.71 |
| C_SORT | 28 | 12 | 350 | 4 | 88.72 | 95.49 | |
| DTSTC | 28 | 12 | 350 | 4 | 88.72 | 95.49 | |
| Area 6 | CMOGv2_D | 77 | 36 | 137 | 8 | 51.60 | 70.80 |
| C_SORT | 29 | 34 | 187 | 7 | 72.00 | 85.58 | |
| DTSTC | 29 | 16 | 205 | 5 | 80.00 | 90.11 |
Disclaimer/Publisher’s Note: The statements, opinions and data contained in all publications are solely those of the individual author(s) and contributor(s) and not of MDPI and/or the editor(s). MDPI and/or the editor(s) disclaim responsibility for any injury to people or property resulting from any ideas, methods, instructions or products referred to in the content. |
© 2023 by the authors. Licensee MDPI, Basel, Switzerland. This article is an open access article distributed under the terms and conditions of the Creative Commons Attribution (CC BY) license (https://creativecommons.org/licenses/by/4.0/).
Share and Cite
Li, M.; Fan, D.; Dong, Y.; Li, D. Satellite Video Moving Vehicle Detection and Tracking Based on Spatiotemporal Characteristics. Sensors 2023, 23, 5771. https://doi.org/10.3390/s23125771
Li M, Fan D, Dong Y, Li D. Satellite Video Moving Vehicle Detection and Tracking Based on Spatiotemporal Characteristics. Sensors. 2023; 23(12):5771. https://doi.org/10.3390/s23125771
Chicago/Turabian StyleLi, Ming, Dazhao Fan, Yang Dong, and Dongzi Li. 2023. "Satellite Video Moving Vehicle Detection and Tracking Based on Spatiotemporal Characteristics" Sensors 23, no. 12: 5771. https://doi.org/10.3390/s23125771