

Verification of Mechanical Properties Identification Based on Impulse Excitation Technique and Mobile Device Measurements


Abstract
:1. Introduction
- Young’s modulus: measures the material’s stiffness and resistance to deformation under tension or compression.
- Poisson’s ratio: describes the lateral deformation of a material in response to an applied axial load.
- Elastic limit: the maximum stress that a material can withstand before it becomes permanently deformed.
- Modulus of resilience: the energy required to deform a material to its elastic limit.
- Modulus of toughness: the energy required to break a material.
- (1)
- Finding a low-cost solution to perform quality assurance tests of materials without needing sophisticated measurement equipment, such as universal testing machines, laser vibrometers, professional sensors (e.g., accelerometers, microphones), and acquisition systems together with the licensed software. The typical equipment used also requires a well-trained engineer to prepare the setup, adjust signal acquisition parameters, and analyze the data.
- (2)
- Present the possibility of using a mobile device with its sensor (microphone) as a reliable tool for obtaining materials’ elastic properties.
- (3)
- Present a typical application and advantages of using such a setup for IET method analysis on typical materials used for the construction of technical objects.
- (4)
- Show that the IET method, using a smartphone as a sensing solution and a way to analyze the data quickly, allows for its direct implementation even in small companies with no sensing equipment resources.
2. Materials and Methods
- E—Young’s modulus, Pa
- m—a mass of the sample (a bar), g
- b—width of the sample (a bar), mm
- L—length of the sample (a bar), mm
- t—thickness of the sample (a bar), mm
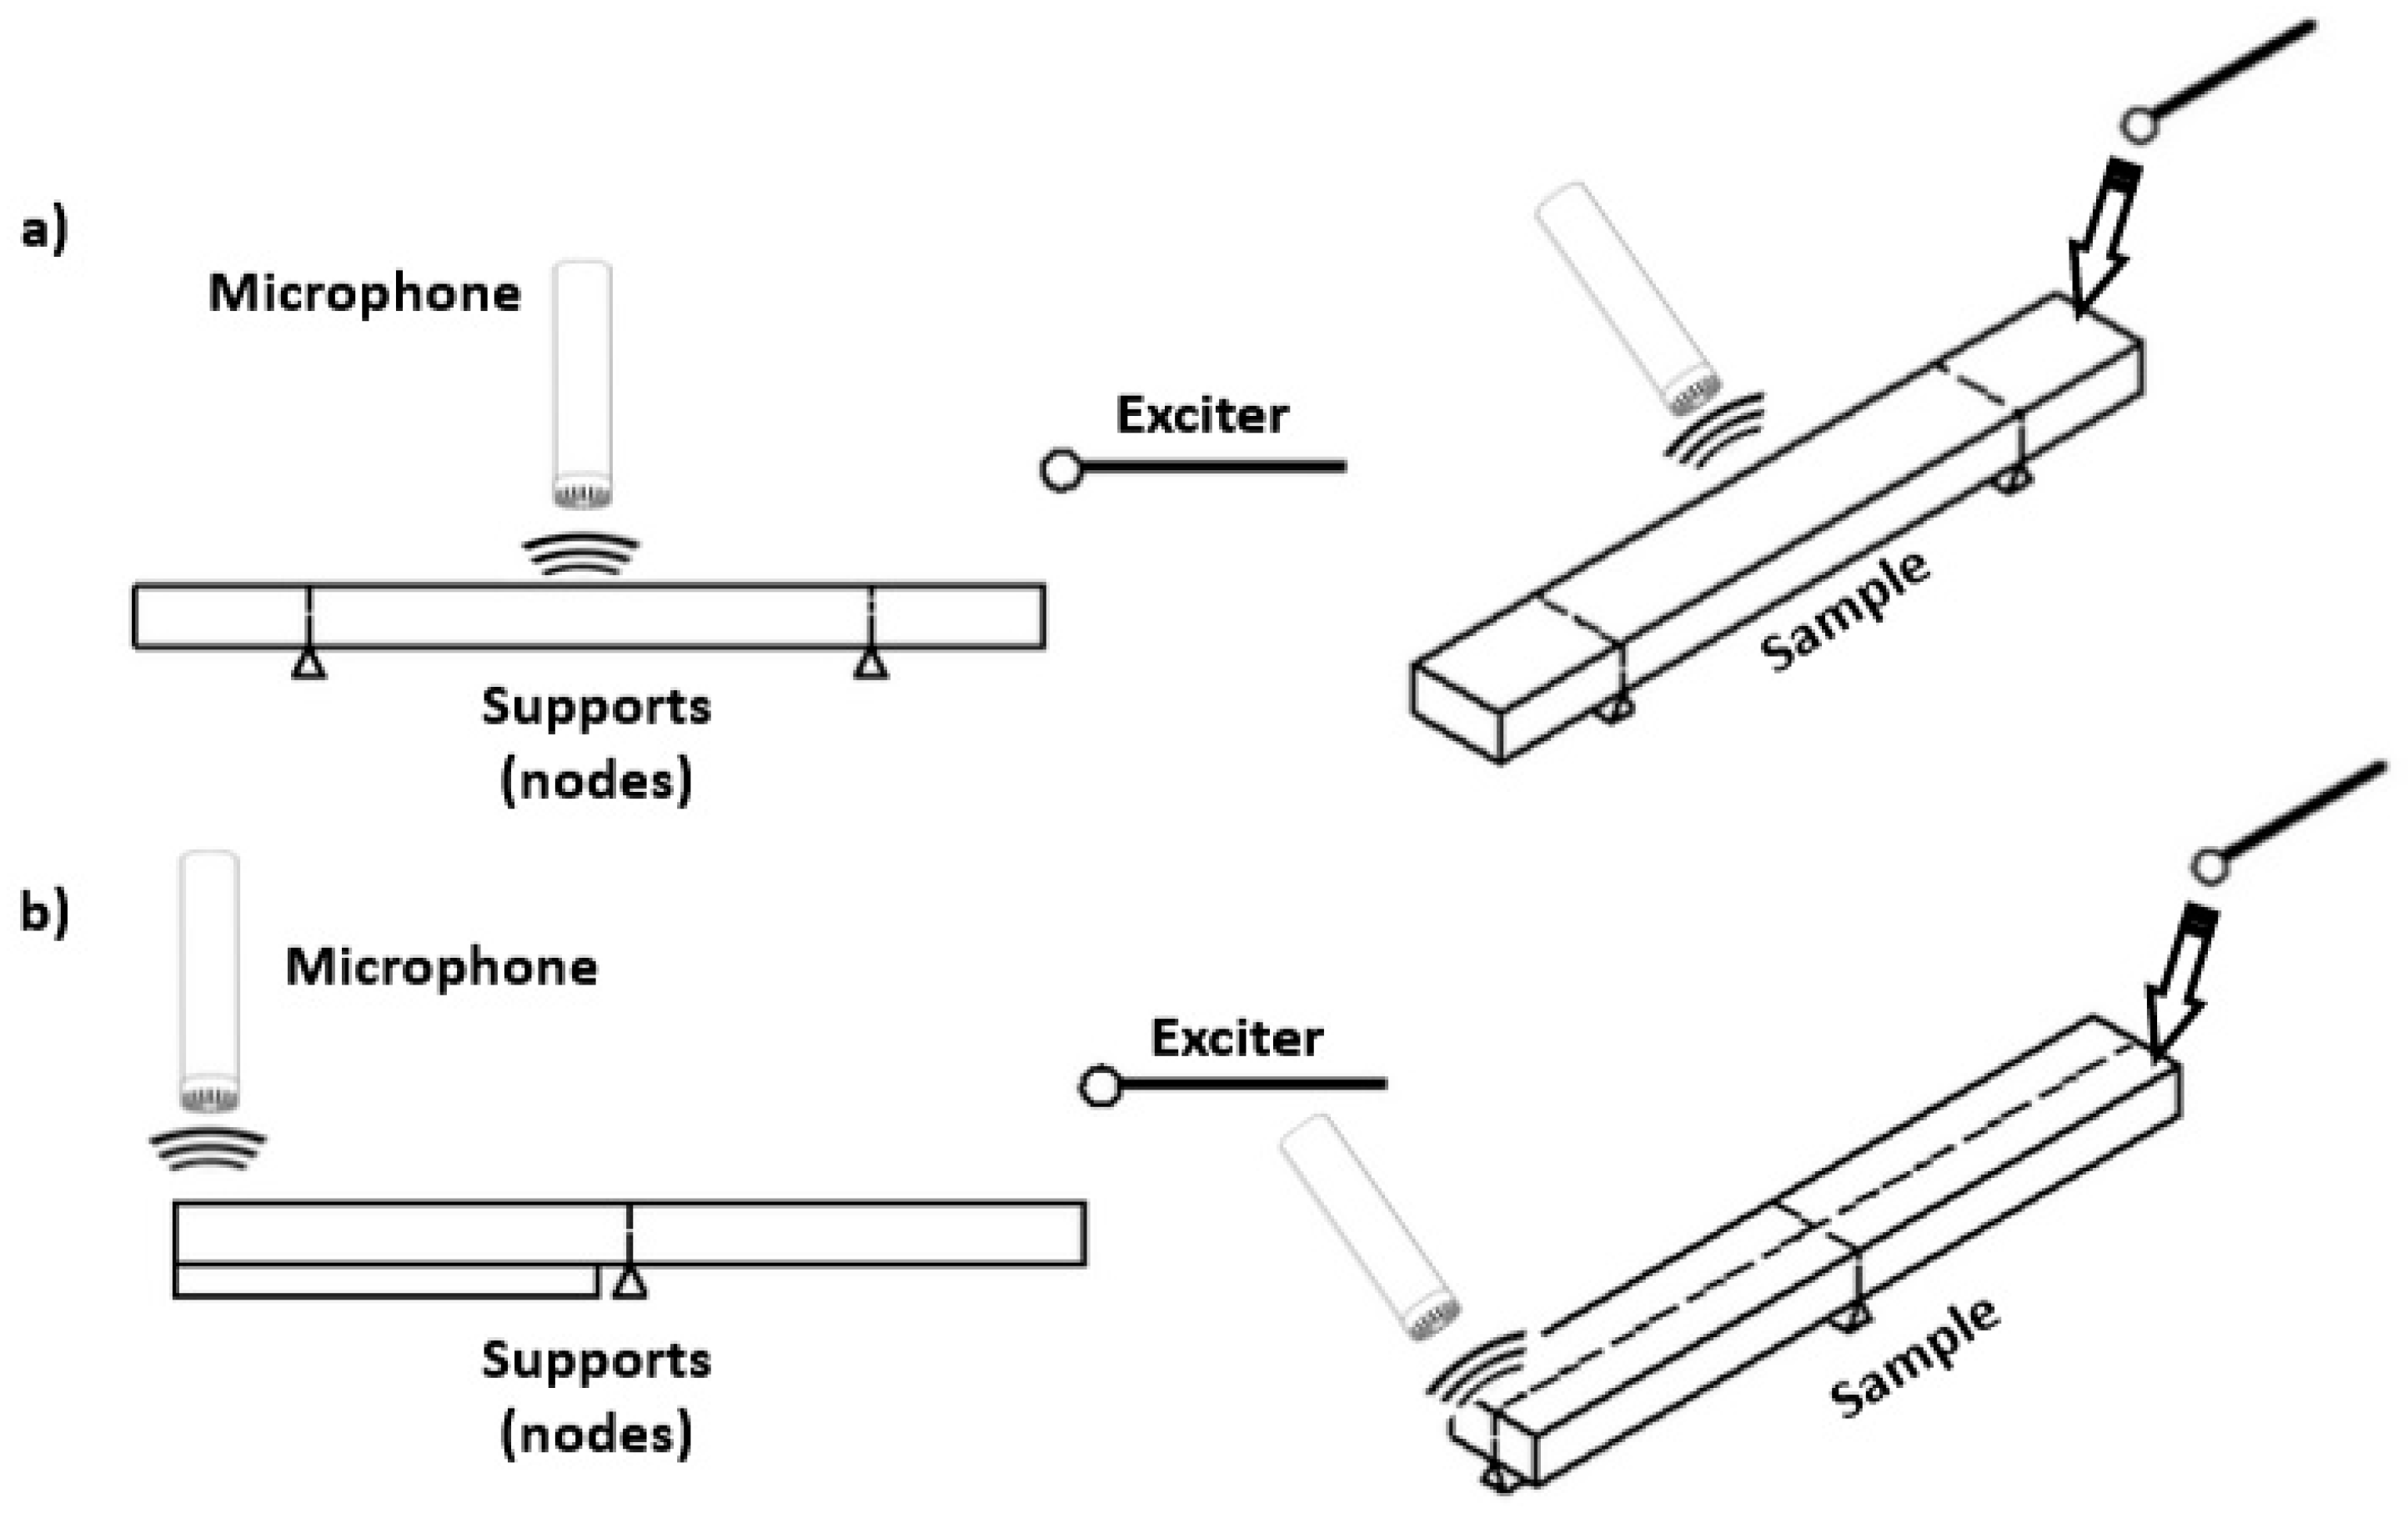
- —fundamental resonant frequency of sample (a bar) in flexure, Hz
- —correction factor for fundamental flexural mode to account for finite thickness of the sample (a bar), Poisson’s ratio, and so forth
- —dynamic shear modulus, Pa,
- —fundamental resonant frequency of sample (a bar) in torsion Hz.
3. Results
4. Discussion
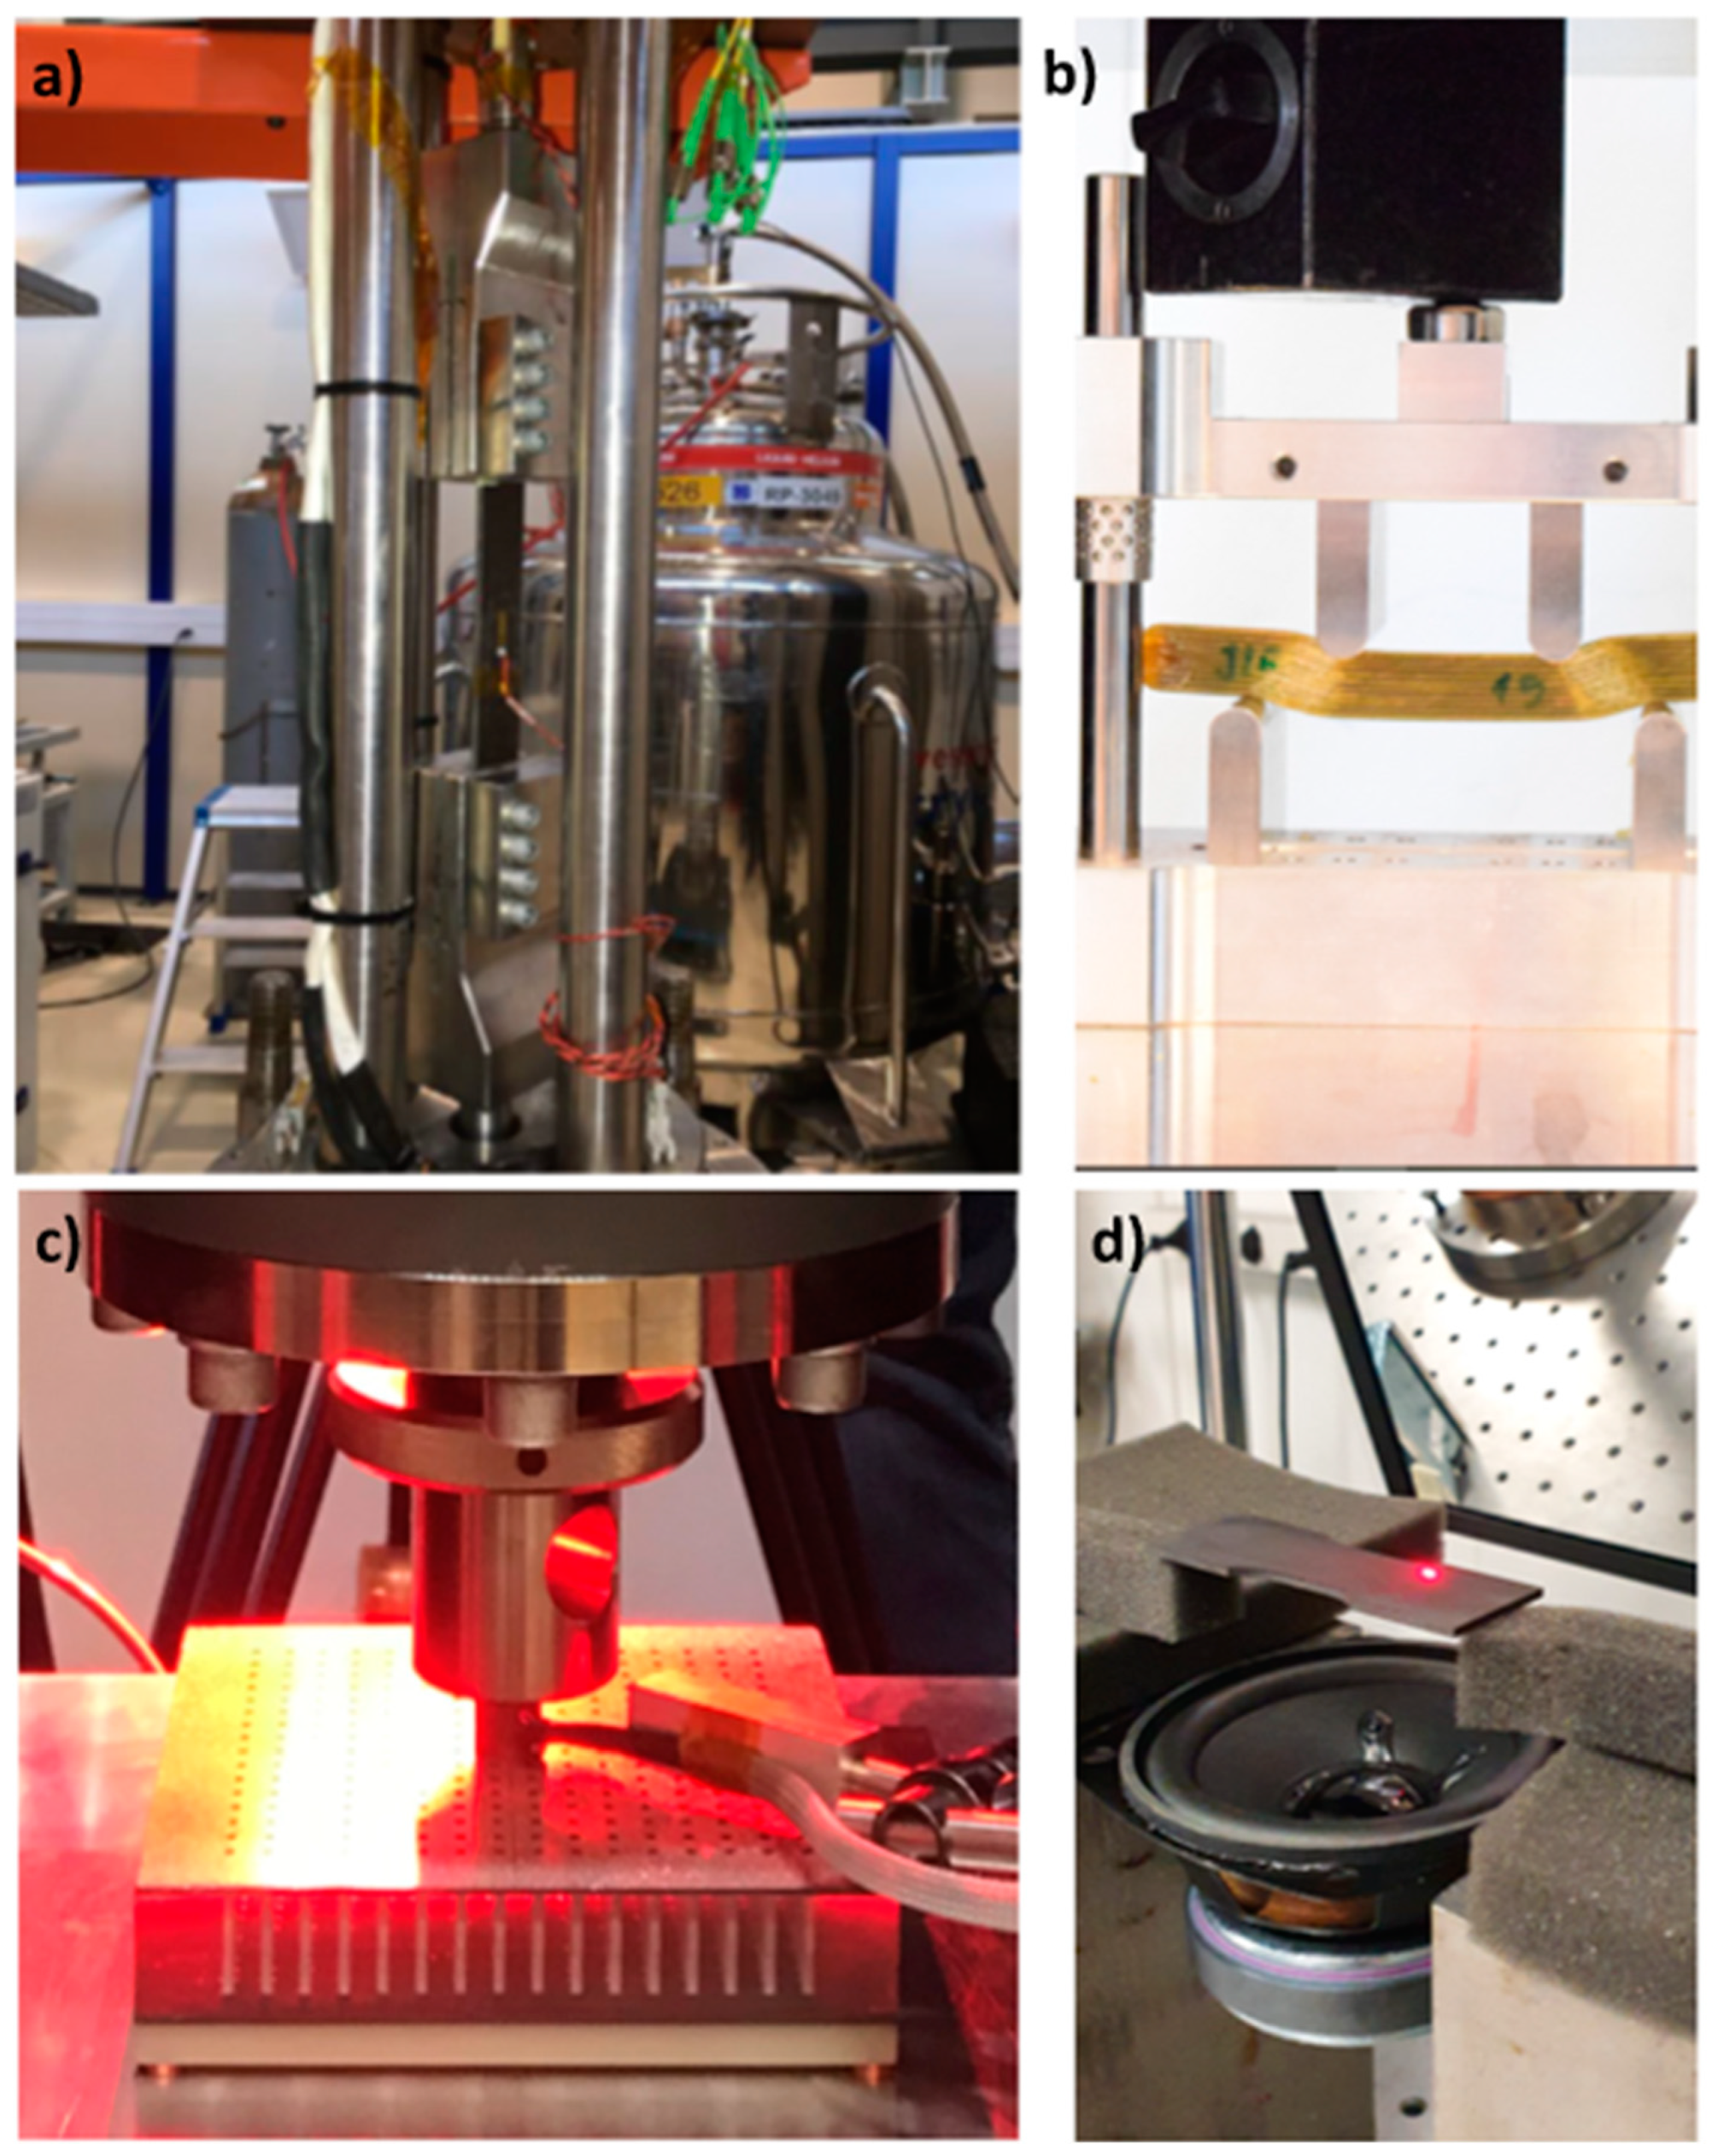
- Using a contact setup with a transducer (accelerometer) glued to the surface and excitation from impulse, e.g., modal hammer or shaker, is allowed only for large, heavy structures due to added mass from the transducer. For smaller samples and lightweight materials, using even a small accelerometer of a few grams will introduce an error in the measurements. This error will be even more significant while calculating Poisson’s ratio due to its value. This method requires investments in the equipment (sensors, exciters), specialized software, and a well-trained engineer to prepare the setup, choose correct acquisition parameters, and analyze the data.
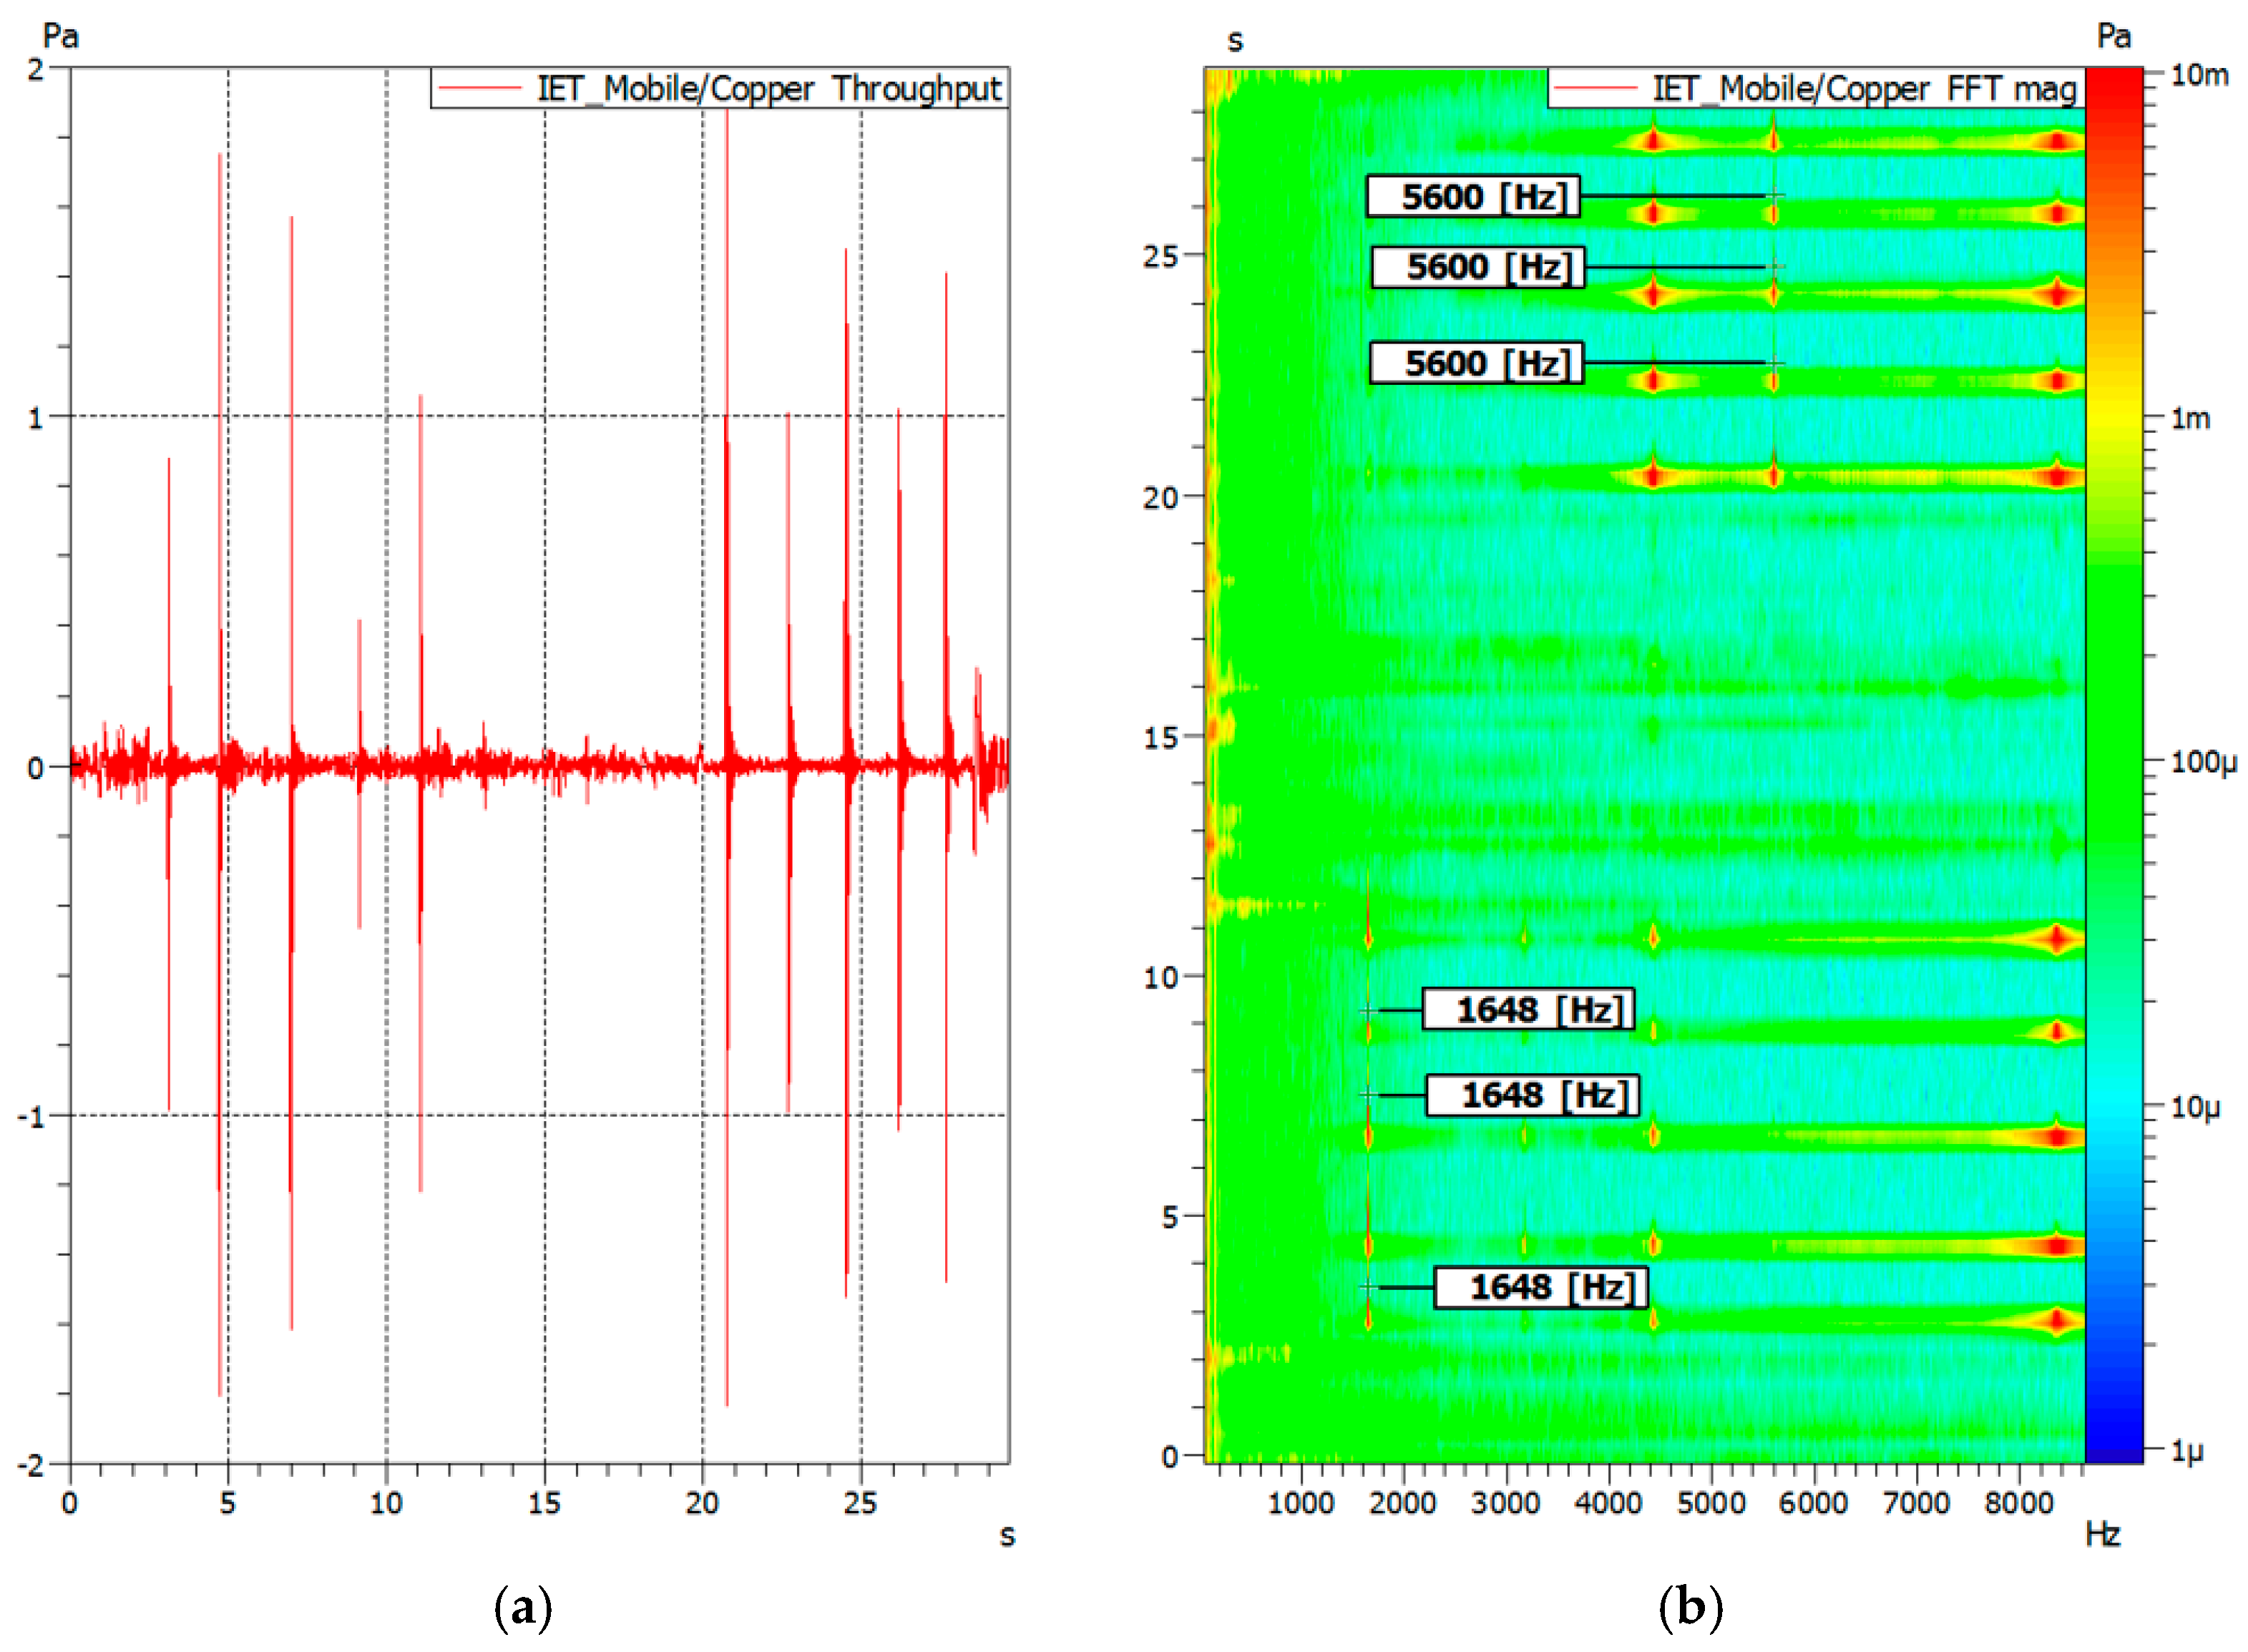
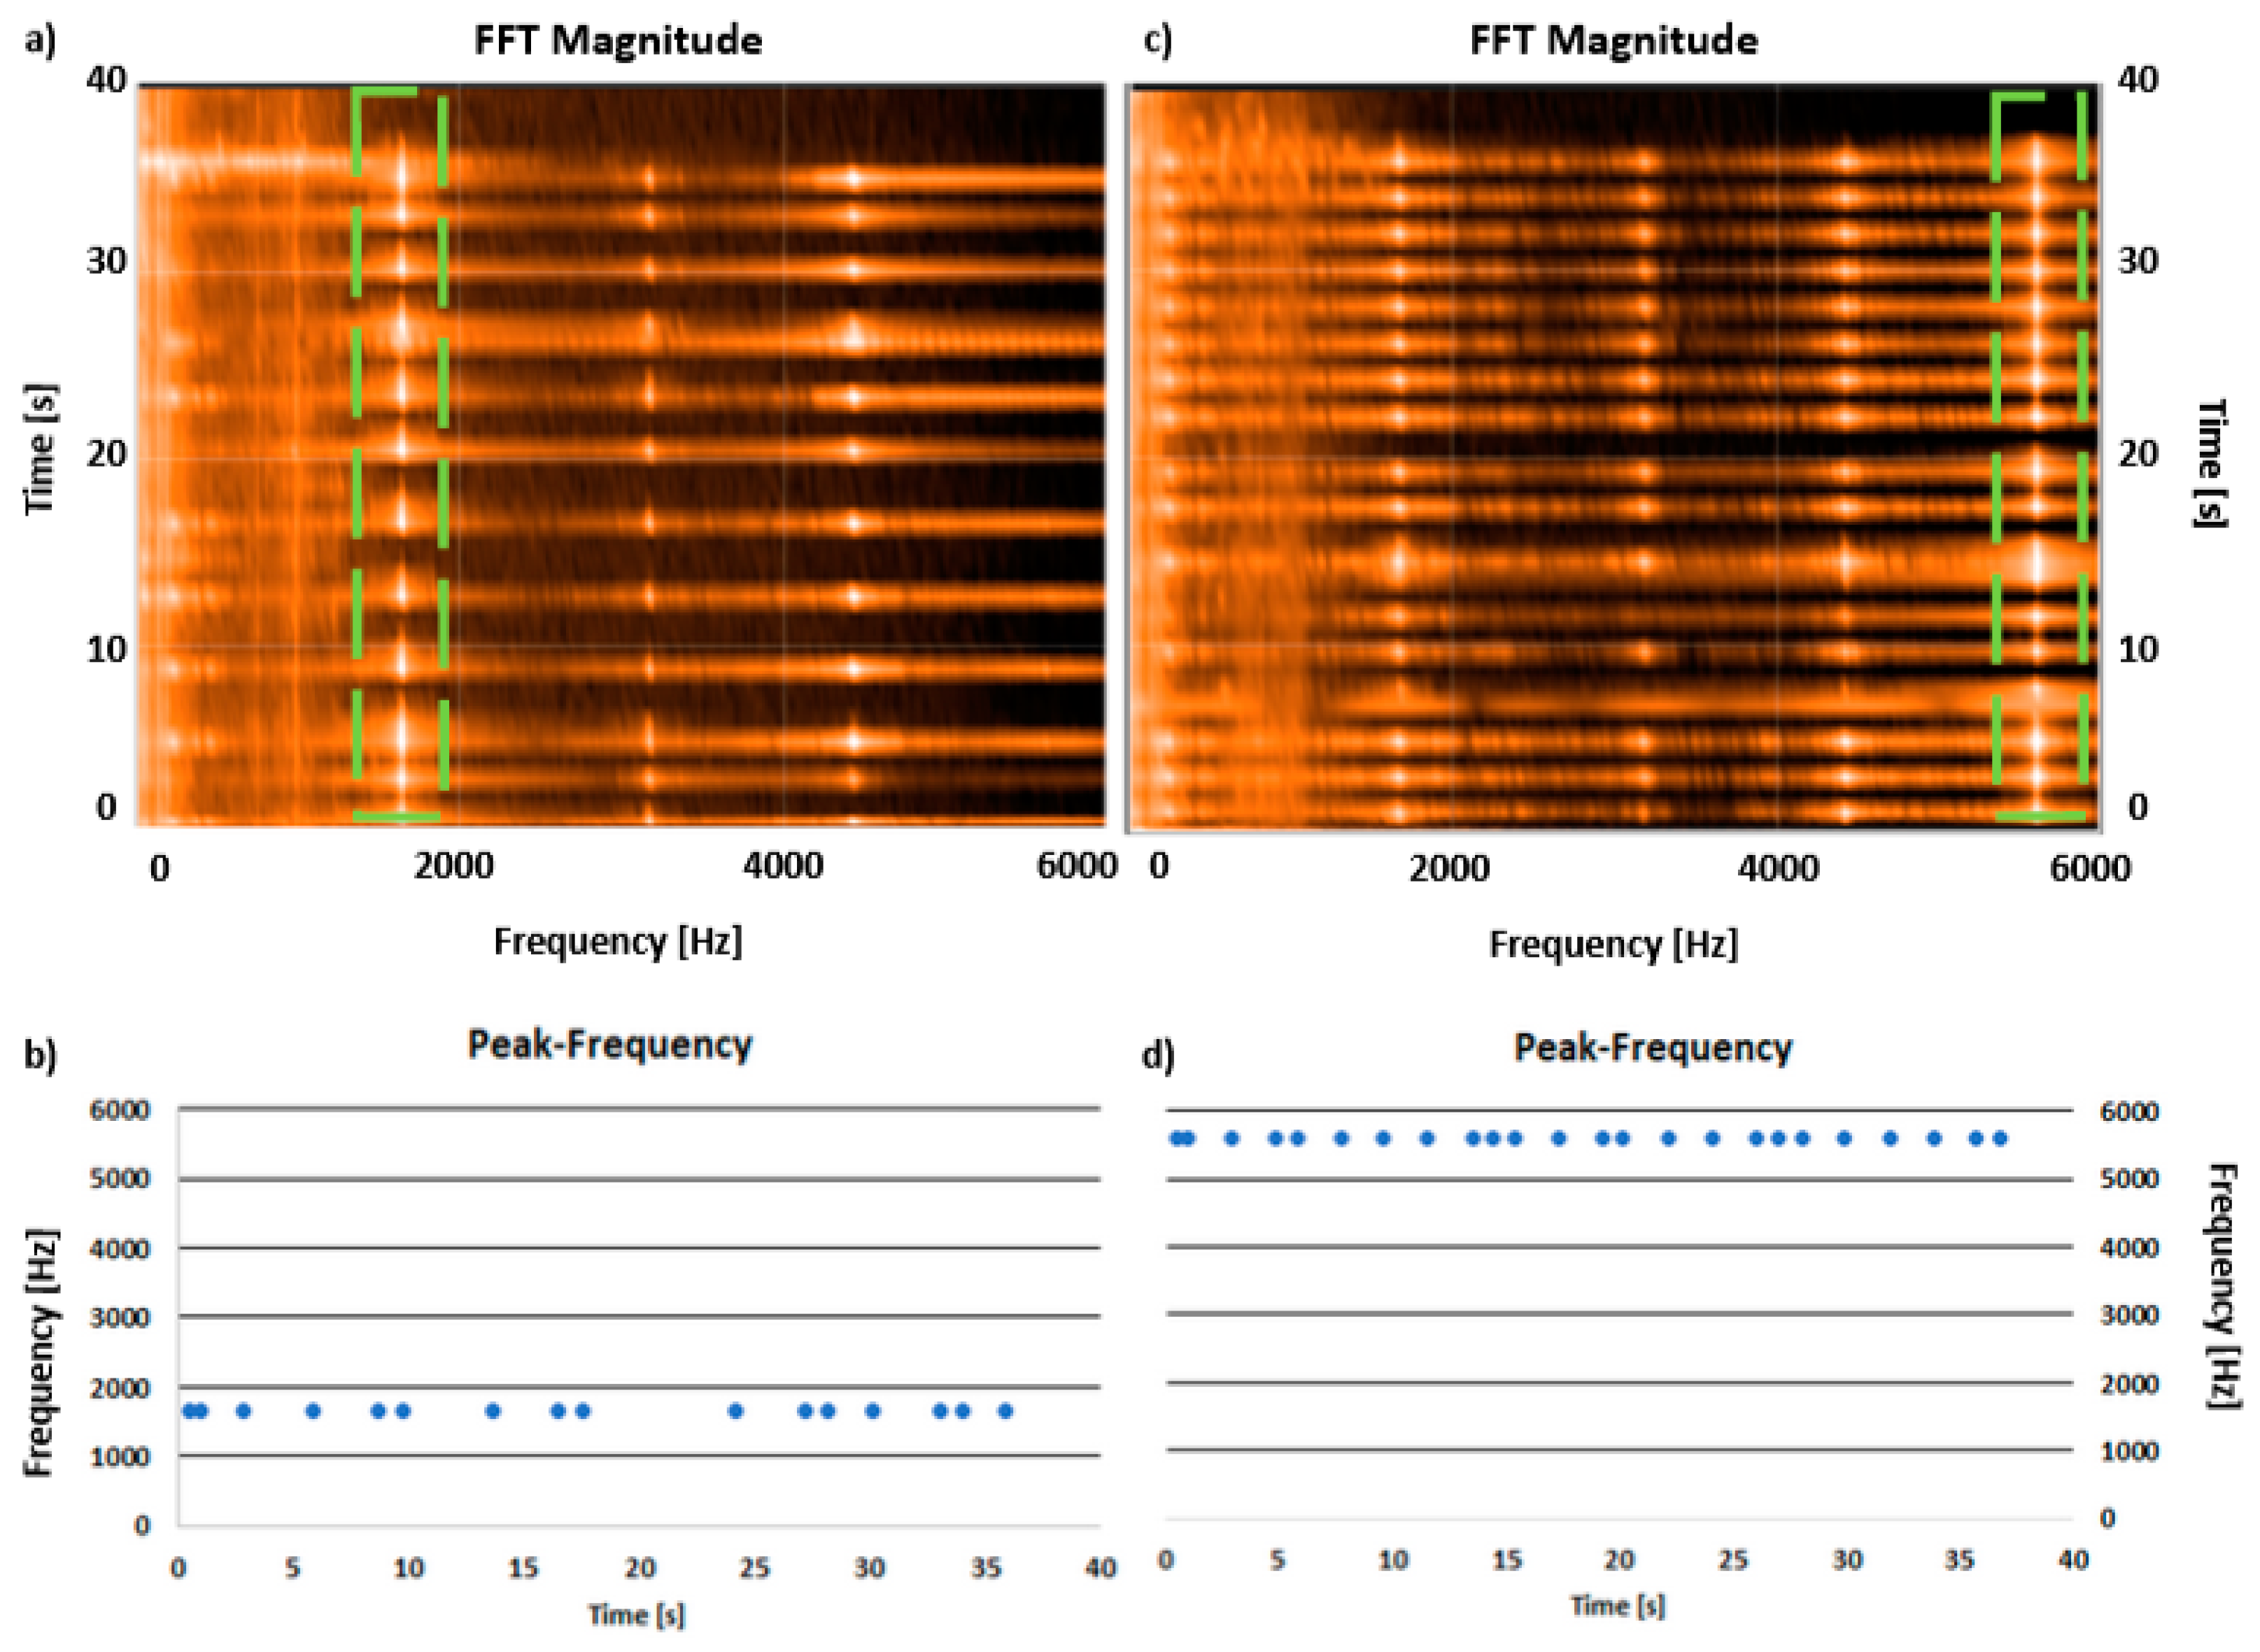
- Using the semi-contact method with the use of a contactless transducer (microphone and contact impulse, as presented in the control example in this study (Figure 3a), limits the problem of changing the structure dynamics due to changes in the object mass. However, the problem of the cost of the measuring equipment, the time needed for the test preparation, and personal costs is still a significant issue.
- Using a fully non-contact method with the use of, e.g., a 3D Laser Doppler Vibrometer as sensing equipment and the loudspeaker as an element introducing energy to the system, allows for reliable measurements with high accuracy (Figure 1d), as the author presented in previous works [18,19]. Additionally, due to the possibility of visualizing the forms straight after the test and thus identification of both the first flexural and first torsional frequencies, it is possible to perform the test without the need of changing support conditions or in the free-free conditions, e.g., using elastic strings. This makes this technique especially suitable for the measurement of light and ultralight materials or samples of fragile materials. Although the method is the most advanced, it has significant drawbacks in case of potential use. Due to the system’s cost, it is rarely used for similar tests authorized by the aerospace or automotive industries or highly specialized laboratories, such as the Mechanical Measurement Laboratory at CERN. Due to the cost and optical component, it is problematic to use for simple field tests, such as IET measurements of materials shipments. It also requires highly trained engineers for preparing the measurement, as well as the need for creating a new setup for every sample.
- Using the proposed method with the use of a smartphone’s microphone as a transducer and a small hammer or even a hand-crafted exciter, as presented above (Figure 3b), allows for reliable results comparable with professional equipment. It can be performed without laboratory conditions and sophisticated equipment. The results are obtained immediately after the test, and the system does not require specialized knowledge; thus, it is ideal for on-site material quality checks. Opposite to using sophisticated optical equipment, such as a 3D Laser Doppler Vibrometer, it is possible to measure multiple samples one after another without downtime needed for individual preparation of the measurement setup. Thus, multiple samples can be measured in a matter of minutes. Moreover, the cost of the whole measurement system contains the cost of the smartphone itself. Finally, due to its universality, the user is not limited by anything and can stream data to the cloud, incorporate measurements with companies software, e.g., Product Lifecycle Management (PLM), Product Data Management (PDM), Enterprise Resource Planning (ERP), Manufacturing Execution System (MES), and others, or connect the data stream with simulation software if the aim is to obtain reliable data, e.g., Finite Element Method (FEM) simulations.
5. Conclusions
Funding
Institutional Review Board Statement
Informed Consent Statement
Data Availability Statement
Conflicts of Interest
References
- Trzepieciński, T.; Najm, S.M.; Oleksik, V.; Vasilca, D.; Paniti, I.; Szpunar, M. Recent Developments and Future Challenges in Incremental Sheet Forming of Aluminium and Aluminium Alloy Sheets. Metals 2022, 12, 124. [Google Scholar] [CrossRef]
- Yang, D.; Zhao, J.; Ahmad, W.; Nasir Amin, M.; Aslam, F.; Khan, K.; Ahmad, A. Potential Use of Waste Eggshells in Cement-Based Materials: A Bibliographic Analysis and Review of the Material Properties. Constr. Build. Mater. 2022, 344, 128143. [Google Scholar] [CrossRef]
- Wei, J.; Sun, L.; Pan, W. Study on the Interfacial Properties of Bi-Material Structures Manufactured by Injection Molding after Compression. Compos. Struct. 2023, 309, 116740. [Google Scholar] [CrossRef]
- Kizilkanat, A.B.; Kabay, N.; Akyüncü, V.; Chowdhury, S.; Akça, A.H. Mechanical Properties and Fracture Behavior of Basalt and Glass Fiber Reinforced Concrete: An Experimental Study. Constr. Build. Mater. 2015, 100, 218–224. [Google Scholar] [CrossRef]
- Hossain, M.D.; Hassan, M.K.; Akl, M.; Pathirana, S.; Rahnamayiezekavat, P.; Douglas, G.; Bhat, T.; Saha, S. Fire Behaviour of Insulation Panels Commonly Used in High-Rise Buildings. Fire 2022, 5, 81. [Google Scholar] [CrossRef]
- Suryanarayana, C.; Al-Joubori, A.A.; Wang, Z. Nanostructured Materials and Nanocomposites by Mechanical Alloying: An Overview. Met. Mater. Int. 2022, 28, 41–53. [Google Scholar] [CrossRef]
- Li, T.; Lu, X.-M.; Zhang, M.-R.; Hu, K.; Li, Z. Peptide-Based Nanomaterials: Self-Assembly, Properties and Applications. Bioact. Mater. 2022, 11, 268–282. [Google Scholar] [CrossRef]
- Singh, S.; Ramakrishna, S.; Singh, R. Material Issues in Additive Manufacturing: A Review. J. Manuf. Process. 2017, 25, 185–200. [Google Scholar] [CrossRef]
- García-Collado, A.; Blanco, J.M.; Gupta, M.K.; Dorado-Vicente, R. Advances in Polymers Based Multi-Material Additive-Manufacturing Techniques: State-of-Art Review on Properties and Applications. Addit. Manuf. 2022, 50, 102577. [Google Scholar] [CrossRef]
- Chaudhary, R.P.; Parameswaran, C.; Idrees, M.; Rasaki, A.S.; Liu, C.; Chen, Z.; Colombo, P. Additive Manufacturing of Polymer-Derived Ceramics: Materials, Technologies, Properties and Potential Applications. Prog. Mater. Sci. 2022, 128, 100969. [Google Scholar] [CrossRef]
- Shen, Z.; Lin, Z.; Shi, P.; Zhu, J.; Zheng, T.; Ding, B.; Guo, Y.; Zhong, Y. Enhanced Electrical, Mechanical and Tribological Properties of Cu-Cr-Zr Alloys by Continuous Extrusion Forming and Subsequent Aging Treatment. J. Mater. Sci. Technol. 2022, 110, 187–197. [Google Scholar] [CrossRef]
- Coyle, S.; Majidi, C.; LeDuc, P.; Hsia, K.J. Bio-Inspired Soft Robotics: Material Selection, Actuation, and Design. Extrem. Mech. Lett. 2018, 22, 51–59. [Google Scholar] [CrossRef]
- Elango, N.; Faudzi, A.A.M. A Review Article: Investigations on Soft Materials for Soft Robot Manipulations. Int. J. Adv. Manuf. Technol. 2015, 80, 1027–1037. [Google Scholar] [CrossRef] [Green Version]
- Amirtharaj Mosas, K.K.; Chandrasekar, A.R.; Dasan, A.; Pakseresht, A.; Galusek, D. Recent Advancements in Materials and Coatings for Biomedical Implants. Gels 2022, 8, 323. [Google Scholar] [CrossRef] [PubMed]
- Azambou, C.I.; Djioko, F.H.K.; Obiukwu, O.O.; Tsobnang, P.K.; Kalu, E.E.; Kenfack, I.T.; Oguzie, E.E. Structural, Electronic, Mechanical and Thermodynamic Properties of Lithium-Rich Layered Oxides Cathode Materials for Lithium-Ion Battery: Computational Study. Mater. Today Commun. 2023, 35, 105738. [Google Scholar] [CrossRef]
- Li, X.; Li, P.; Wu, Z.; Luo, D.; Yu, H.-Y.; Lu, Z.-H. Review and Perspective of Materials for Flexible Solar Cells. Mater. Rep. Energy 2021, 1, 100001. [Google Scholar] [CrossRef]
- Yang, S.; Chen, Y.; Jiang, C. Strain Engineering of Two-dimensional Materials: Methods, Properties, and Applications. InfoMat 2021, 3, 397–420. [Google Scholar] [CrossRef]
- Guinchard, M.; Angeletti, M.; Boyer, F.; Catinaccio, A.; Gargiulo, C.; Lacny, L.; Laudi, E.; Scislo, L. Experimental Modal Analysis of Lightweight Structures Used in Particle Detectors: Optical Non-Contact Method. In Proceedings of the 9th International Particle Accelerator Conference, Vancouver, BC, Canada, 29 April–4 May 2018; pp. 2565–2567. [Google Scholar] [CrossRef]
- Scislo, L. Single-Point and Surface Quality Assessment Algorithm in Continuous Production with the Use of 3D Laser Doppler Scanning Vibrometry System. Sensors 2023, 23, 1263. [Google Scholar] [CrossRef]
- Scislo, L. Quality Assurance and Control of Steel Blade Production Using Full Non-Contact Frequency Response Analysis and 3D Laser Doppler Scanning Vibrometry System. In Proceedings of the 2021 11th IEEE International Conference on Intelligent Data Acquisition and Advanced Computing Systems: Technology and Applications (IDAACS), Cracow, Poland, 22–25 September 2021; pp. 419–423. [Google Scholar]
- Wu, S.-J.; Chin, P.-C.; Liu, H. Measurement of Elastic Properties of Brittle Materials by Ultrasonic and Indentation Methods. Appl. Sci. 2019, 9, 2067. [Google Scholar] [CrossRef] [Green Version]
- Obermayer, T.; Krempaszky, C.; Werner, E. Analysis of Texture and Anisotropic Elastic Properties of Additively Manufactured Ni-Base Alloys. Metals 2022, 12, 1991. [Google Scholar] [CrossRef]
- Paolino, D.S.; Geng, H.; Scattina, A.; Tridello, A.; Cavatorta, M.P.; Belingardi, G. Damaged Composite Laminates: Assessment of Residual Young’s Modulus through the Impulse Excitation Technique. Compos. Part B Eng. 2017, 128, 76–82. [Google Scholar] [CrossRef]
- Boursier Niutta, C. Residual Elastic Response in Damaged Woven Laminates through Local Impulse Excitation Technique. Compos. Struct. 2022, 293, 115723. [Google Scholar] [CrossRef]
- Coulon, A.; Filhol, A.; Pillet, G. Evaluation of Ceramic Mechanical Properties by Impulse Excitation Techniques: Effects of Heating Temperature and Cooling Rate. Ceram. Int. 2021, 47, 9203–9213. [Google Scholar] [CrossRef]
- Psiuk, B.; Wiecinska, P.; Lipowska, B.; Pietrzak, E.; Podwórny, J. Impulse Excitation Technique IET as a Non-Destructive Method for Determining Changes during the Gelcasting Process. Ceram. Int. 2016, 42, 3989–3996. [Google Scholar] [CrossRef]
- Popov, I.I.; Rossikhin, Y.A.; Shitikova, M.V. Experimental Identification of the Fractional Parameter for a Viscoelastic Model of Concrete at Different Ages Based on the Impulse Excitation Technique. In Advances in Rotor Dynamics, Control, and Structural Health Monitoring; Springer: Singapore, 2020; pp. 349–358. [Google Scholar]
- Mazel, V.; Tchoreloff, P. Applicability of Impulse Excitation Technique as a Tool to Characterize the Elastic Properties of Pharmaceutical Tablets: Experimental and Numerical Study. Int. J. Pharm. 2020, 590, 119892. [Google Scholar] [CrossRef]
- Meynard, J.; Amado-Becker, F.; Tchoreloff, P.; Mazel, V. Characterization of the Viscoelasticity of Pharmaceutical Tablets Using Impulse Excitation Technique. Int. J. Pharm. 2022, 613, 121410. [Google Scholar] [CrossRef]
- Garnier, C.; Pastor, M.-L.; Eyma, F.; Lorrain, B. The Detection of Aeronautical Defects in Situ on Composite Structures Using Non Destructive Testing. Compos. Struct. 2011, 93, 1328–1336. [Google Scholar] [CrossRef] [Green Version]
- Aravindh, S.; Venkatachalam, G. Investigation on Elastic Constants of Microfibril Reinforced Poly Vinyl Chloride Composites Using Impulsive Excitation of Vibration. Polymers 2022, 14, 5083. [Google Scholar] [CrossRef]
- Scislo, L.; Guinchard, M. Non-Invasive Measurements of Ultra-Lightweight Composite Materials Using Laser Doppler Vibrometry System. In Proceedings of the 26th International Congress on Sound and Vibration: Montreal Bridges, Montreal, QC, Canada, 7–11 July 2019; Canadian Acoustical Association: Montreal, QC, Canada, 2019; pp. 1–8. [Google Scholar]
- Meng, Q.; Zhu, S. Developing IoT Sensing System for Construction-Induced Vibration Monitoring and Impact Assessment. Sensors 2020, 20, 6120. [Google Scholar] [CrossRef]
- Tong, X.; Yang, H.; Wang, L.; Miao, Y. The Development and Field Evaluation of an IoT System of Low-Power Vibration for Bridge Health Monitoring. Sensors 2019, 19, 1222. [Google Scholar] [CrossRef] [PubMed] [Green Version]
- Jung, D.; Zhang, Z.; Winslett, M. Vibration Analysis for IoT Enabled Predictive Maintenance. In Proceedings of the 2017 IEEE 33rd International Conference on Data Engineering (ICDE), San Diego, CA, USA, 19–22 April 2017; pp. 1271–1282. [Google Scholar]
- Scislo, L.; Szczepanik-Scislo, N. Influence of Mechanical Ventilation and Cooling Systems on Vibrations of High Precision Machines. E3S Web Conf. 2019, 100, 00080. [Google Scholar] [CrossRef] [Green Version]


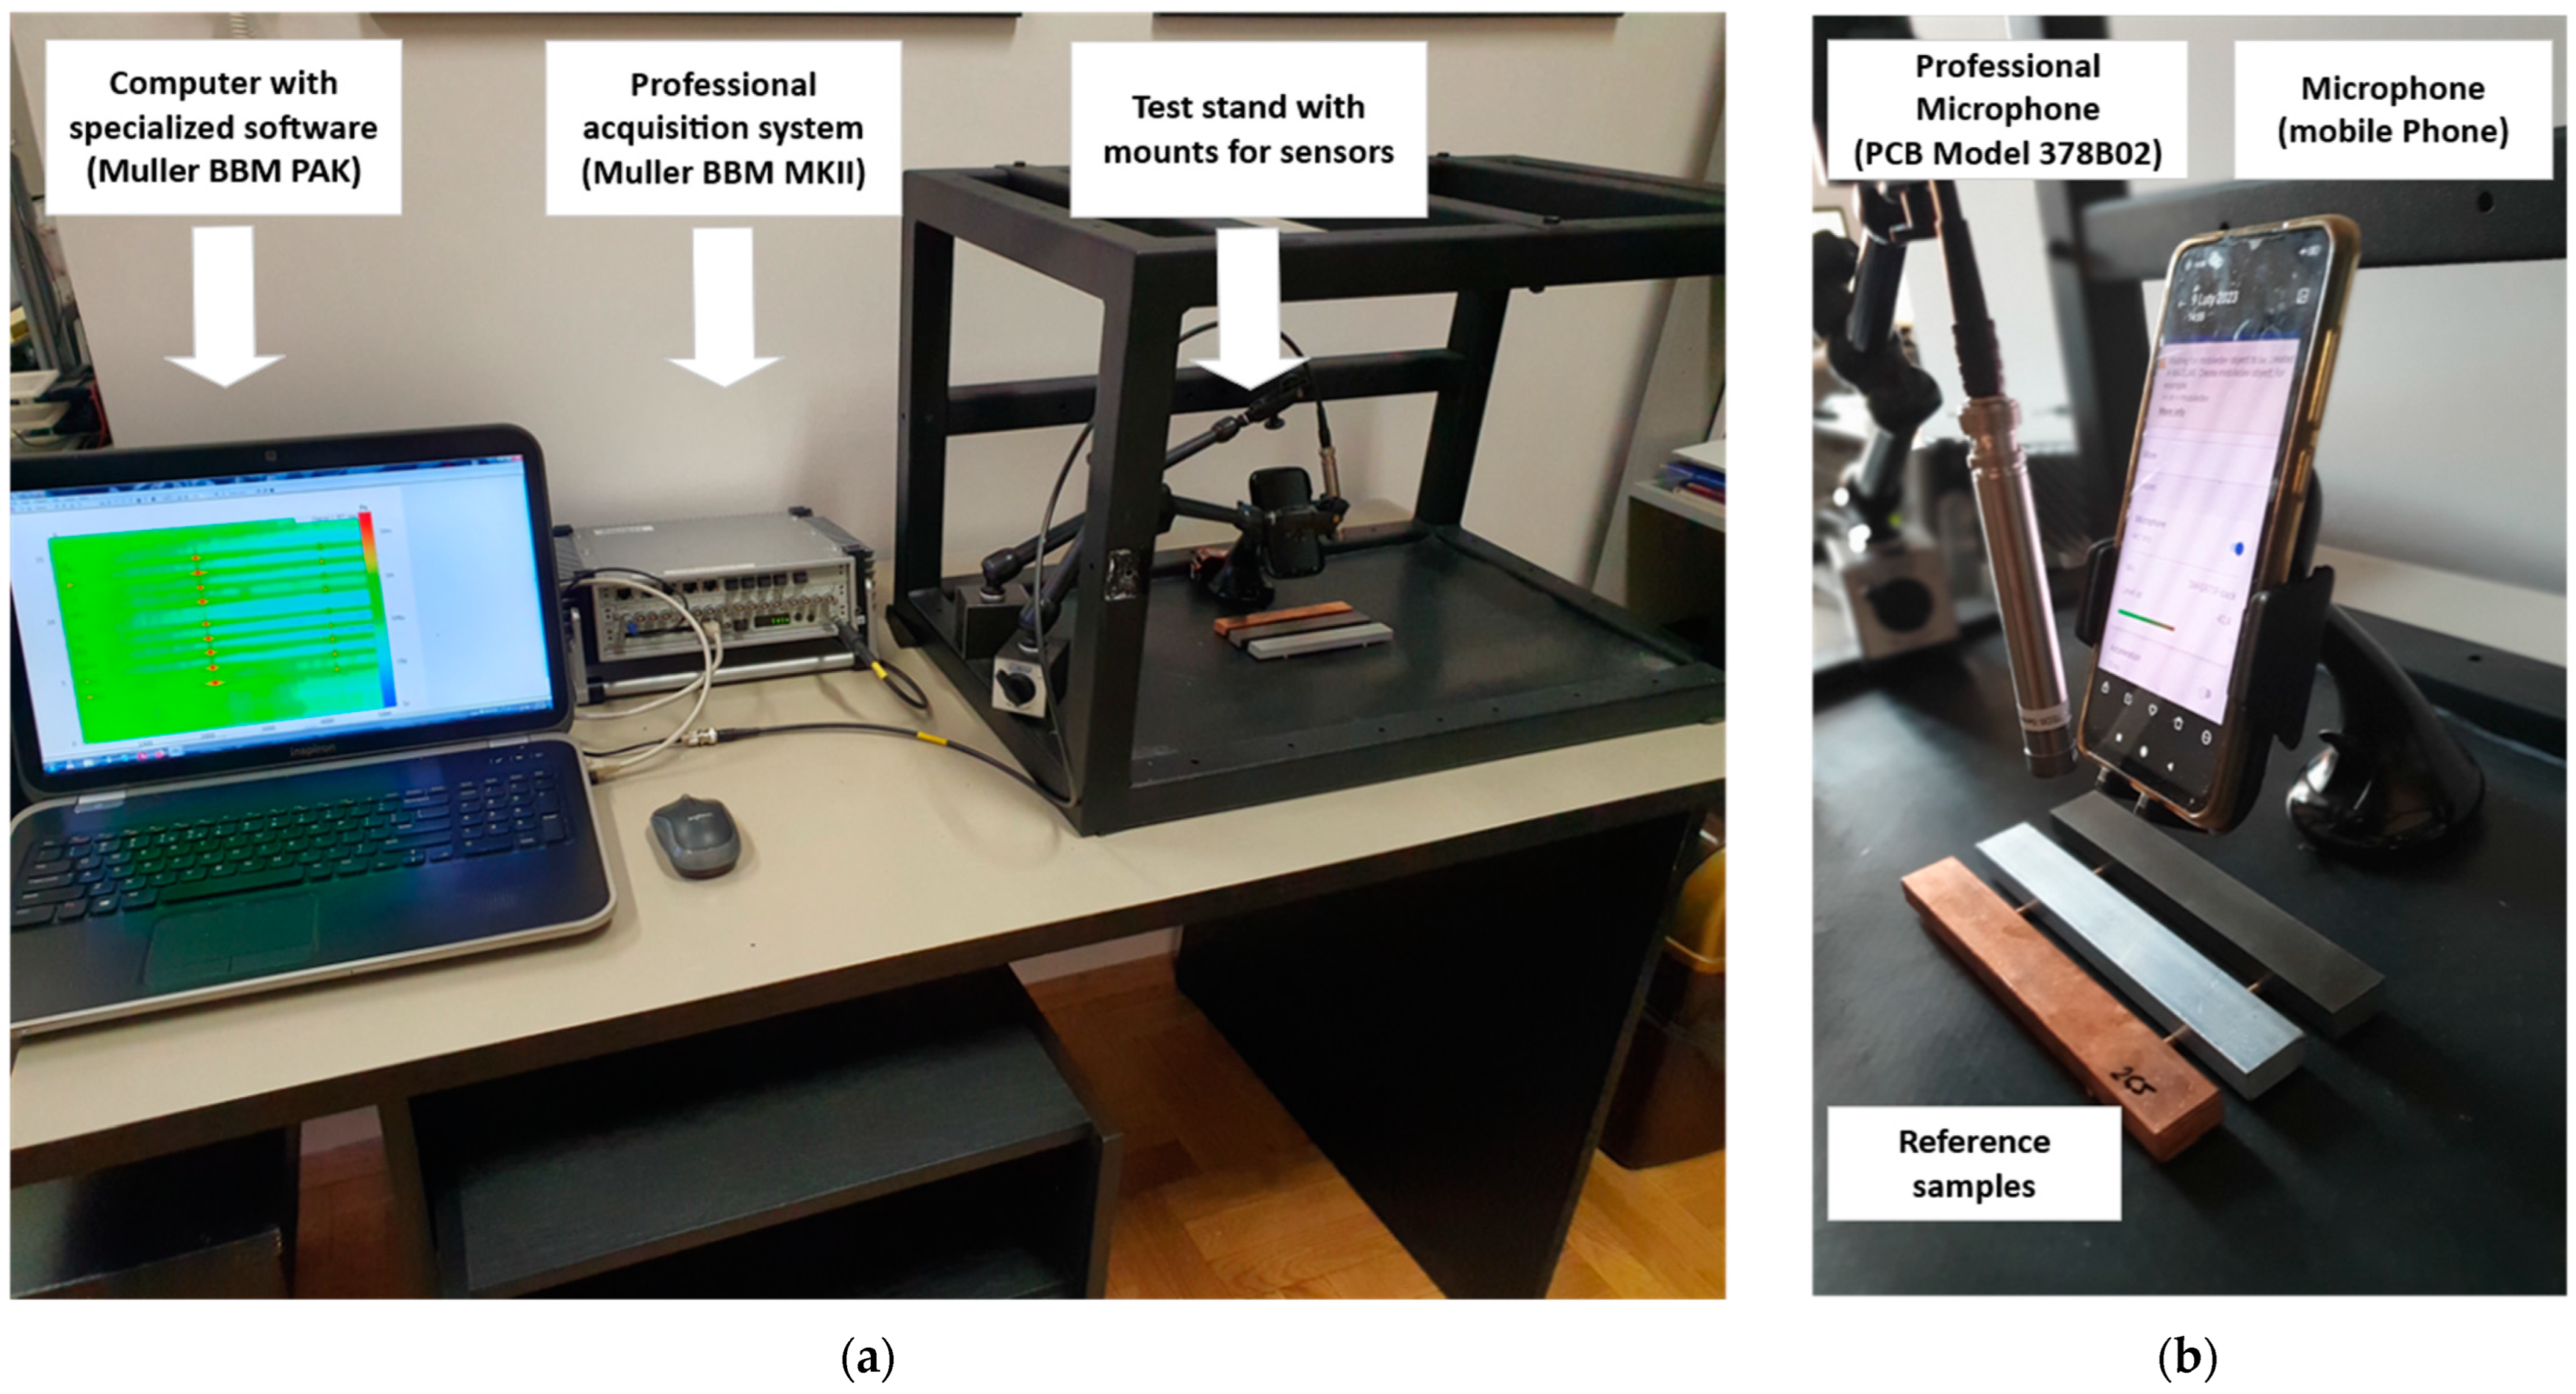
| Property | Microphone PCB Model 378B02 | Microphone Mobile Phone * |
|---|---|---|
| Sensitivity [±1.5 dB] | −26 | −40 |
| Sensitivity [mV/Pa] | 50 | 10 |
| Frequency Range [Hz] | 3.75 to 20,000 | 20–20,000 |
| Sample | Flexural Resonant Frequency ff [kHz] | Torsional Resonant Frequency ft [kHz] | Mass | L [mm] | b [mm] | t [mm] | E [GPa] | G [GPa] | μ [-] |
|---|---|---|---|---|---|---|---|---|---|
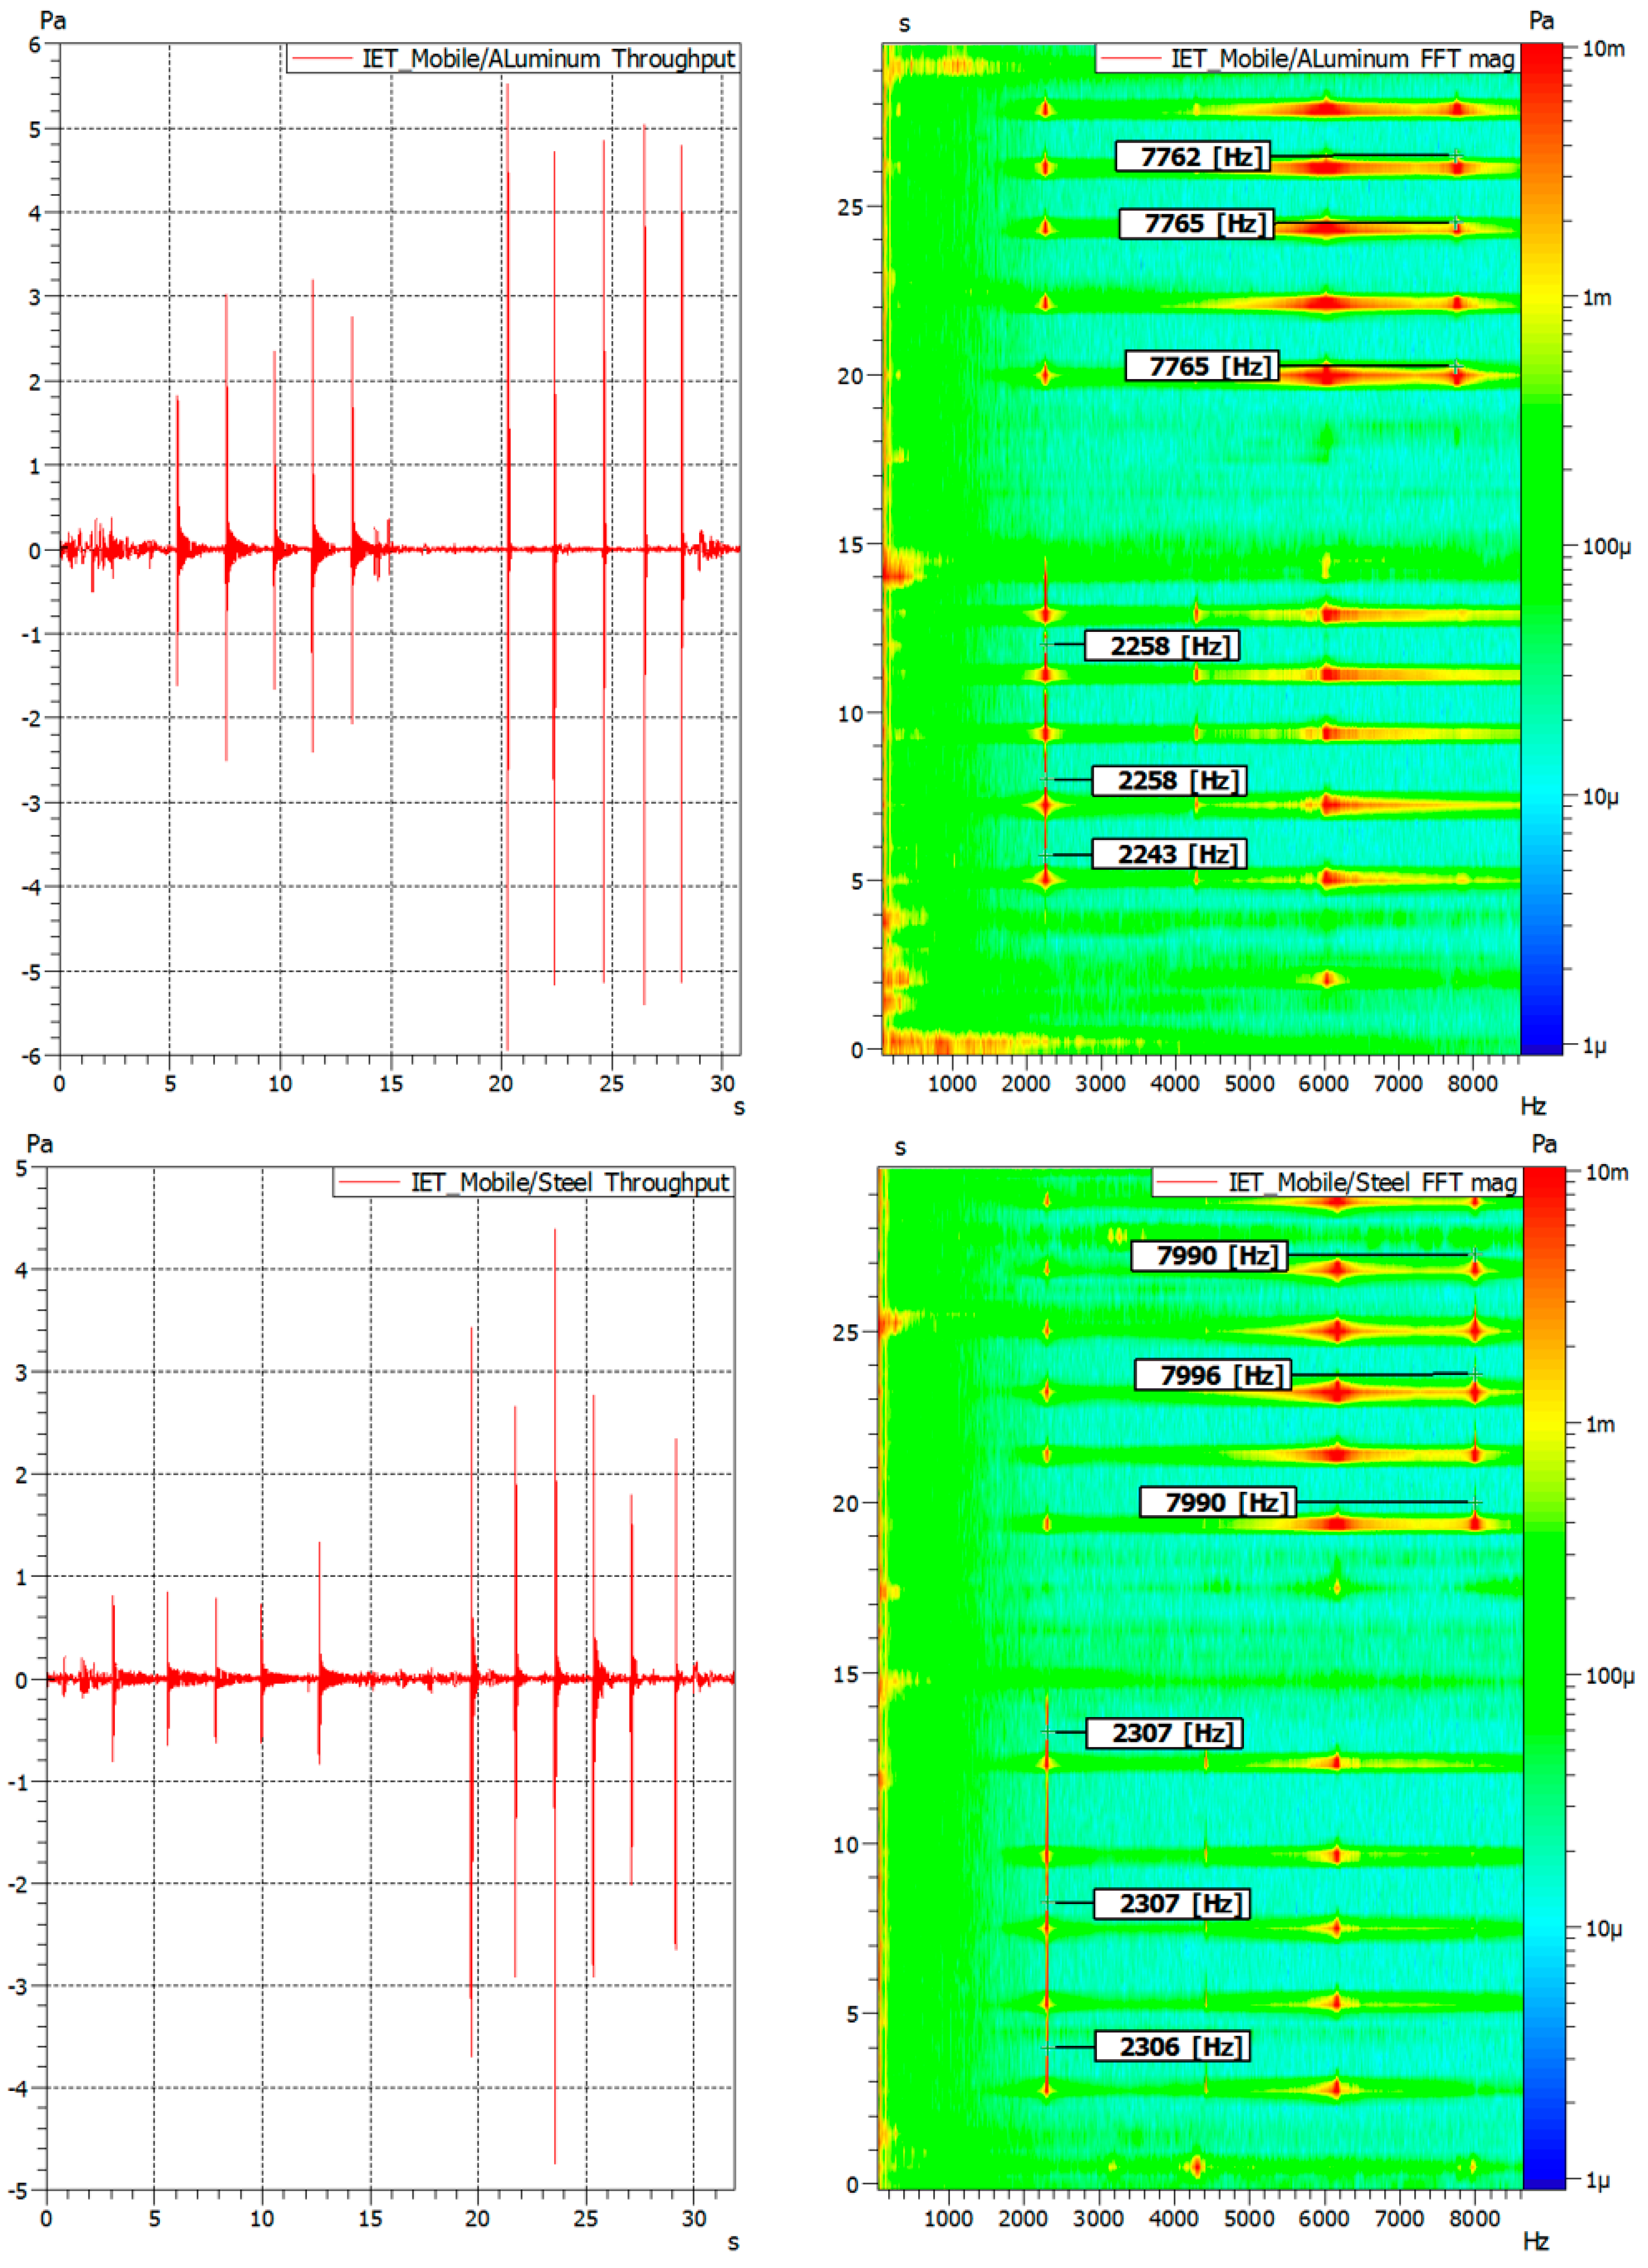
| Aluminum | |||||||||
| Measurement 1 | 2.258 | 7.762 | 81.5 | 150 | 20 | 10 | 66.372 | 26.779 | 0.239 |
| Measurement 2 | 2.258 | 7.765 | 81.5 | 150 | 20 | 10 | 66.372 | 26.800 | 0.238 |
| Measurement 3 | 2.243 | 7.765 | 81.5 | 150 | 20 | 10 | 65.493 | 26.800 | 0.222 |
| Average | 2.253 | 7.764 | 81.5 | 150 | 20 | 10 | 66.079 | 26.793 | 0.233 |
| Steel | |||||||||
| Measurement 1 | 2.307 | 7.990 | 236 | 150 | 20 | 10 | 200.625 | 82.166 | 0.221 |
| Measurement 2 | 2.307 | 7.996 | 236 | 150 | 20 | 10 | 200.625 | 82.289 | 0.219 |
| Measurement 3 | 2.306 | 7.990 | 236 | 150 | 20 | 10 | 200.451 | 82.166 | 0.220 |
| Average | 2.307 | 7.992 | 236 | 150 | 20 | 10 | 200.567 | 82.207 | 0.220 |
| Copper | |||||||||
| Measurement 1 | 1.648 | 5.600 | 265 | 150 | 20 | 10 | 114.958 | 45.322 | 0.268 |
| Measurement 2 | 1.648 | 5.600 | 265 | 150 | 20 | 10 | 114.958 | 45.322 | 0.268 |
| Measurement 3 | 1.648 | 5.600 | 265 | 150 | 20 | 10 | 114.958 | 45.322 | 0.268 |
| Average | 1.648 | 5.600 | 265 | 150 | 20 | 10 | 114.958 | 45.322 | 0.268 |
| Sample | Flexural Resonant Frequency ff [kHz] | Torsional Resonant Frequency ft [kHz] | E [GPa] | G [GPa] | μ [-] |
|---|---|---|---|---|---|
| Aluminum | |||||
| Measurement 1 | 2.247 | 7.783 | 65.727 | 26.924 | 0.221 |
| Measurement 2 | 2.244 | 7.781 | 65.551 | 26.910 | 0.218 |
| Measurement 3 | 2.243 | 7.781 | 65.493 | 26.910 | 0.217 |
| Average | 2.245 | 7.782 | 65.590 | 26.915 | 0.218 |
| Steel | |||||
| Measurement 1 | 2.291 | 7.995 | 197.851 | 82.269 | 0.202 |
| Measurement 2 | 2.294 | 7.994 | 198.370 | 82.248 | 0.206 |
| Measurement 3 | 2.294 | 7.995 | 198.370 | 82.269 | 0.206 |
| Average | 2.293 | 7.995 | 198.197 | 82.262 | 0.205 |
| Copper | |||||
| Measurement 1 | 1.646 | 5.595 | 114.679 | 45.241 | 0.267 |
| Measurement 2 | 1.645 | 5.596 | 114.539 | 45.257 | 0.265 |
| Measurement 3 | 1.646 | 5.596 | 114.679 | 45.257 | 0.267 |
| Average | 1.646 | 5.596 | 114.632 | 45.252 | 0.267 |
| Sample | Muller BBM | Mobile Phone | Difference |
|---|---|---|---|
| Aluminum | |||
| Flexural Resonant Frequency [kHz] | 2.253 | 2.245 | 0.36% |
| Torsional Resonant Frequency [kHz] | 7.764 | 7.782 | 0.23% |
| E [GPa] | 66.079 | 65.590 | 0.74% |
| G [GPa] | 26.793 | 26.915 | 0.45% |
| Steel | |||
| Flexural Resonant Frequency [kHz] | 2.307 | 2.293 | 0.61% |
| Torsional Resonant Frequency [kHz] | 7.992 | 7.995 | 0.04% |
| E [GPa] | 200.567 | 198.197 | 1.19% |
| G [GPa] | 82.207 | 82.262 | 0.07% |
| Copper | |||
| Flexural Resonant Frequency [kHz] | 1.648 | 1.646 | 0.12% |
| Torsional Resonant Frequency [kHz] | 5.600 | 5.596 | 0.07% |
| E [GPa] | 114.958 | 114.632 | 0.28% |
| G [GPa] | 45.322 | 45.252 | 0.15% |
Disclaimer/Publisher’s Note: The statements, opinions and data contained in all publications are solely those of the individual author(s) and contributor(s) and not of MDPI and/or the editor(s). MDPI and/or the editor(s) disclaim responsibility for any injury to people or property resulting from any ideas, methods, instructions or products referred to in the content. |
© 2023 by the author. Licensee MDPI, Basel, Switzerland. This article is an open access article distributed under the terms and conditions of the Creative Commons Attribution (CC BY) license (https://creativecommons.org/licenses/by/4.0/).
Share and Cite
Scislo, L. Verification of Mechanical Properties Identification Based on Impulse Excitation Technique and Mobile Device Measurements. Sensors 2023, 23, 5639. https://doi.org/10.3390/s23125639
Scislo L. Verification of Mechanical Properties Identification Based on Impulse Excitation Technique and Mobile Device Measurements. Sensors. 2023; 23(12):5639. https://doi.org/10.3390/s23125639
Chicago/Turabian StyleScislo, Lukasz. 2023. "Verification of Mechanical Properties Identification Based on Impulse Excitation Technique and Mobile Device Measurements" Sensors 23, no. 12: 5639. https://doi.org/10.3390/s23125639