
Flexible Seven-in-One Microsensor Embedded in High-Pressure Proton Exchange Membrane Water Electrolyzer for Real-Time Microscopic Monitoring
Abstract
:1. Introduction
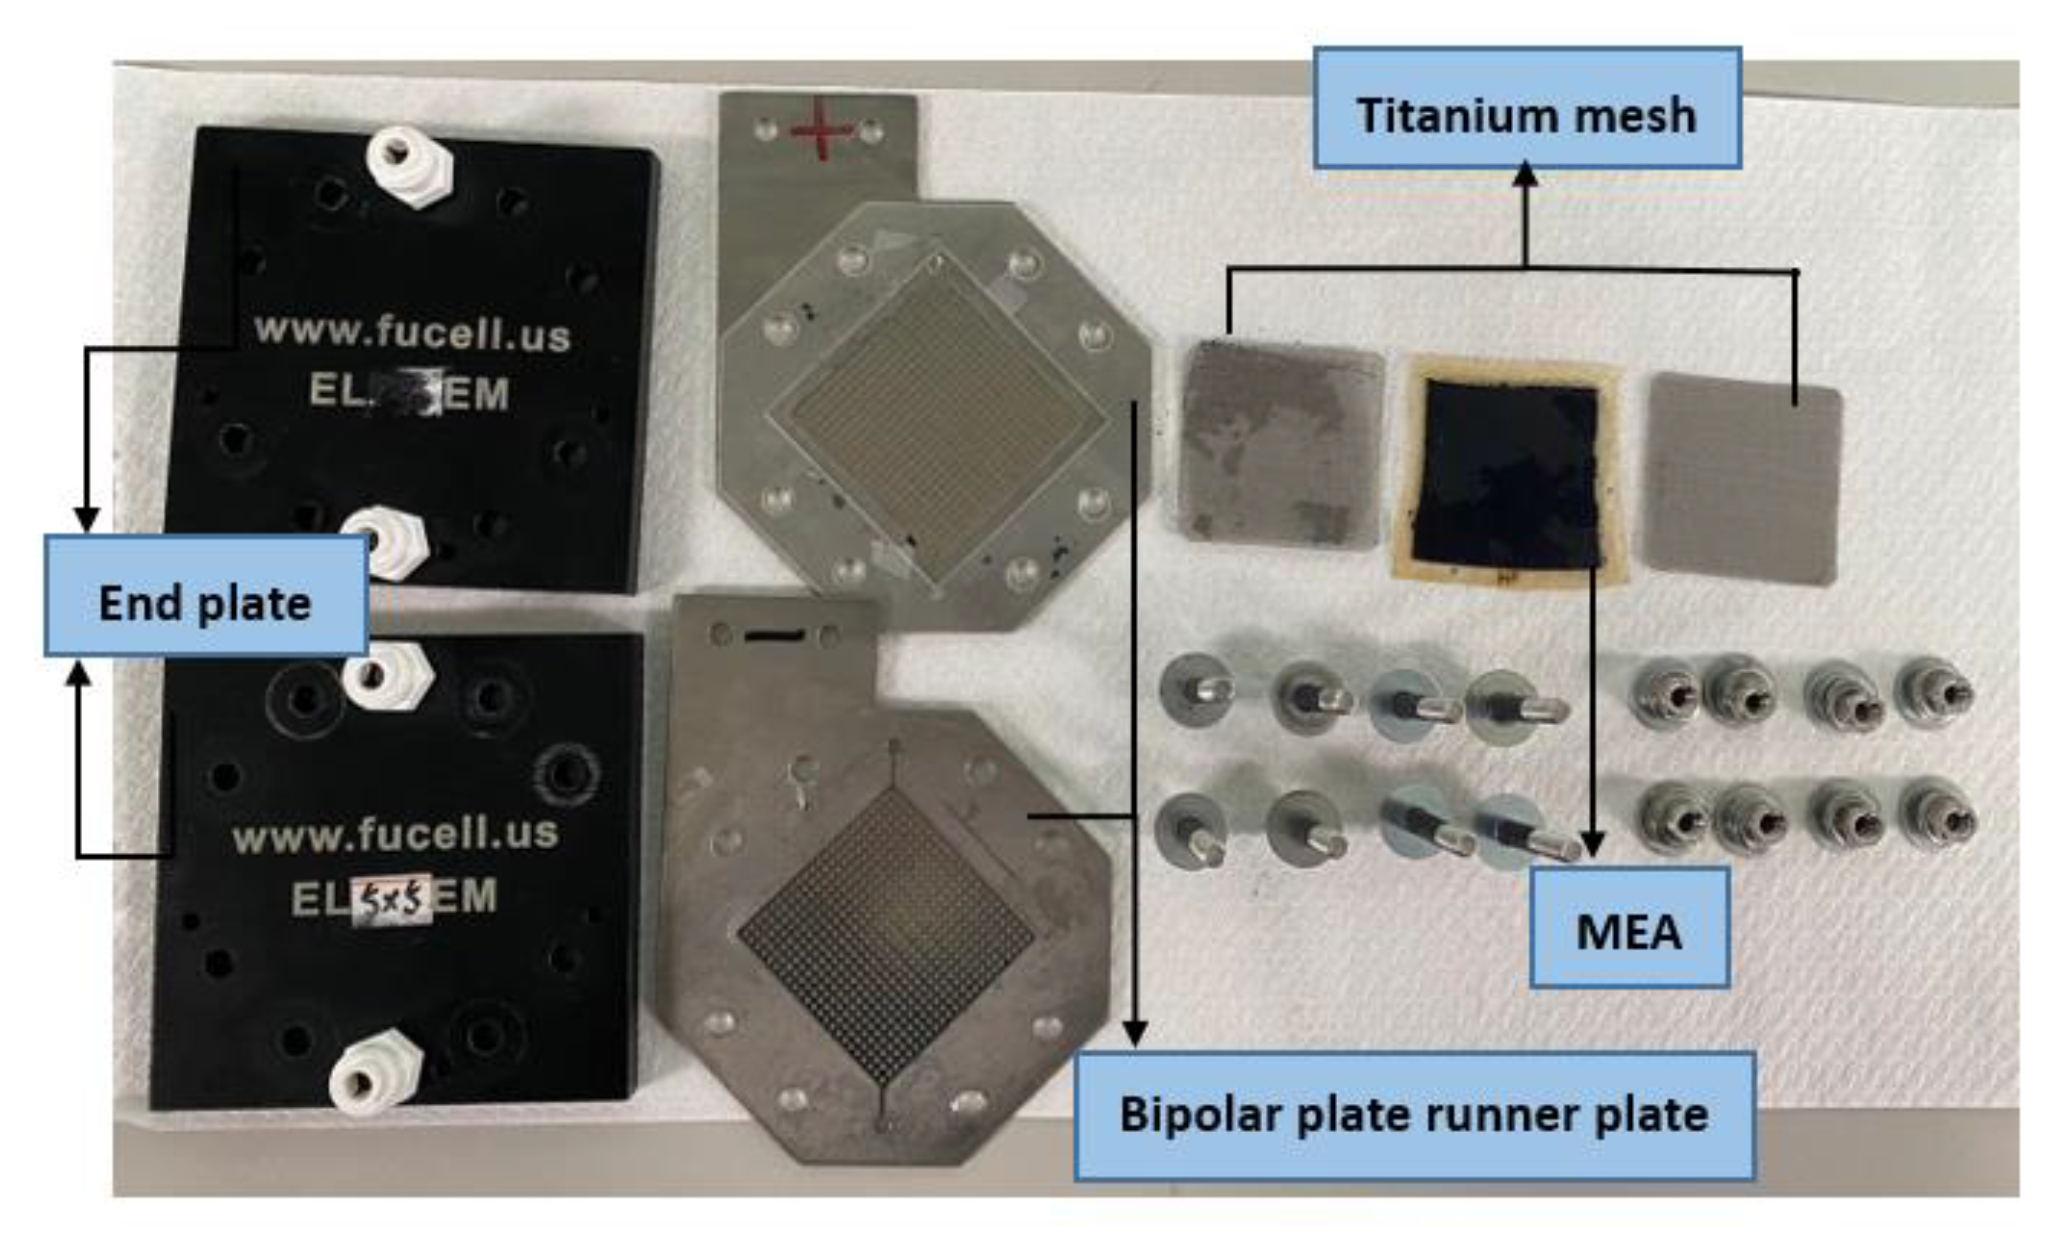
2. High-Pressure PEMWE
2.1. High-Pressure PEMWE Design
2.2. End Plate
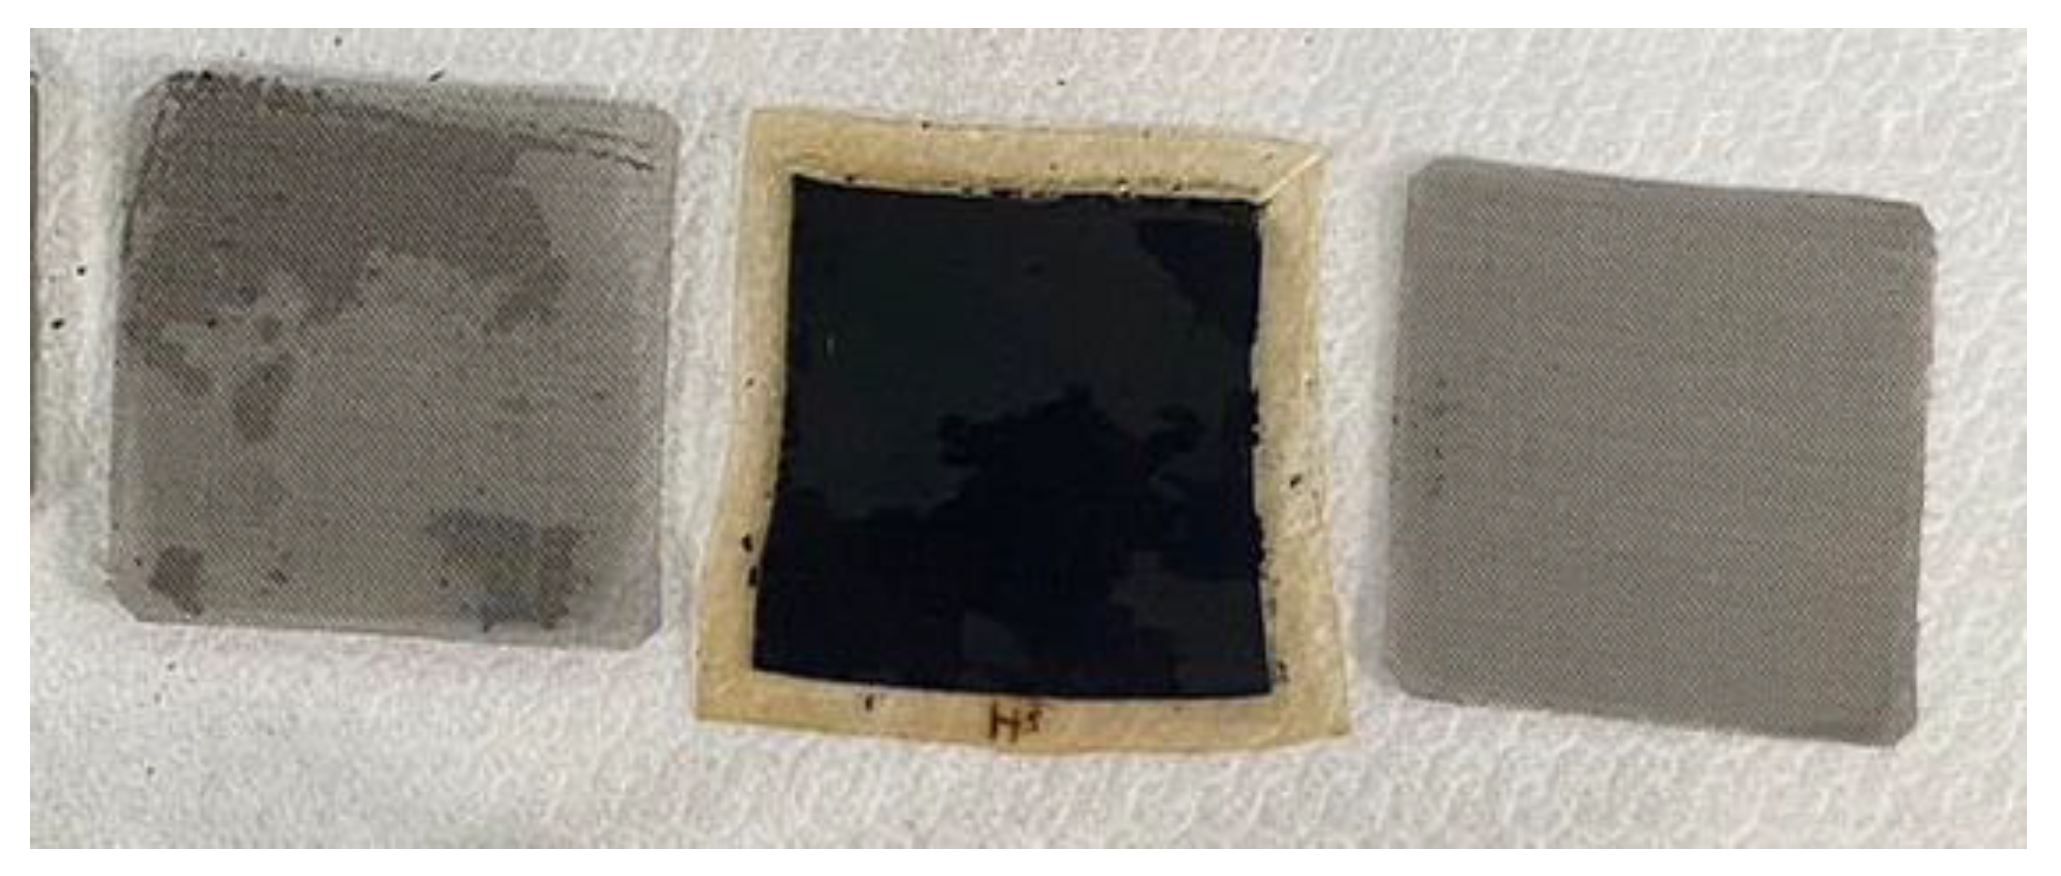
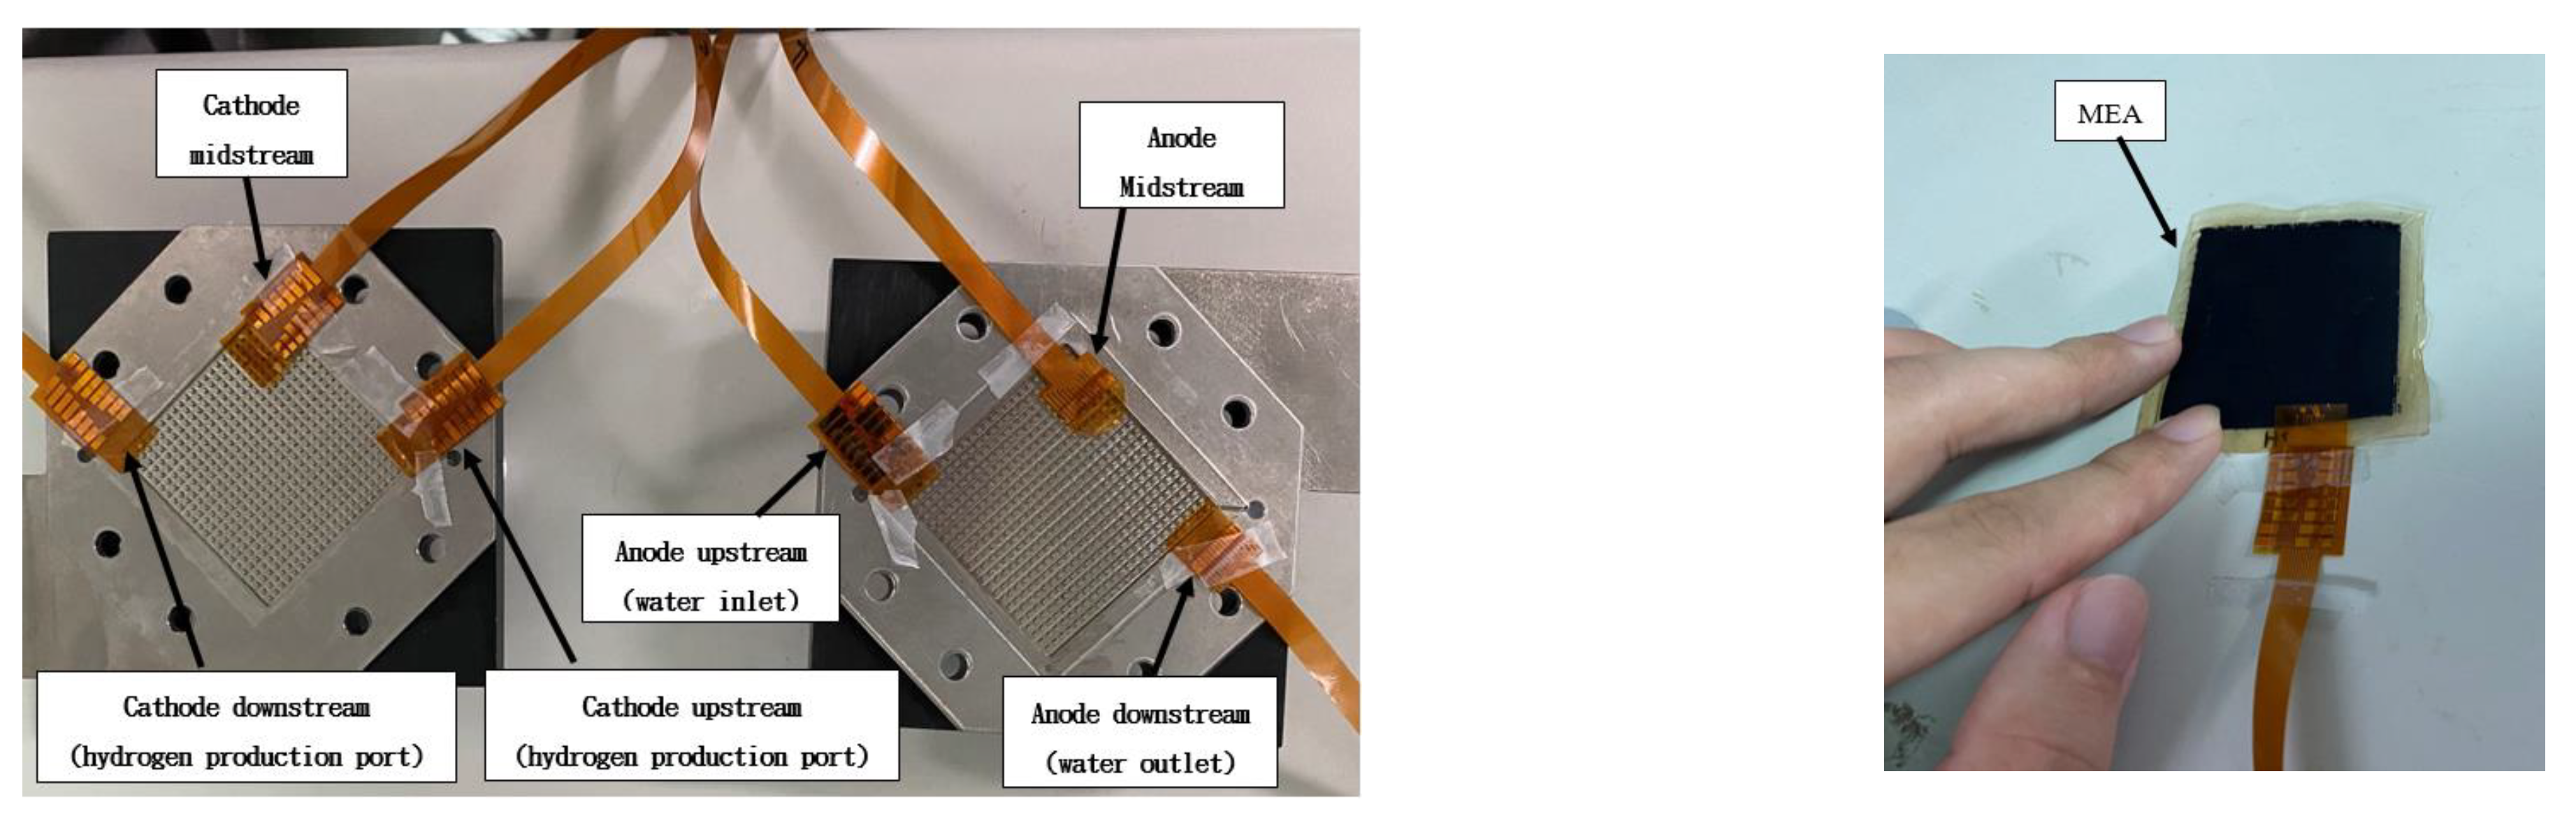
2.3. MEA
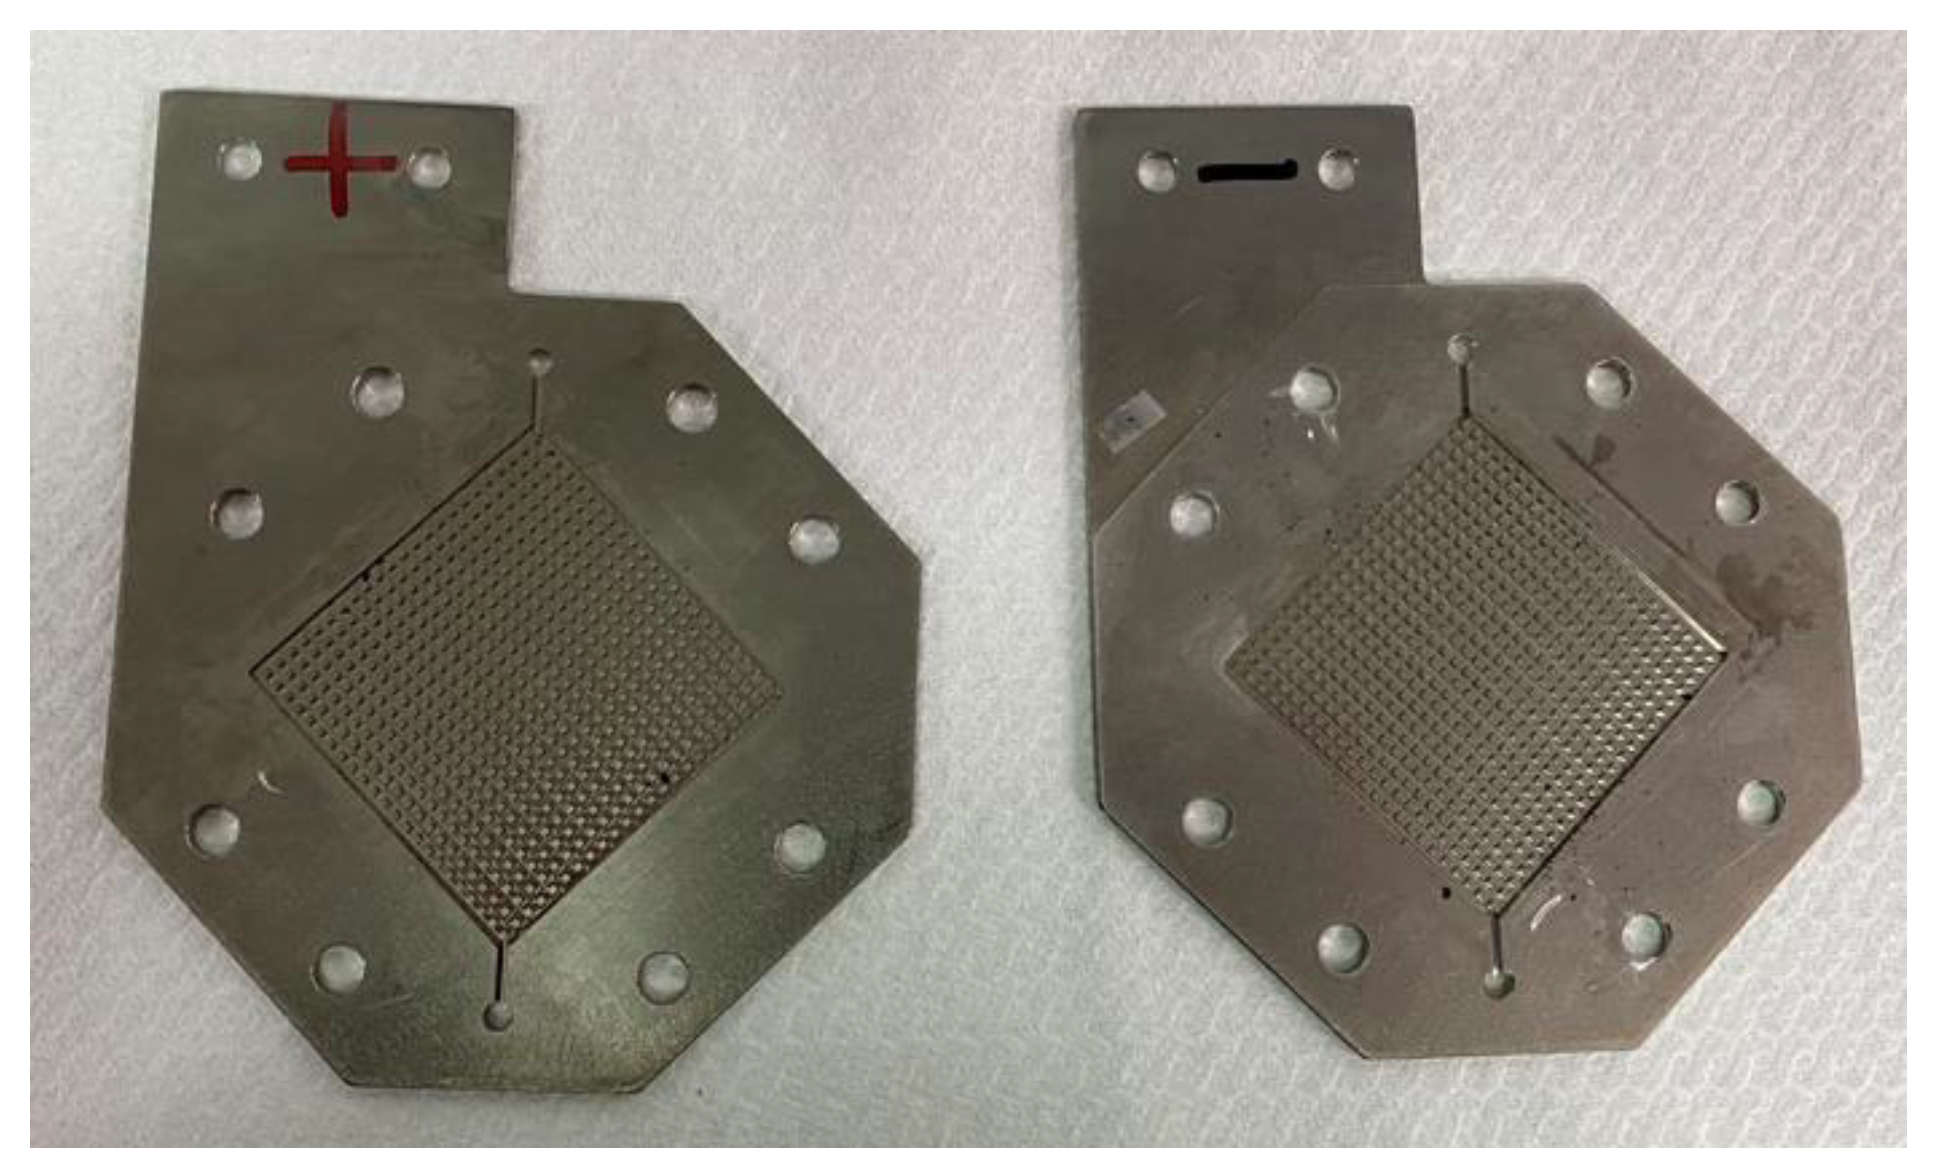
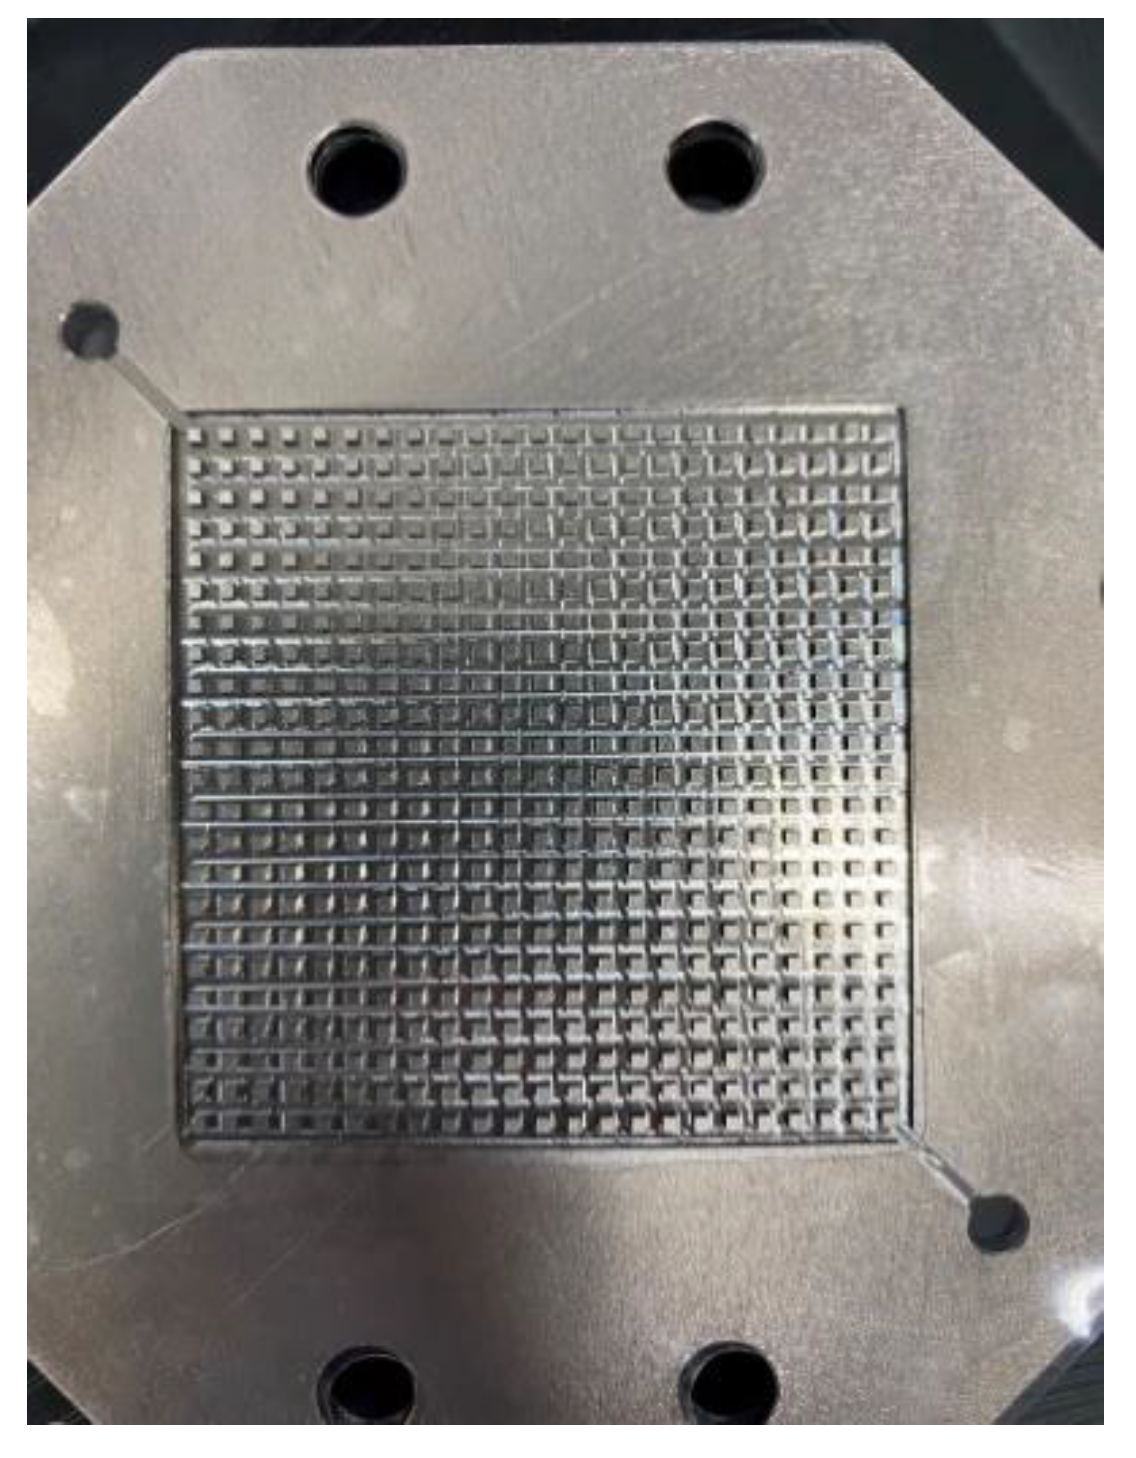
2.4. Bipolar Plate Runner Design
3. The Principle of the High-Voltage Flexible Seven-in-One Microsensor
3.1. The Principle of Microvoltage Sensor
3.2. The Principle of Microcurrent Sensor
3.3. The Principle of Microtemperature Sensor
3.4. The Principle of Microhumidity Sensor
3.5. The Principle of Microflow Sensor
3.6. The Principle of Micropressure Sensor
3.7. The Principle of Microhydrogen Sensor
4. Microscopic Monitoring of High-Pressure PEMWE
5. Microscopic Monitoring of High-Pressure PEMWE
5.1. Real-Time Microscopic Monitoring of High-Pressure PEMWE
5.2. High-Pressure PEMWE Testing Environment
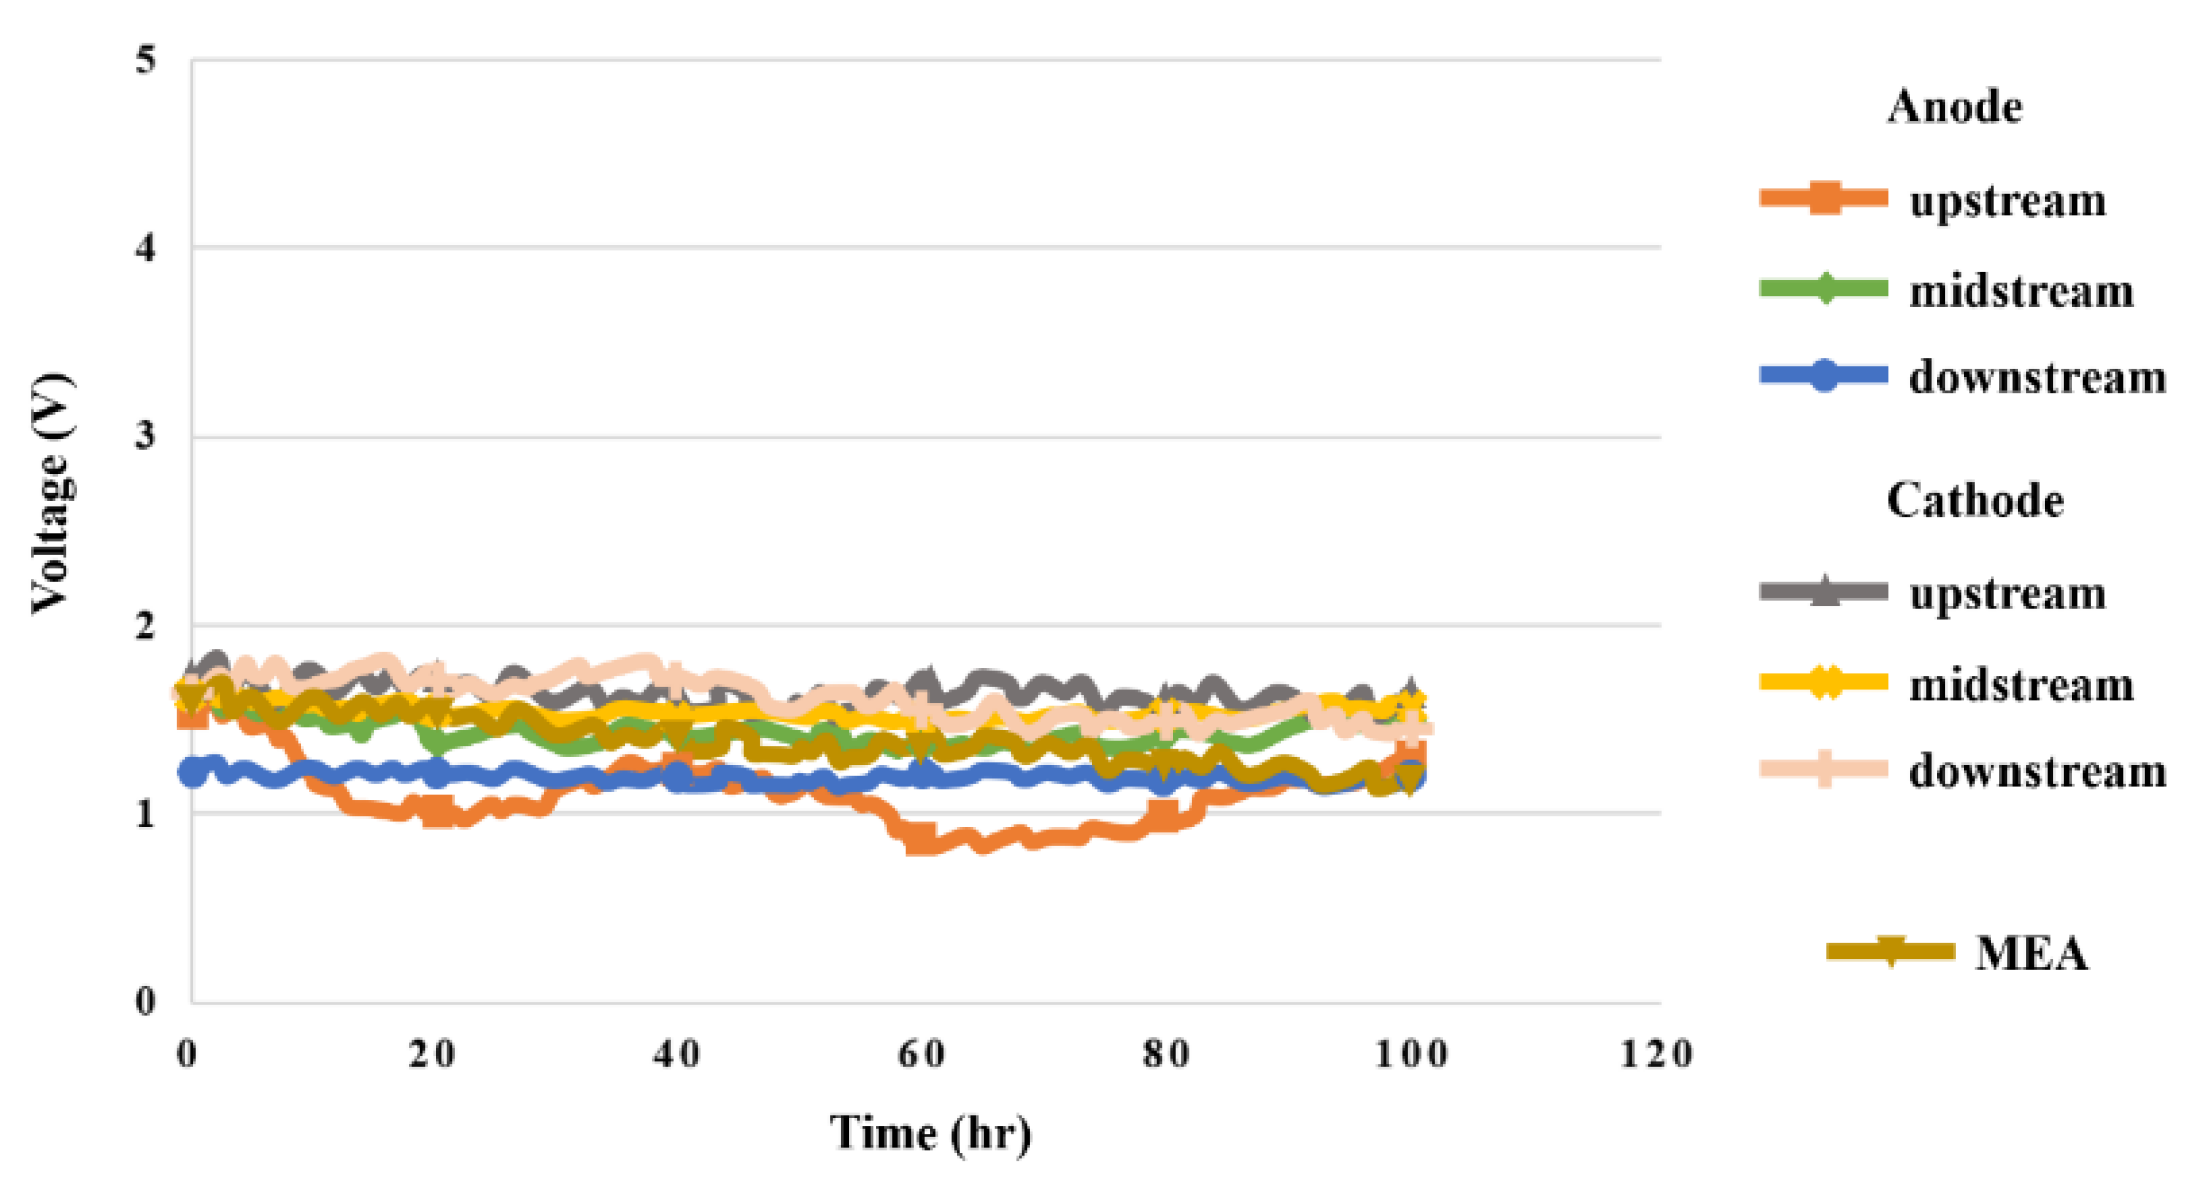
5.3. Voltage in High-Pressure PEMWE
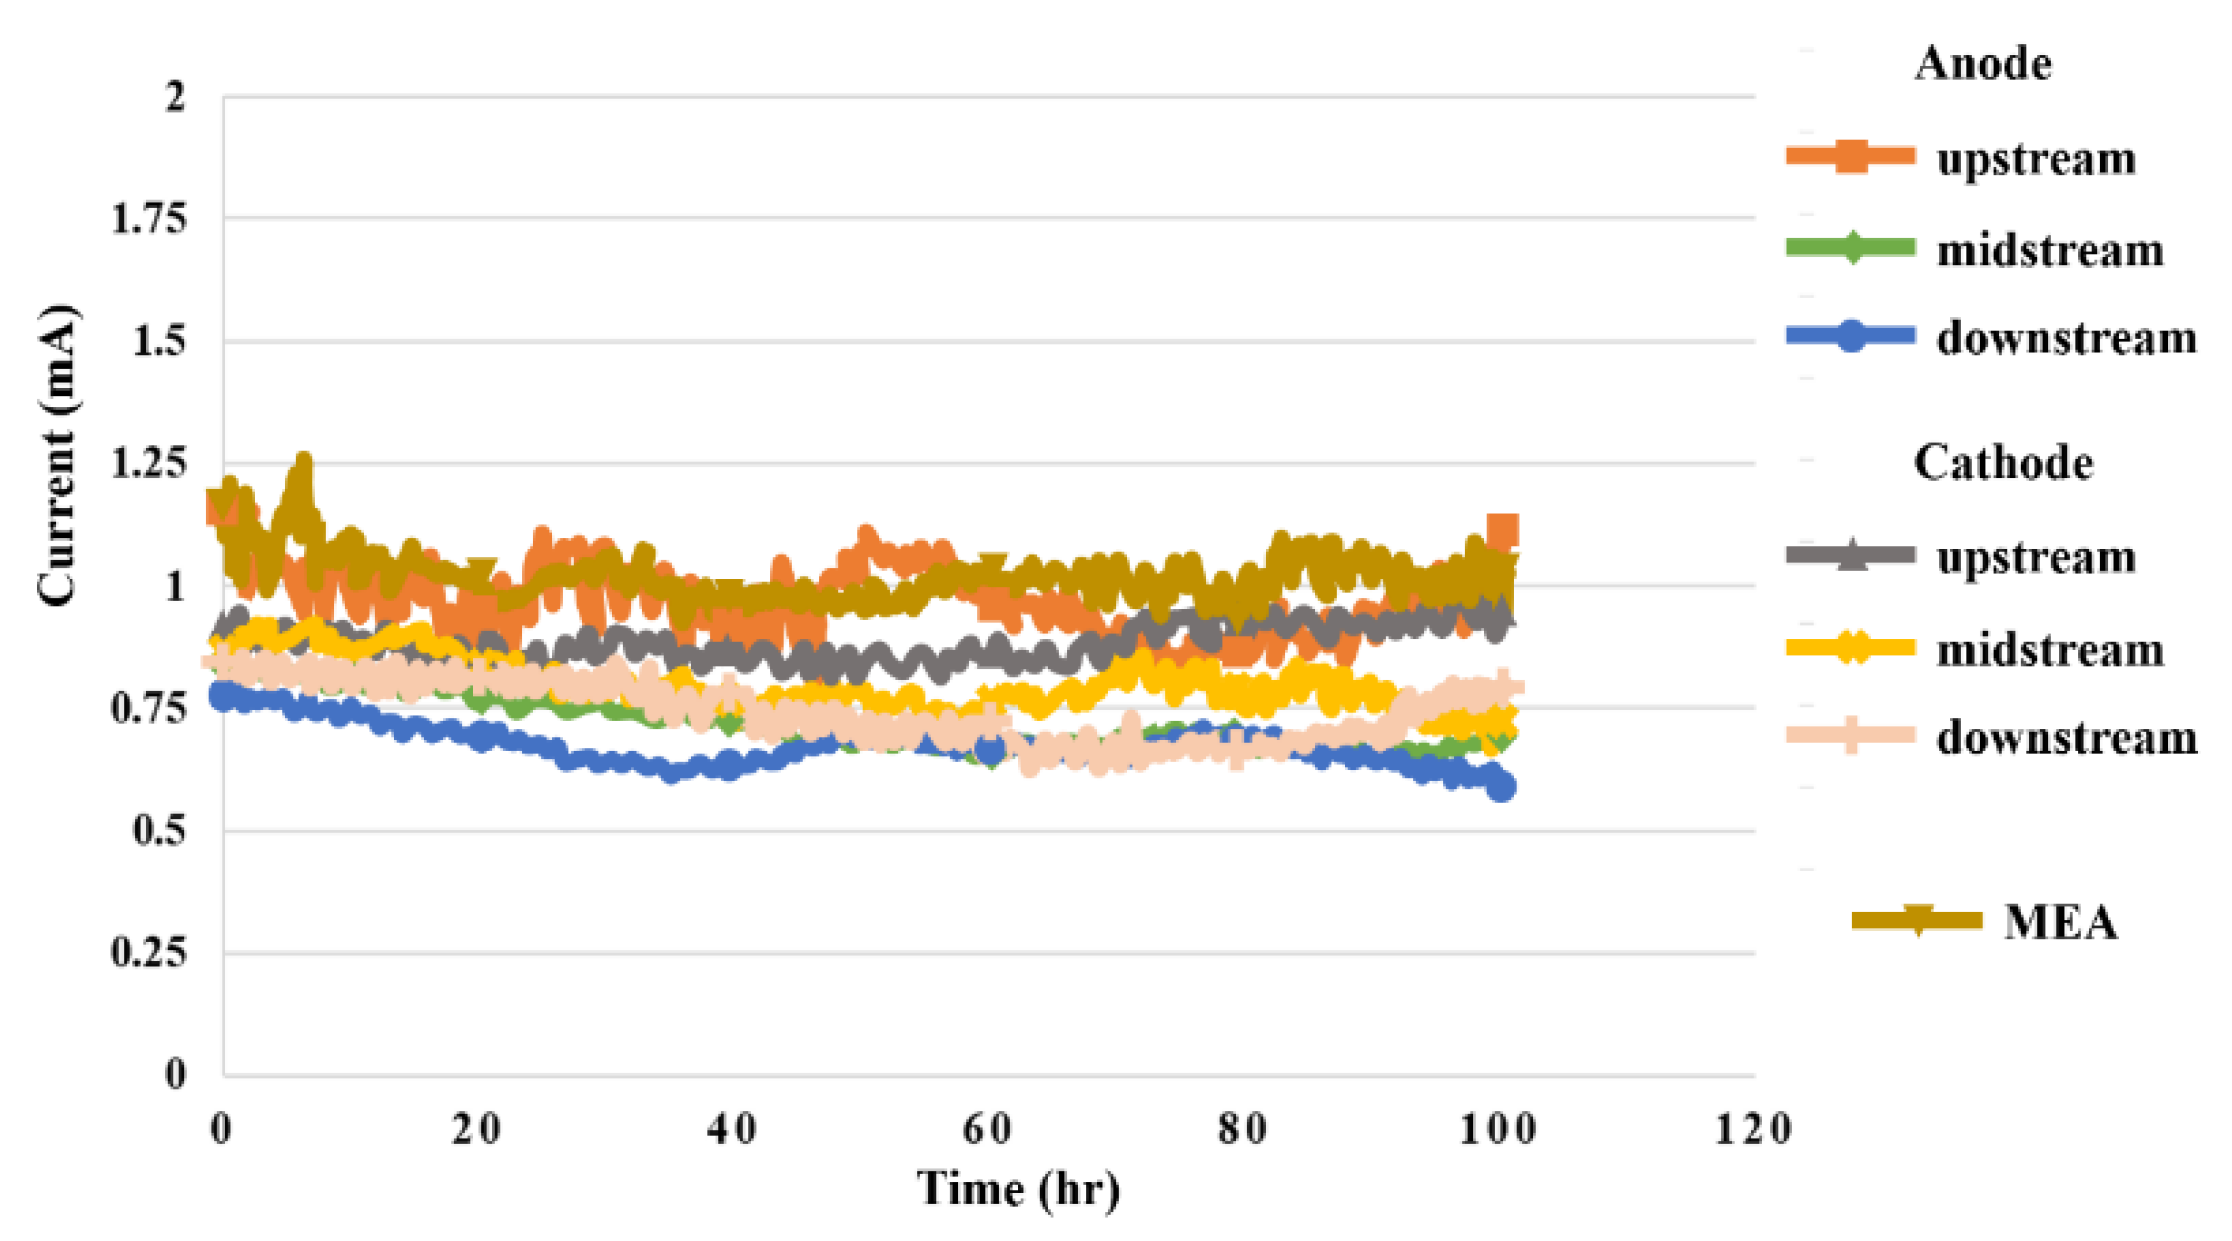
5.4. Current in High-Pressure PEMWE
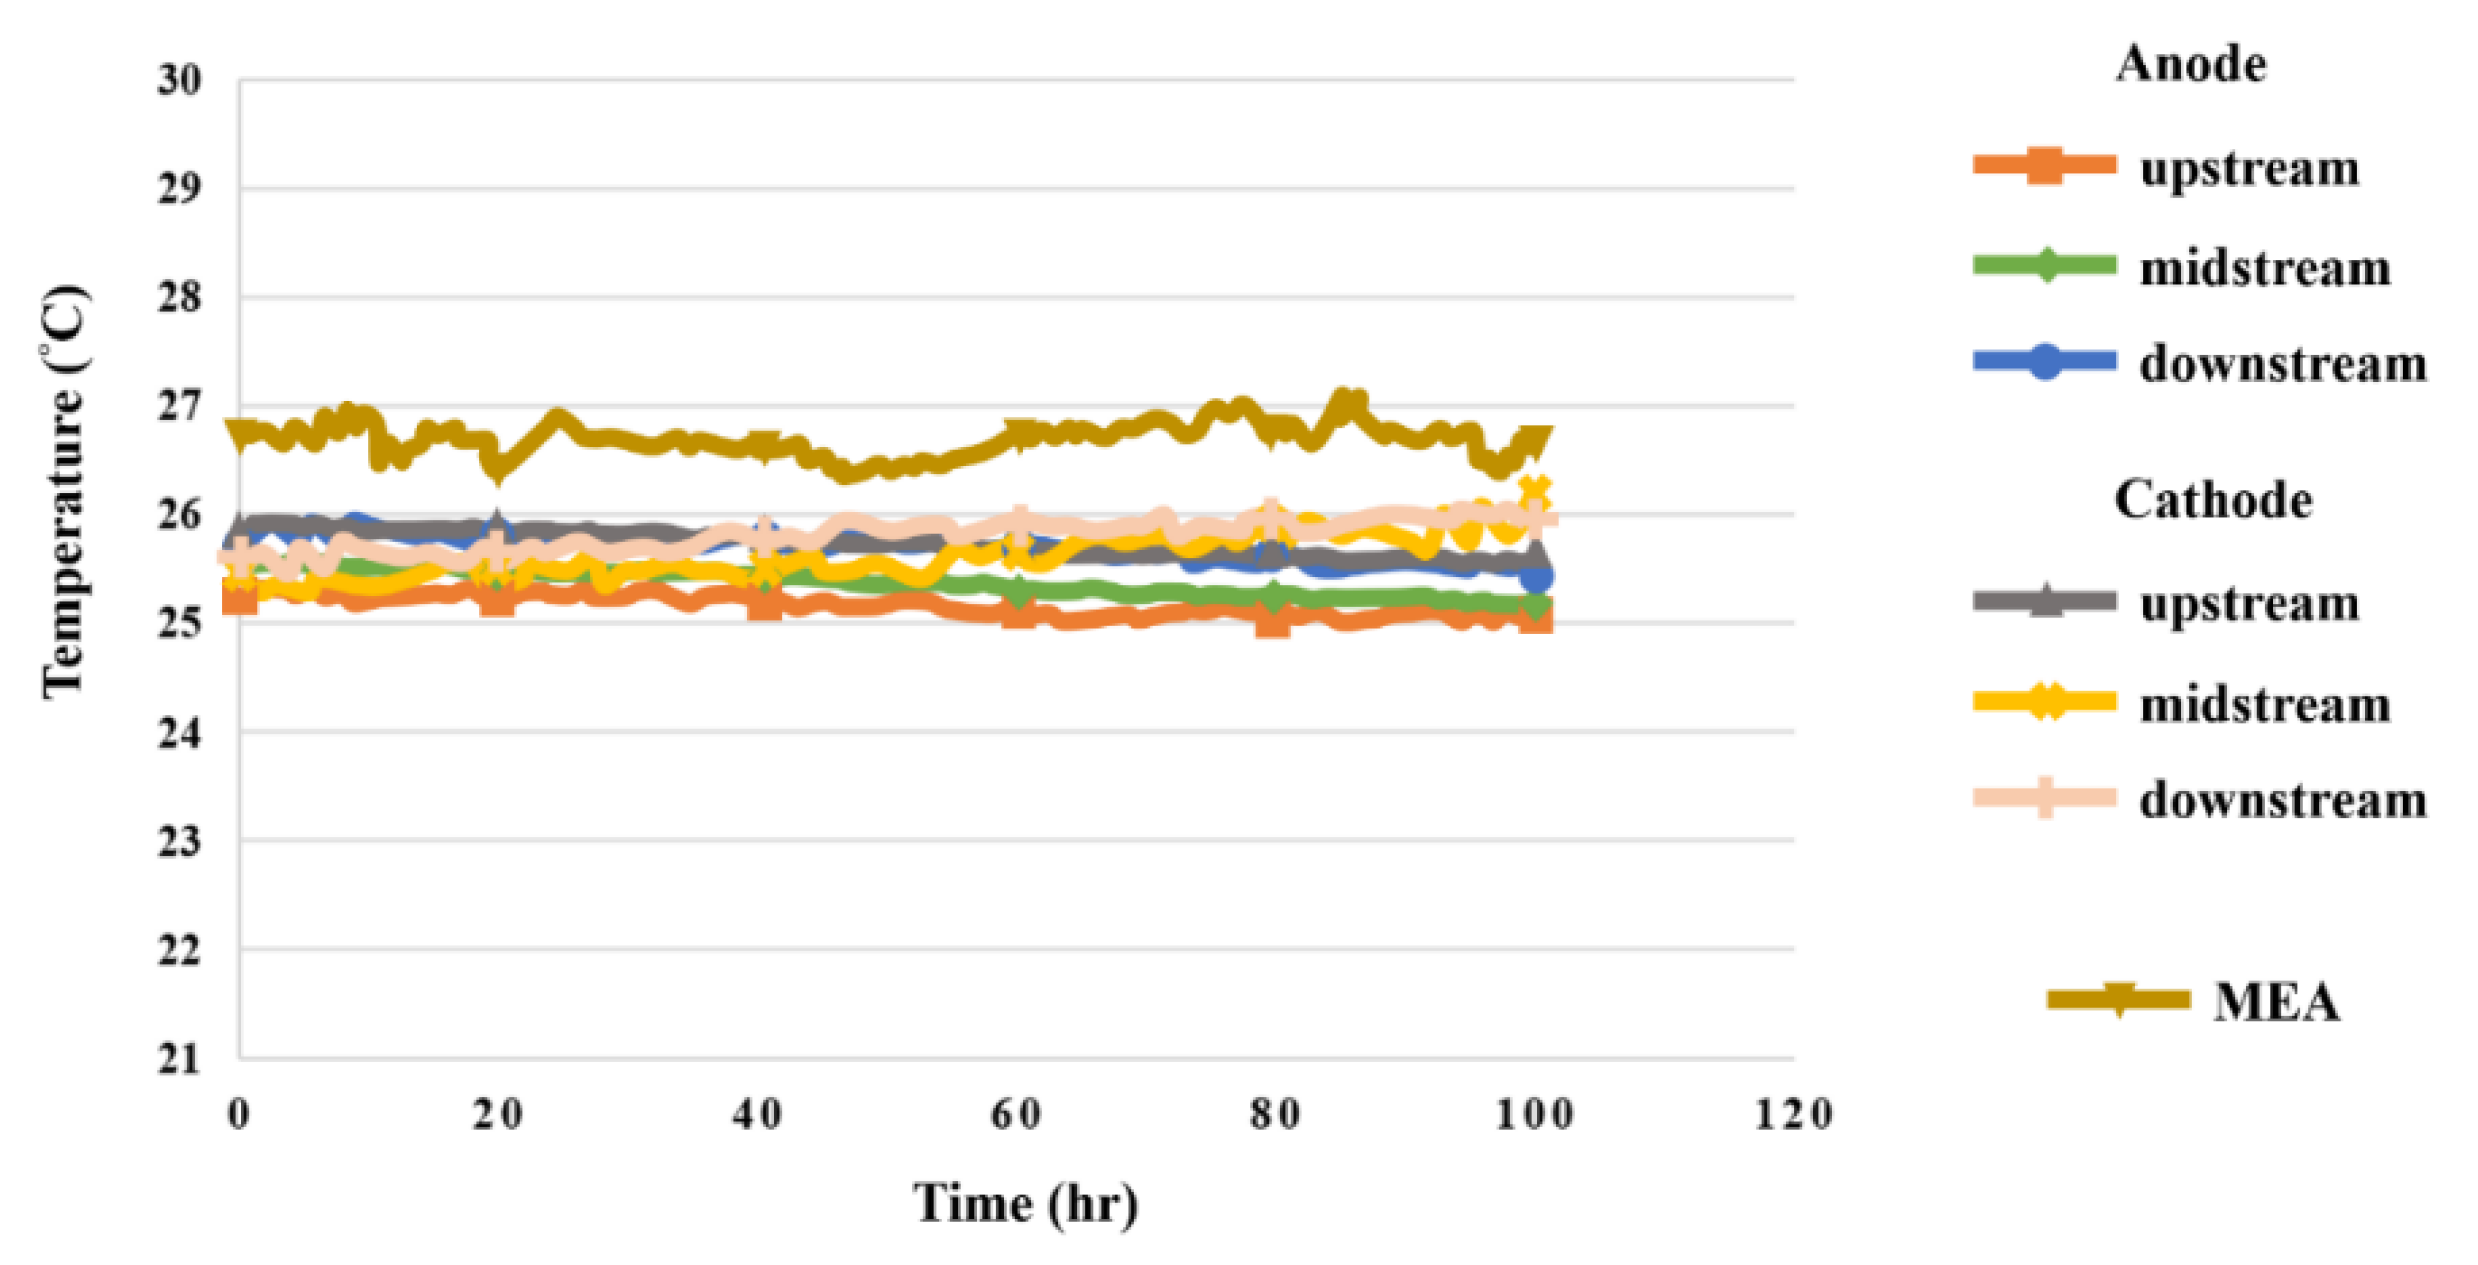
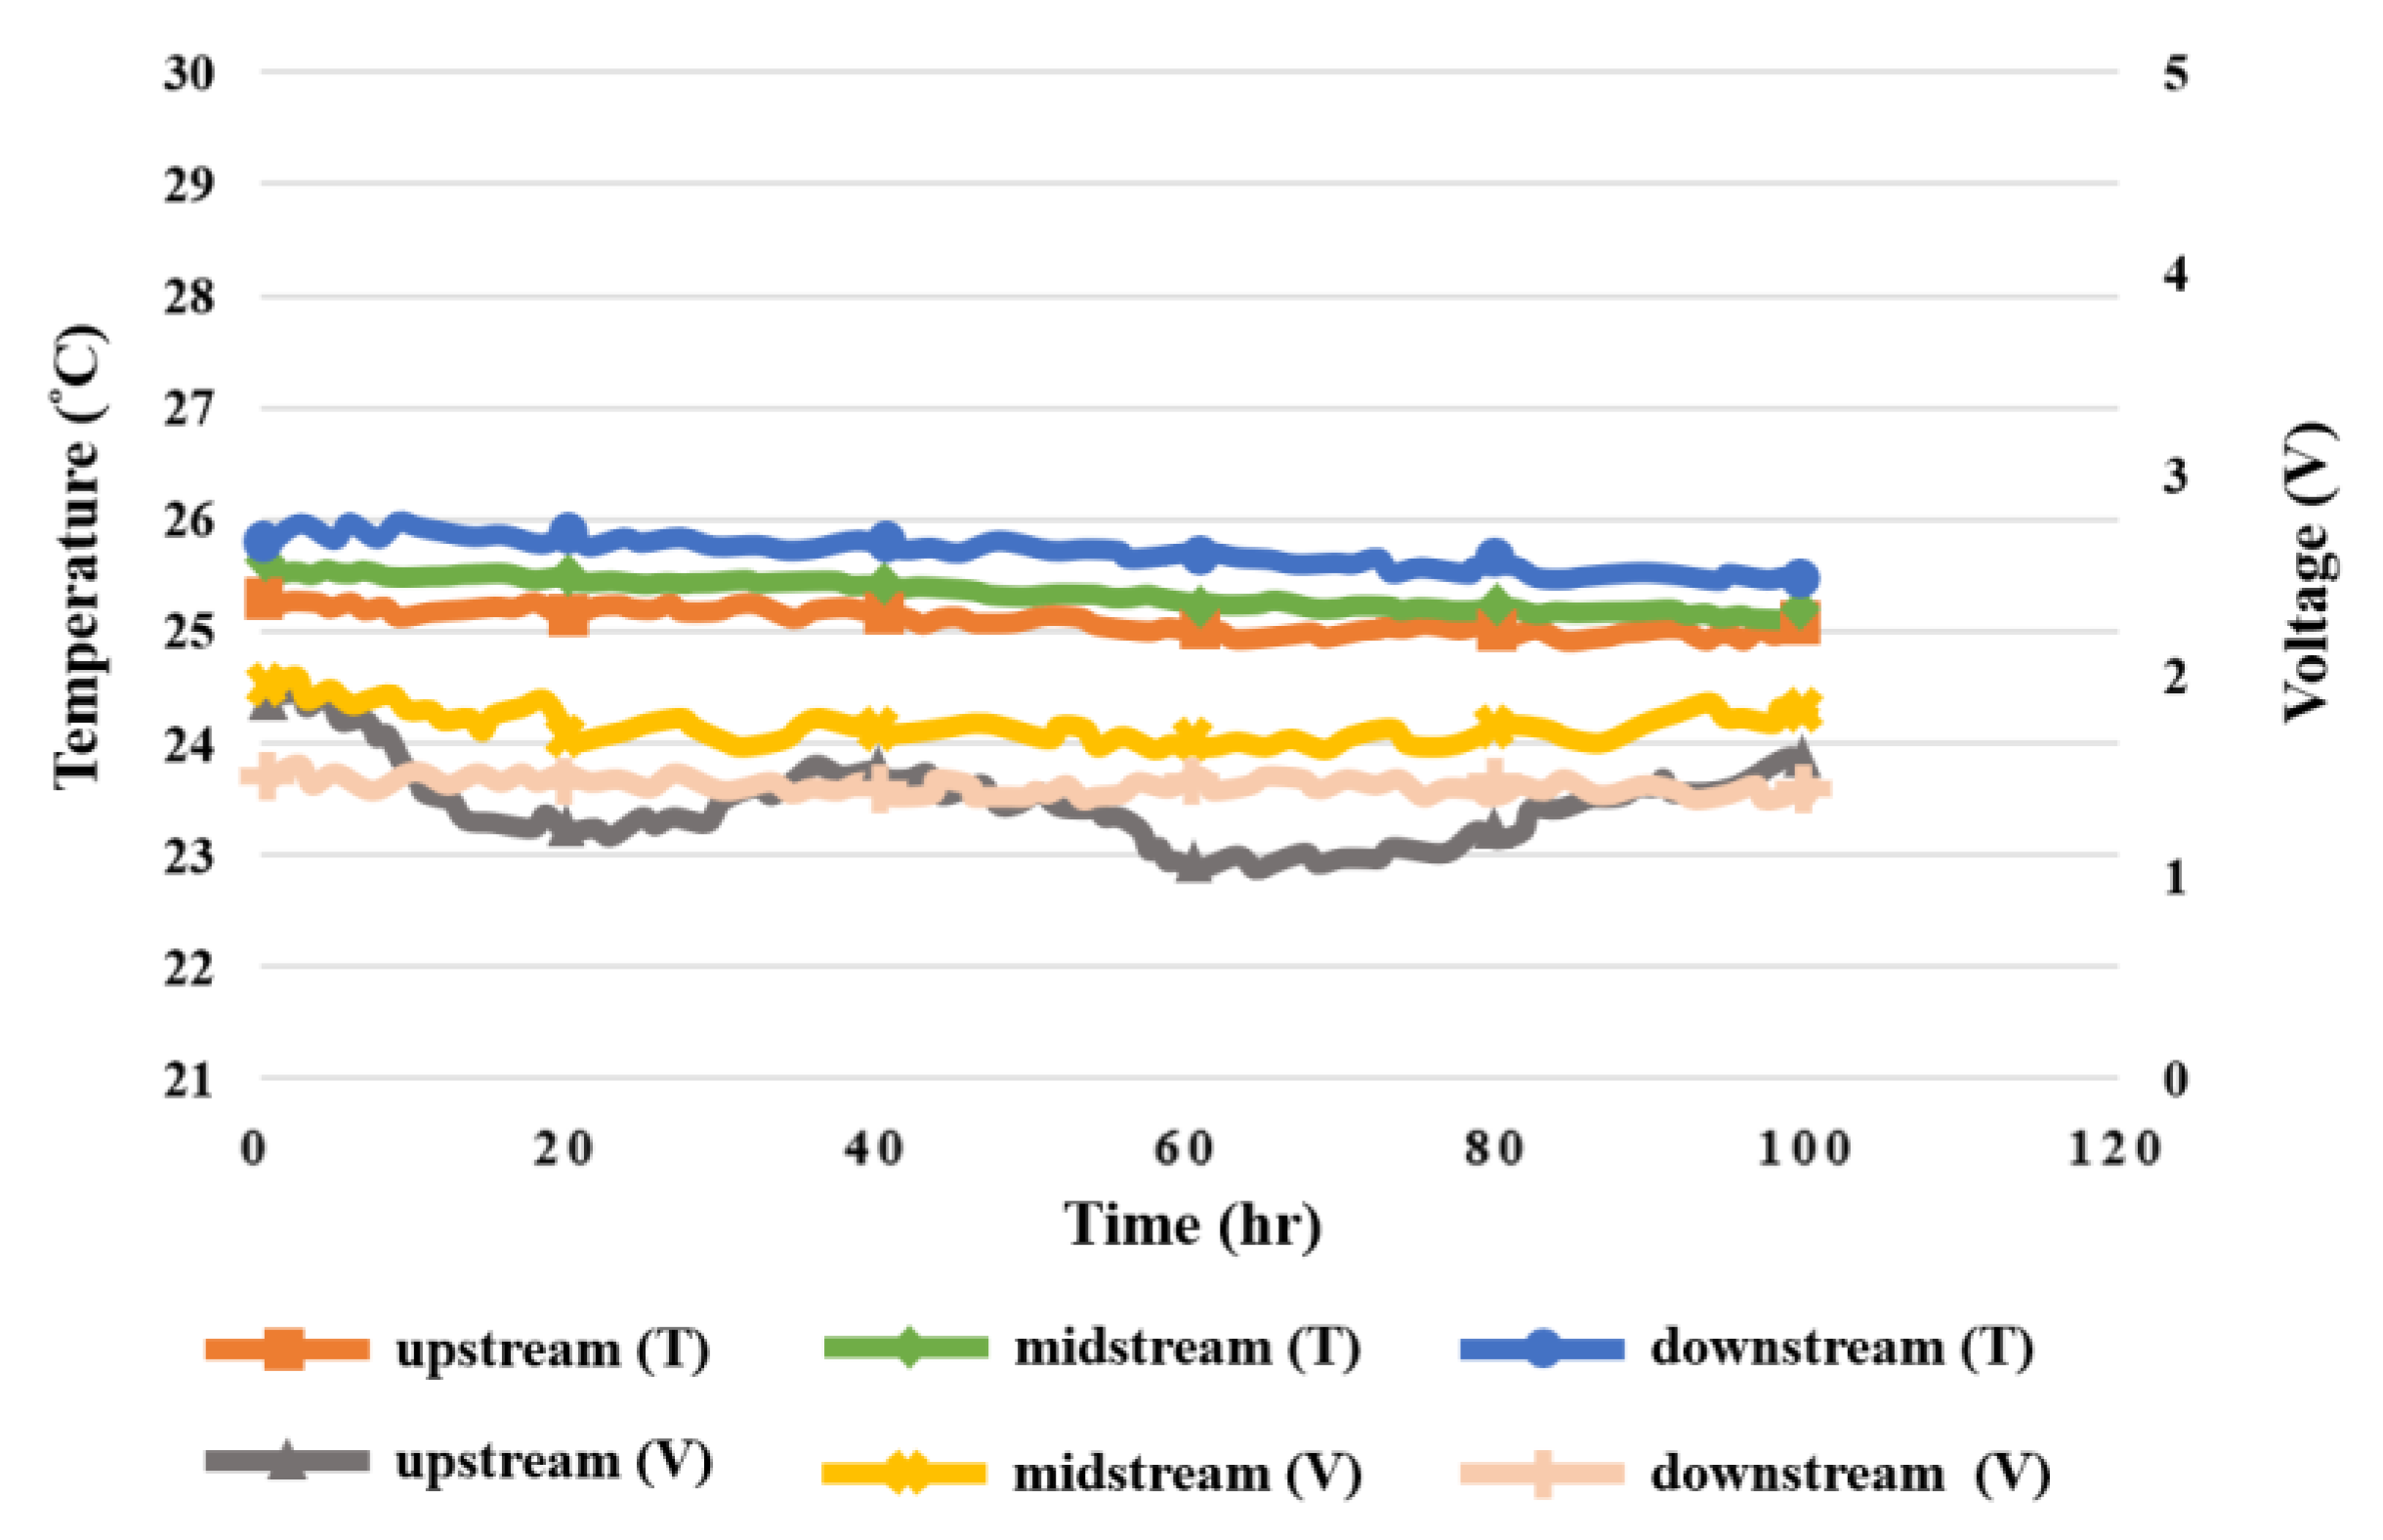
5.5. Temperature in High-Pressure PEMWE
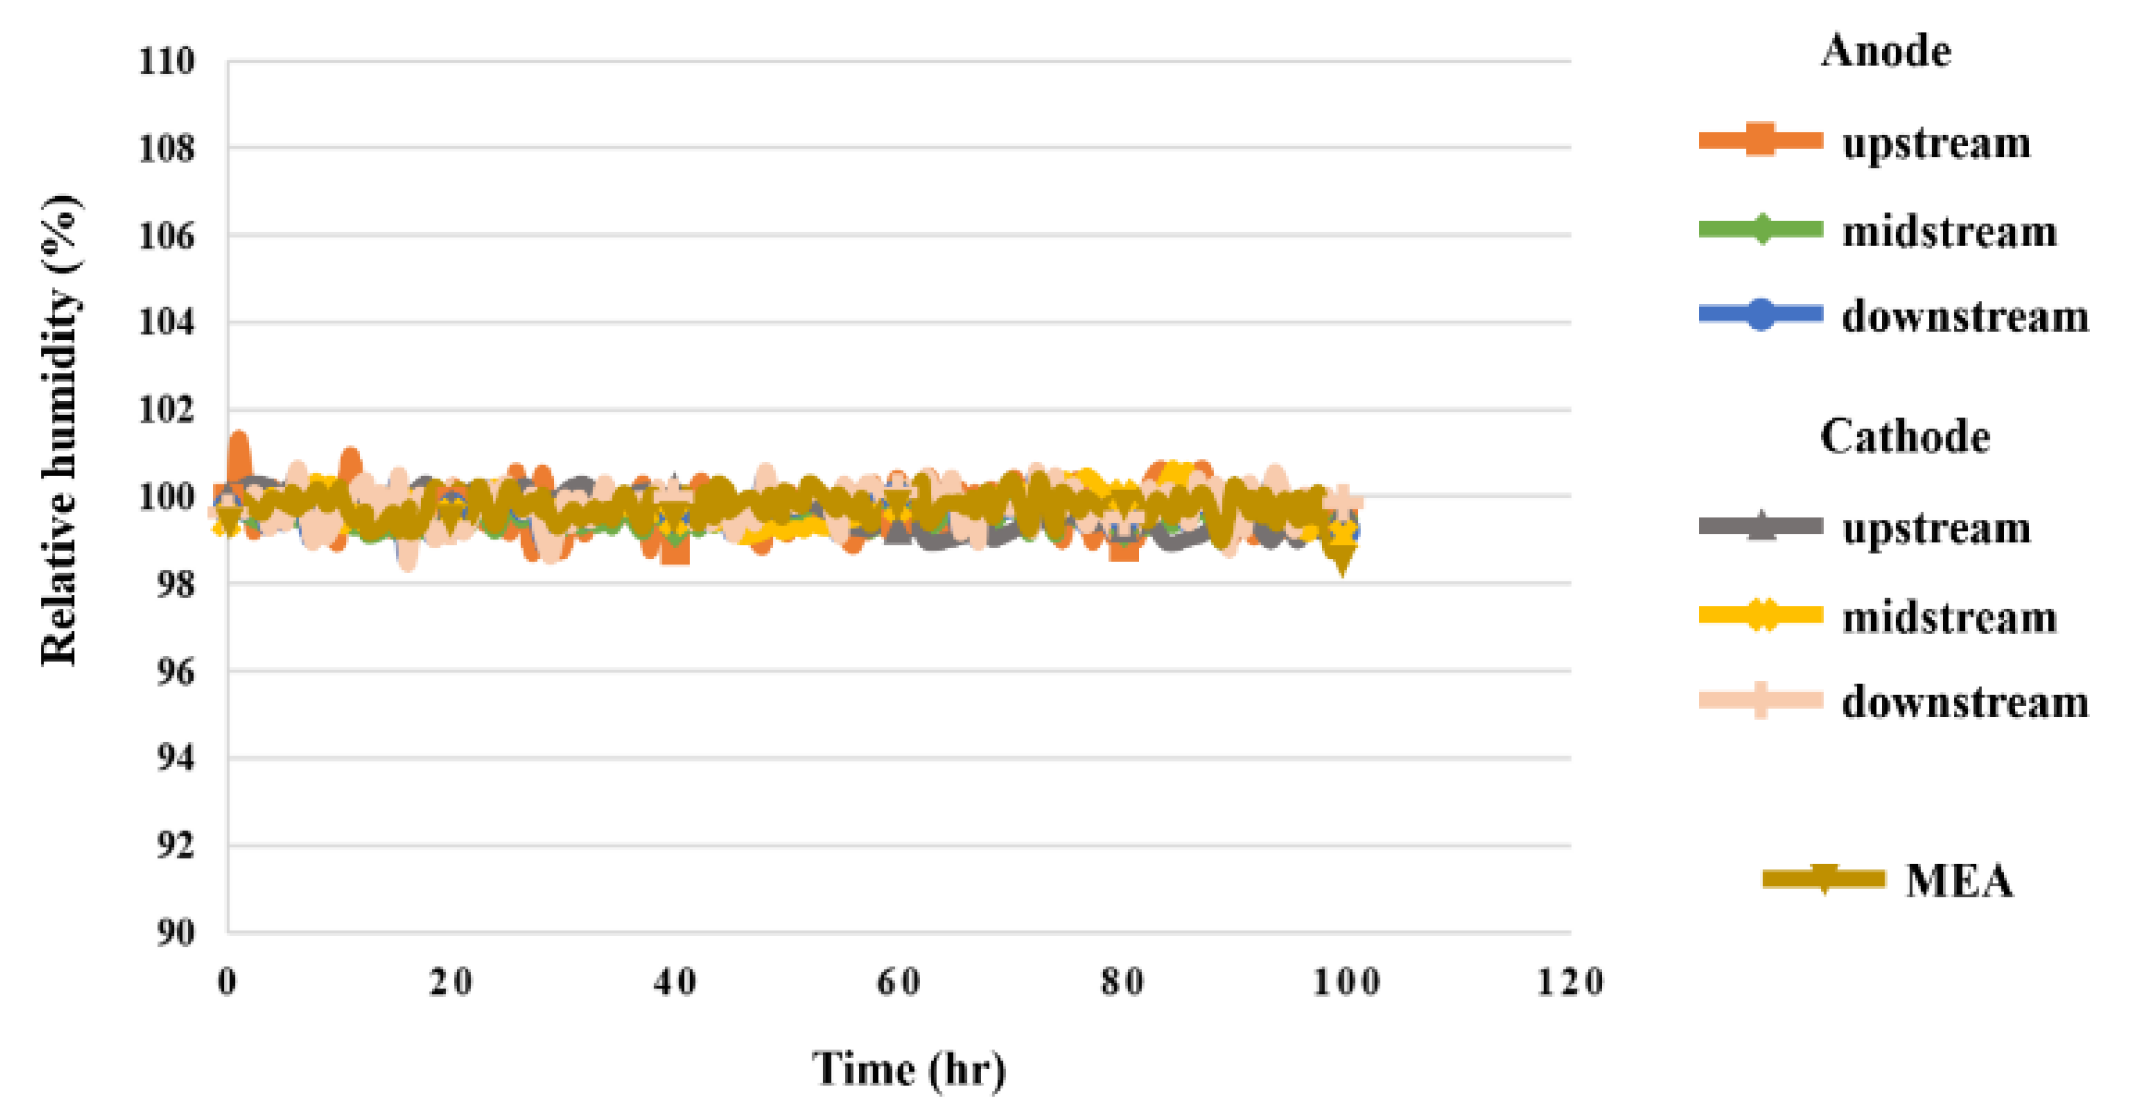
5.6. Humidity in High-Pressure PEMWE
5.7. Pressure in High-Pressure PEMWE
5.8. Flow in High-Pressure PEMWE
5.9. Hydrogen in High-Pressure PEMWE
5.10. Relationships among Internal Physical Quantities of High-Pressure PEMWE during 100 h
6. Conclusions
Author Contributions
Funding
Institutional Review Board Statement
Informed Consent Statement
Data Availability Statement
Acknowledgments
Conflicts of Interest
References
- IPCC. Climate Change 2014 Synthesis Report; IPCC: Geneva, Szwitzerland, 2014. [Google Scholar]
- Global Carbon Project. Global Carbon Budget 2022. Earth Syst. Sci. Data Discuss. 2022, 14, 1–159.
- Makhsoos, A.; Kandidayeni, M.; Pollet, B.G.; Boulon, L. A perspective on increasing the efficiency of proton exchange membrane water electrolyzers—A review. Int. J. Hydrogen Energy 2023, 48, 15341–15370. [Google Scholar] [CrossRef]
- Xie, F.; Shao, Z.; Hou, M.; Yu, H.; Song, W.; Sun, S.; Zhou, L.; Yi, B. Recent progresses in H2-PEMFC at DICP. J. Energy Chem. 2019, 36, 129–140. [Google Scholar] [CrossRef] [Green Version]
- Bareiß, K.; Rua, C.; Möckl, M.; Hamacher, T. Life cycle assessment of hydrogen from proton exchange membrane water electrolysis in future energy systems. Appl. Energy 2019, 237, 862–872. [Google Scholar] [CrossRef]
- Kang, Z.; Wang, H.; Liu, Y.; Mo, J.; Wang, M.; Li, J.; Tian, X. Exploring and understanding the internal voltage losses through catalyst layers in proton exchange membrane water electrolysis devices. Appl. Energy 2022, 317, 119213–119221. [Google Scholar] [CrossRef]
- Liu, P.; Xu, S.; Fu, J.; Liu, C. Experimental investigation on the voltage uniformity for a PEMFC stack with different dynamic loading strategies. Int. J. Hydrogen Energy 2020, 45, 26490–26500. [Google Scholar] [CrossRef]
- Shin, H.S.; Oh, B.S. Water transport according to temperature and current in PEM water electrolyzer. Int. J. Hydrogen Energy 2020, 45, 56–63. [Google Scholar] [CrossRef]
- Ogumerem, G.S.; Pistikopoulos, E.N. Parametric optimization and control for a smart proton exchange membrane water electrolysis (PEMWE) system. J. Process Control 2020, 91, 37–49. [Google Scholar] [CrossRef]
- Chandesris, M.; Médeau, V.; Guillet, N.; Chelghoum, S.; Thoby, D.; Fouda-Onana, F. Membrane degradation in PEM water electrolyzer: Numerical modeling and experimental evidence of the influence of temperature and current density. Int. J. Hydrogen Energy 2015, 40, 1353–1366. [Google Scholar] [CrossRef]
- Fouda-Onana, F.; Chandesris, M.; Médeau, V.; Chelghoum, S.; Thoby, D.; Guillet, N. Investigation on the degradation of MEAs for PEM water electrolysers Part I: Effects of testing conditions on MEA performances and membrane properties. Int. J. Hydrogen Energy 2016, 41, 16627–16636. [Google Scholar] [CrossRef]
- Tjarks, G.; Gibelhaus, A.; Lanzerath, F.; Müller, M.; Bardow, A.; Stolten, D. Energetically-optimal PEM electrolyzer pressure in power-to-gas plants. Appl. Energy 2018, 218, 192–198. [Google Scholar] [CrossRef]
- Upadhyay, M.; Kim, A.; Paramanantham, S.S.; Kim, H.; Lim, D.; Lee, S.; Moon, S.; Lim, H. Three-dimensional CFD simulation of proton exchange membrane water electrolyser: Performance assessment under different condition. Appl. Energy 2022, 306, 118016–118024. [Google Scholar] [CrossRef]
- Diéguez, P.M.; Ursúa, A.; Sanchis, P.; Sopena, C.; Guelbenzu, E.; Gandía, L.M. Thermal performance of a commercial alkaline water electrolyzer: Experimental study and mathematical modeling. Int. J. Hydrogen Energy 2008, 33, 7338–7354. [Google Scholar] [CrossRef]
- Selamet, Ö.F.; Acar, M.C.; Mat, M.D.; Kaplan, Y. Effects of operating parameters on the performance of a high-pressure proton exchange membrane electrolyzer. Int. J. Energy Res. 2012, 37, 457–467. [Google Scholar] [CrossRef]
- Scheepers, F.; Stähler, M.; Stähler, A.; Rauls, E.; Müller, M.; Carmo, M.; Lehnert, W. Temperature optimization for improving polymer electrolyte membrane-water electrolysis system efficiency. Appl. Energy 2021, 283, 116270–116280. [Google Scholar] [CrossRef]
- Bender, G.; Carmo, M.; Smolinka, T.; Gago, A.; Danilovic, N.; Mueller, M.; Ganci, F.; Fallisch, A.; Lettenmeier, P.; Friedrich, K.A.; et al. Initial approaches in benchmarking and round robin testing for proton exchange membrane water electrolyzers. Int. J. Hydrogen Energy 2019, 44, 9174–9187. [Google Scholar] [CrossRef]
- Majasan, J.O.; Cho, J.I.S.; Dedigama, I.; Tsaoulidis, D.; Shearing, P.; Brett, D.J.L. Two-phase flow behaviour and performance of polymer electrolyte membrane electrolysers: Electrochemical and optical characterization. Int. J. Hydrogen Energy 2018, 43, 15659–15672. [Google Scholar] [CrossRef]
- Selamet, Ö.F.; Becerikli, F.; Mat, M.D.; Kaplan, Y. Development and testing of a highly efficient proton exchange membrane (PEM) electrolyzer stack. Int. J. Hydrogen Energy 2011, 36, 11480–11487. [Google Scholar] [CrossRef]
- Maier, M.; Smith, K.; Dodwell, J.; Hinds, G.; Shearing, P.R.; Brett, D.J.L. Mass transport in PEM water electrolysers: A review. Int. J. Hydrogen Energy 2022, 47, 30–56. [Google Scholar] [CrossRef]
- Widera, B. Renewable hydrogen implementations for combined energy storage, transportation and stationary applications. Therm. Sci. Eng. Prog. 2020, 16, 100460–100467. [Google Scholar] [CrossRef]
- Lee, C.Y.; Chen, C.H.; Chen, S.Y.; Hsieh, H.T. High-pressure-resistant flexible seven-in-one microsensor embedded in high-pressure proton exchange membrane water electrolyzer for real-time microscopic measurement. Membranes 2022, 12, 919–933. [Google Scholar] [CrossRef] [PubMed]


Disclaimer/Publisher’s Note: The statements, opinions and data contained in all publications are solely those of the individual author(s) and contributor(s) and not of MDPI and/or the editor(s). MDPI and/or the editor(s) disclaim responsibility for any injury to people or property resulting from any ideas, methods, instructions or products referred to in the content. |
© 2023 by the authors. Licensee MDPI, Basel, Switzerland. This article is an open access article distributed under the terms and conditions of the Creative Commons Attribution (CC BY) license (https://creativecommons.org/licenses/by/4.0/).
Share and Cite
Lee, C.-Y.; Chen, C.-H.; Chuang, H.-C.; Chen, S.-Y.; Chiang, Y.-C. Flexible Seven-in-One Microsensor Embedded in High-Pressure Proton Exchange Membrane Water Electrolyzer for Real-Time Microscopic Monitoring. Sensors 2023, 23, 5489. https://doi.org/10.3390/s23125489
Lee C-Y, Chen C-H, Chuang H-C, Chen S-Y, Chiang Y-C. Flexible Seven-in-One Microsensor Embedded in High-Pressure Proton Exchange Membrane Water Electrolyzer for Real-Time Microscopic Monitoring. Sensors. 2023; 23(12):5489. https://doi.org/10.3390/s23125489
Chicago/Turabian StyleLee, Chi-Yuan, Chia-Hung Chen, Hsian-Chun Chuang, Shan-Yu Chen, and Yu-Chen Chiang. 2023. "Flexible Seven-in-One Microsensor Embedded in High-Pressure Proton Exchange Membrane Water Electrolyzer for Real-Time Microscopic Monitoring" Sensors 23, no. 12: 5489. https://doi.org/10.3390/s23125489