
An Imbalanced Generative Adversarial Network-Based Approach for Network Intrusion Detection in an Imbalanced Dataset

Abstract
:1. Introduction
Novel Contribution
- ➢
- We introduce IGAN, a class imbalance processing method. This strategy can stop random under-sampling from losing crucial samples, as well as the unnecessary time and space costs associated with oversampling. It considerably raises the rate at which minority classes are discovered.
- ➢
- One-hot encoding and normalization operations are performed in preprocessing.
- ➢
- The model accuracy and speed of convergence are both enhanced by data normalization. The class label numeralization of two datasets also employs one-hot encoding.
- ➢
- An ensemble of Lenet 5 and LSTM is employed to classify the various attack categories in NIDS.
- ➢
- The UNSW-NB15 and CICIDS2017 datasets have undergone various experiments. Our proposed network outperforms the state efficiency concerning all other approaches, according to the experimental data.
2. Literature Review
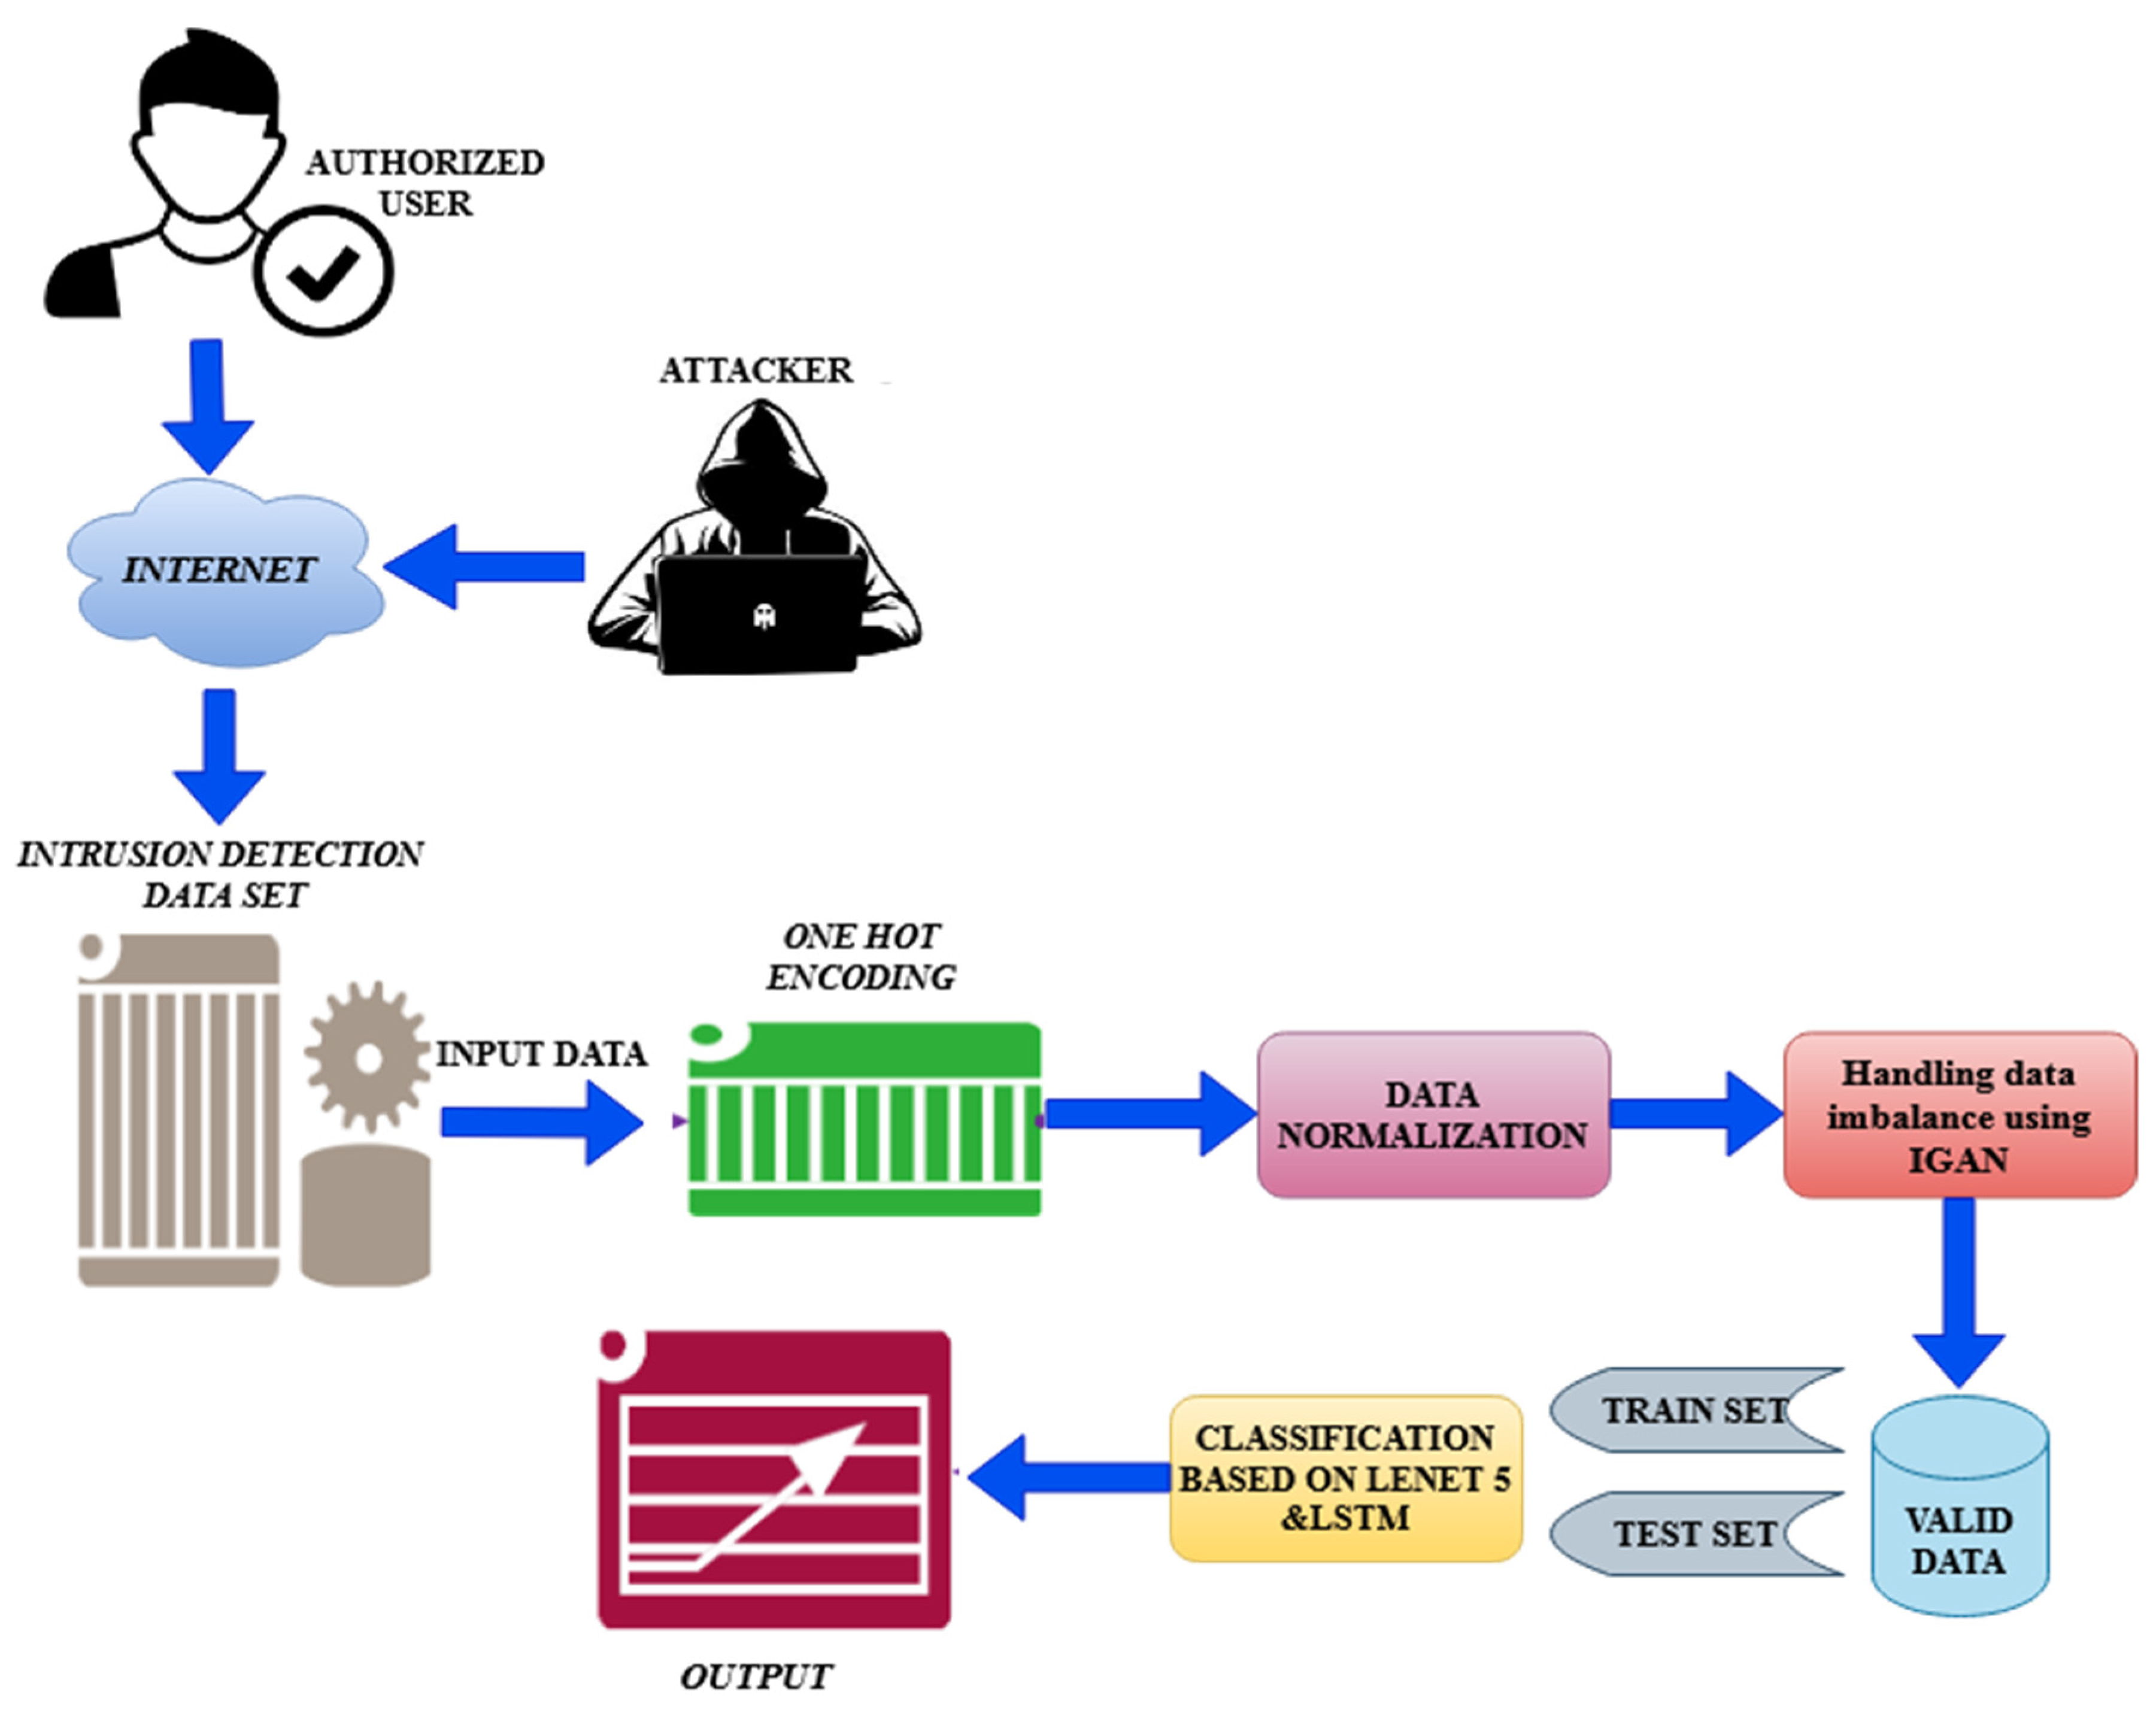
3. Proposed Methodology
3.1. Problem Statement
3.2. Preprocessing
3.2.1. One-Hot Processing
3.2.2. Normalization
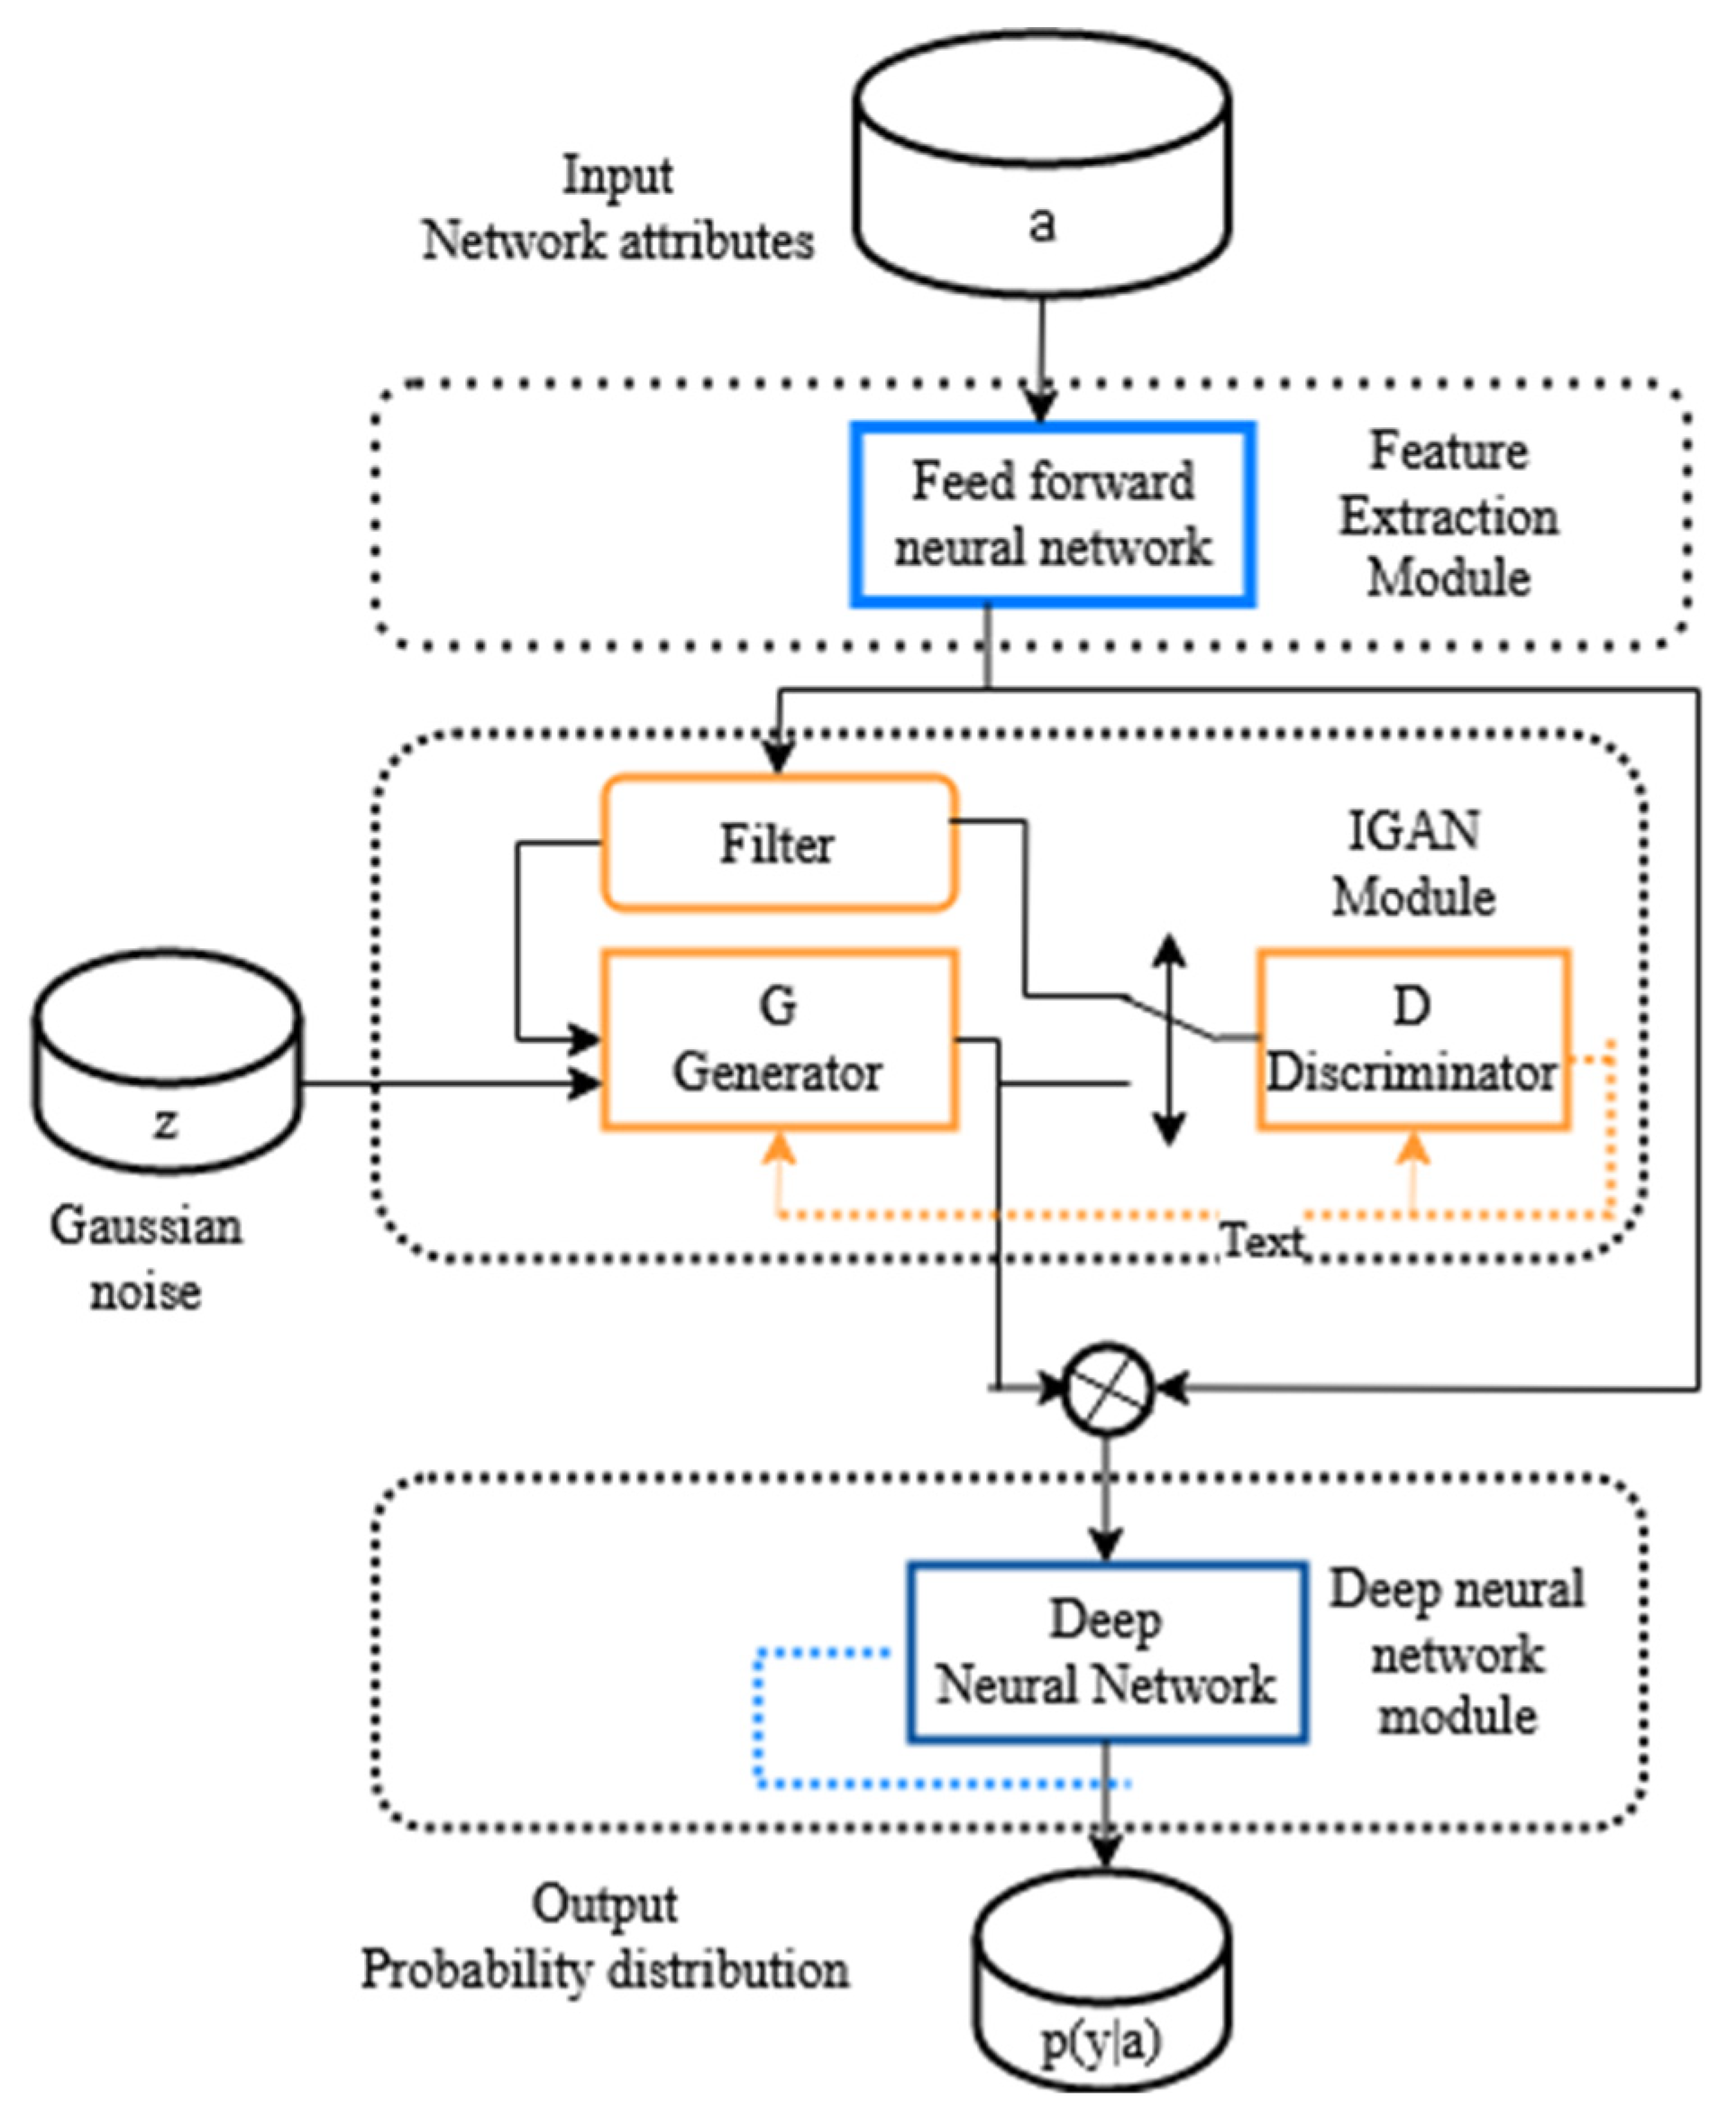
3.3. Imbalanced Data Handling Using IGAN
3.3.1. System Model
3.3.2. Model Description
- (a)
- Imbalanced data filter
- (b)
- Discriminator (D)
- (c)
- Generator (G)
| Algorithm 1. IGAN |
| Input:s = (x, y) the original samples Output: The synthesized samples Parameter: t, iteration times of D per global iteration While D has not converged to 0.5 do For t steps do Optimization of the discriminator End Optimization of the generator Samples can be changed as a batch form End Generating the samples Return |
3.4. Classification
3.4.1. LeNet 5
3.4.2. Long Short-Term Memory (LSTM)
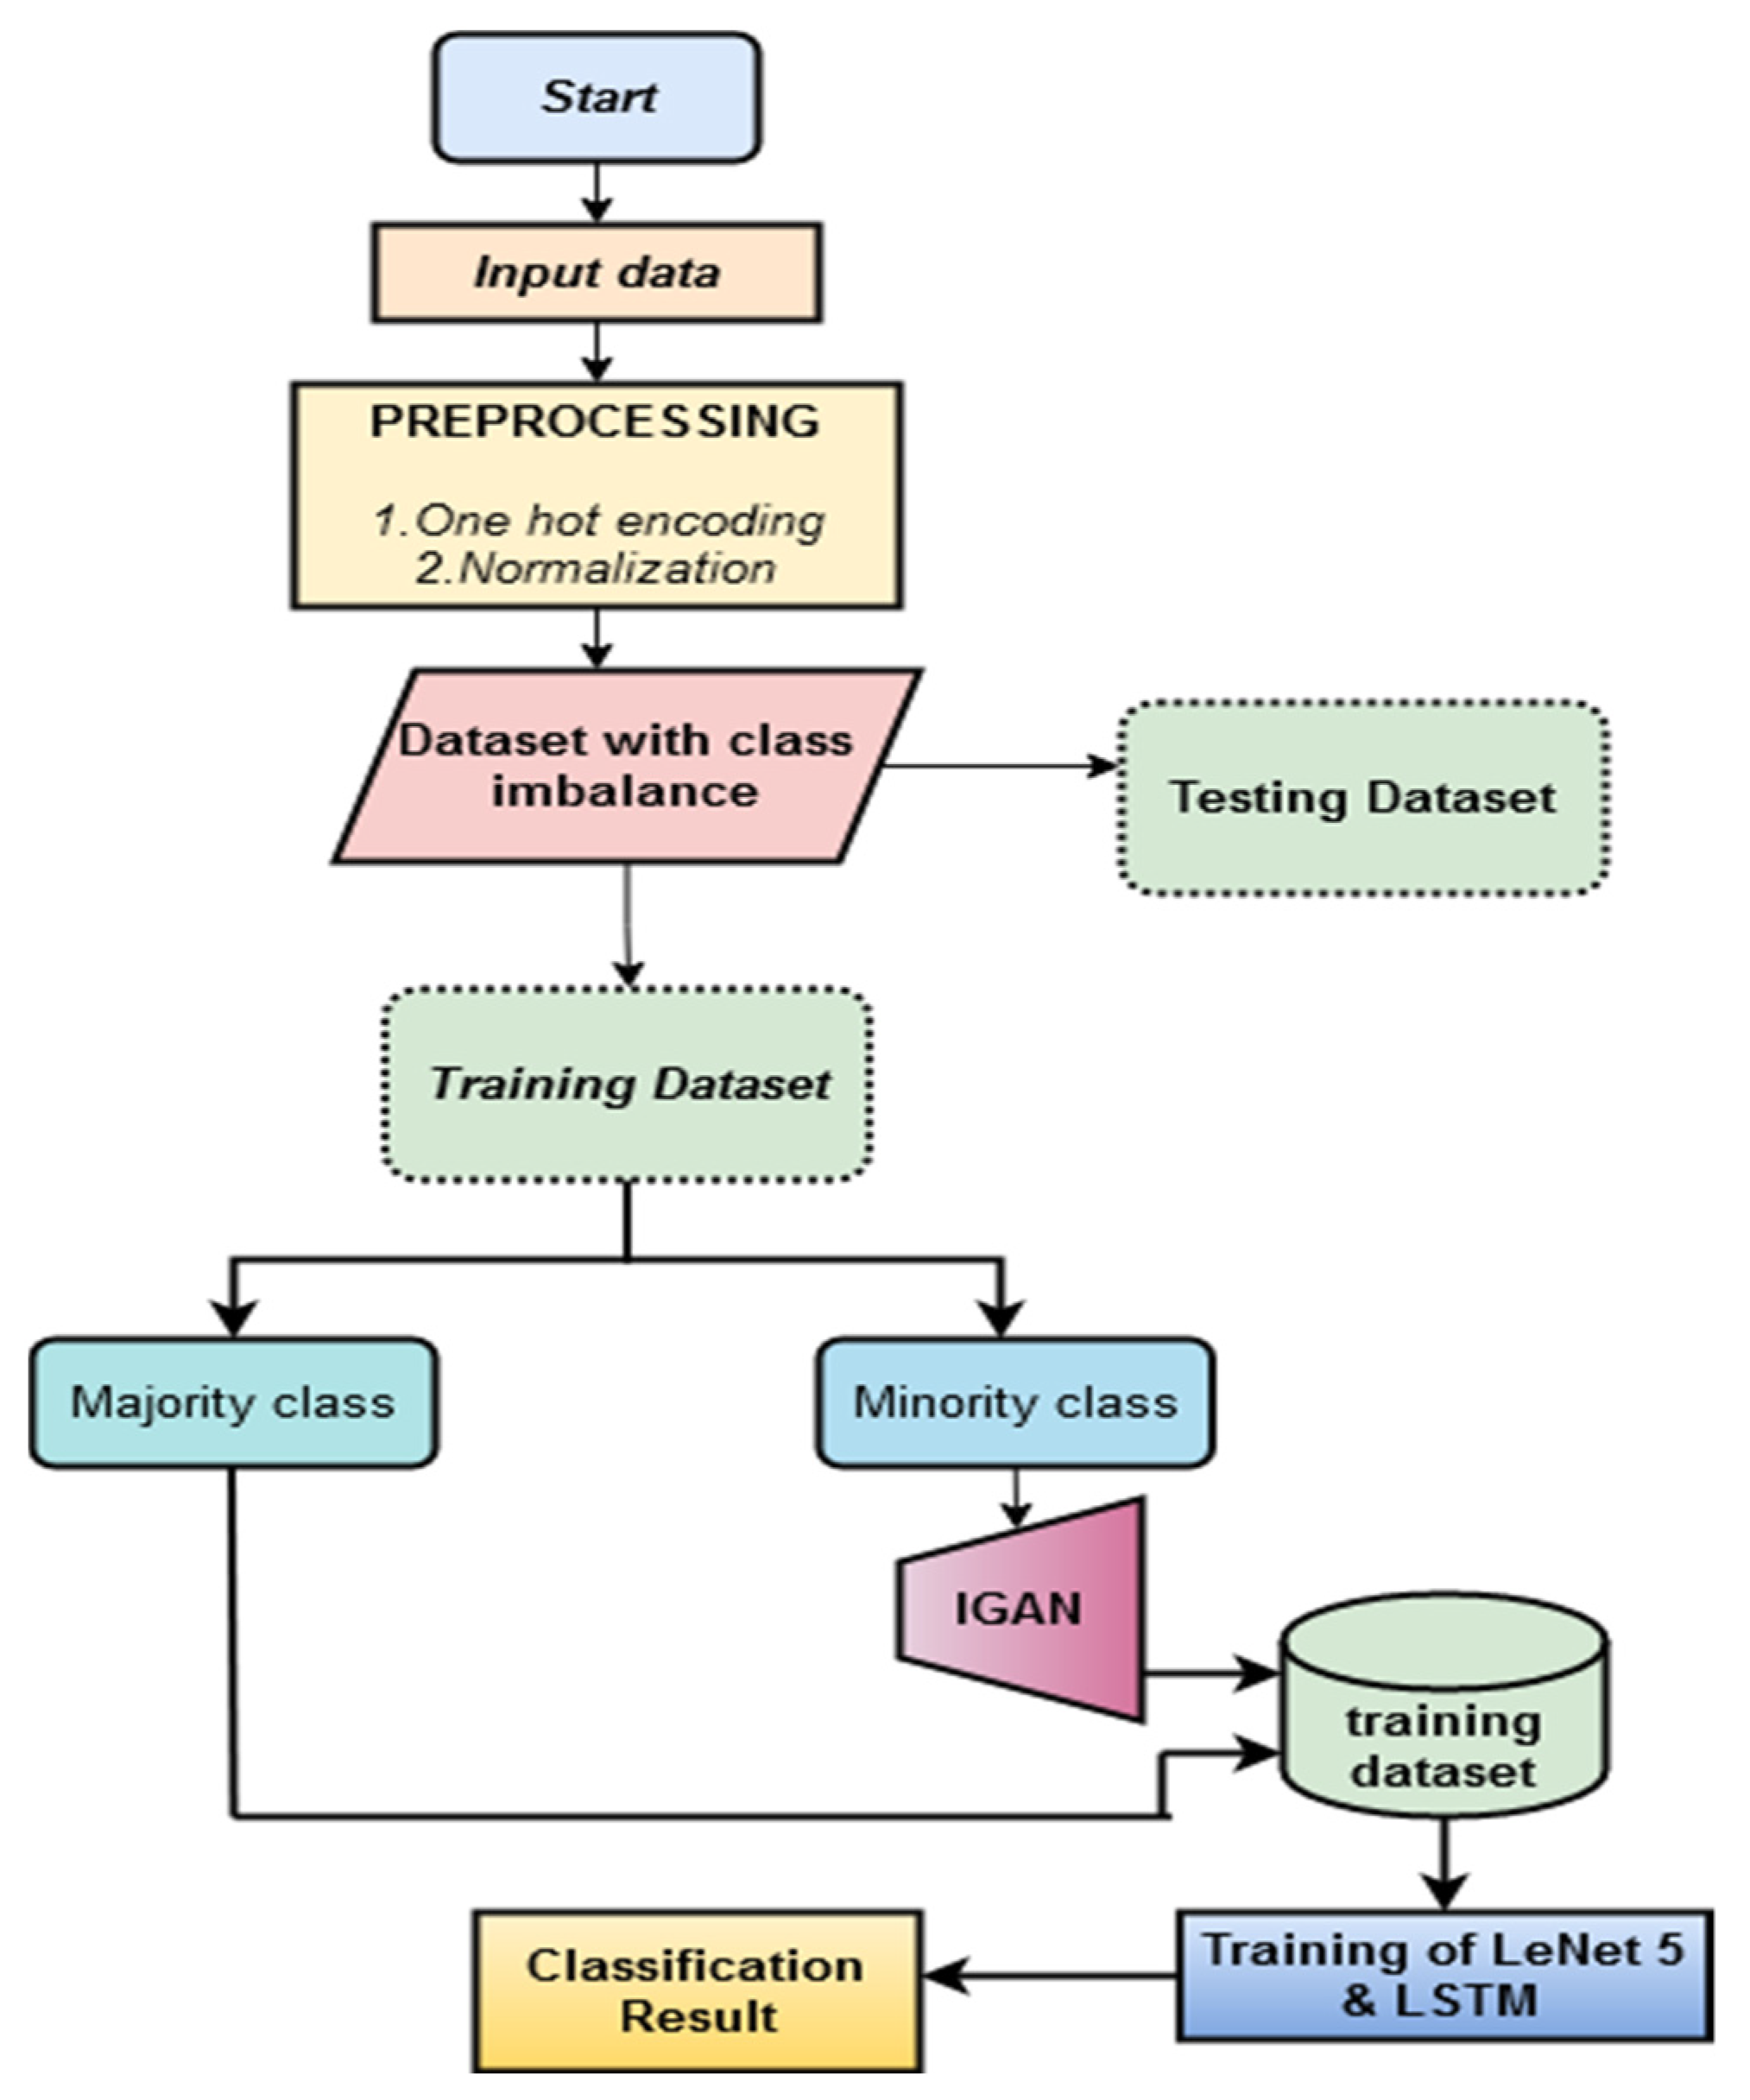
- Step 1.
- Start.
- Step 2.
- Intrusion detection data is an input.
- Step 3.
- Apply preprocessing in the IDS dataset, and one hot-encoding and normalization operation are performed.
- Step 4.
- Symbolic features in the dataset are converted into numerical features using the one-hot approach.
- Step 5.
- Normalization processing removes the measurement unit’s influence from the model training and increases the reliance on the training outcome.
- Step 6.
- Employ an imbalanced generative adversarial network (IGAN) to address the problem of class imbalance by increasing the detection rate of minority classes.
- Step 7.
- Lenet 5 and LSTM are employed to classify the various attack categories in NIDS.
- Step 8.
- End.
4. Result and Discussions
4.1. Experimental Setting
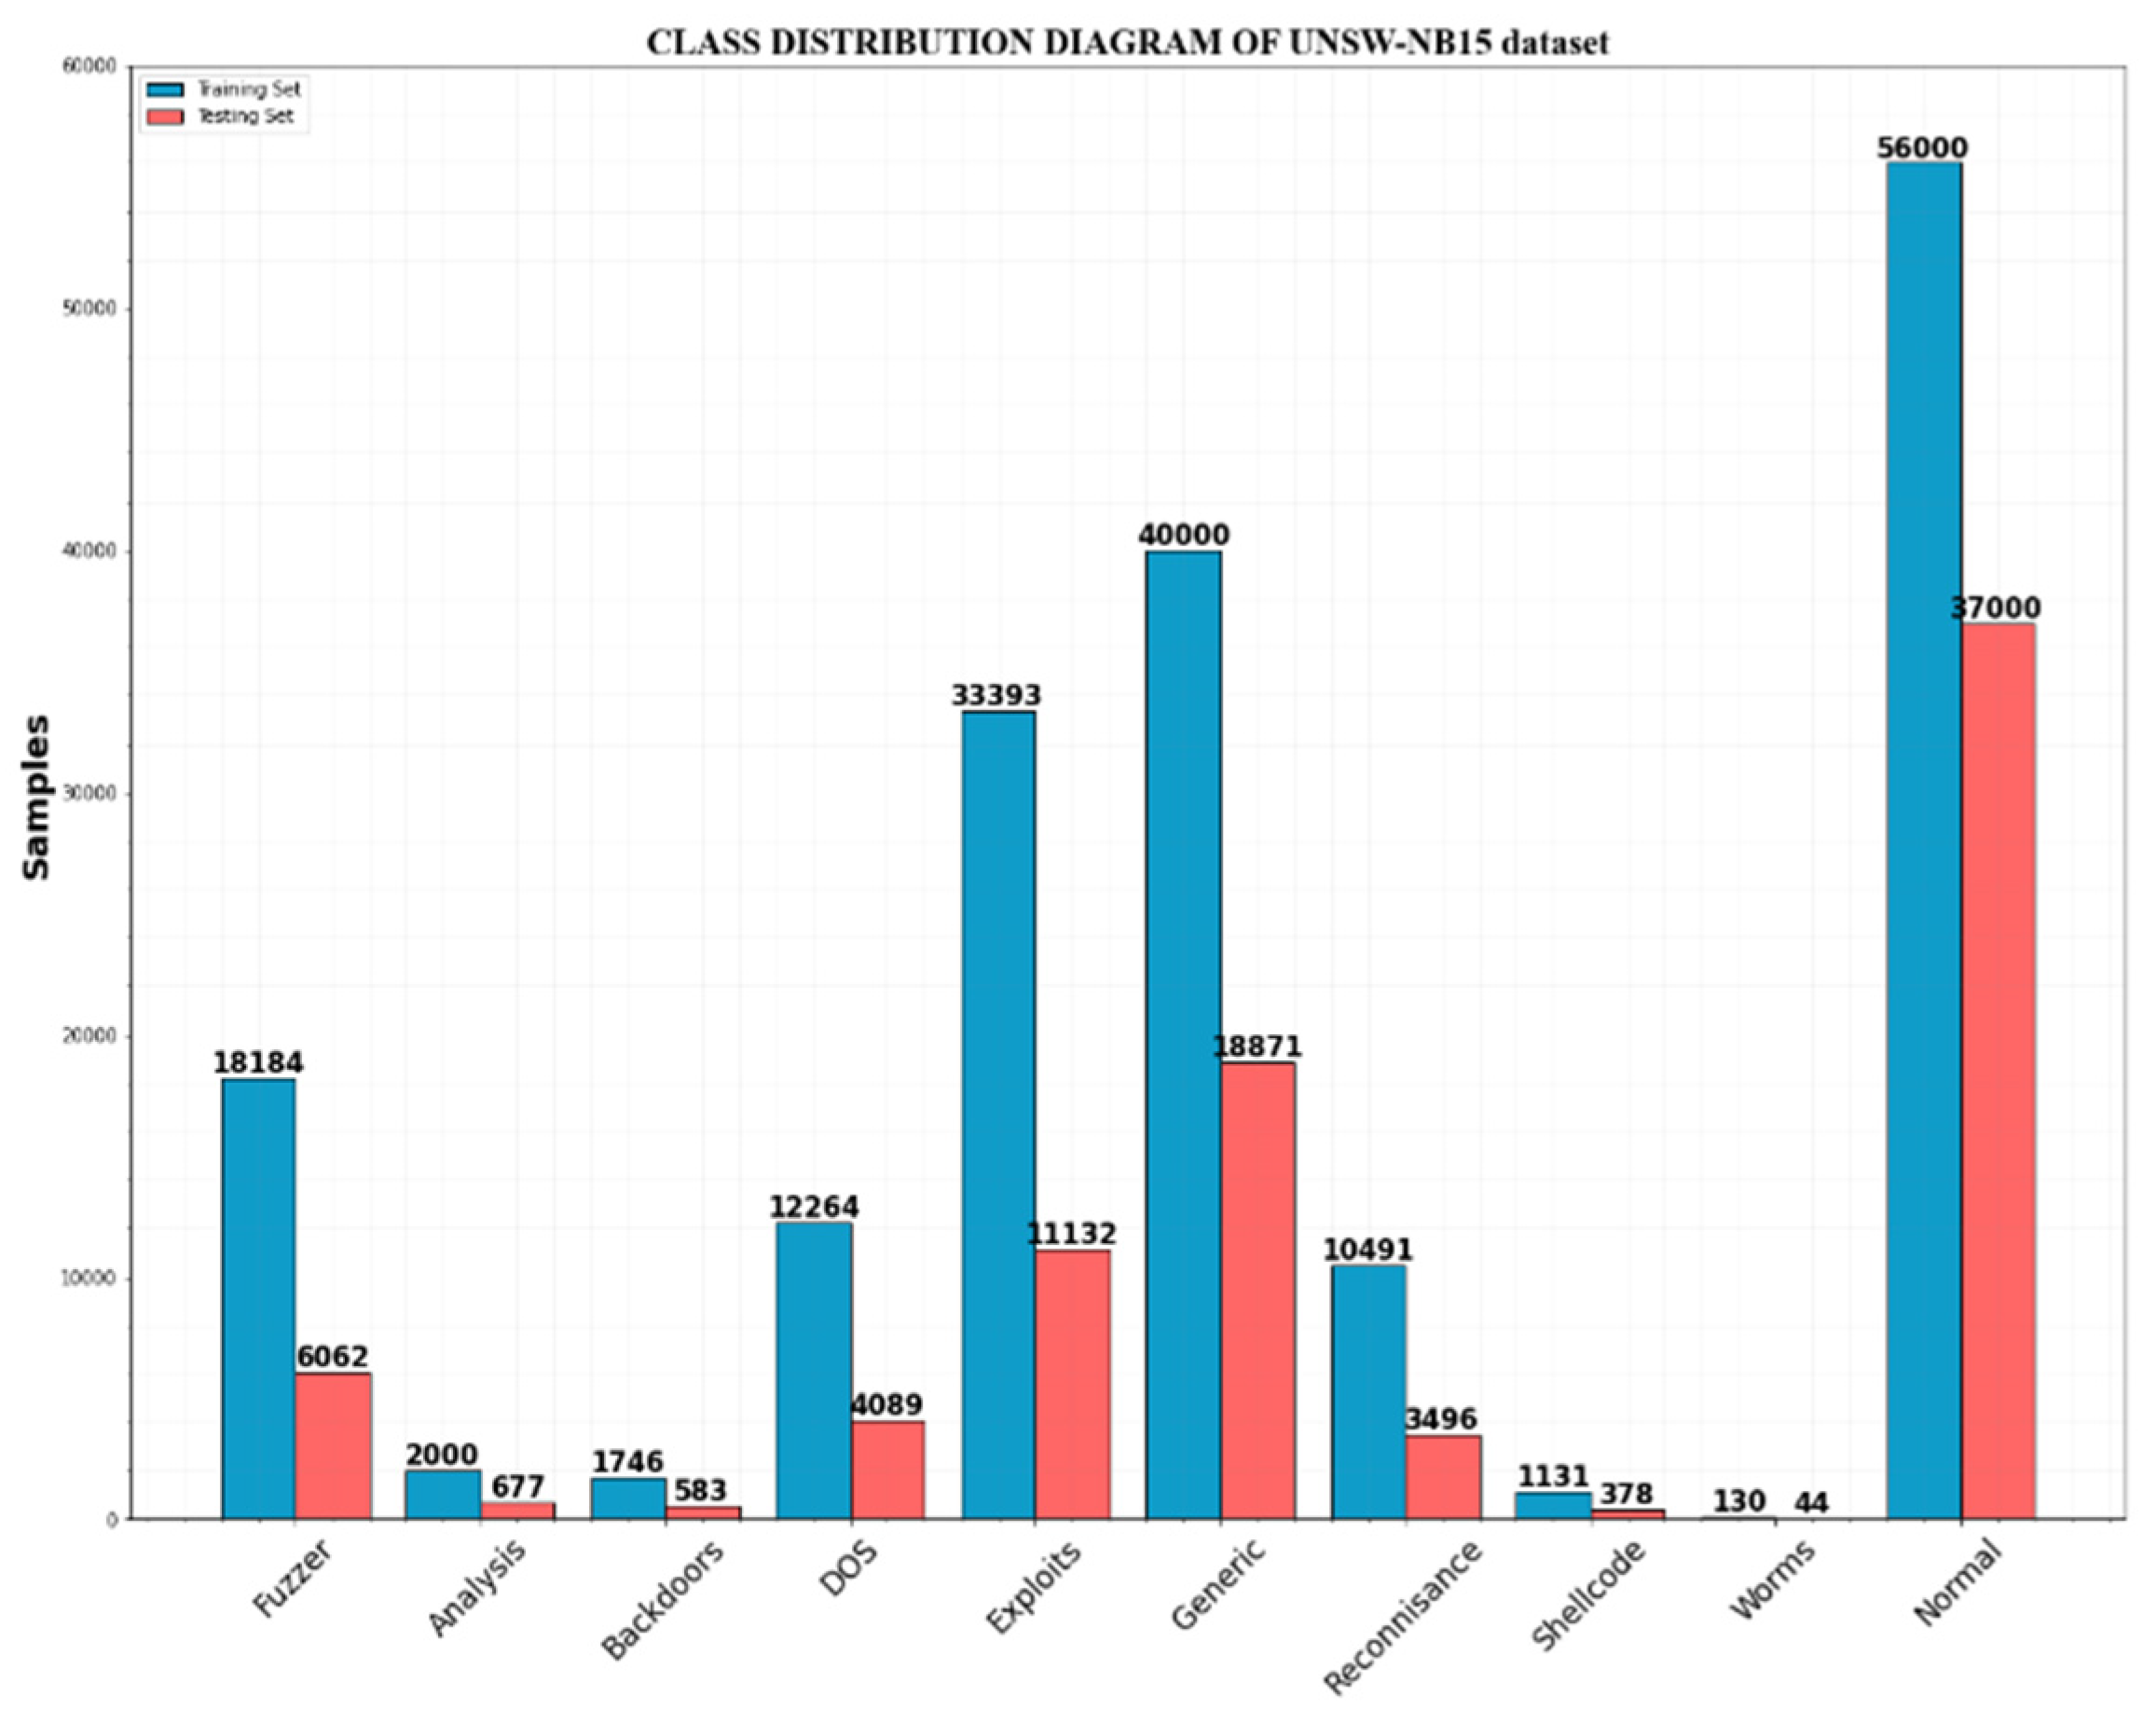
4.2. Dataset Description
4.3. Evaluation Metrics
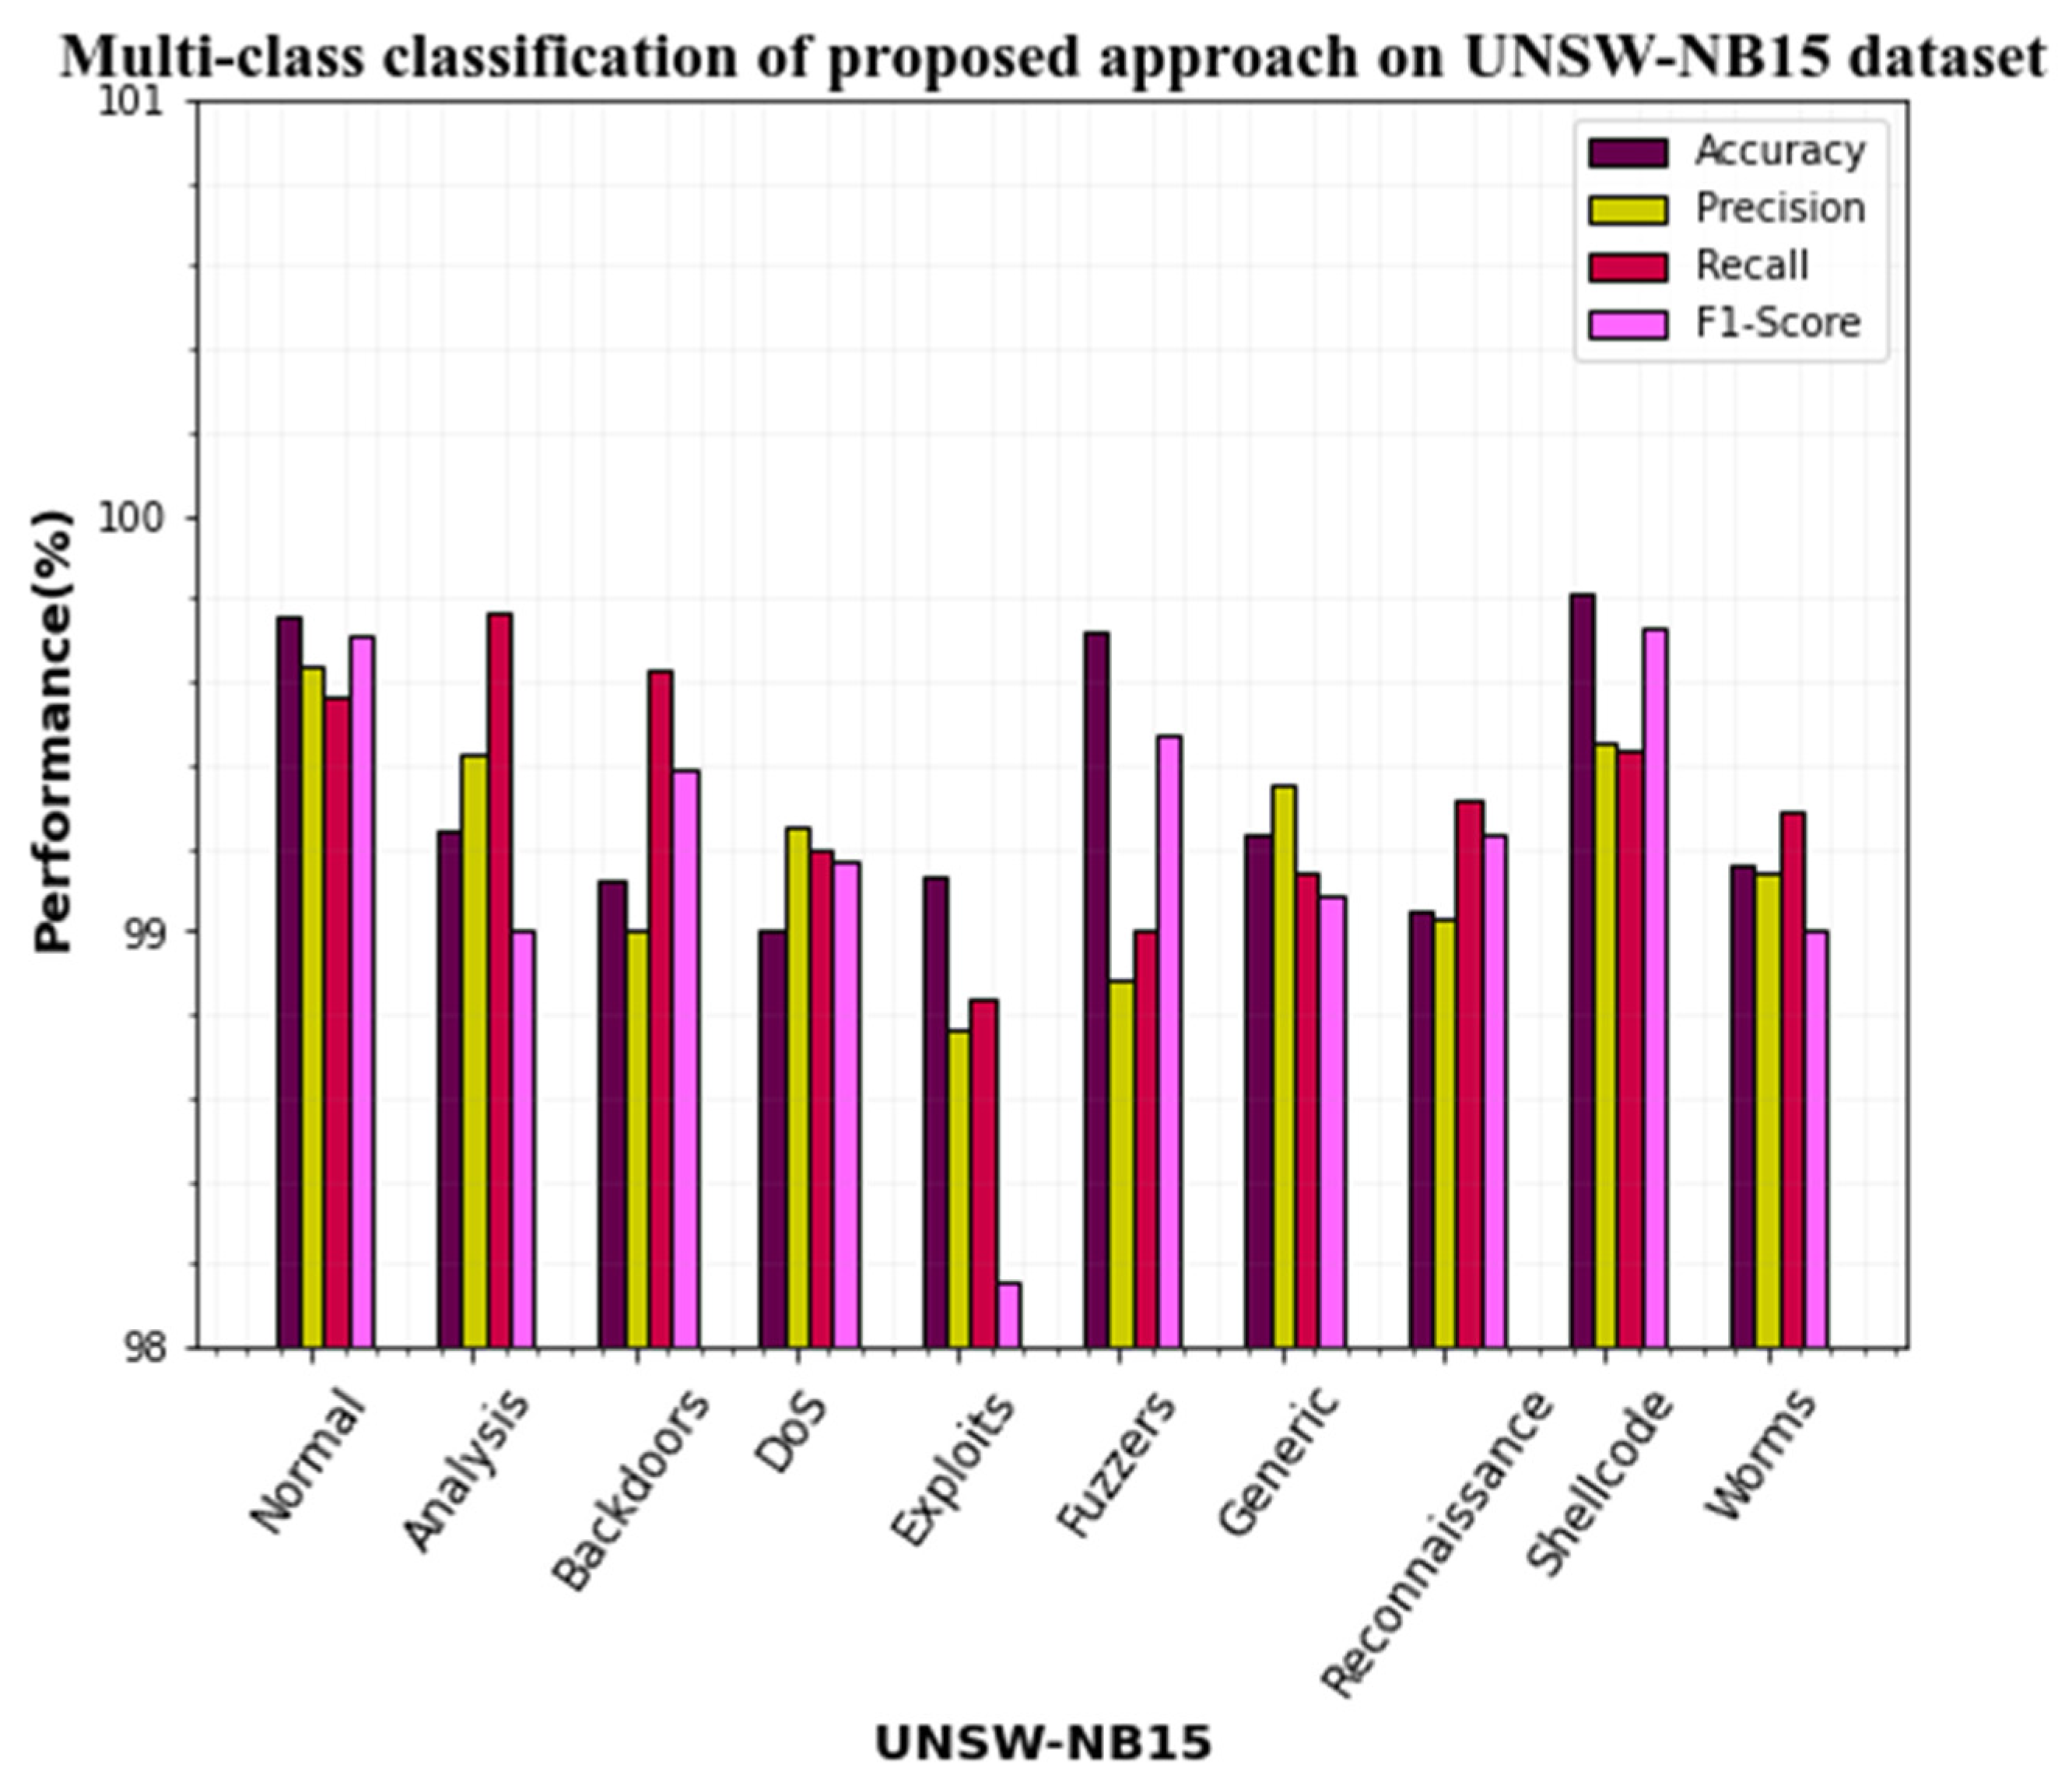
4.4. Performance Evaluation of the UNSW-NB15 Dataset
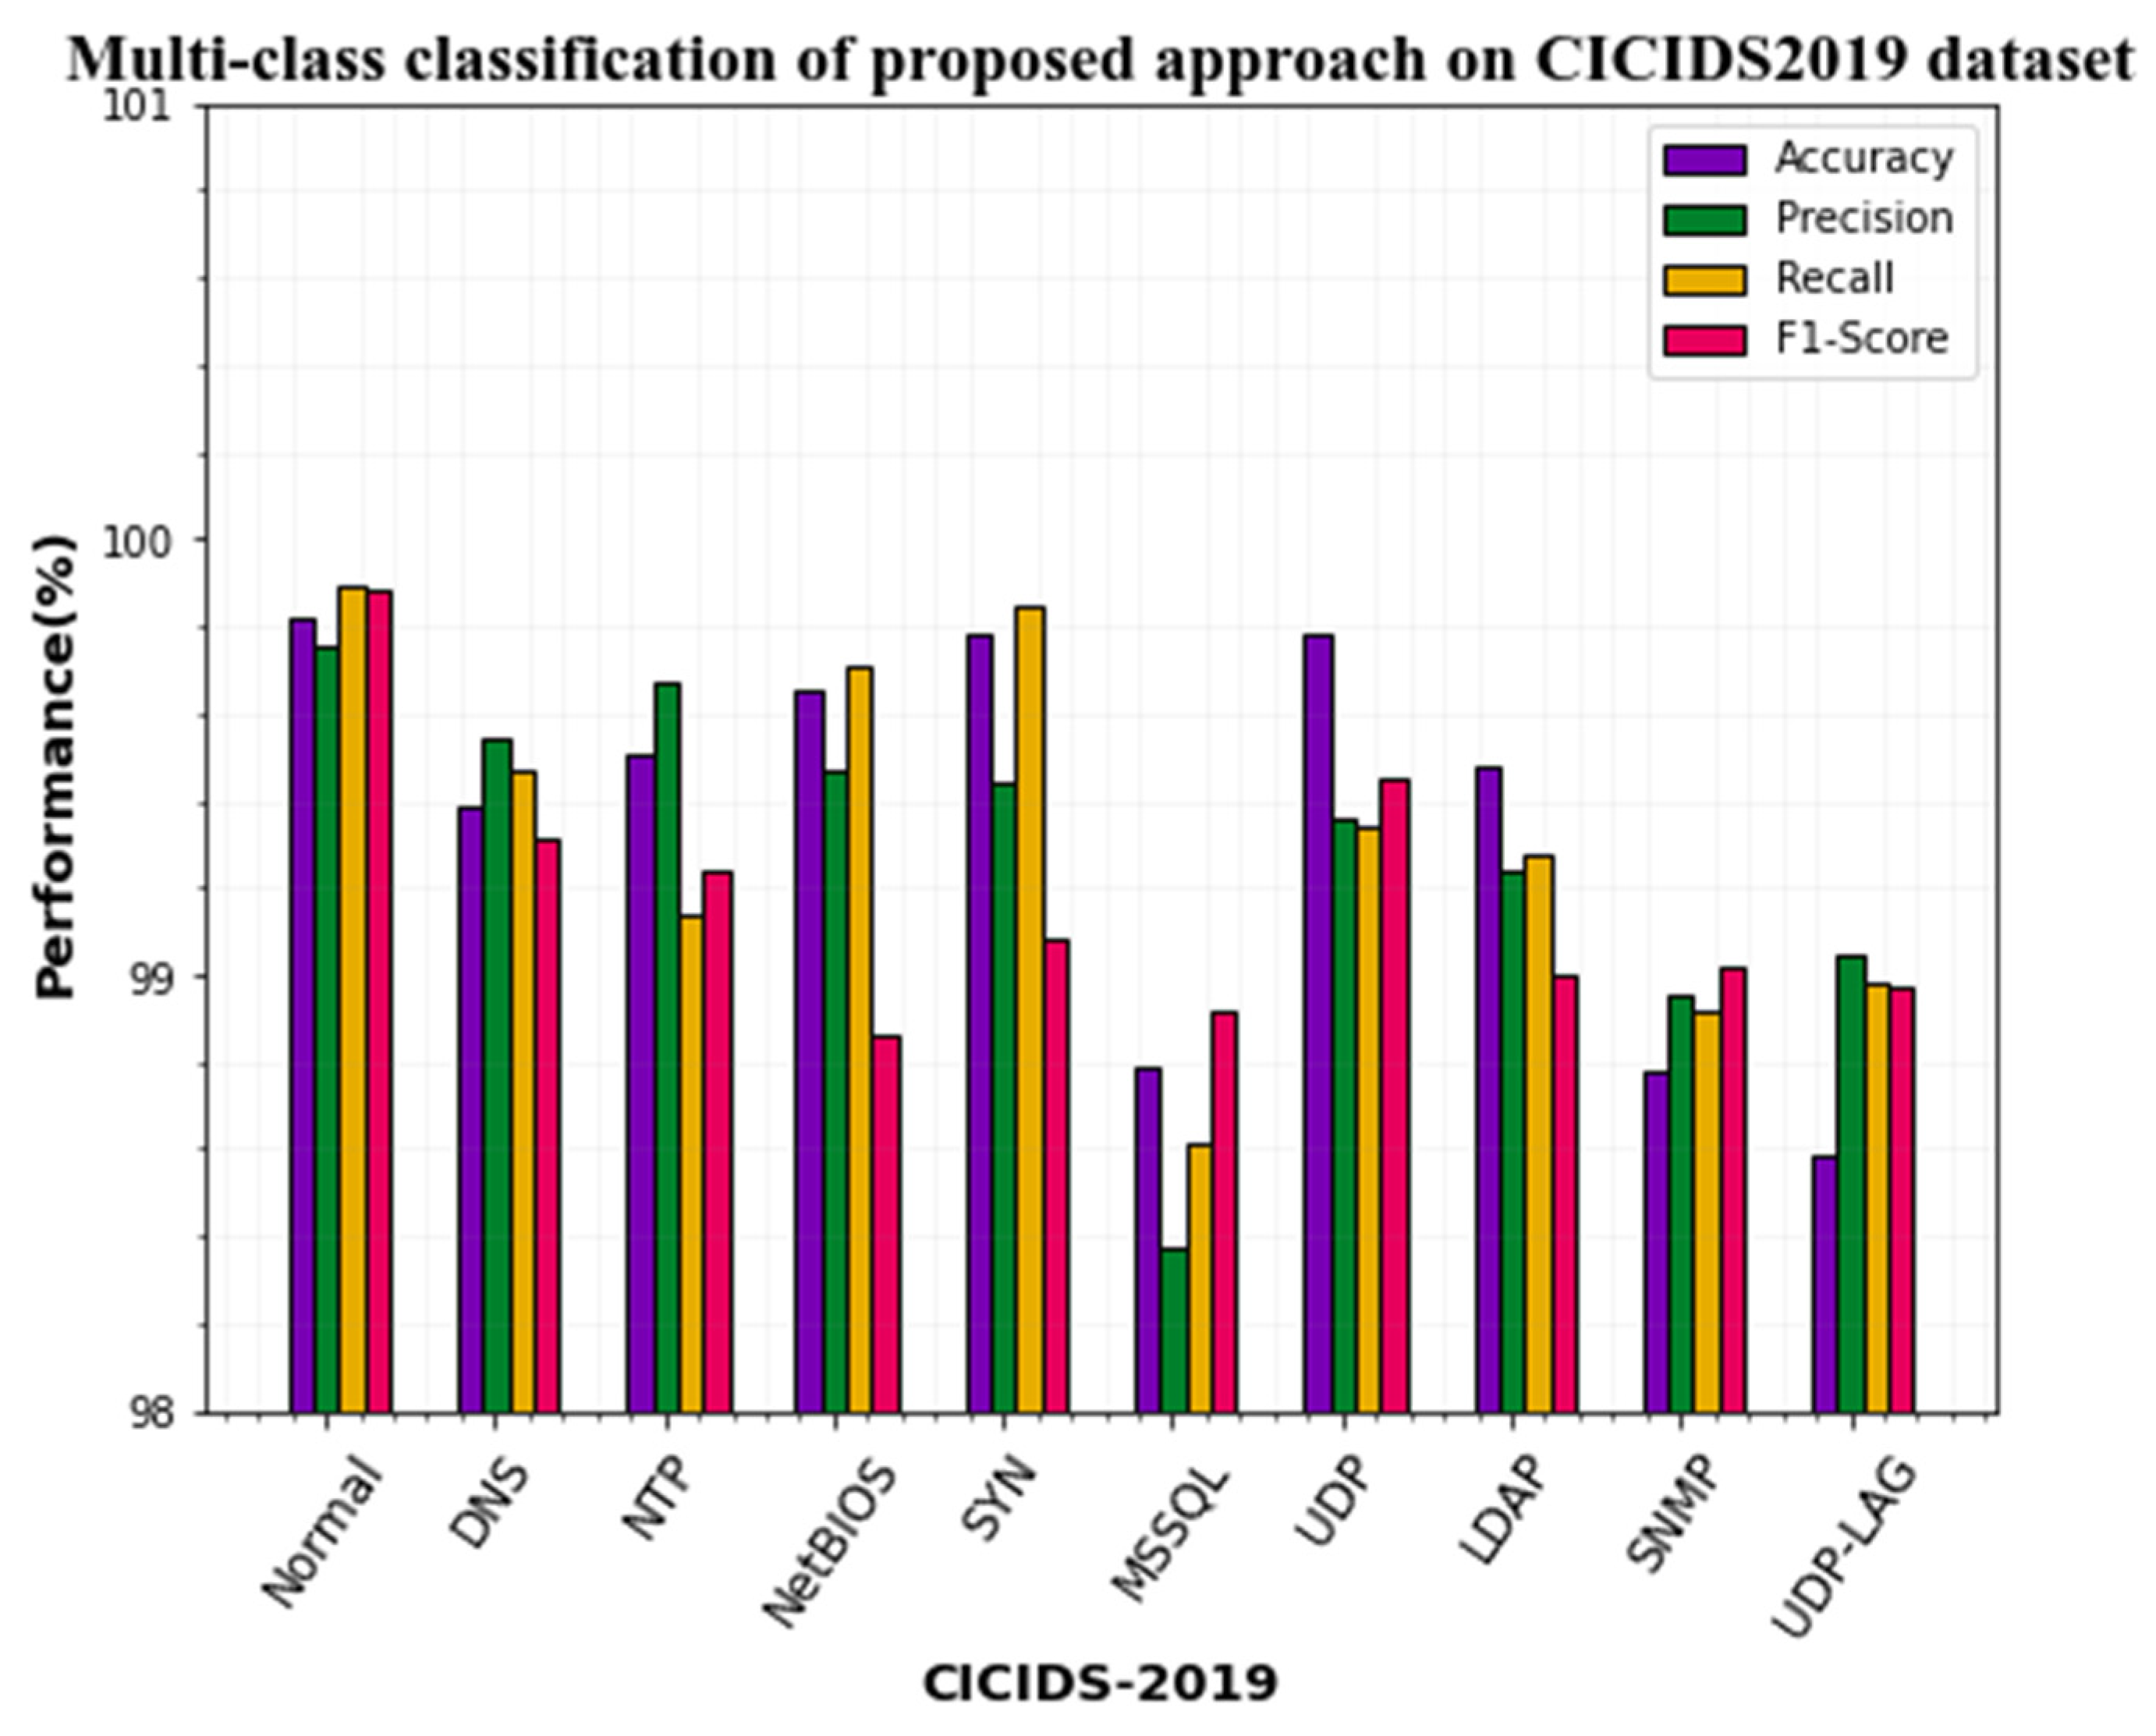
4.5. Performance Evaluation on the CICIDS2017 Dataset
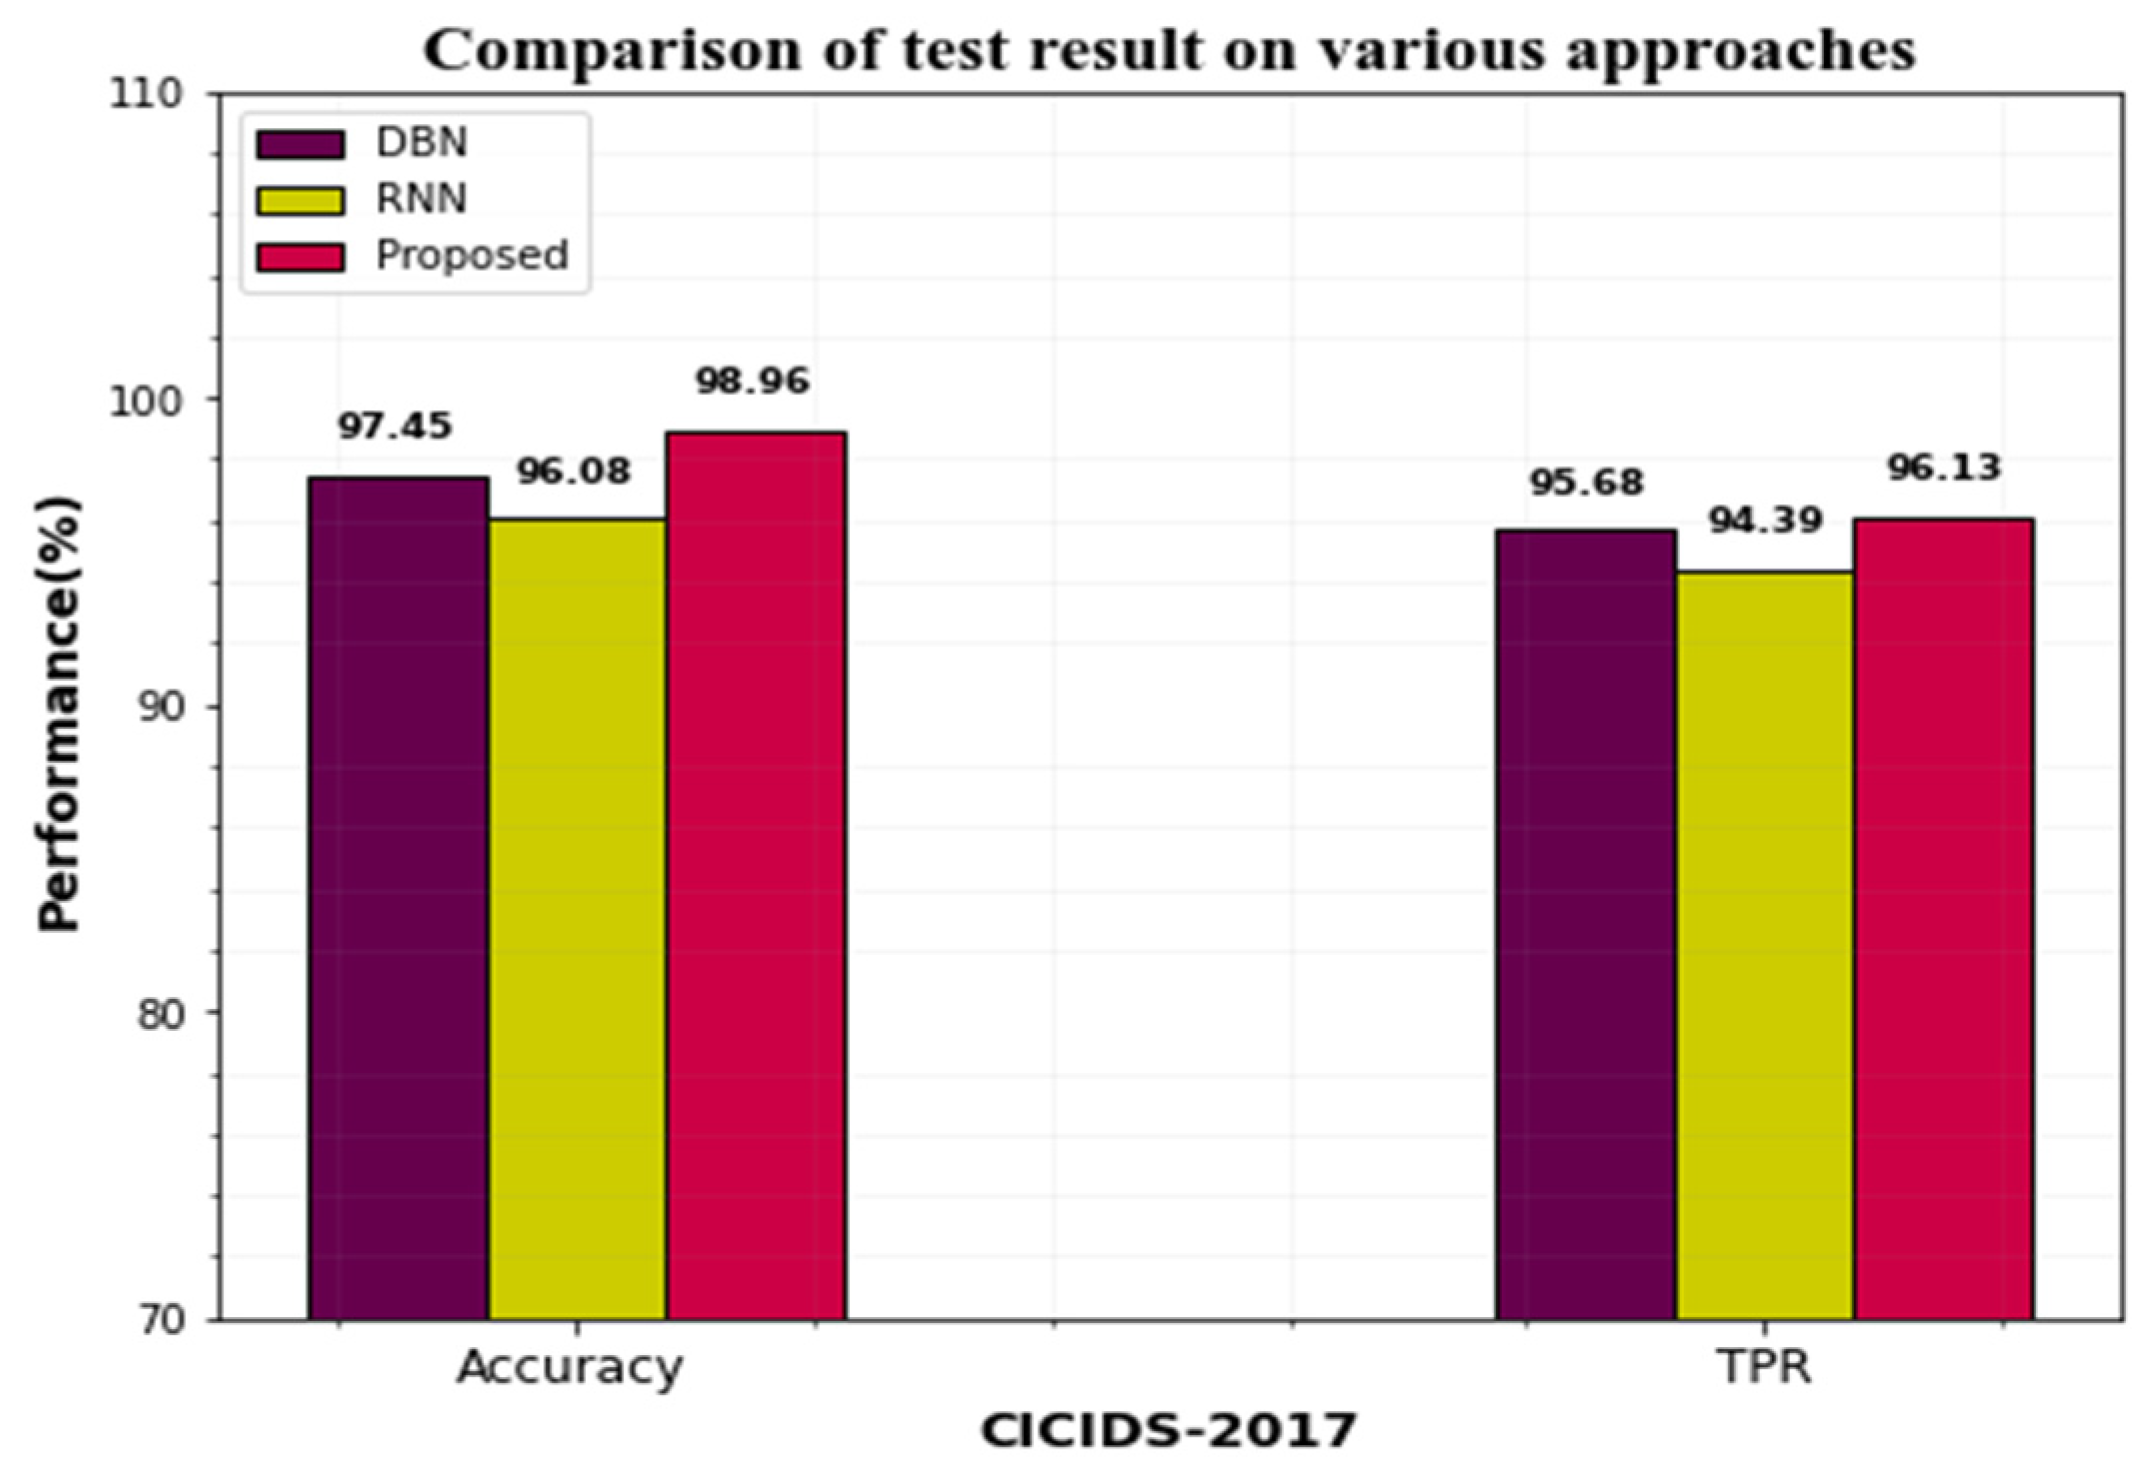
4.6. Comparison of CICIDS-2017 and UNSW-NB15 Datasets with Various Approaches
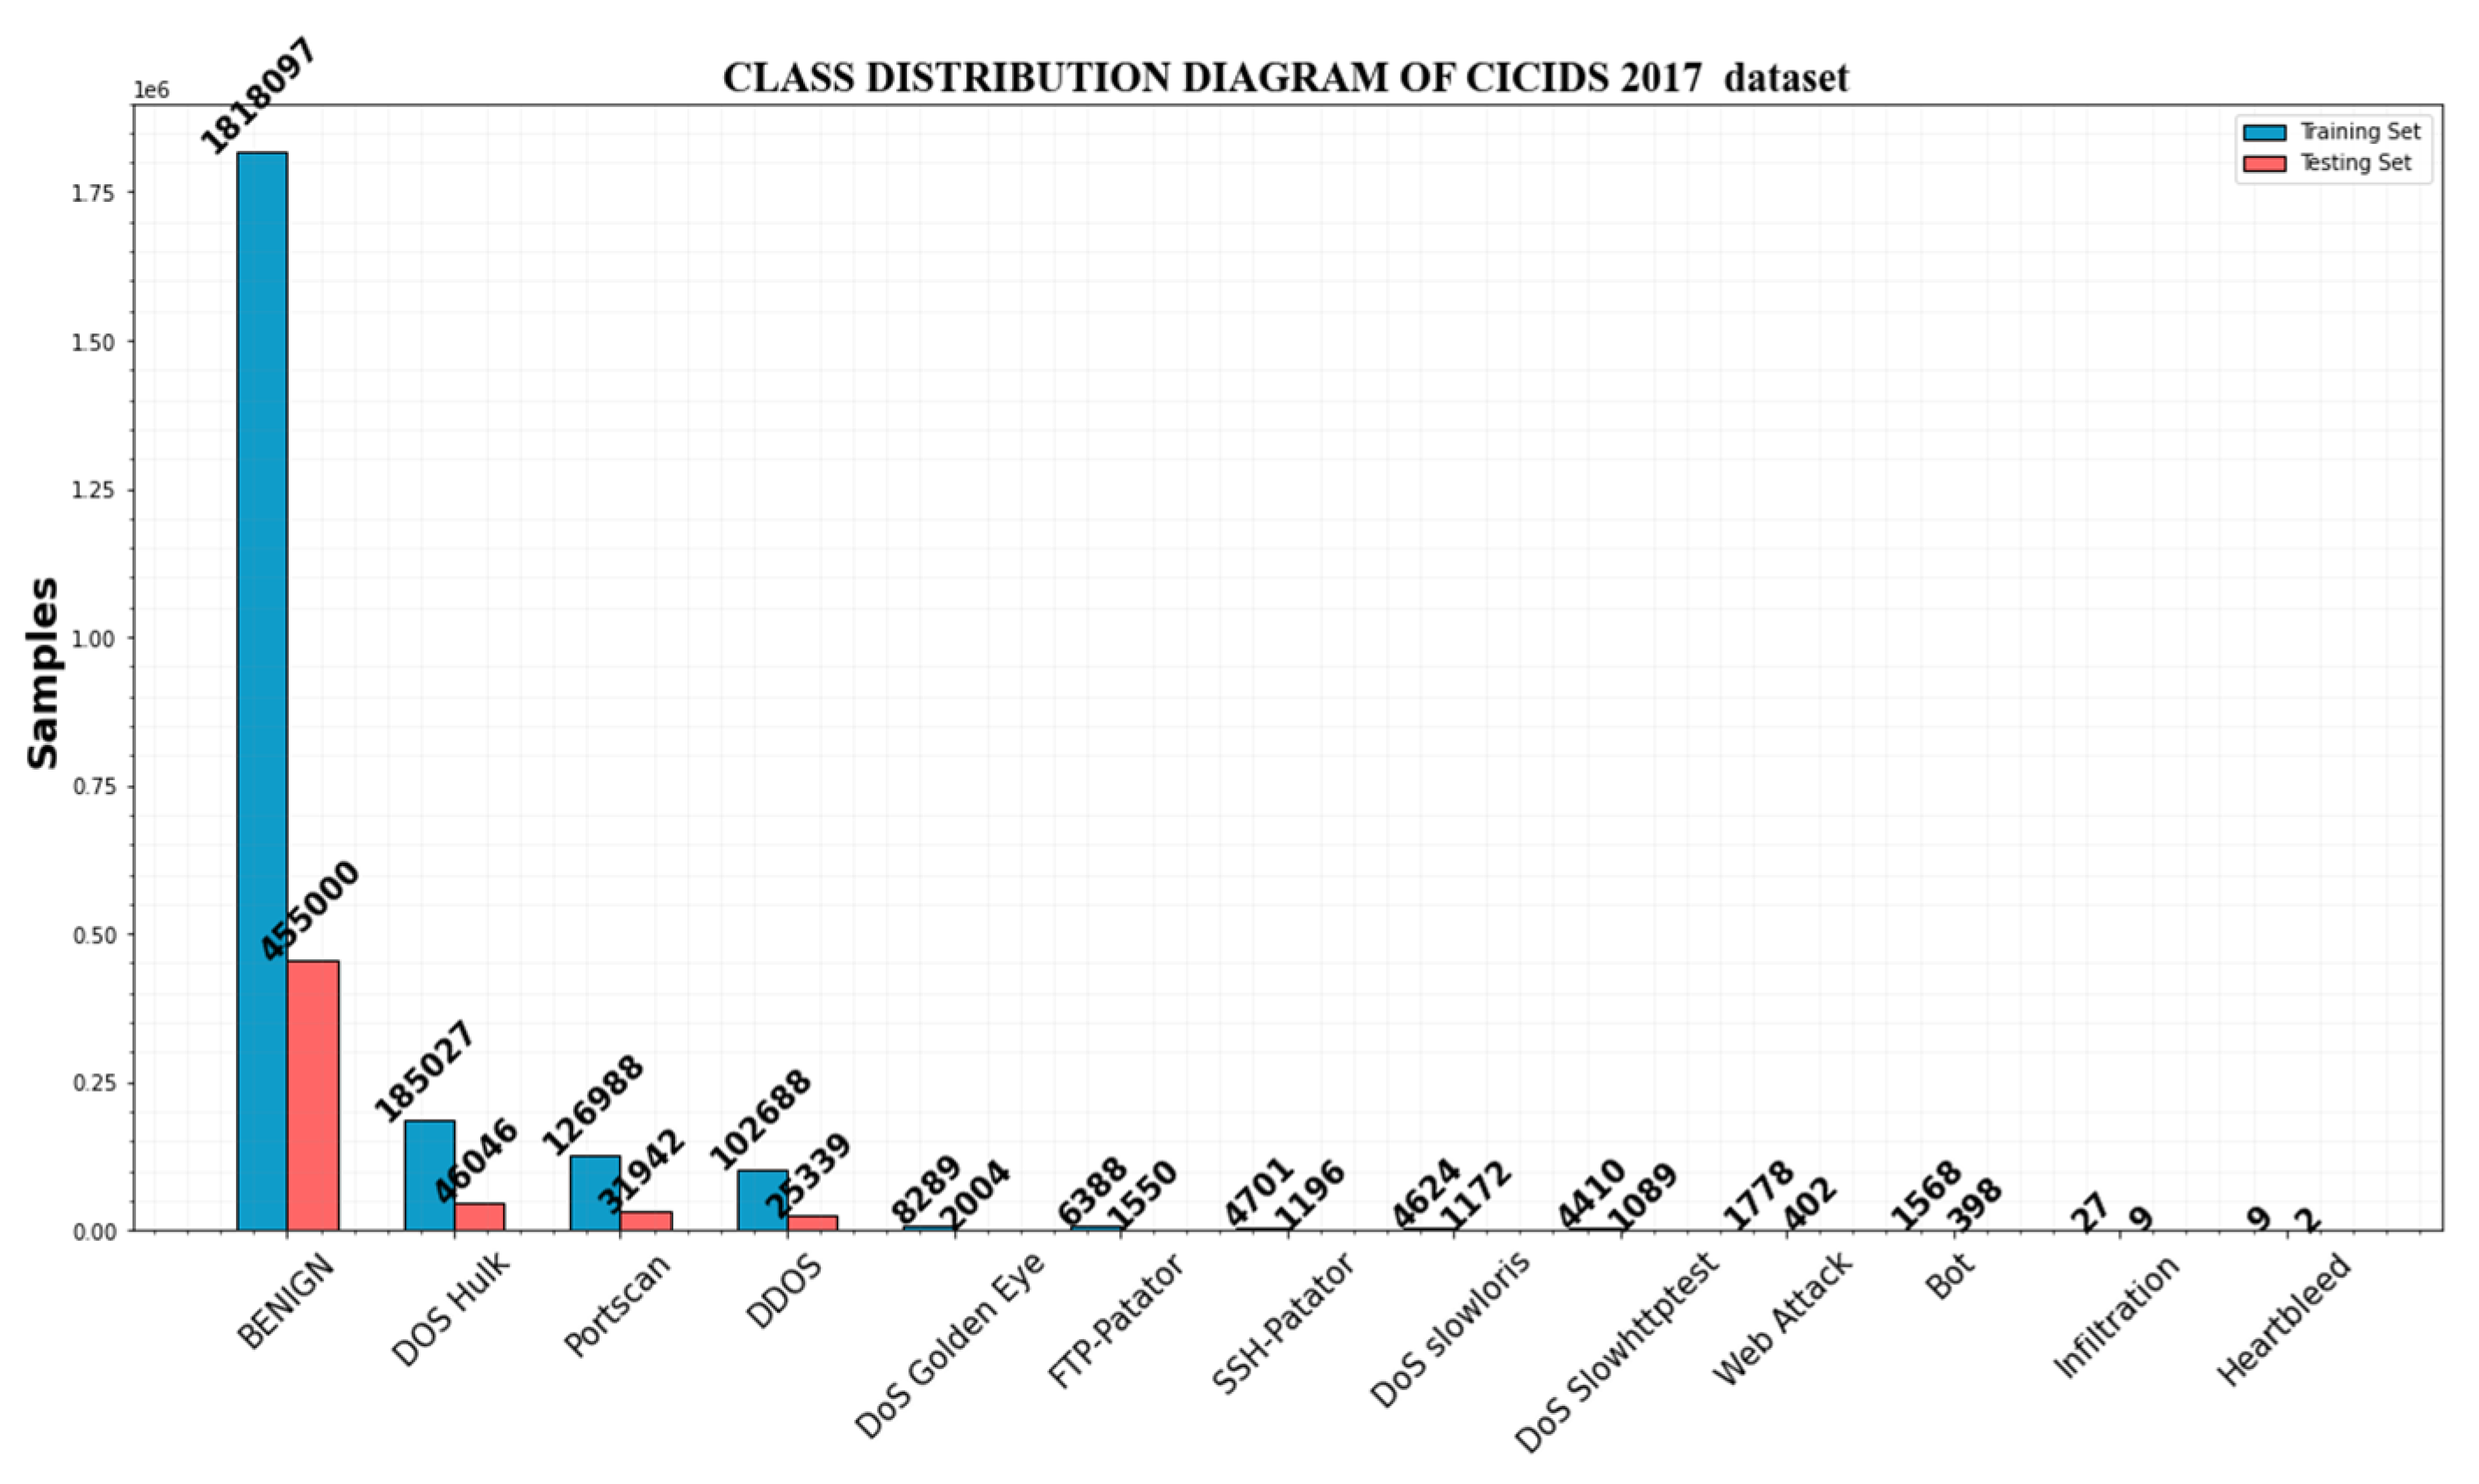
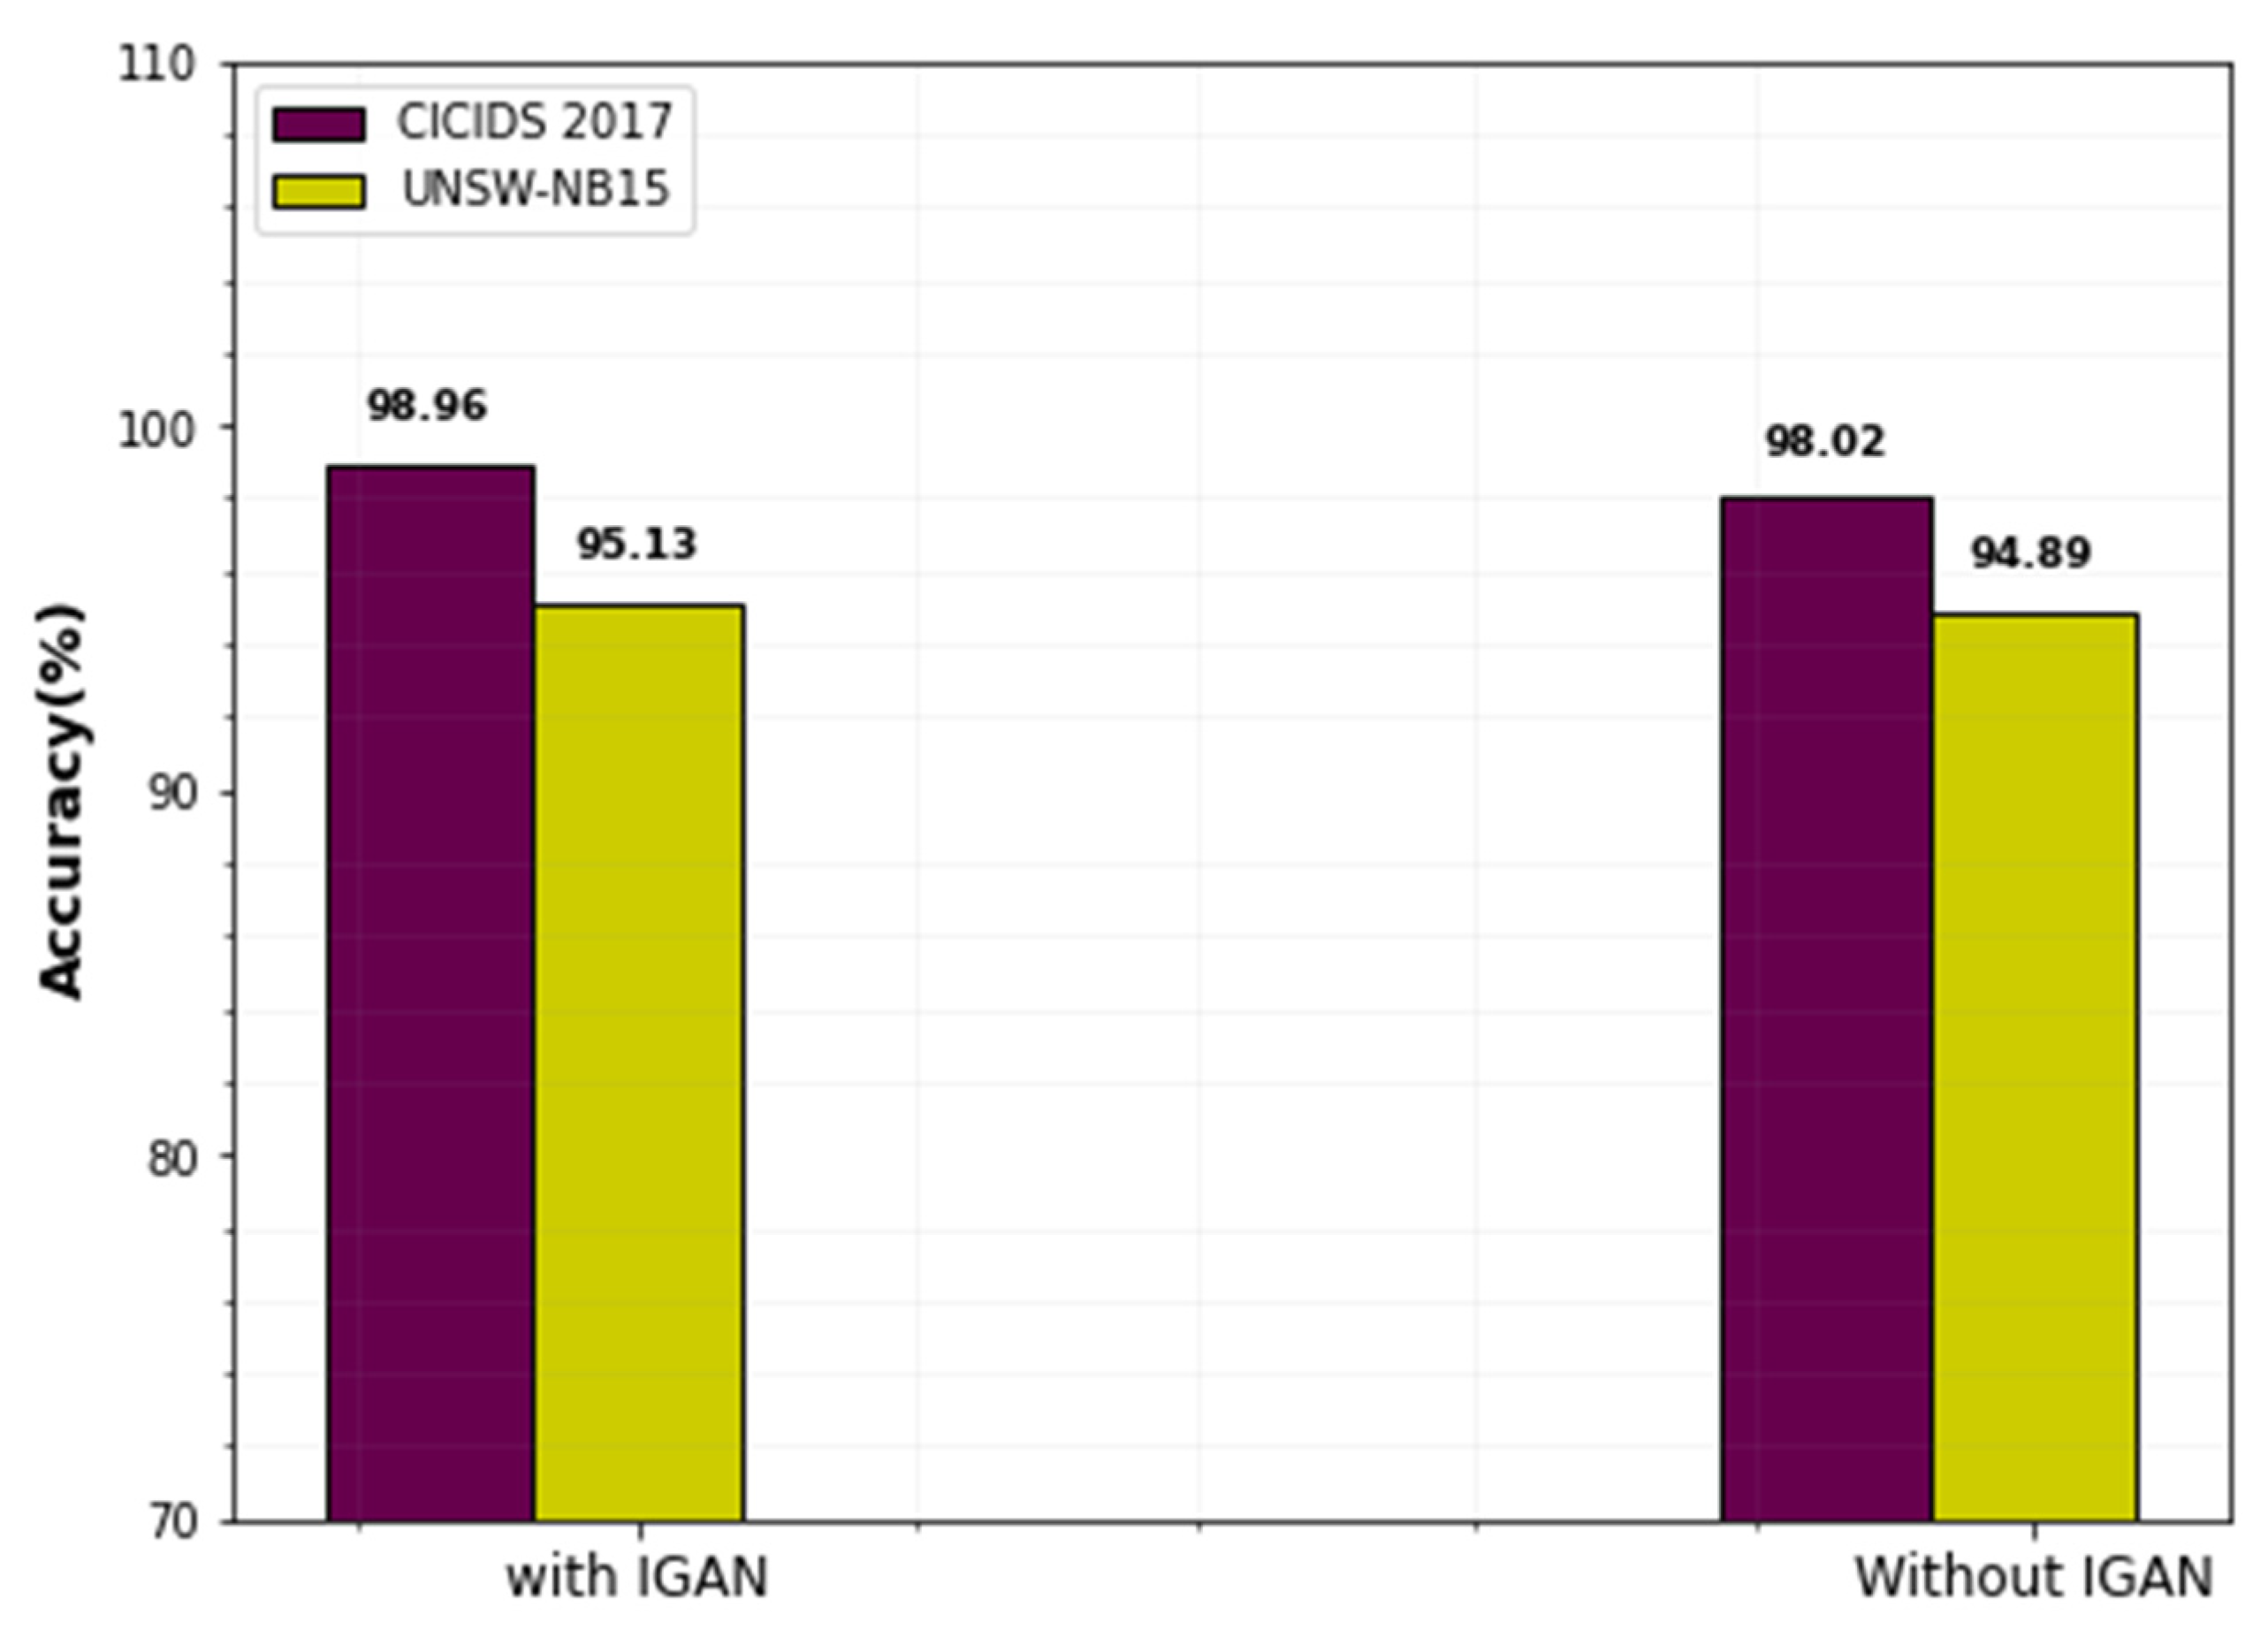
4.7. Data Imbalance Comparison
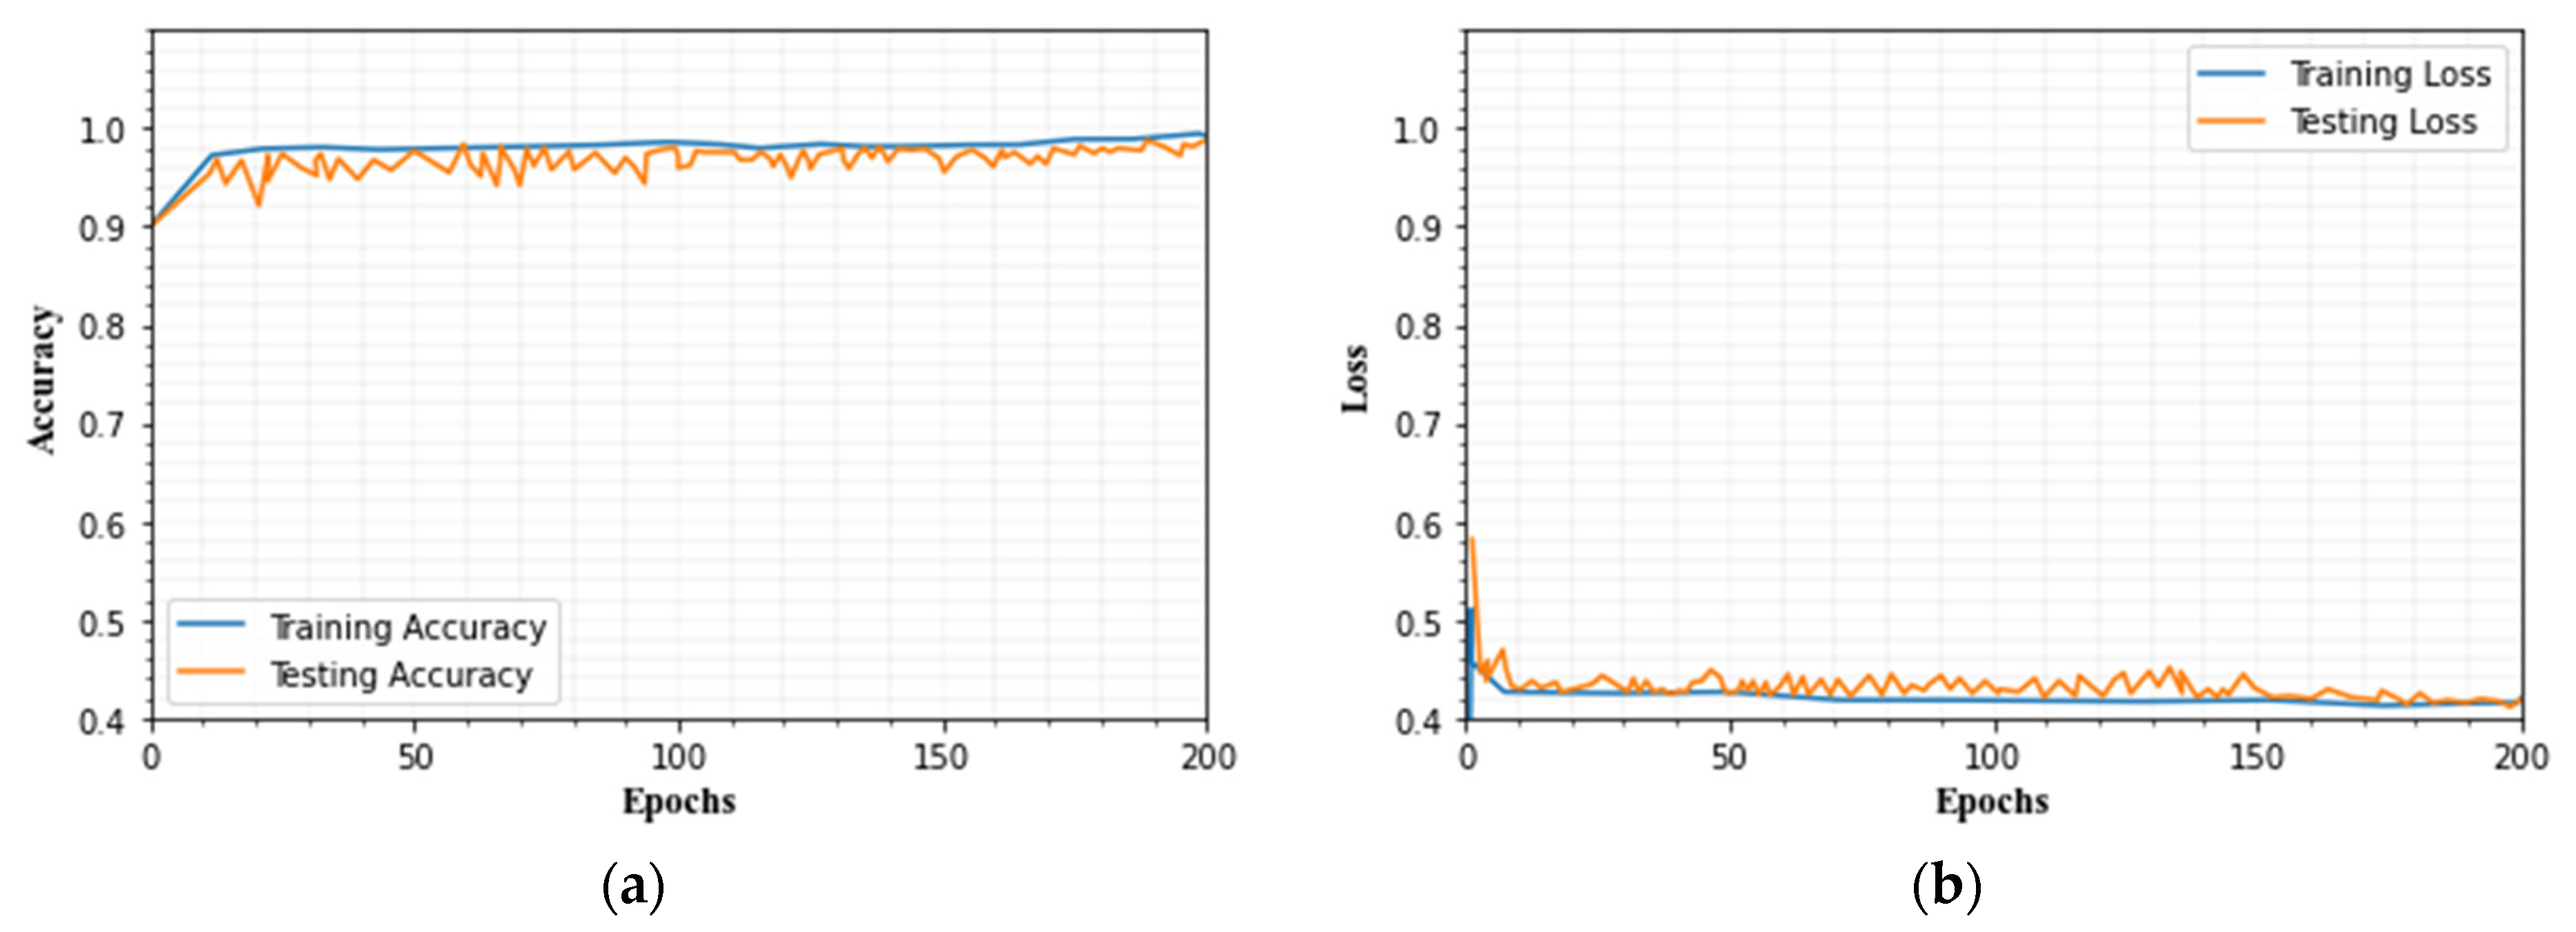
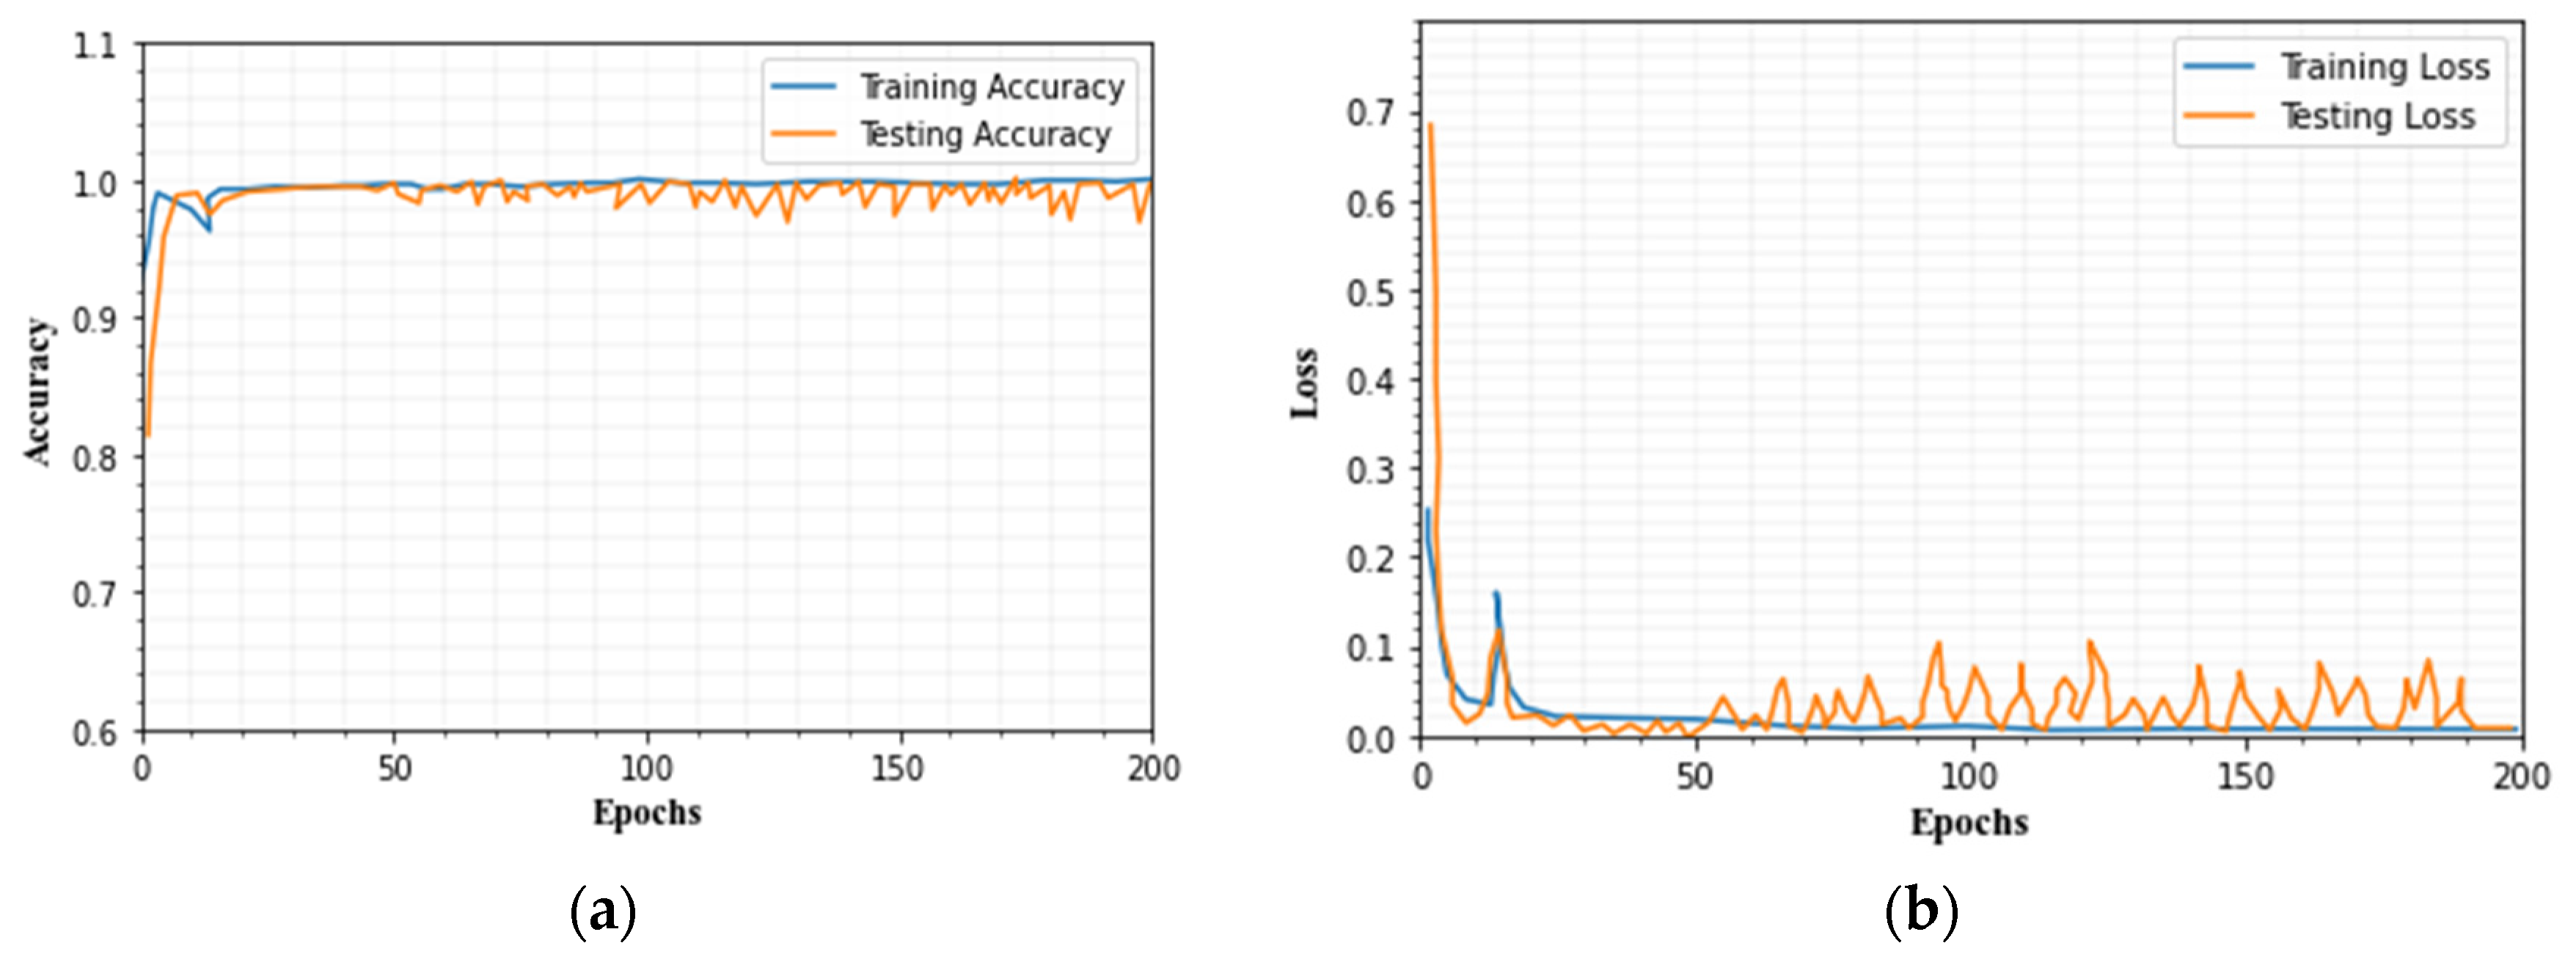
4.8. Evaluation of Training and Testing Set
4.9. Case Study
- (a)
- Experimental setup and configuration
- (b)
- Results
5. Conclusions
Author Contributions
Funding
Institutional Review Board Statement
Informed Consent Statement
Data Availability Statement
Acknowledgments
Conflicts of Interest
References
- Mazini, M.; Shirazi, B.; Mahdavi, I. Anomaly network-based intrusion detection system using a reliable hybrid artificial bee colony and AdaBoost algorithms. J. King Saud Univ.-Inf. Sci. 2019, 31, 541–553. [Google Scholar] [CrossRef]
- Meftah, S.; Rachidi, T.; Assem, N. Network Based Intrusion Detection Using the UNSW-NB15 Dataset. Int. J. Comput. Digit. Syst. 2019, 8, 477–487. [Google Scholar] [CrossRef]
- Khan, M. HCRNNIDS: Hybrid Convolutional Recurrent Neural Network-Based Network Intrusion Detection System. Processes 2021, 9, 834. [Google Scholar] [CrossRef]
- Maseer, Z.K.; Yusof, R.; Bahaman, N.; Mostafa, S.A.; Foozy, C.F.M. Benchmarking of Machine Learning for Anomaly Based Intrusion Detection Systems in the CICIDS2017 Dataset. IEEE Access 2021, 9, 22351–22370. [Google Scholar] [CrossRef]
- Chawla, A.; Lee, B.; Fallon, S.; Jacob, P. Host-based intrusion detection system with combined CNN/RNN model. In Joint European Conference on Machine Learning and Knowledge Discovery in Databases; Springer: Cham, Switzerland, 2018; pp. 149–158. [Google Scholar]
- Zhang, H.; Huang, L.; Wu, C.Q.; Li, Z. An effective convolutional neural network based on SMOTE and Gaussian mixture model for intrusion detection in imbalanced dataset. Comput. Netw. 2020, 177, 107315. [Google Scholar] [CrossRef]
- Jaber, A.N.; Rehman, S.U. FCM–SVM-based intrusion detection system for the cloud computing environment. Clust. Comput. 2020, 23, 3221–3231. [Google Scholar] [CrossRef]
- Gassais, R.; Ezzati-Jivan, N.; Fernandez, J.M.; Aloise, D.; Dagenais, M.R. Multi-level host-based intrusion detection system for Internet of things. J. Cloud Comput. 2020, 9, 62. [Google Scholar] [CrossRef]
- Sudqi Khater, B.; Abdul Wahab, A.W.B.; Idris, M.Y.I.B.; Abdulla Hussain, M.; Ahmed Ibrahim, A. A Lightweight Perceptron-Based Intrusion Detection System for Fog Computing. Appl. Sci. 2019, 9, 178. [Google Scholar] [CrossRef] [Green Version]
- Krishnan, R.S.; Julie, E.G.; Robinson, Y.H.; Kumar, R.; Son, L.H.; Tuan, T.A.; Long, H.V. Modified zone based intrusion detection system for security enhancement in mobile ad hoc networks. Wirel. Netw. 2019, 26, 1275–1289. [Google Scholar] [CrossRef]
- Benmessahel, I.; Xie, K.; Chellal, M. A new evolutionary neural networks based on intrusion detection systems using multiverse optimization. Appl. Intell. 2017, 48, 2315–2327. [Google Scholar] [CrossRef]
- Kumar, P.; Gupta, G.P.; Tripathi, R. A distributed ensemble design based intrusion detection system using fog computing to protect the internet of things networks. J. Ambient. Intell. Humaniz. Comput. 2020, 12, 9555–9572. [Google Scholar] [CrossRef]
- Tama, B.A.; Comuzzi, M.; Rhee, K.-H. TSE-IDS: A Two-Stage Classifier Ensemble for Intelligent Anomaly-Based Intrusion Detection System. IEEE Access 2019, 7, 94497–94507. [Google Scholar] [CrossRef]
- Alamiedy, T.A.; Anbar, M.; Alqattan, Z.N.; Alzubi, Q.M. Anomaly-based intrusion detection system using a multi-objective grey wolf optimization algorithm. J. Ambient. Intell. Humaniz. Comput. 2020, 11, 3735–3756. [Google Scholar] [CrossRef]
- Zavrak, S.; Iskefiyeli, M. Anomaly-Based Intrusion Detection from Network Flow Features Using Variational Autoencoder. IEEE Access 2020, 8, 108346–108358. [Google Scholar] [CrossRef]
- Resende, P.A.A.; Drummond, A.C. Adaptive anomaly-based intrusion detection system using genetic algorithm and profiling. Secur. Priv. 2018, 1, e36. [Google Scholar] [CrossRef] [Green Version]
- Besharati, E.; Naderan, M.; Namjoo, E. LR-HIDS: Logistic regression host-based intrusion detection system for cloud environments. J. Ambient. Intell. Humaniz. Comput. 2018, 10, 3669–3692. [Google Scholar] [CrossRef]
- Ghugar, U.; Pradhan, J.; Bhoi, S.K.; Sahoo, R.R. LB-IDS: Securing Wireless Sensor Network Using Protocol Layer Trust-Based Intrusion Detection System. J. Comput. Netw. Commun. 2019, 2019, 2054298. [Google Scholar] [CrossRef]
- Yang, J.; Li, T.; Liang, G.; He, W.; Zhao, Y. A Simple Recurrent Unit Model Based Intrusion Detection System With DCGAN. IEEE Access 2019, 7, 83286–83296. [Google Scholar] [CrossRef]
- Mayuranathan, M.; Murugan, M.; Dhanakoti, V. Best features-based intrusion detection system by RBM model for detecting DDoS in a cloud environment. J. Ambient. Intell. Humaniz. Comput. 2021, 12, 3609–3619. [Google Scholar] [CrossRef]
- Lee, J.; Park, K. GAN-based imbalanced data intrusion detection system. Pers. Ubiquitous Comput. 2019, 25, 121–128. [Google Scholar] [CrossRef]
- Fu, Y.; Du, Y.; Cao, Z.; Li, Q.; Xiang, W. A Deep Learning Model for Network Intrusion Detection with Imbalanced Data. Electronics 2022, 11, 898. [Google Scholar] [CrossRef]
- Jiang, K.; Wang, W.; Wang, A.; Wu, H. Network Intrusion Detection Combined Hybrid Sampling with Deep Hierarchical Network. IEEE Access 2020, 8, 32464–32476. [Google Scholar] [CrossRef]
- Al, S.; Dener, M. STL-HDL: A new hybrid network intrusion detection system for imbalanced dataset on big data environment. Comput. Secur. 2021, 110, 102435. [Google Scholar] [CrossRef]
- Cao, B.; Li, C.; Song, Y.; Qin, Y.; Chen, C. Network Intrusion Detection Model Based on CNN and GRU. Appl. Sci. 2022, 12, 4184. [Google Scholar] [CrossRef]
- Mulyanto, M.; Faisal, M.; Prakosa, S.W.; Leu, J.-S. Effectiveness of Focal Loss for Minority Classification in Network Intrusion Detection Systems. Symmetry 2020, 13, 4. [Google Scholar] [CrossRef]
- Man, J.; Sun, G. A Residual Learning-Based Network Intrusion Detection System. Secur. Commun. Netw. 2021, 2021, 5593435. [Google Scholar] [CrossRef]


| Reference | Approach | Merits | Demerits |
|---|---|---|---|
| Lee. J and Park. K [21] | 1D-CNN | The classifier’s effectiveness in predicting minorities has been improved. | In terms of computation, it is more expensive than the other approaches. |
| Fu et al. [22] | Bi-LSTM | Compared to other algorithms, this one is simpler, faster, and less complex. | The quantity of outliers in the data affects performance. |
| Jiang et al. [23] | CNN with Bi-LSTM | The classifiers are one-of-a-kind and low-cost to run. | It is a confusing and time-consuming procedure. |
| Al. S and Dener. M [24] | CNN and LSTM | An algorithm that is simpler, easier, faster, and less difficult. | The main disadvantage of this model is that crucial data can be lost. |
| Cao et al. [25] | RF algorithm | Reduces the rate at which duplicate data is created | In multiclass, the performance standard falls. |
| Mulyanto et al. [26] | FL-NIDS | Faster training speed of undersampling | Only focusing on problems with binary classification |
| Man. J and Sun. G [27] | residual learning | Increased accuracy level | Unable to resolve the issue of imbalance class highly |
| Level | Names of the Layers | Size of Input | Kernel Size | Step Size | Pooled Area | Output Size |
|---|---|---|---|---|---|---|
| Input | Input | 32 × 32 | 6 × 6 | 1 | 26 × 26 | |
| 1st layer | Convolutional | 5@28 × 28 | 2 | 2 × 2 | 6@12 × 12 | |
| 2nd layer | Pool | 5@16 × 16 | 5 × 5 | 1 | 16@10 × 10 | |
| 3rd layer | Convolutional | 16@14 × 14 | 2 | 2 × 2 | 16@5 × 5 | |
| 4th layer | Pool | 16@6 × 6 | 6 × 6 | 1 | 124@2 × 2 | |
| 5th layer | Fully convolutional | 1 × 124 | 1 × 86 | |||
| 6th layer | Fully convolutional | 1 × 82 | 1 × 8 | |||
| Output | Output | 1 × 7 |
| Parameter | Value |
|---|---|
| MLP layers | 3 |
| Epoch | 20 |
| Batch size | 32 |
| Decay | 10−5 |
| Momentum | 0.9 |
| Learning rate | 0.01 |
| MLP hidden nodes | 48 |
| RNN hidden units | 128 |
| Class | Training Set Size | Testing Set Size |
|---|---|---|
| Normal | 1,553,132 | 443,755 |
| Generic | 150,836 | 43,097 |
| Dos | 11,449 | 3269 |
| Fuzzers | 16,972 | 4849 |
| Backdrops | 1630 | 466 |
| Shellcode | 1057 | 303 |
| Worms | 122 | 35 |
| Exploits | 31,167 | 8906 |
| Analysis | 1874 | 535 |
| Reconnaissance | 9791 | 2797 |
| No | Feature | No | Feature | No | Feature |
|---|---|---|---|---|---|
| 1 | rate | 16 | loss | 31 | Response_body_ien |
| 2 | dur | 17 | synack | 32 | Ct_src_itm |
| 3 | dpkts | 18 | swin | 33 | ackdat |
| 4 | Ct_src_dst | 19 | Sjit | 34 | State |
| 5 | dwin | 20 | Ct_dst_sport_ltm | 35 | Ct_src_dport_ltm |
| 6 | spkts | 21 | smean | 36 | djit |
| 7 | proto | 22 | Ct_flw_http_mthd | 37 | sbytes |
| 8 | Ct_dst_src_ltm | 23 | Ct_srv_src | 38 | dtrcpb |
| 9 | Sttl | 24 | dbytes | 39 | Is_sm_ips_ports |
| 10 | Attack_cat | 25 | dinpkt | 40 | stcpb |
| 11 | Is_ftp_login | 26 | sinpkt | 41 | Trans_depth |
| 12 | dttl | 27 | Ct_state_ttl | 42 | service |
| 13 | sloss | 28 | tcprtt | 43 | Ct_ftp_cmd |
| 14 | dload | 29 | dmean | ||
| 15 | sload | 30 | Ct_dst_ltm |
| Class | Training Set Size | Testing Set Size |
|---|---|---|
| BENIGN | 1,591,167 | 454,620 |
| Dos Hulk | 161,751 | 46,215 |
| Port Scan | 111,251 | 31,786 |
| XSS | 457 | 130 |
| Infiltration | 26 | 7 |
| DDoS | 89,618 | 25,606 |
| DoS Golden Eye | 7205 | 2059 |
| DoS slow loris | 4057 | 1159 |
| FTP | 5516 | 1588 |
| Brute force | 1055 | 301 |
| SSH | 4128 | 1179 |
| DoS slow http test | 3849 | 1100 |
| Bot | 1376 | 393 |
| MSSQL | 15 | 4 |
| Heart bleed | 8 | 2 |
| No | Feature | No | Feature | No | Feature |
|---|---|---|---|---|---|
| 1 | Total Length of Bwd Packets | 25 | Forward IAT Std | 49 | Bwd IAT Max |
| 2 | Init_Win_bytes_forward | 26 | Bwd Packets Length Max | 50 | Forward Packets Length Min |
| 3 | protocol | 27 | Forward Packets Length Std | 51 | Fwd IAT Max |
| 4 | Subflow Forward Packets | 28 | Backward IAT Total | 52 | Fwd IAT Min |
| 5 | Forward Header Length | 29 | Forward Header Length1 | 53 | Average Bwd Segment Size Fwd Packets/s |
| 6 | ECE Flag Counts | 30 | Backward IAT Std | 54 | Bwd IAT Mean |
| 7 | Subflow Fwd Bytes | 31 | Total backward packets | 55 | Flow duration |
| 8 | Source port | 32 | Backward IAT Min | 56 | Total Length of forwarding Packets |
| 9 | Subflow Bwd Bytes | 33 | Forward PSH Flags | 57 | Subflow Bwd Packets |
| 10 | Down/Up Ratio | 34 | Total fwd packets | 58 | Fwd Packet Length Max |
| 11 | Average Packet Size | 35 | Bwd Header Length | 59 | Destination port |
| 12 | Avg Fwd Segment Size | 36 | Forward Packet Length Mean | 60 | RST Flag Count |
| 13 | Label | 37 | SYN Flag Counts | 61 | Forward IAT mean |
| 14 | Idle Min | 38 | Active Mean | 62 | Backward Packet Length Std |
| 15 | Packet Length Variance | 39 | PSH Flag Counts | 63 | Min Packet Length |
| 16 | min_seg_size_fwd | 40 | Flow IAT Std | 64 | Flow IAT Max |
| 17 | FIN Flag Counts | 41 | Backward Packet Length Mean | 65 | Active Max |
| 18 | URG Flag Counts | 42 | Packet Length Std | 66 | Max Packet Length |
| 19 | Acknowledge Flag Count | 43 | Flow Bytes/s | 67 | Flow Packets/s |
| 20 | Packet Length Mean | 44 | Backward Packets/s | 68 | Active Min |
| 21 | Active Std | 45 | Idle Mean | 69 | Forward IAT Total |
| 22 | Backward Packet Length Min | 46 | Idle Max | 70 | Flow IAT Min |
| 23 | Init_Win_bytes_bwd | 47 | Flow IAT Mean | ||
| 24 | act_data_pkt_fwd | 48 | Idle Std |
| Attack Types | Precision | F1-Score | Accuracy | Recall |
|---|---|---|---|---|
| Normal | 99.64 | 99.71 | 99.76 | 99.56 |
| Analysis | 99.43 | 99 | 99.24 | 99.77 |
| Backdoors | 99 | 99.39 | 99.12 | 99.63 |
| DoS | 99.25 | 99.17 | 99 | 99.20 |
| Exploits | 98.76 | 98.16 | 99.13 | 98.84 |
| Fuzzers | 98.88 | 99.47 | 99.72 | 99 |
| Generic | 99.35 | 99.09 | 99.23 | 99.14 |
| Reconnaissance | 99.03 | 99.23 | 99.05 | 99.32 |
| Shellcode | 99.45 | 99.73 | 99.81 | 99.44 |
| Worms | 99.14 | 99 | 99.16 | 99.29 |
| Attack Types | Precision | Accuracy | F1-Score | Recall |
|---|---|---|---|---|
| Normal | 99.75 | 99.82 | 99.88 | 99.89 |
| DNS | 99.54 | 99.39 | 99.31 | 99.47 |
| NTP | 99.67 | 99.51 | 99.24 | 99.14 |
| NetBIOS | 99.47 | 99.65 | 98.86 | 99.71 |
| SYN | 99.44 | 99.78 | 99.08 | 99.85 |
| MSSQL | 98.37 | 98.79 | 98.92 | 98.61 |
| UDP | 99.36 | 99.78 | 99.45 | 99.34 |
| LDAP | 99.24 | 99.48 | 99 | 99.28 |
| SNMP | 98.95 | 98.78 | 99.02 | 98.92 |
| UDP-LAG | 99.05 | 98.59 | 98.97 | 98.98 |
| Dataset | Approaches | Accuracy | TPR | FPR |
|---|---|---|---|---|
| CICIDS-2017 | DBN | 97.45 | 95.68 | 0.85 |
| RNN | 96.08 | 94.39 | 0.92 | |
| Proposed | 98.96 | 96.13 | 0.76 | |
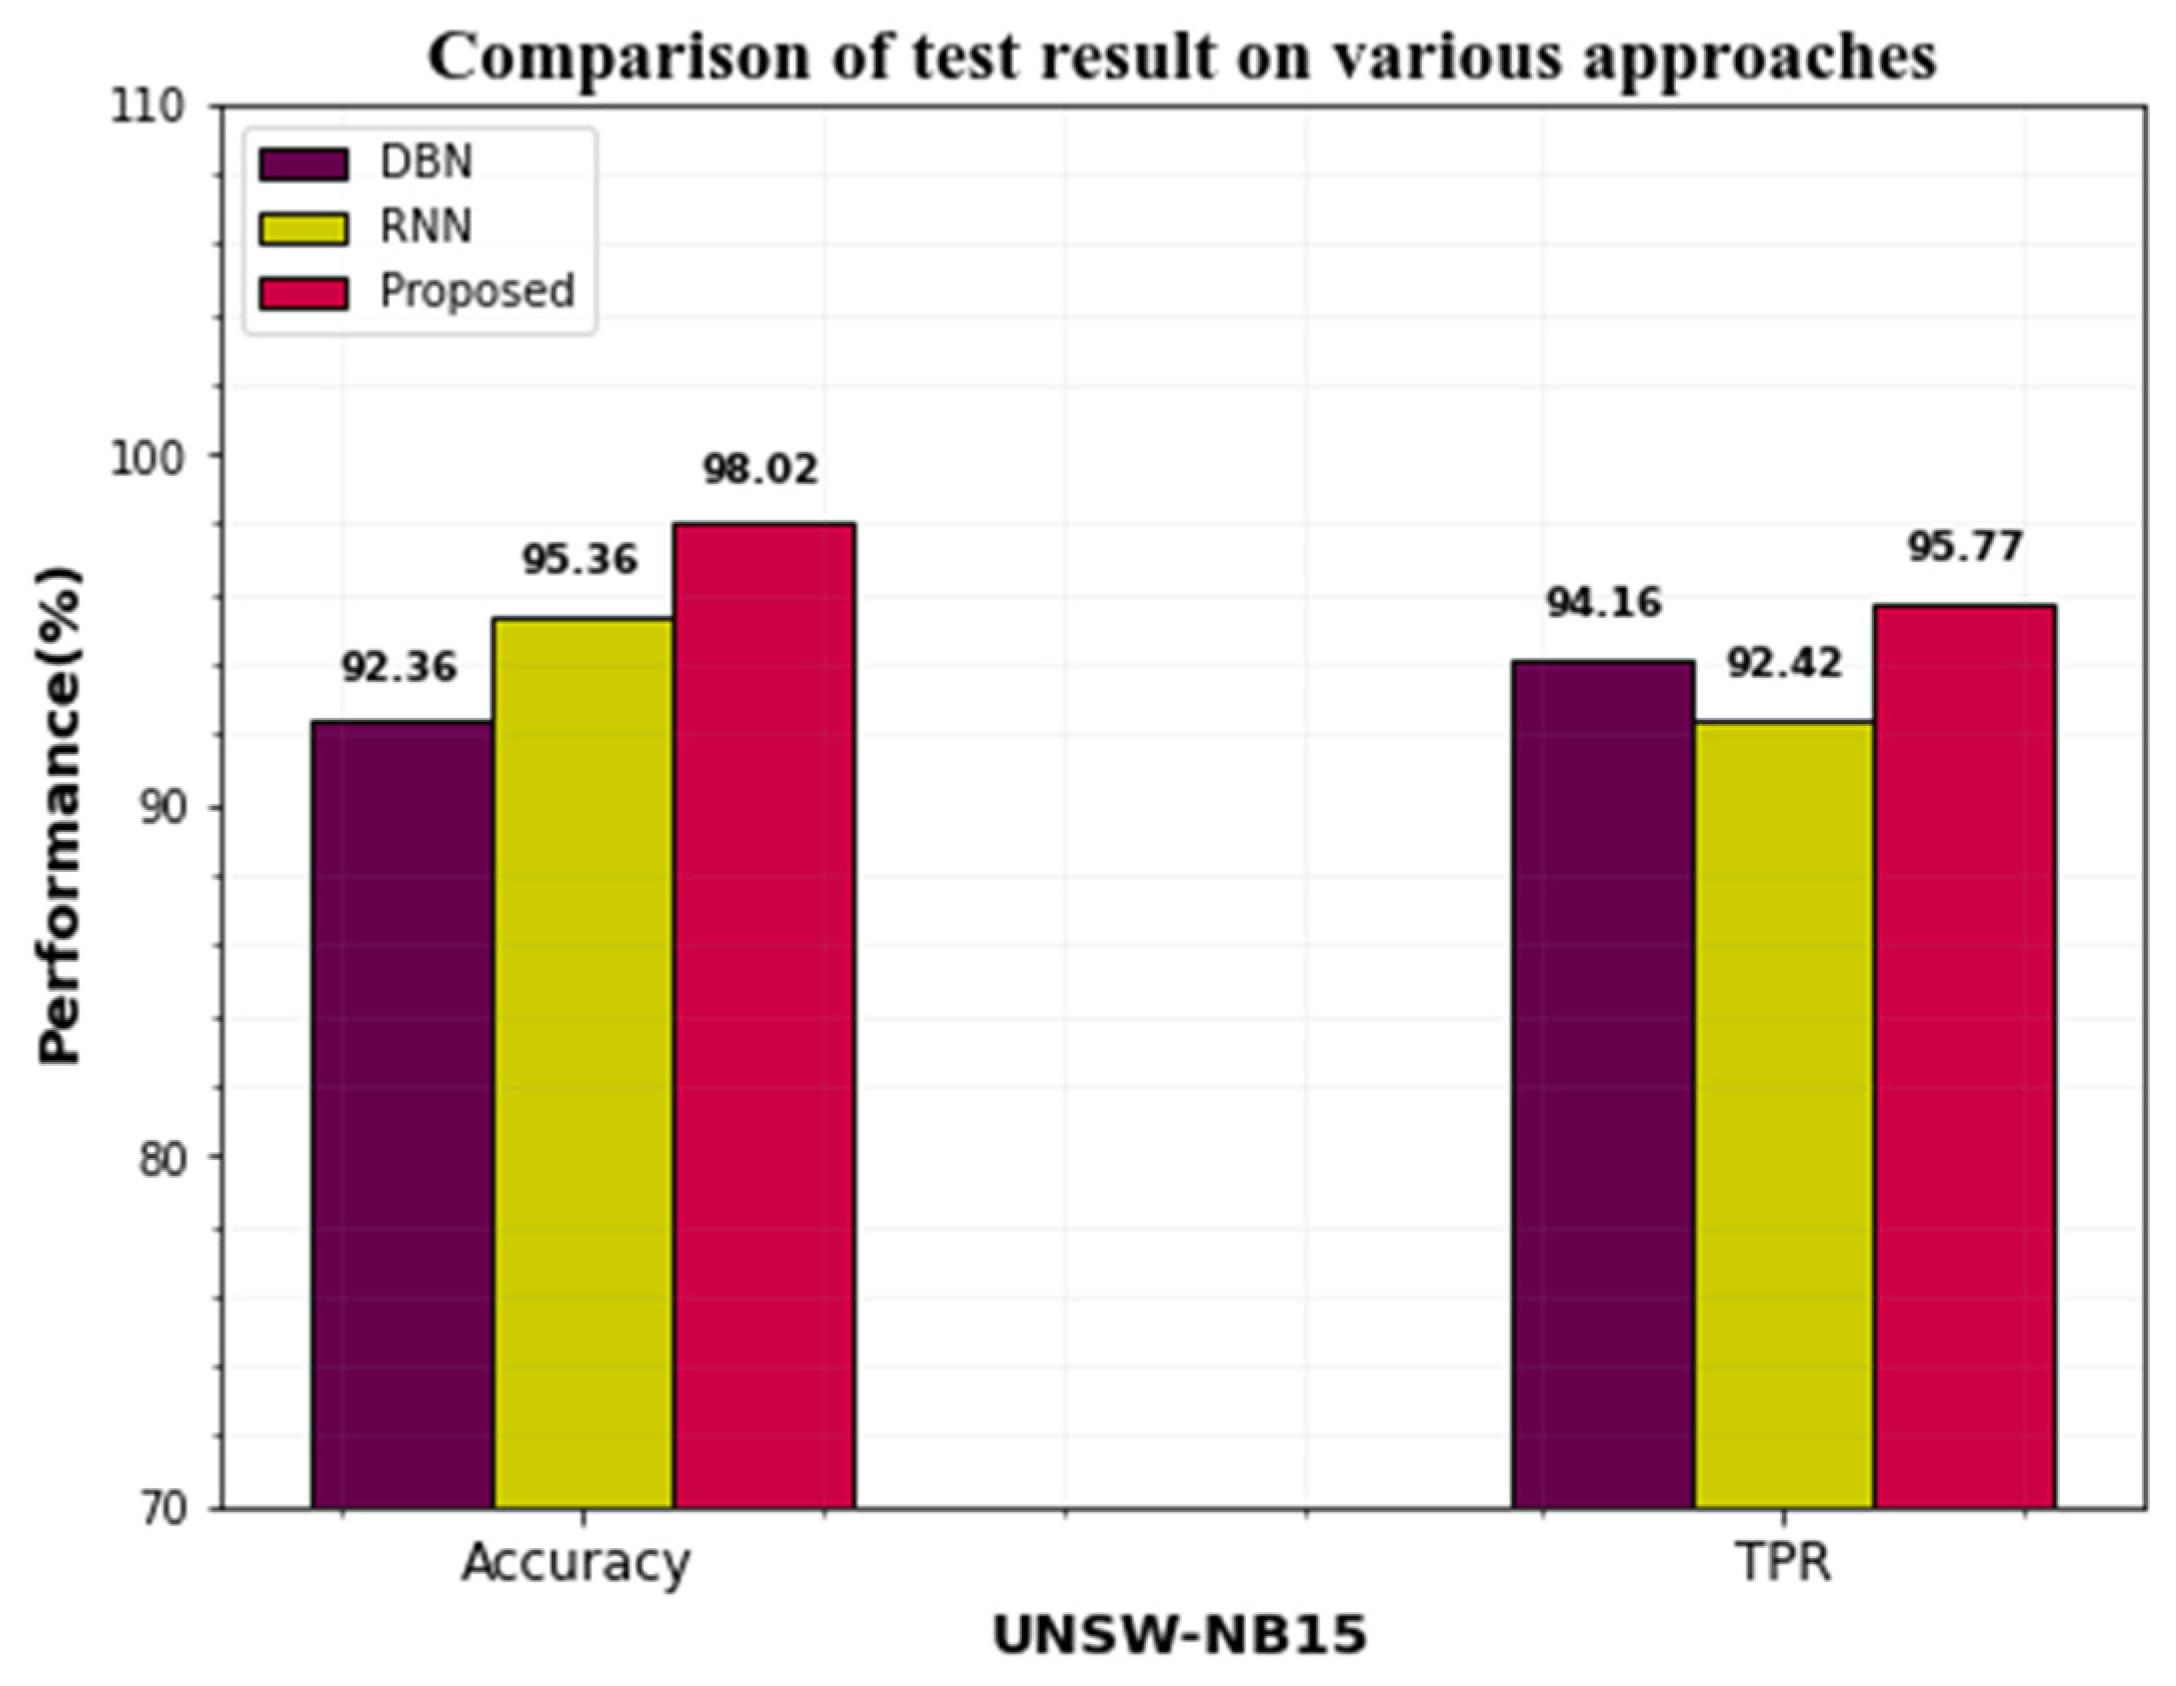
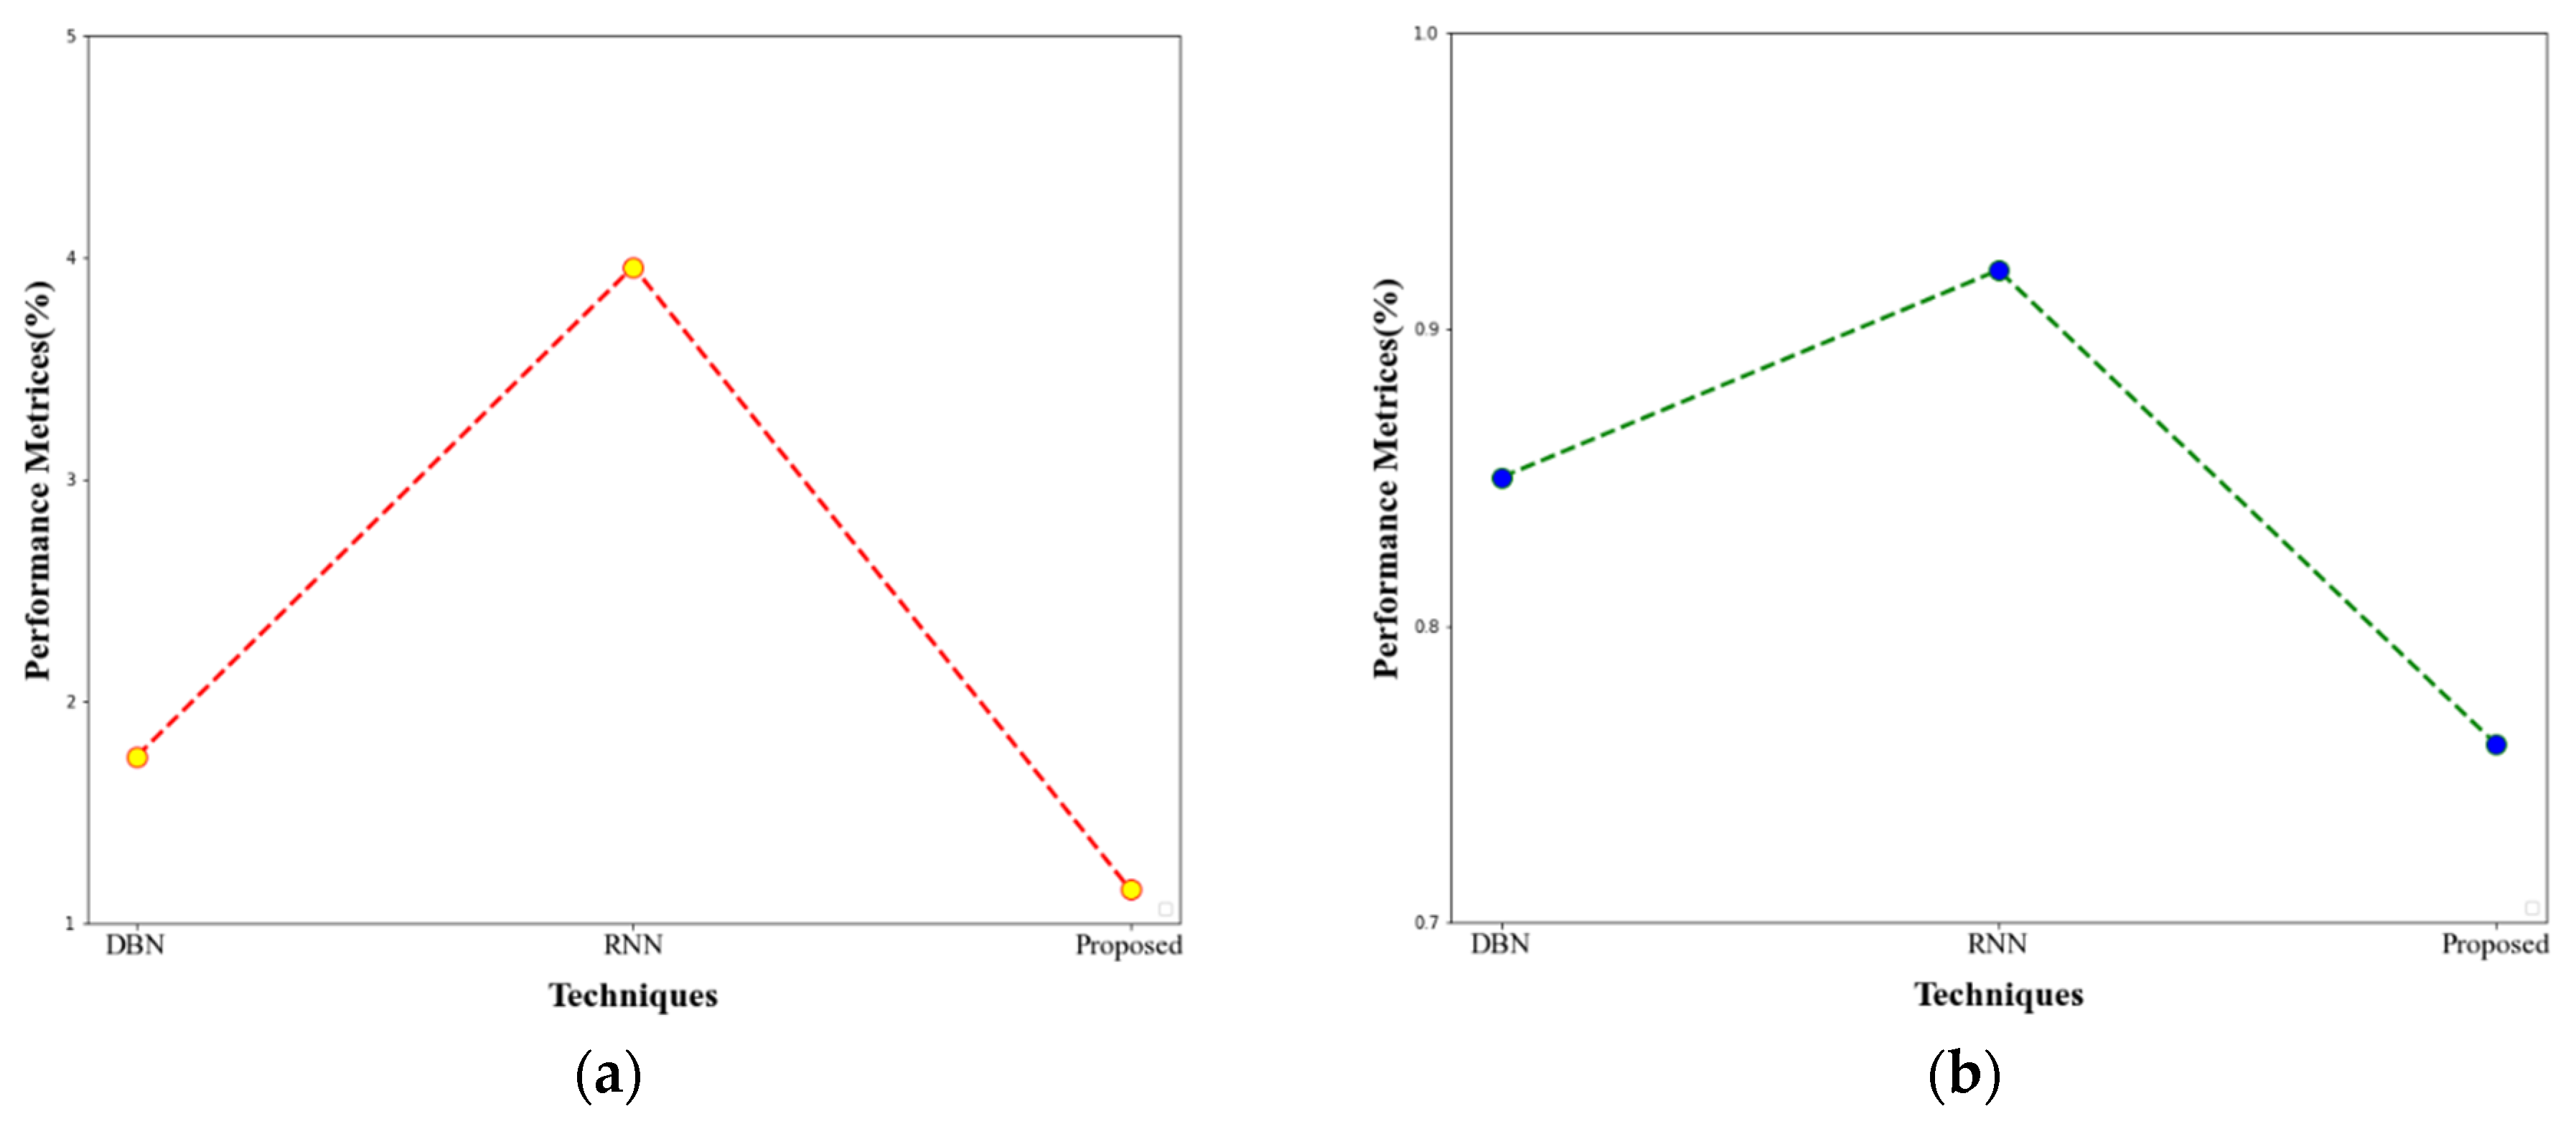
| UNSW-NB15 | DBN | 92.36 | 94.16 | 1.75 |
| RNN | 95.36 | 92.42 | 3.96 | |
| Proposed | 98.02 | 95.77 | 1.15 |
| Approaches | Accuracy | Detection Rate | False Alarm Rate |
|---|---|---|---|
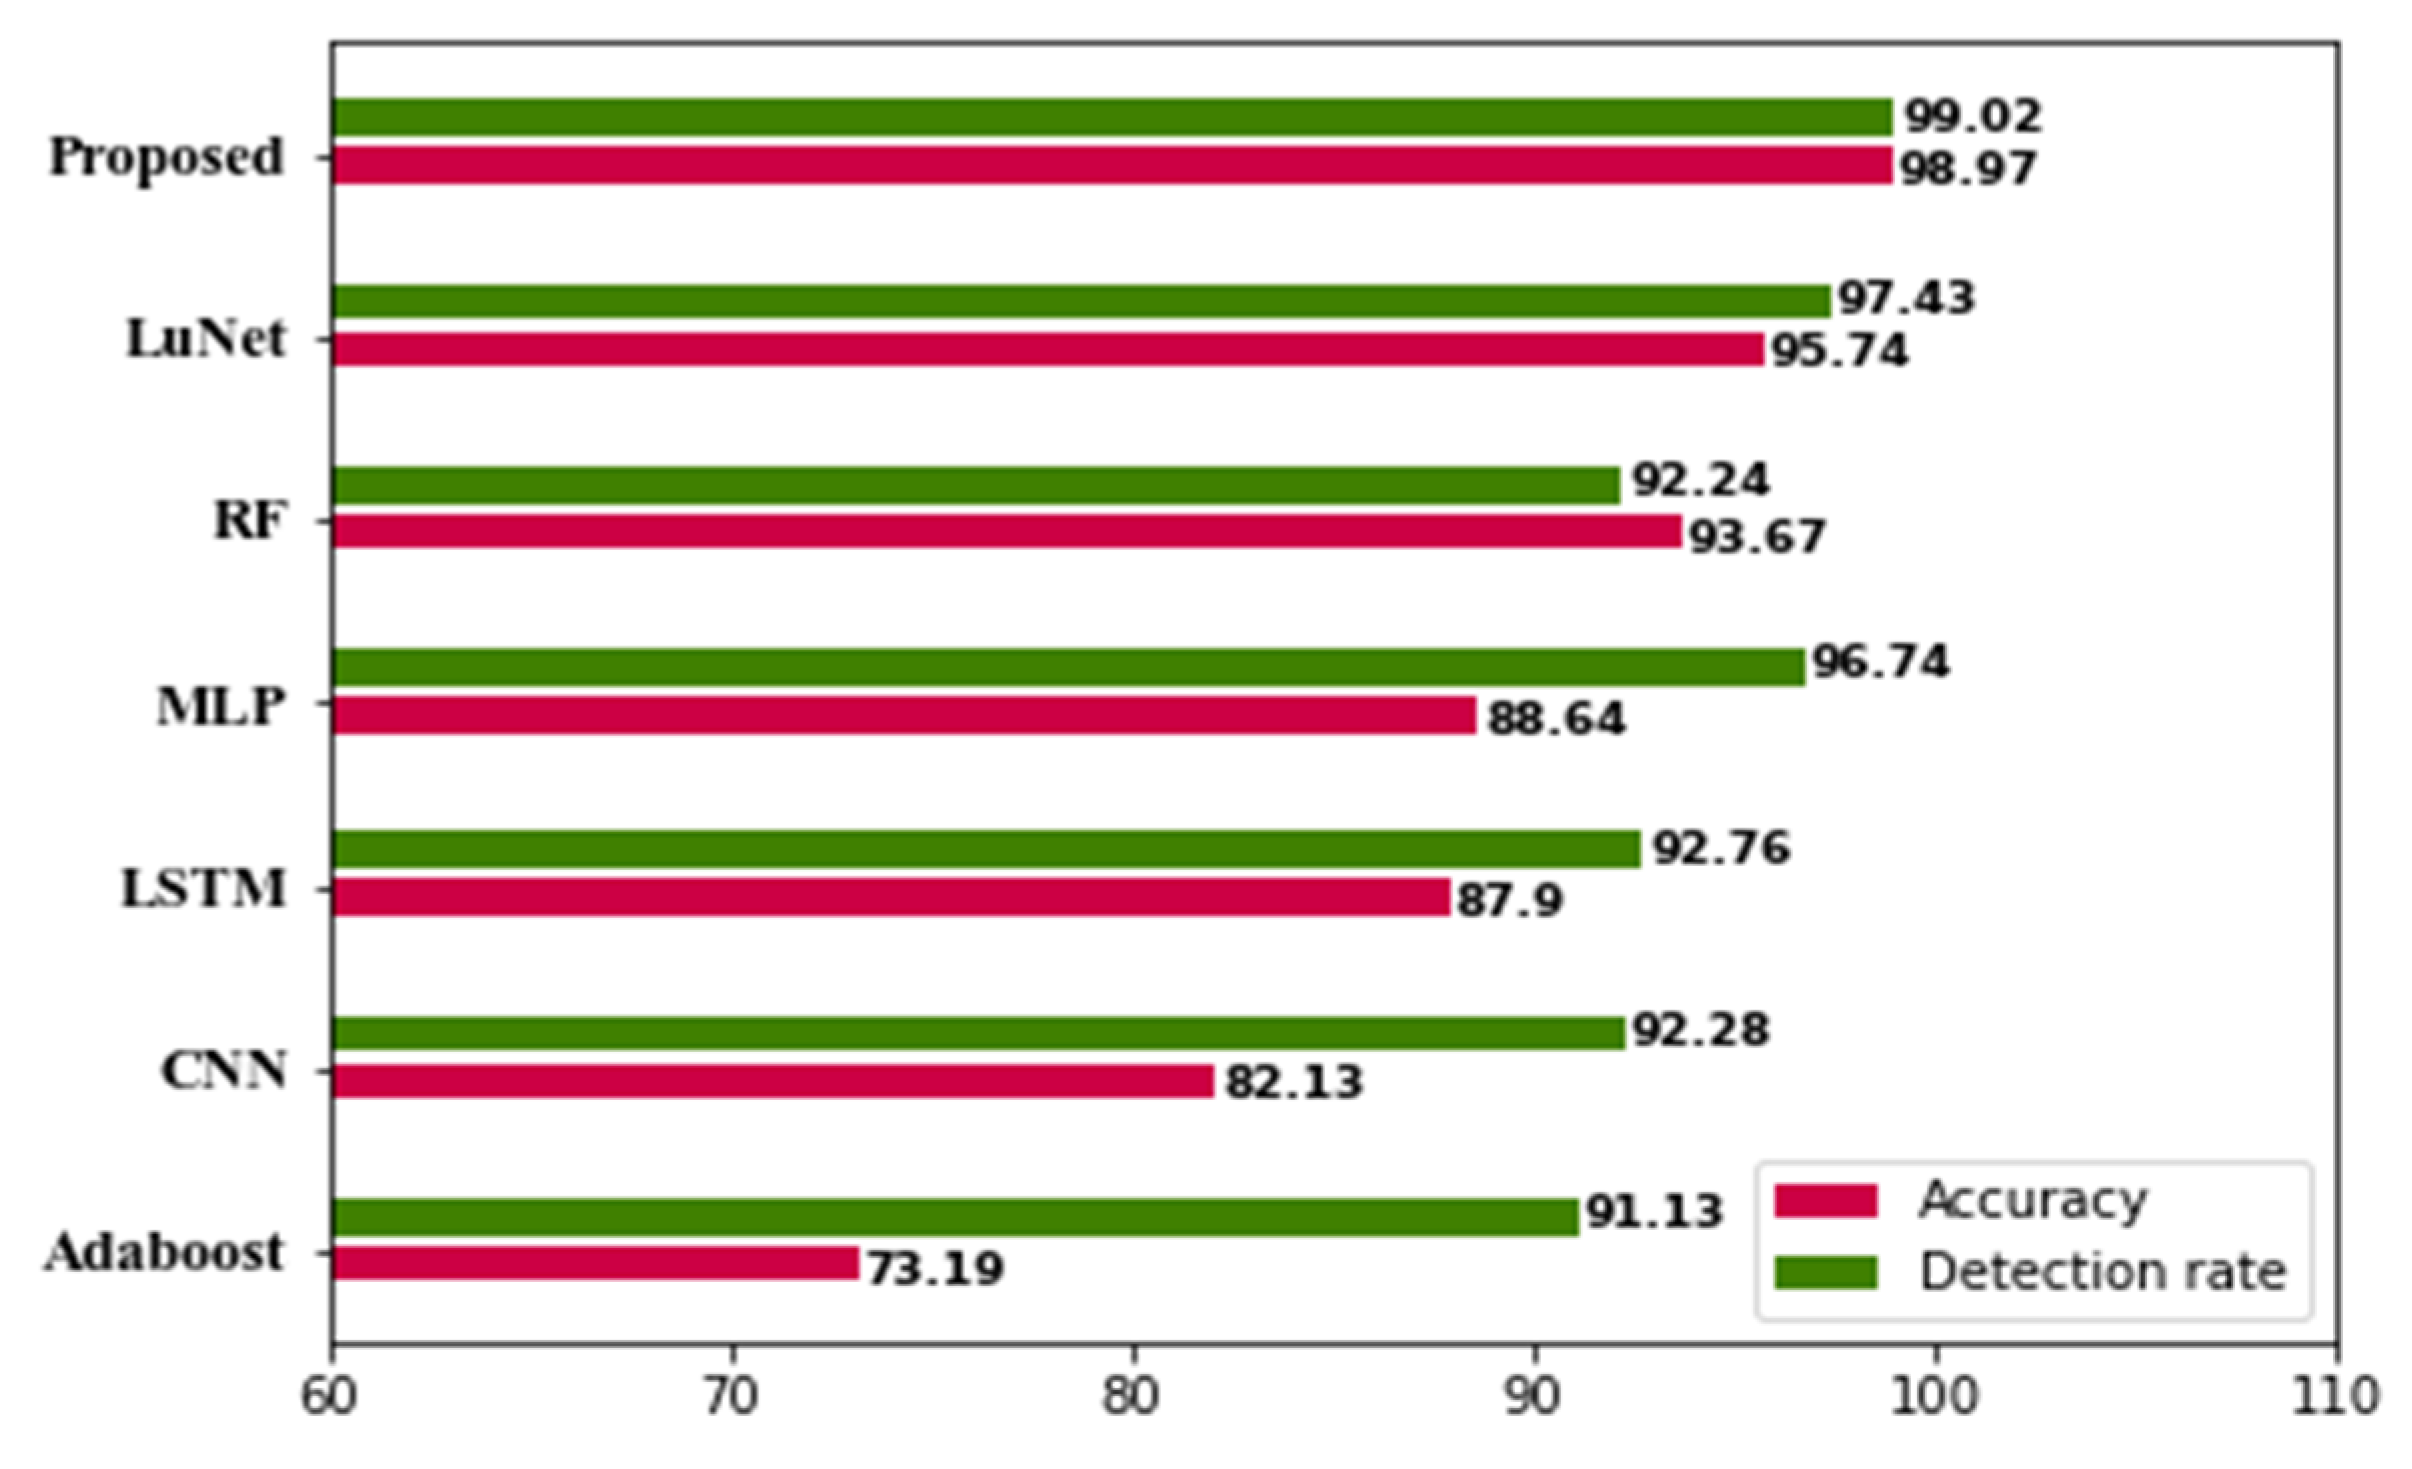
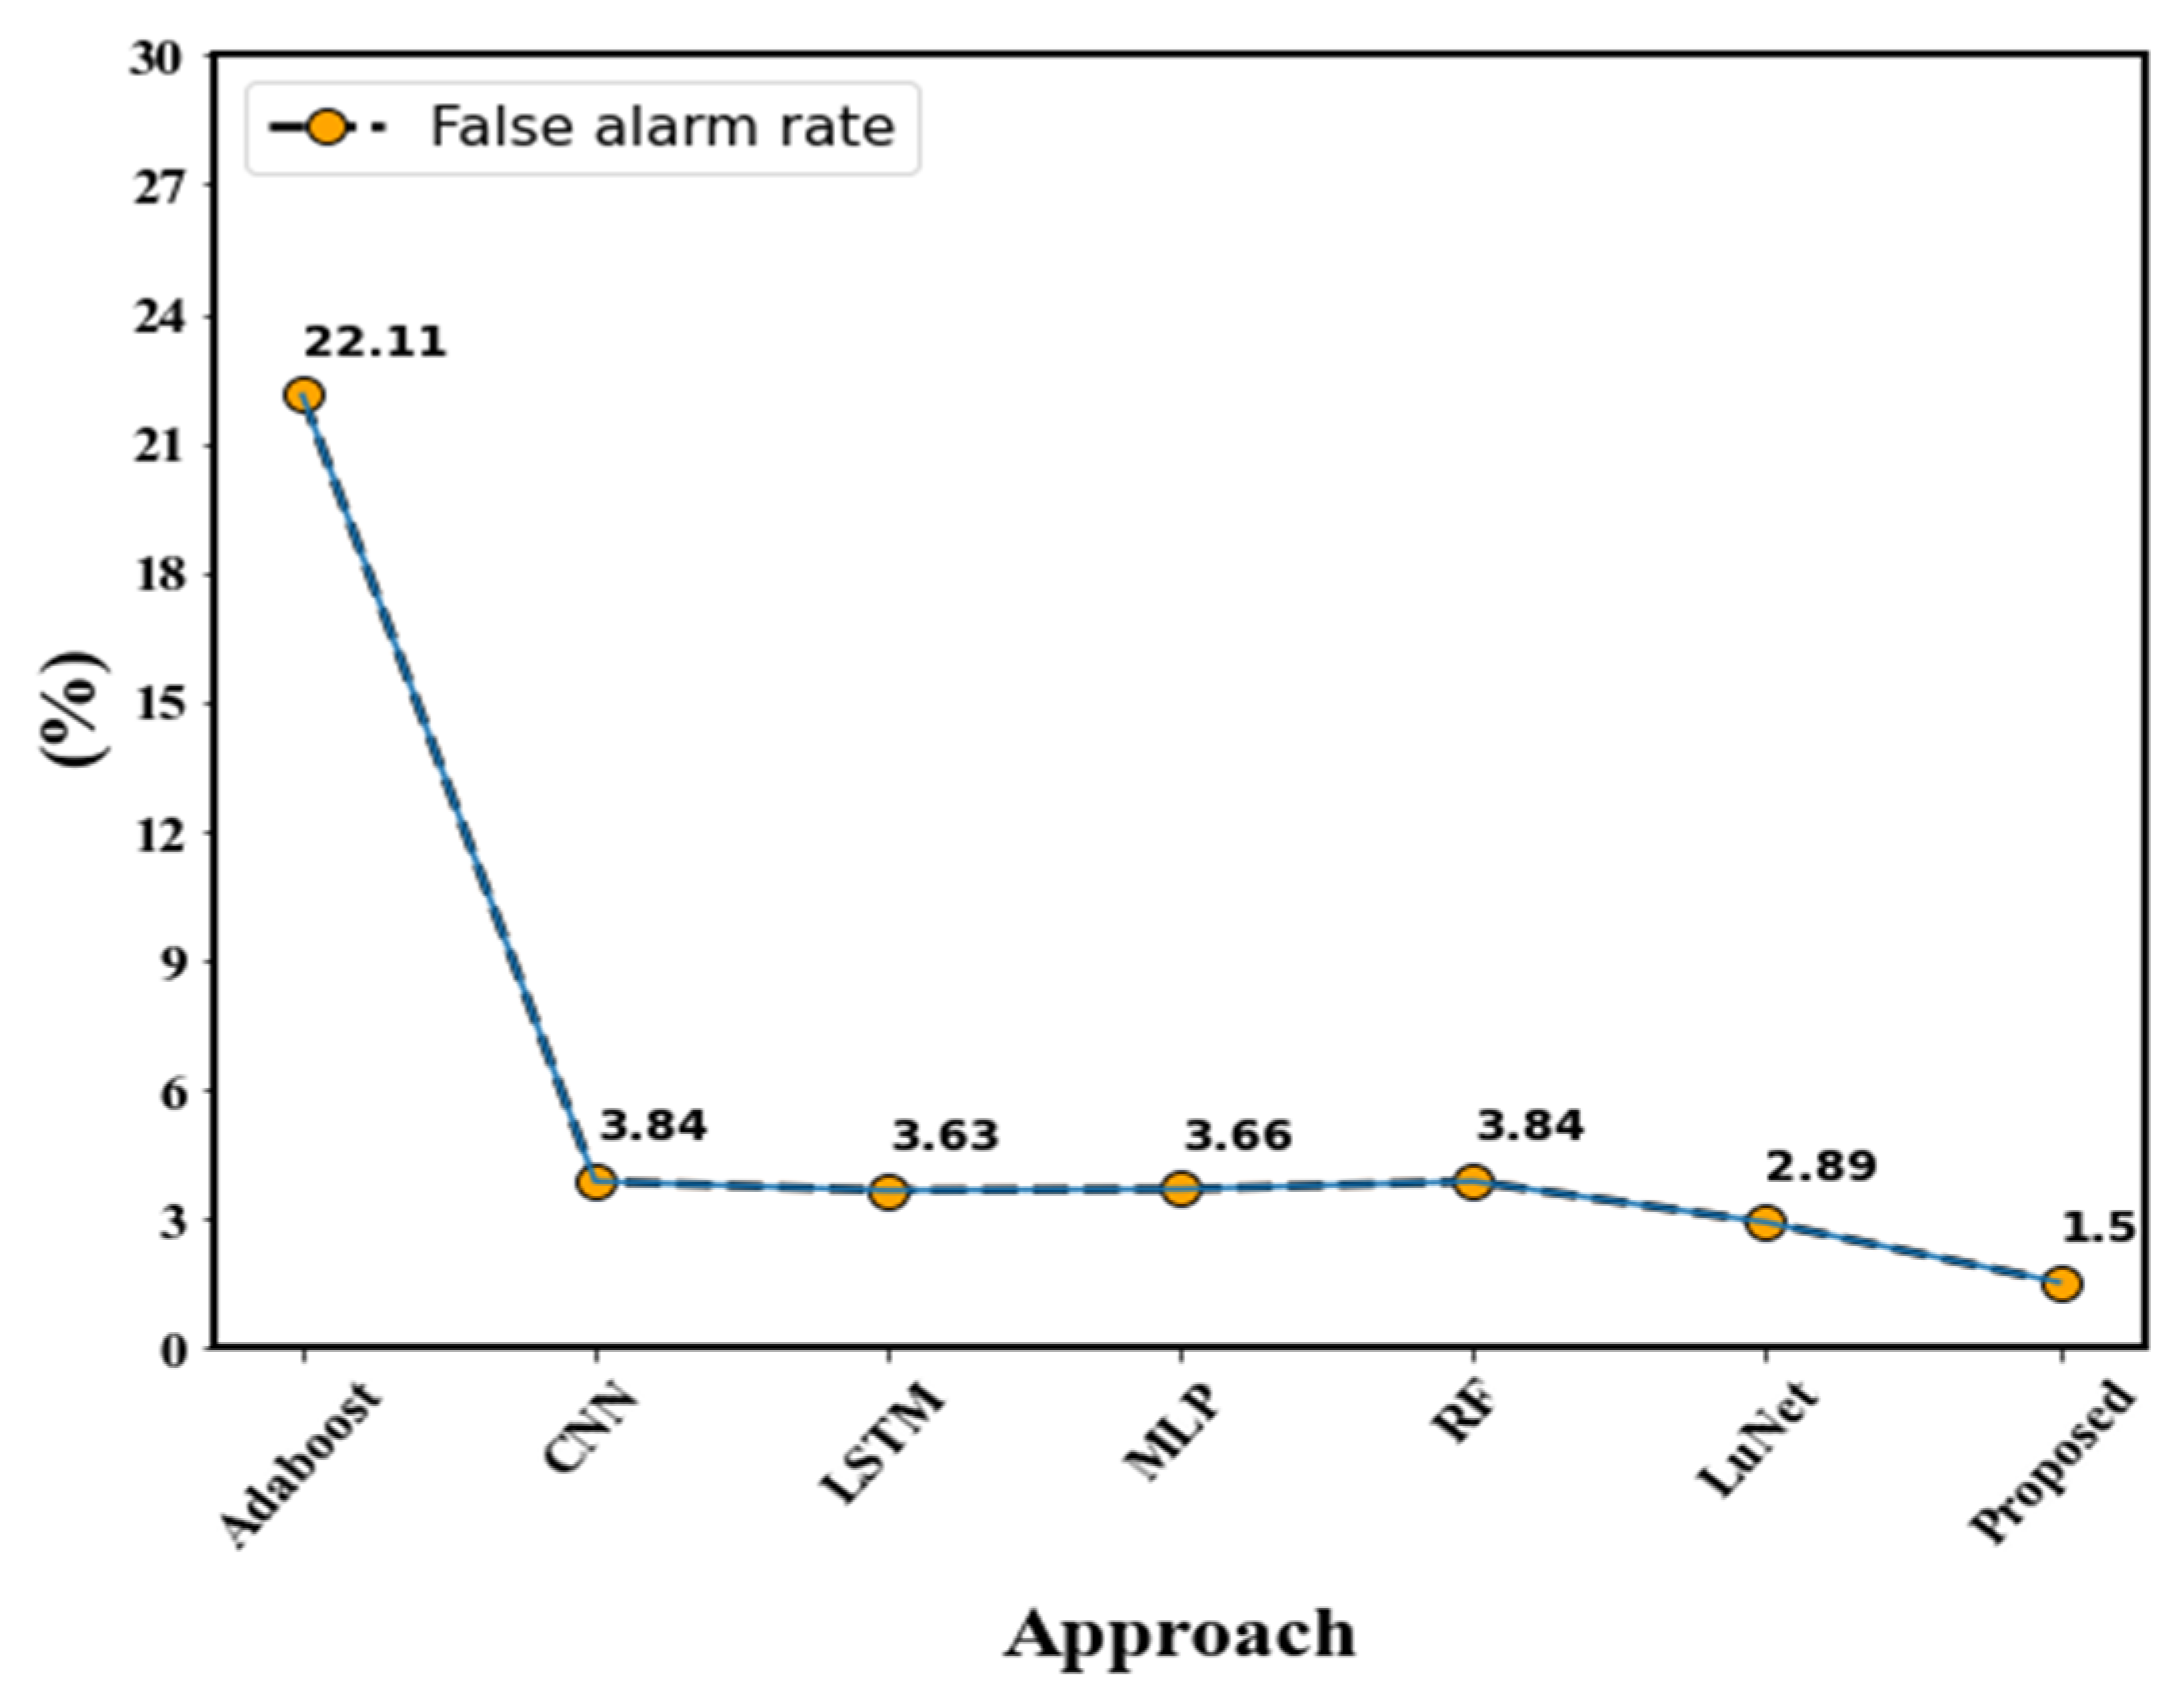
| Adaboost | 73.19% | 91.13% | 22.11% |
| CNN | 82.13% | 92.28% | 3.84% |
| LSTM | 87.90% | 92.76% | 3.63% |
| MLP | 88.64% | 96.74% | 3.66% |
| RF | 93.67% | 92.24% | 3.84% |
| LuNet | 95.74% | 97.43% | 2.89% |
| Proposed | 98.97% | 99.02% | 1.50% |
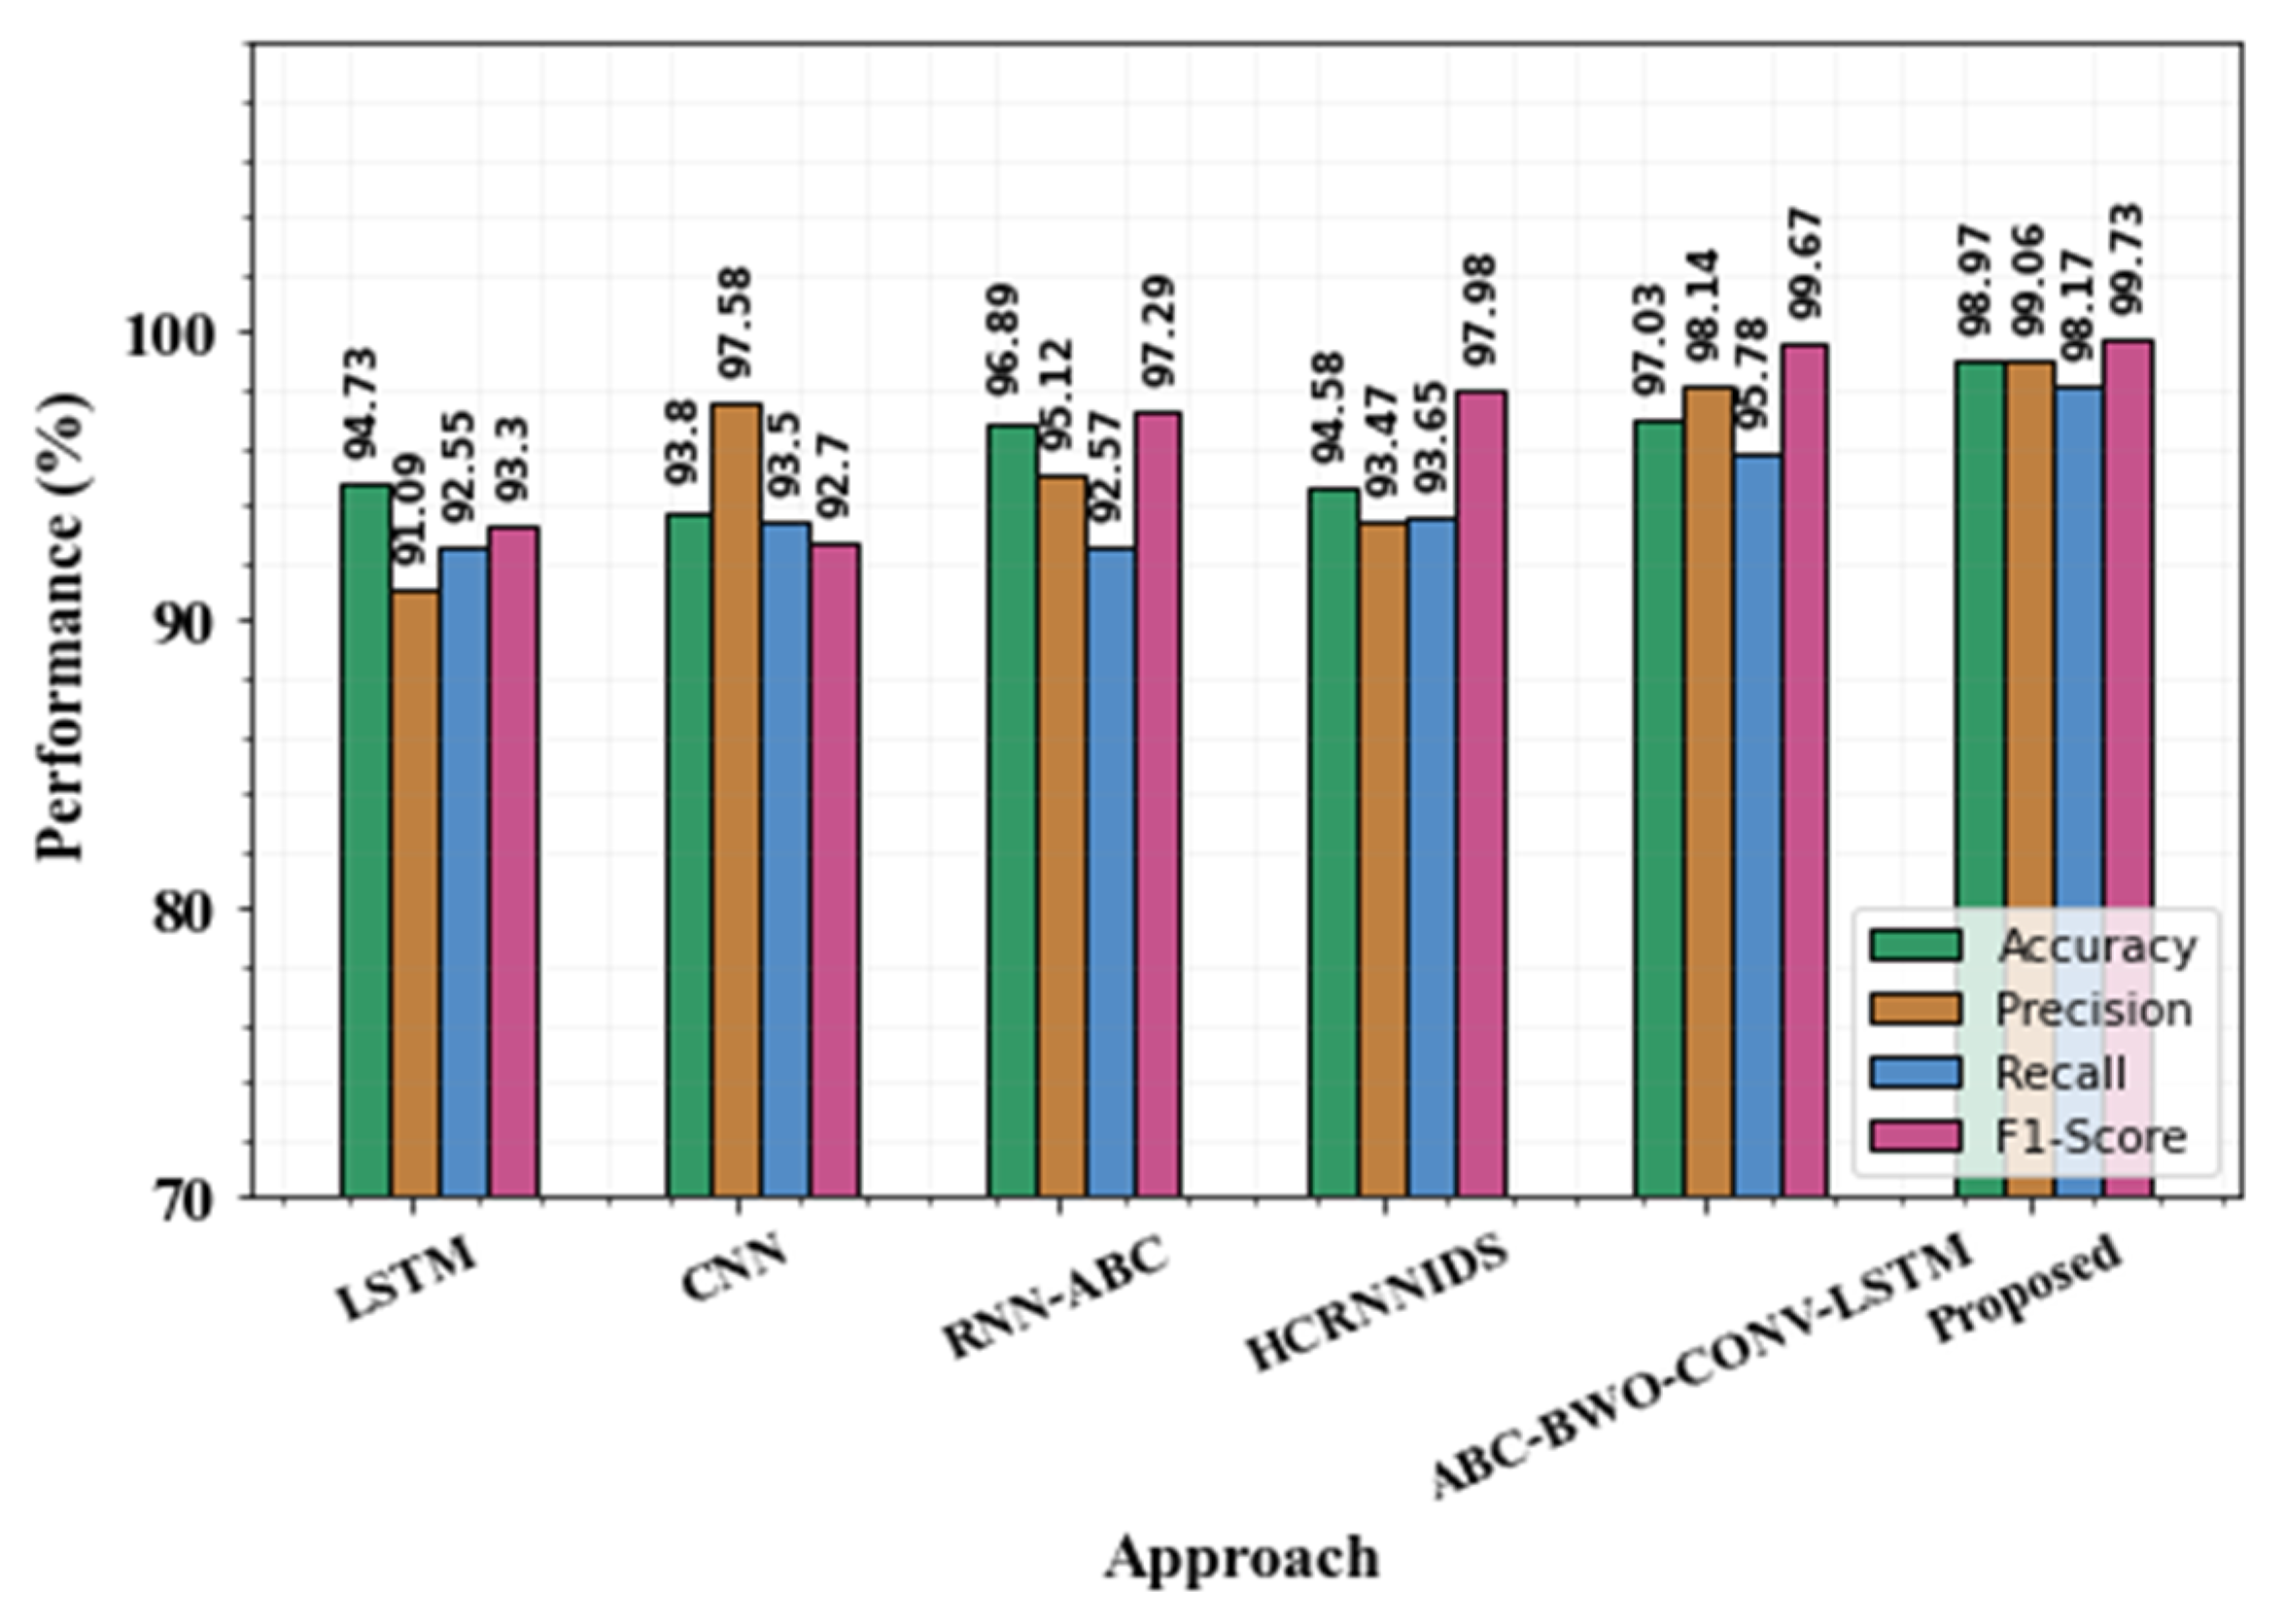
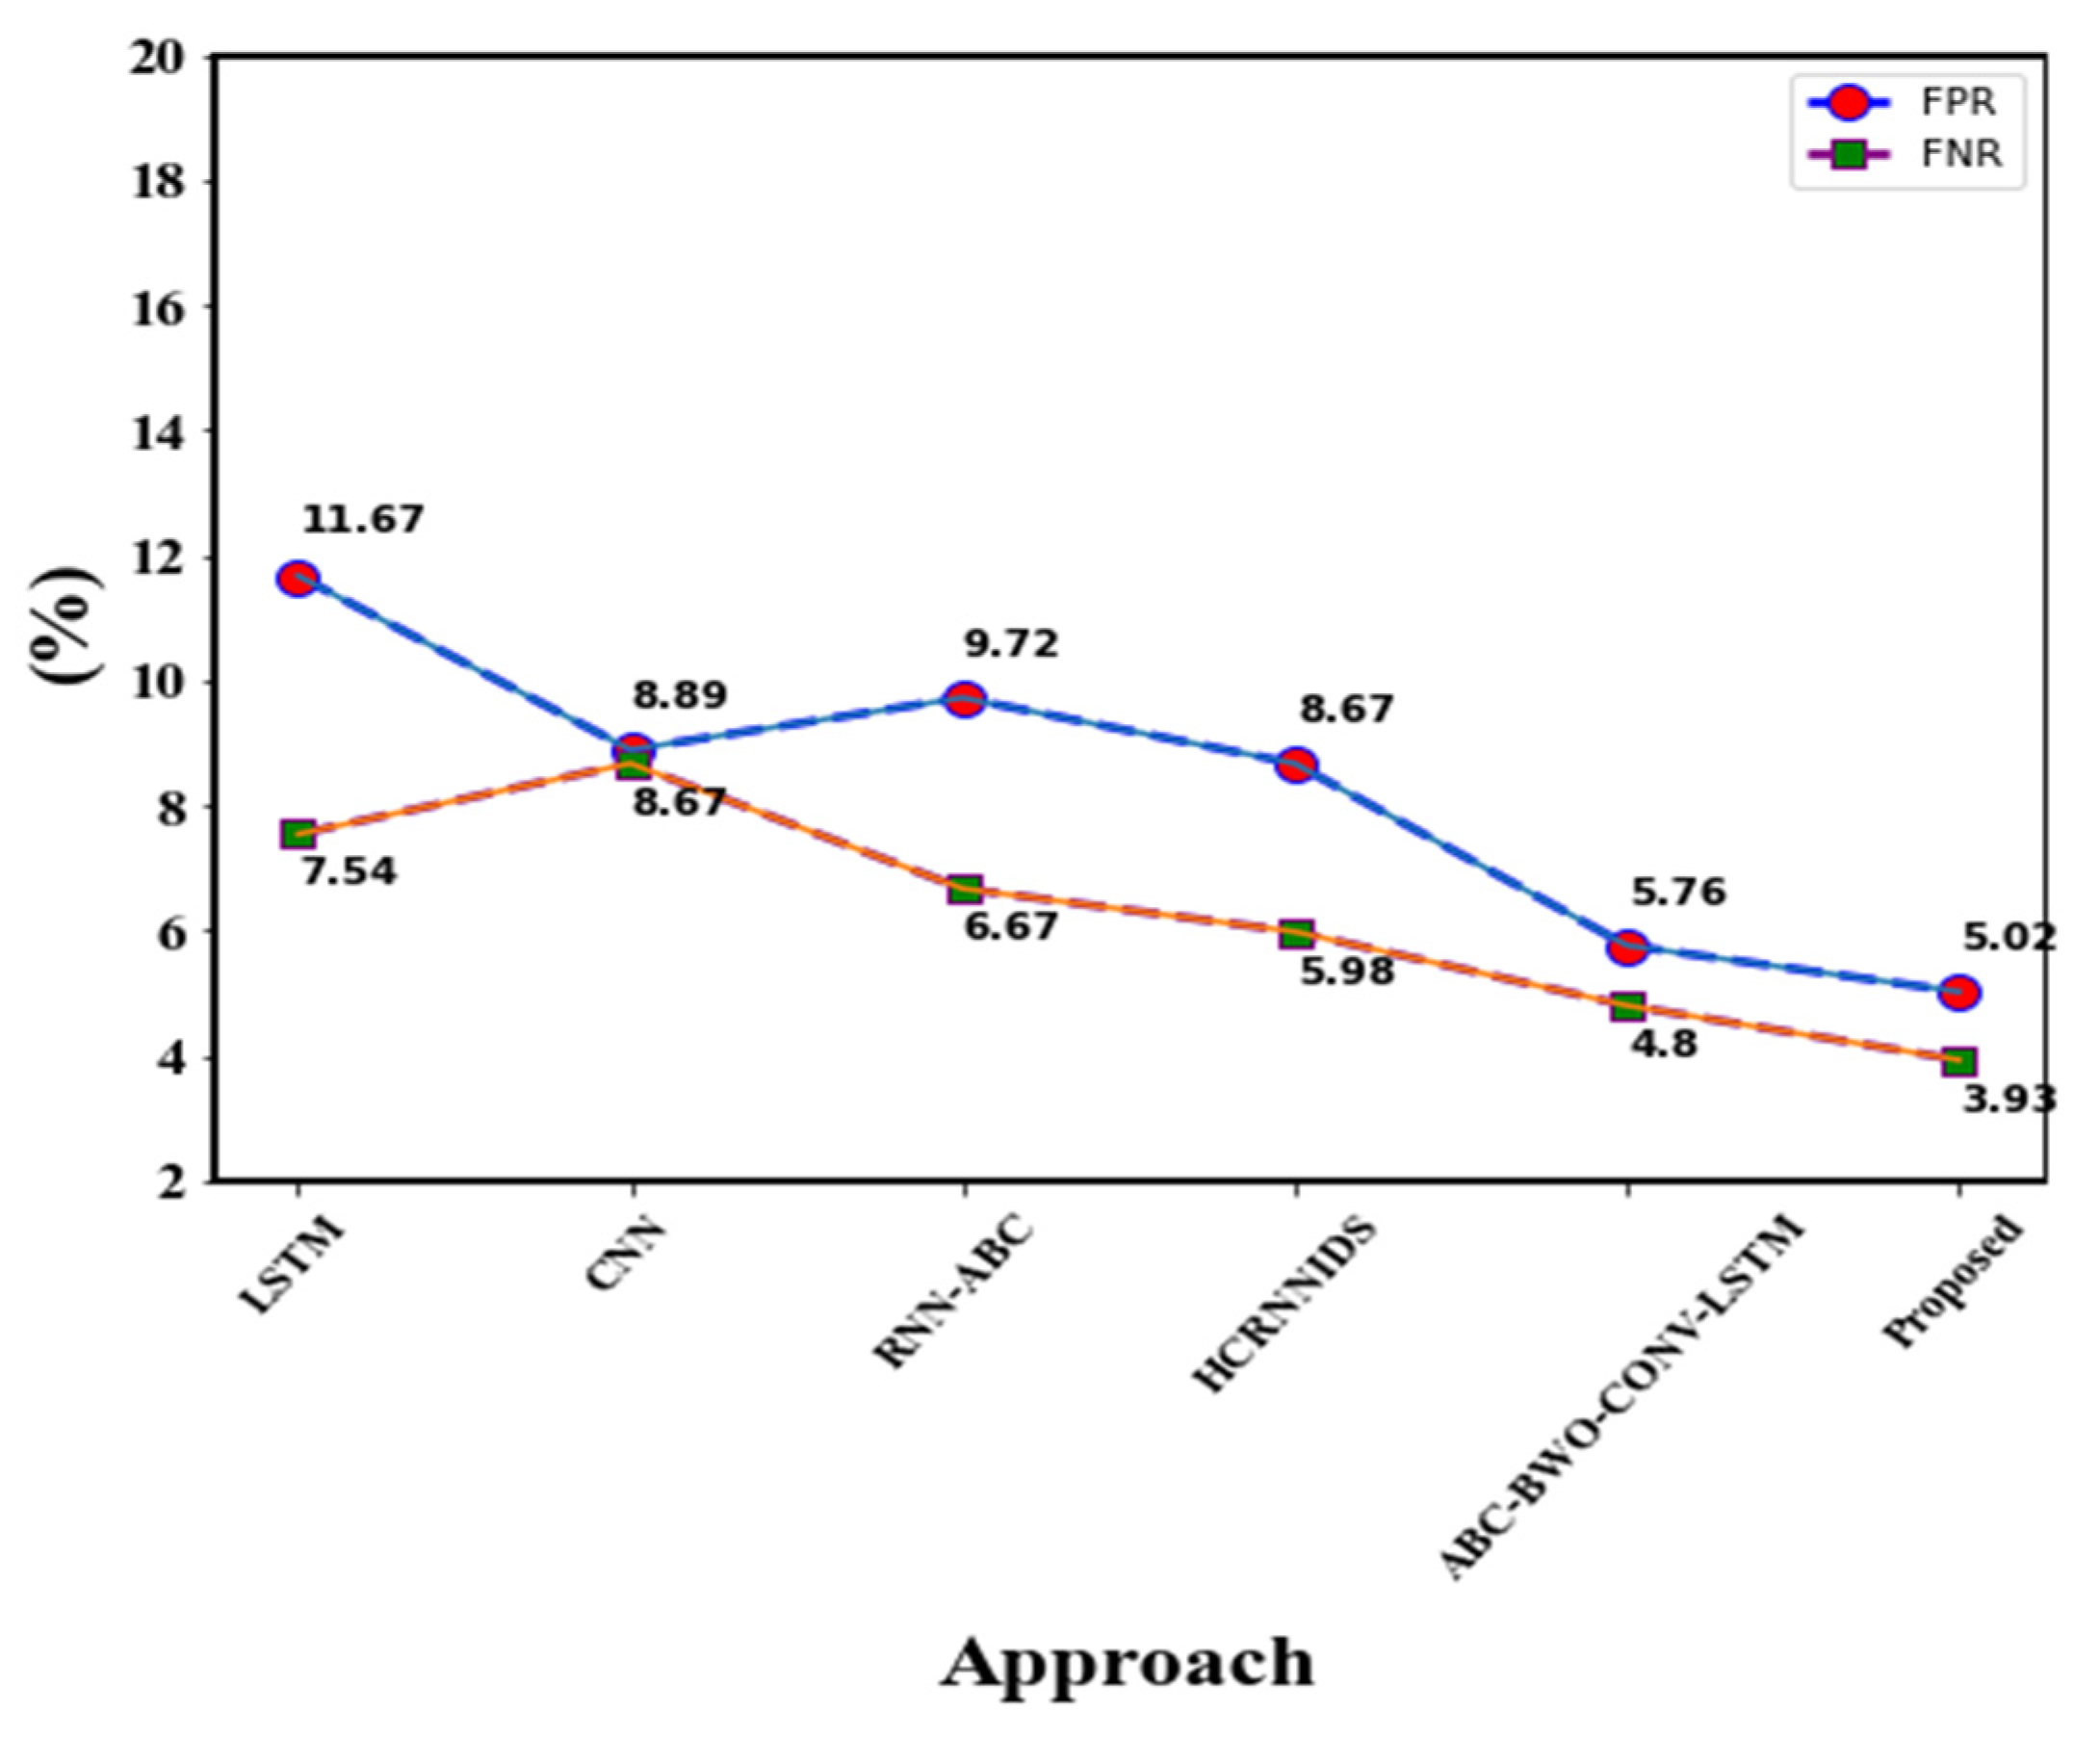
| Approaches | Accuracy (%) | Precision (%) | Recall (%) | F1-Score (%) | FPR (%) | FNR (%) |
|---|---|---|---|---|---|---|
| LSTM | 94.73 | 91.09 | 92.55 | 93.3 | 11.67 | 7.54 |
| CNN | 93.8 | 97.58 | 93.5 | 92.7 | 8.89 | 8.67 |
| RNN-ABC | 96.89 | 95.12 | 92.57 | 97.29 | 9.72 | 6.67 |
| HCRNNIDS | 94.58 | 93.47 | 93.65 | 97.98 | 8.67 | 5.98 |
| ABC-BWO-CONV-LSTM | 97.03 | 98.14 | 95.78 | 99.67 | 5.76 | 4.8 |
| Proposed | 98.97 | 99.06 | 98.17 | 99.73 | 5.02 | 3.93 |
Disclaimer/Publisher’s Note: The statements, opinions and data contained in all publications are solely those of the individual author(s) and contributor(s) and not of MDPI and/or the editor(s). MDPI and/or the editor(s) disclaim responsibility for any injury to people or property resulting from any ideas, methods, instructions or products referred to in the content. |
© 2023 by the authors. Licensee MDPI, Basel, Switzerland. This article is an open access article distributed under the terms and conditions of the Creative Commons Attribution (CC BY) license (https://creativecommons.org/licenses/by/4.0/).
Share and Cite
Rao, Y.N.; Suresh Babu, K. An Imbalanced Generative Adversarial Network-Based Approach for Network Intrusion Detection in an Imbalanced Dataset. Sensors 2023, 23, 550. https://doi.org/10.3390/s23010550
Rao YN, Suresh Babu K. An Imbalanced Generative Adversarial Network-Based Approach for Network Intrusion Detection in an Imbalanced Dataset. Sensors. 2023; 23(1):550. https://doi.org/10.3390/s23010550
Chicago/Turabian StyleRao, Yamarthi Narasimha, and Kunda Suresh Babu. 2023. "An Imbalanced Generative Adversarial Network-Based Approach for Network Intrusion Detection in an Imbalanced Dataset" Sensors 23, no. 1: 550. https://doi.org/10.3390/s23010550