
Use of a Thermodynamic Sensor in Monitoring Fermentation Processes in Gluten-Free Dough Proofing
 , , , , , ,
Abstract
:1. Introduction
1.1. Scientific Hypotheses
1.2. The Target
2. Materials and Methods
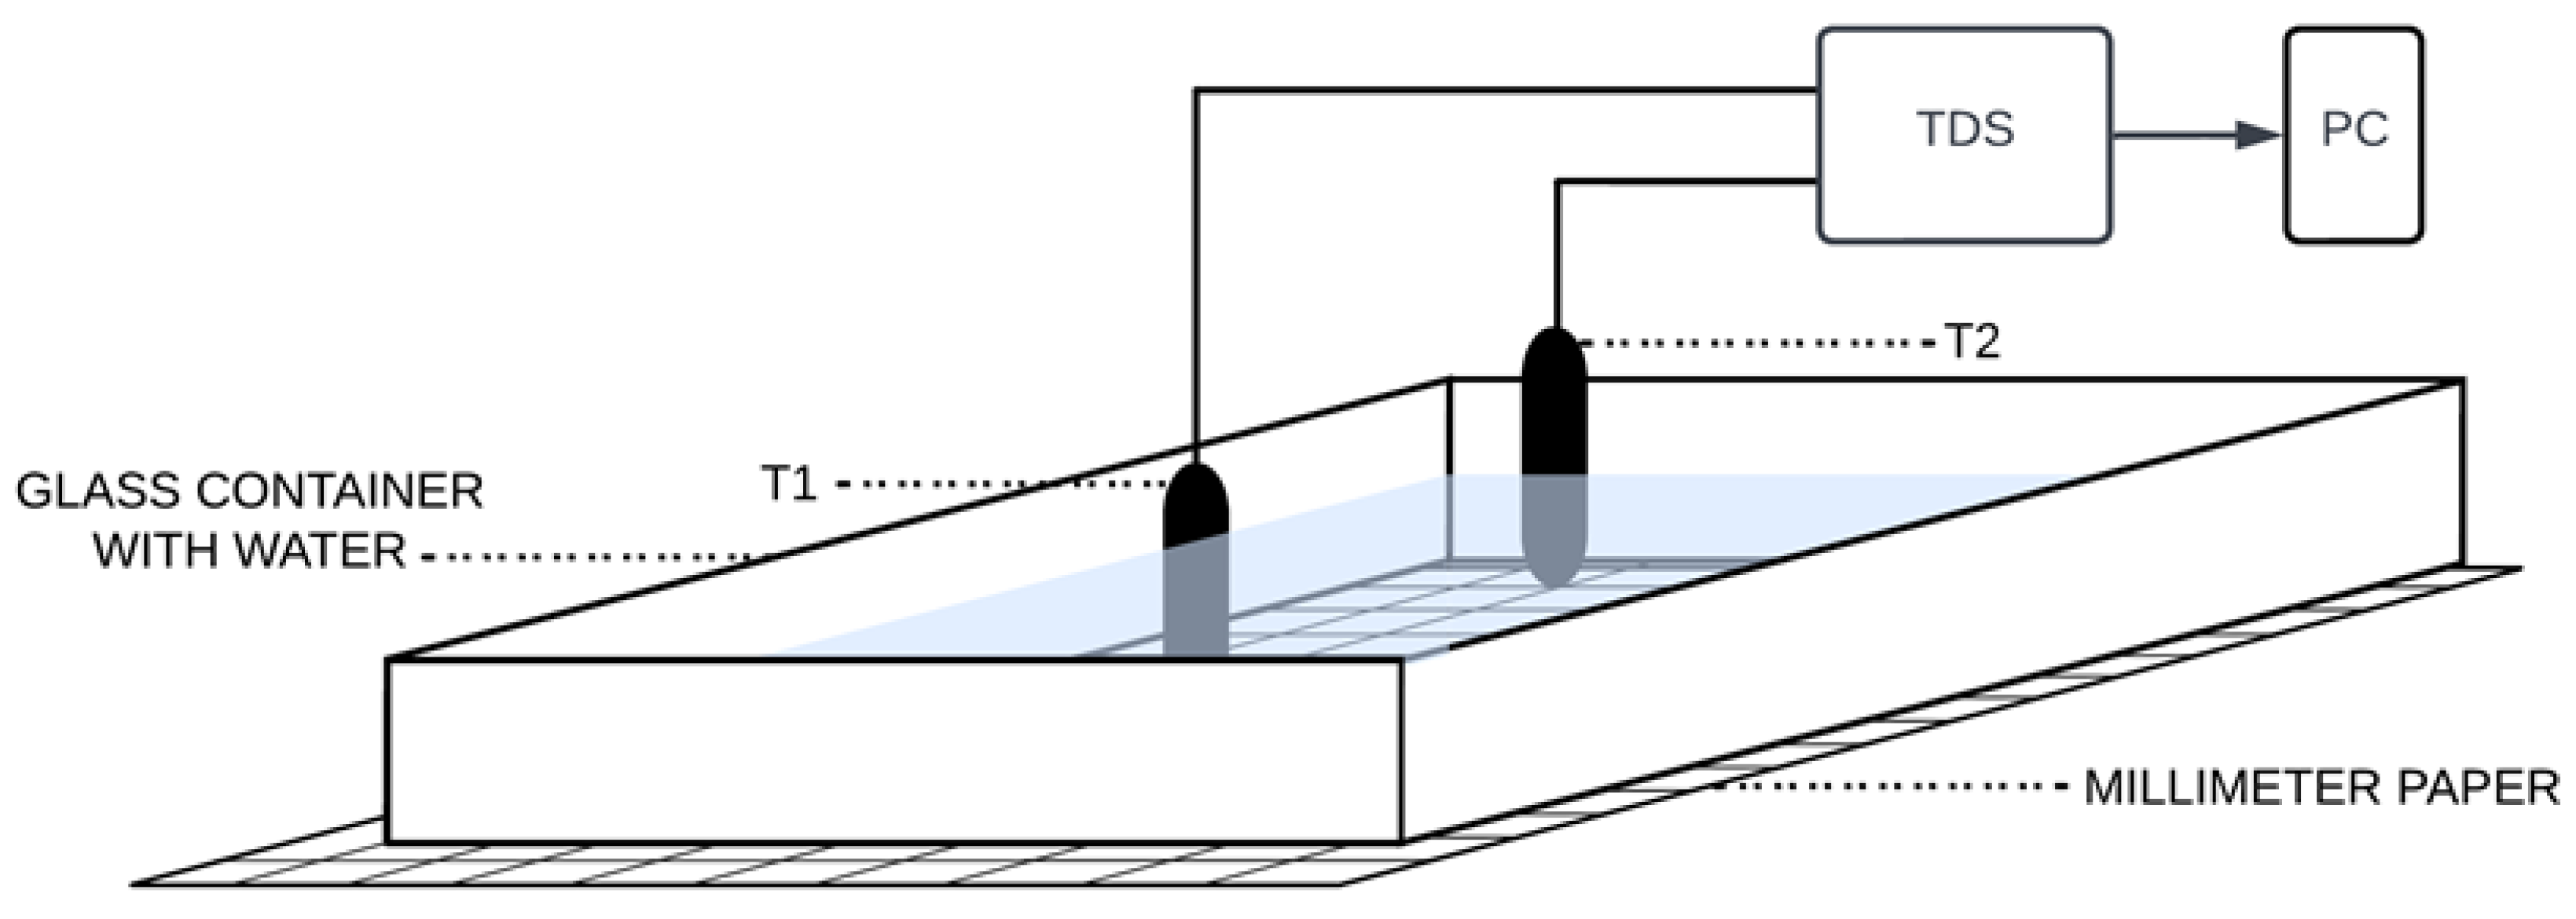
2.1. Arrangement and Methodology of Measurements with TDS
- m1 and m2 are the mass of substances,
- c1 and c2 are specific heats of substances (liquid water 4.184 J⋅kg−1⋅K−1),
- t1 and t2 are temperatures of substances before the thermal change,
- t is final temperature of water in box after mixing.
2.2. Measuring on a Professional Rheofermentometer Rheo F4
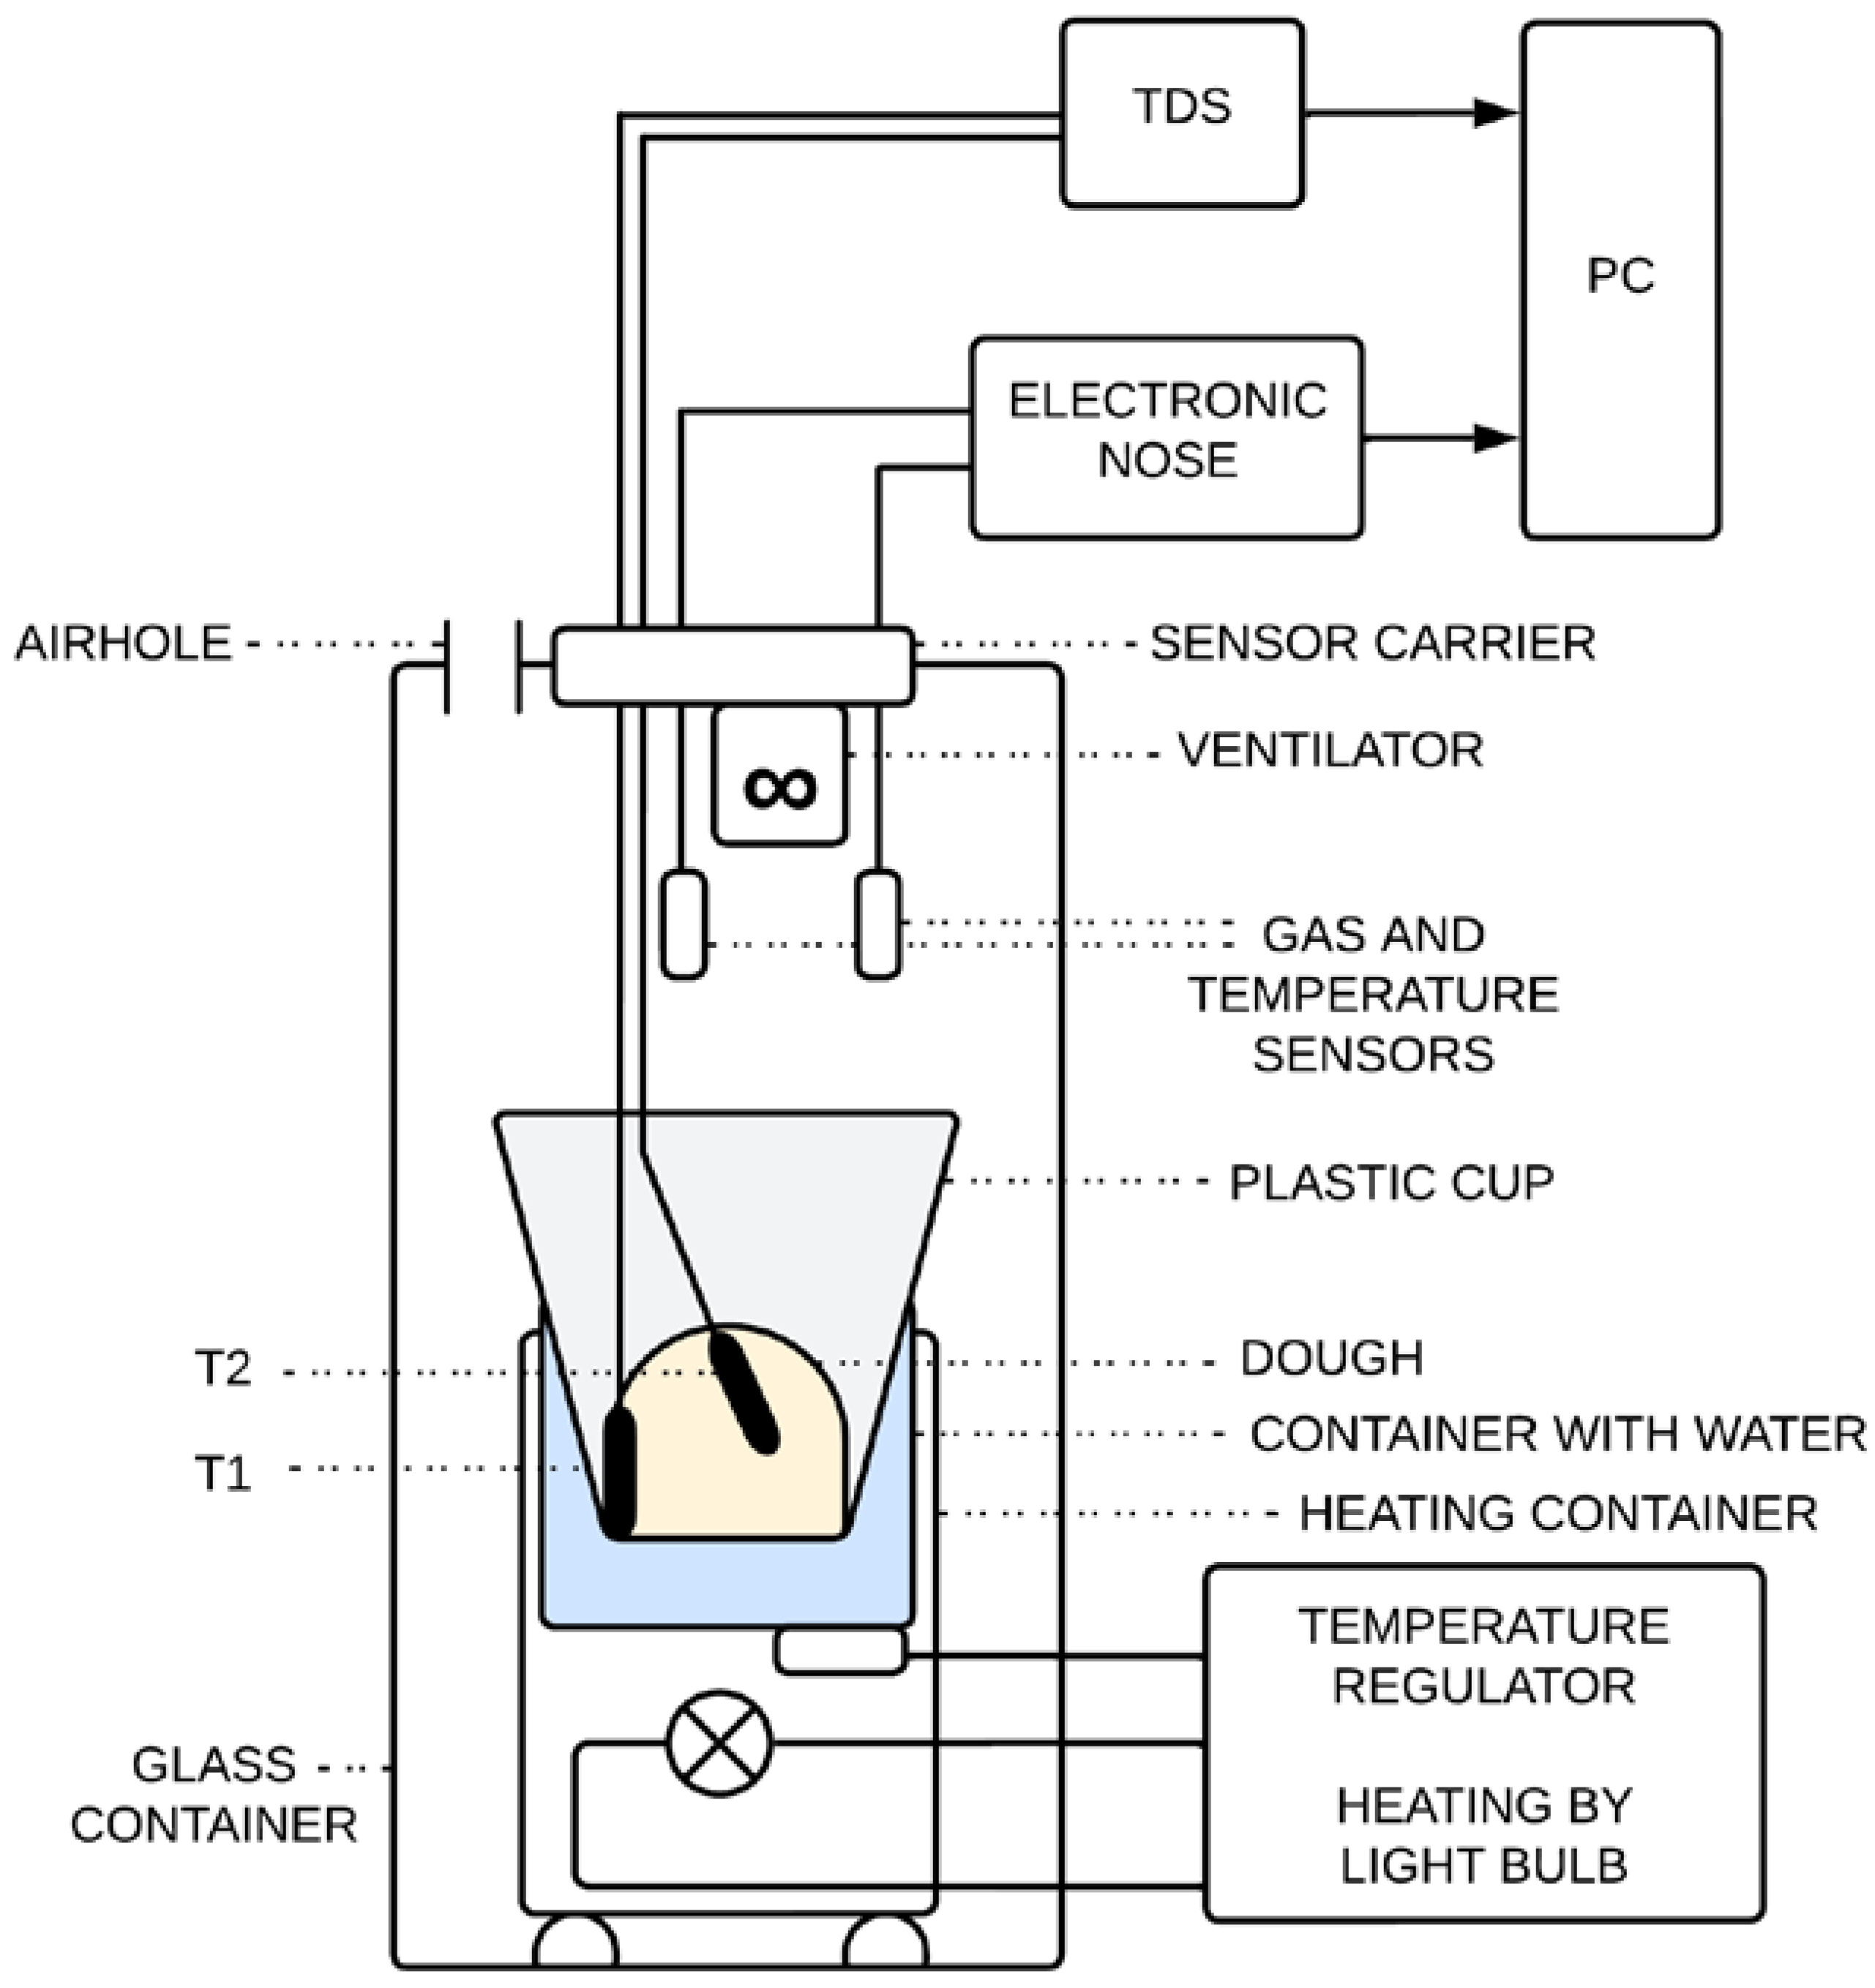
2.3. Electronic Nose Measurement
2.4. Basic Ingredients
2.5. Preparation of the Meal from Tenebrio molitor Larvae
2.6. Recipe for the Preparation of the Basic Dough
2.7. Statistical Analysis
3. Results and Discussion
3.1. Pilot Experiment
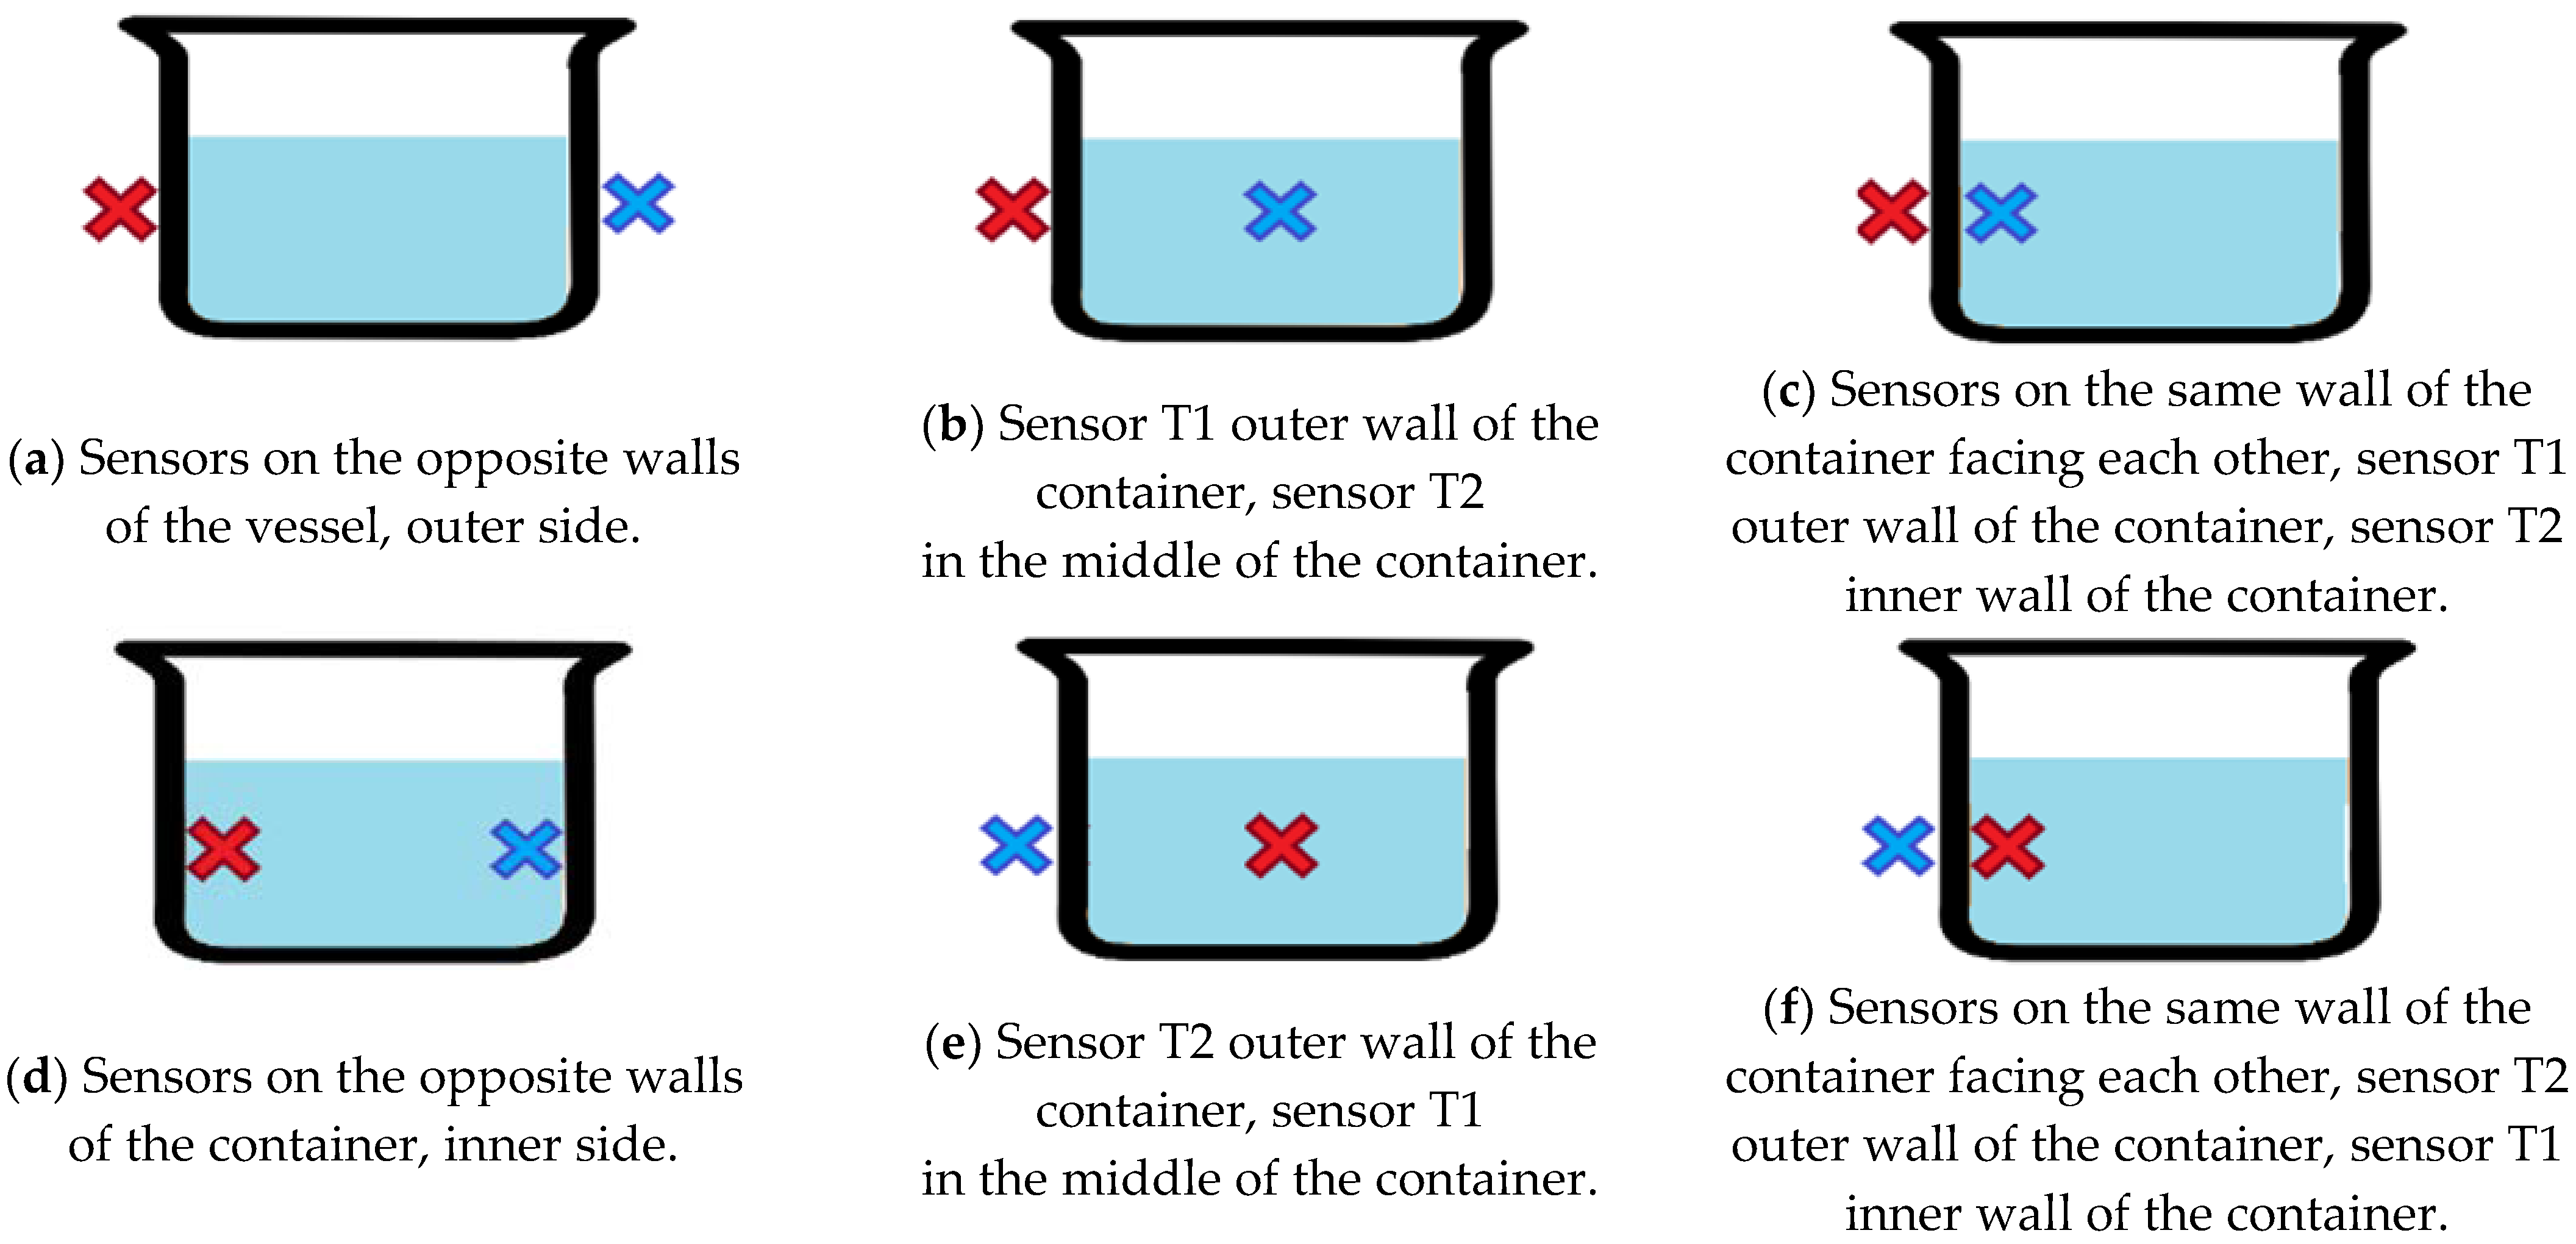
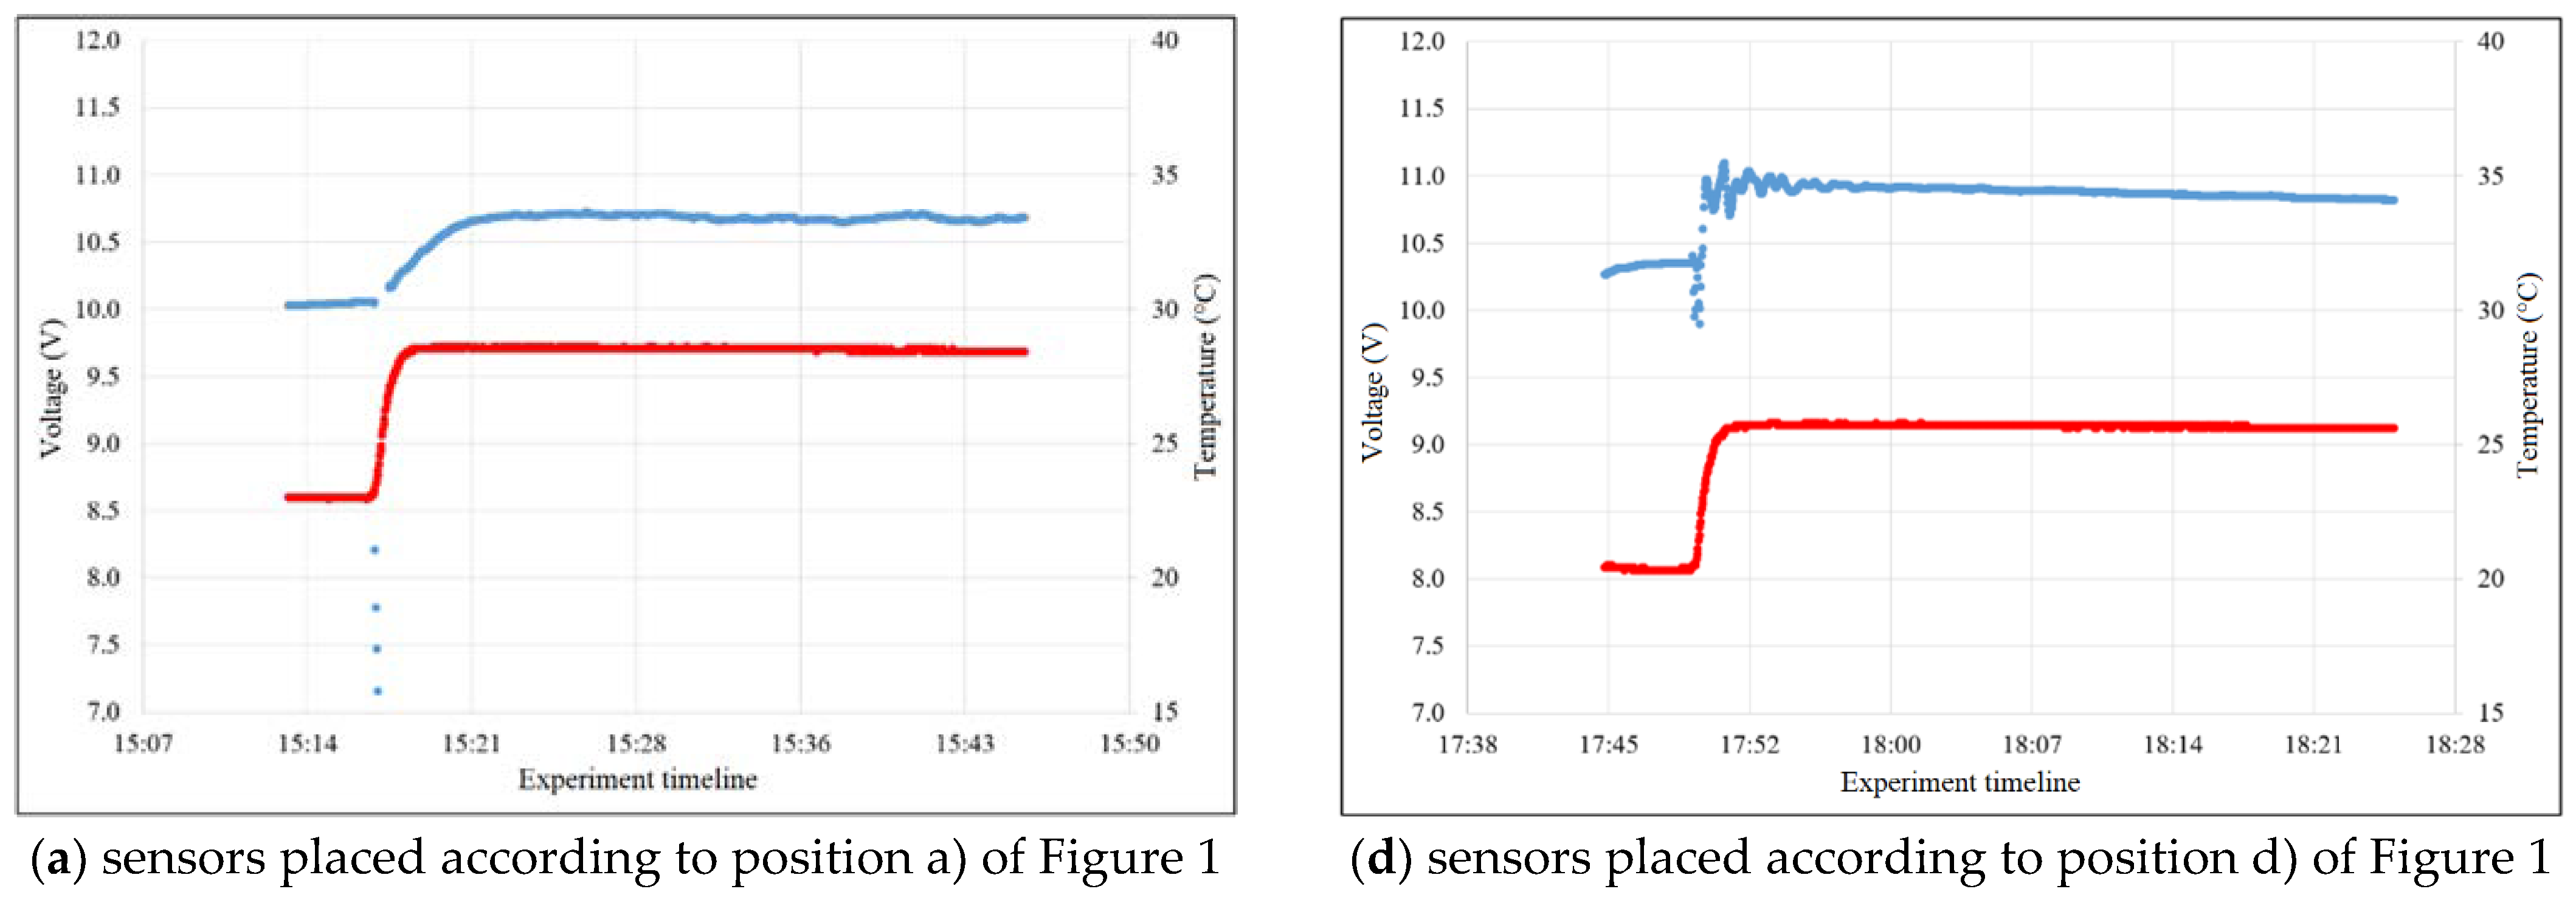
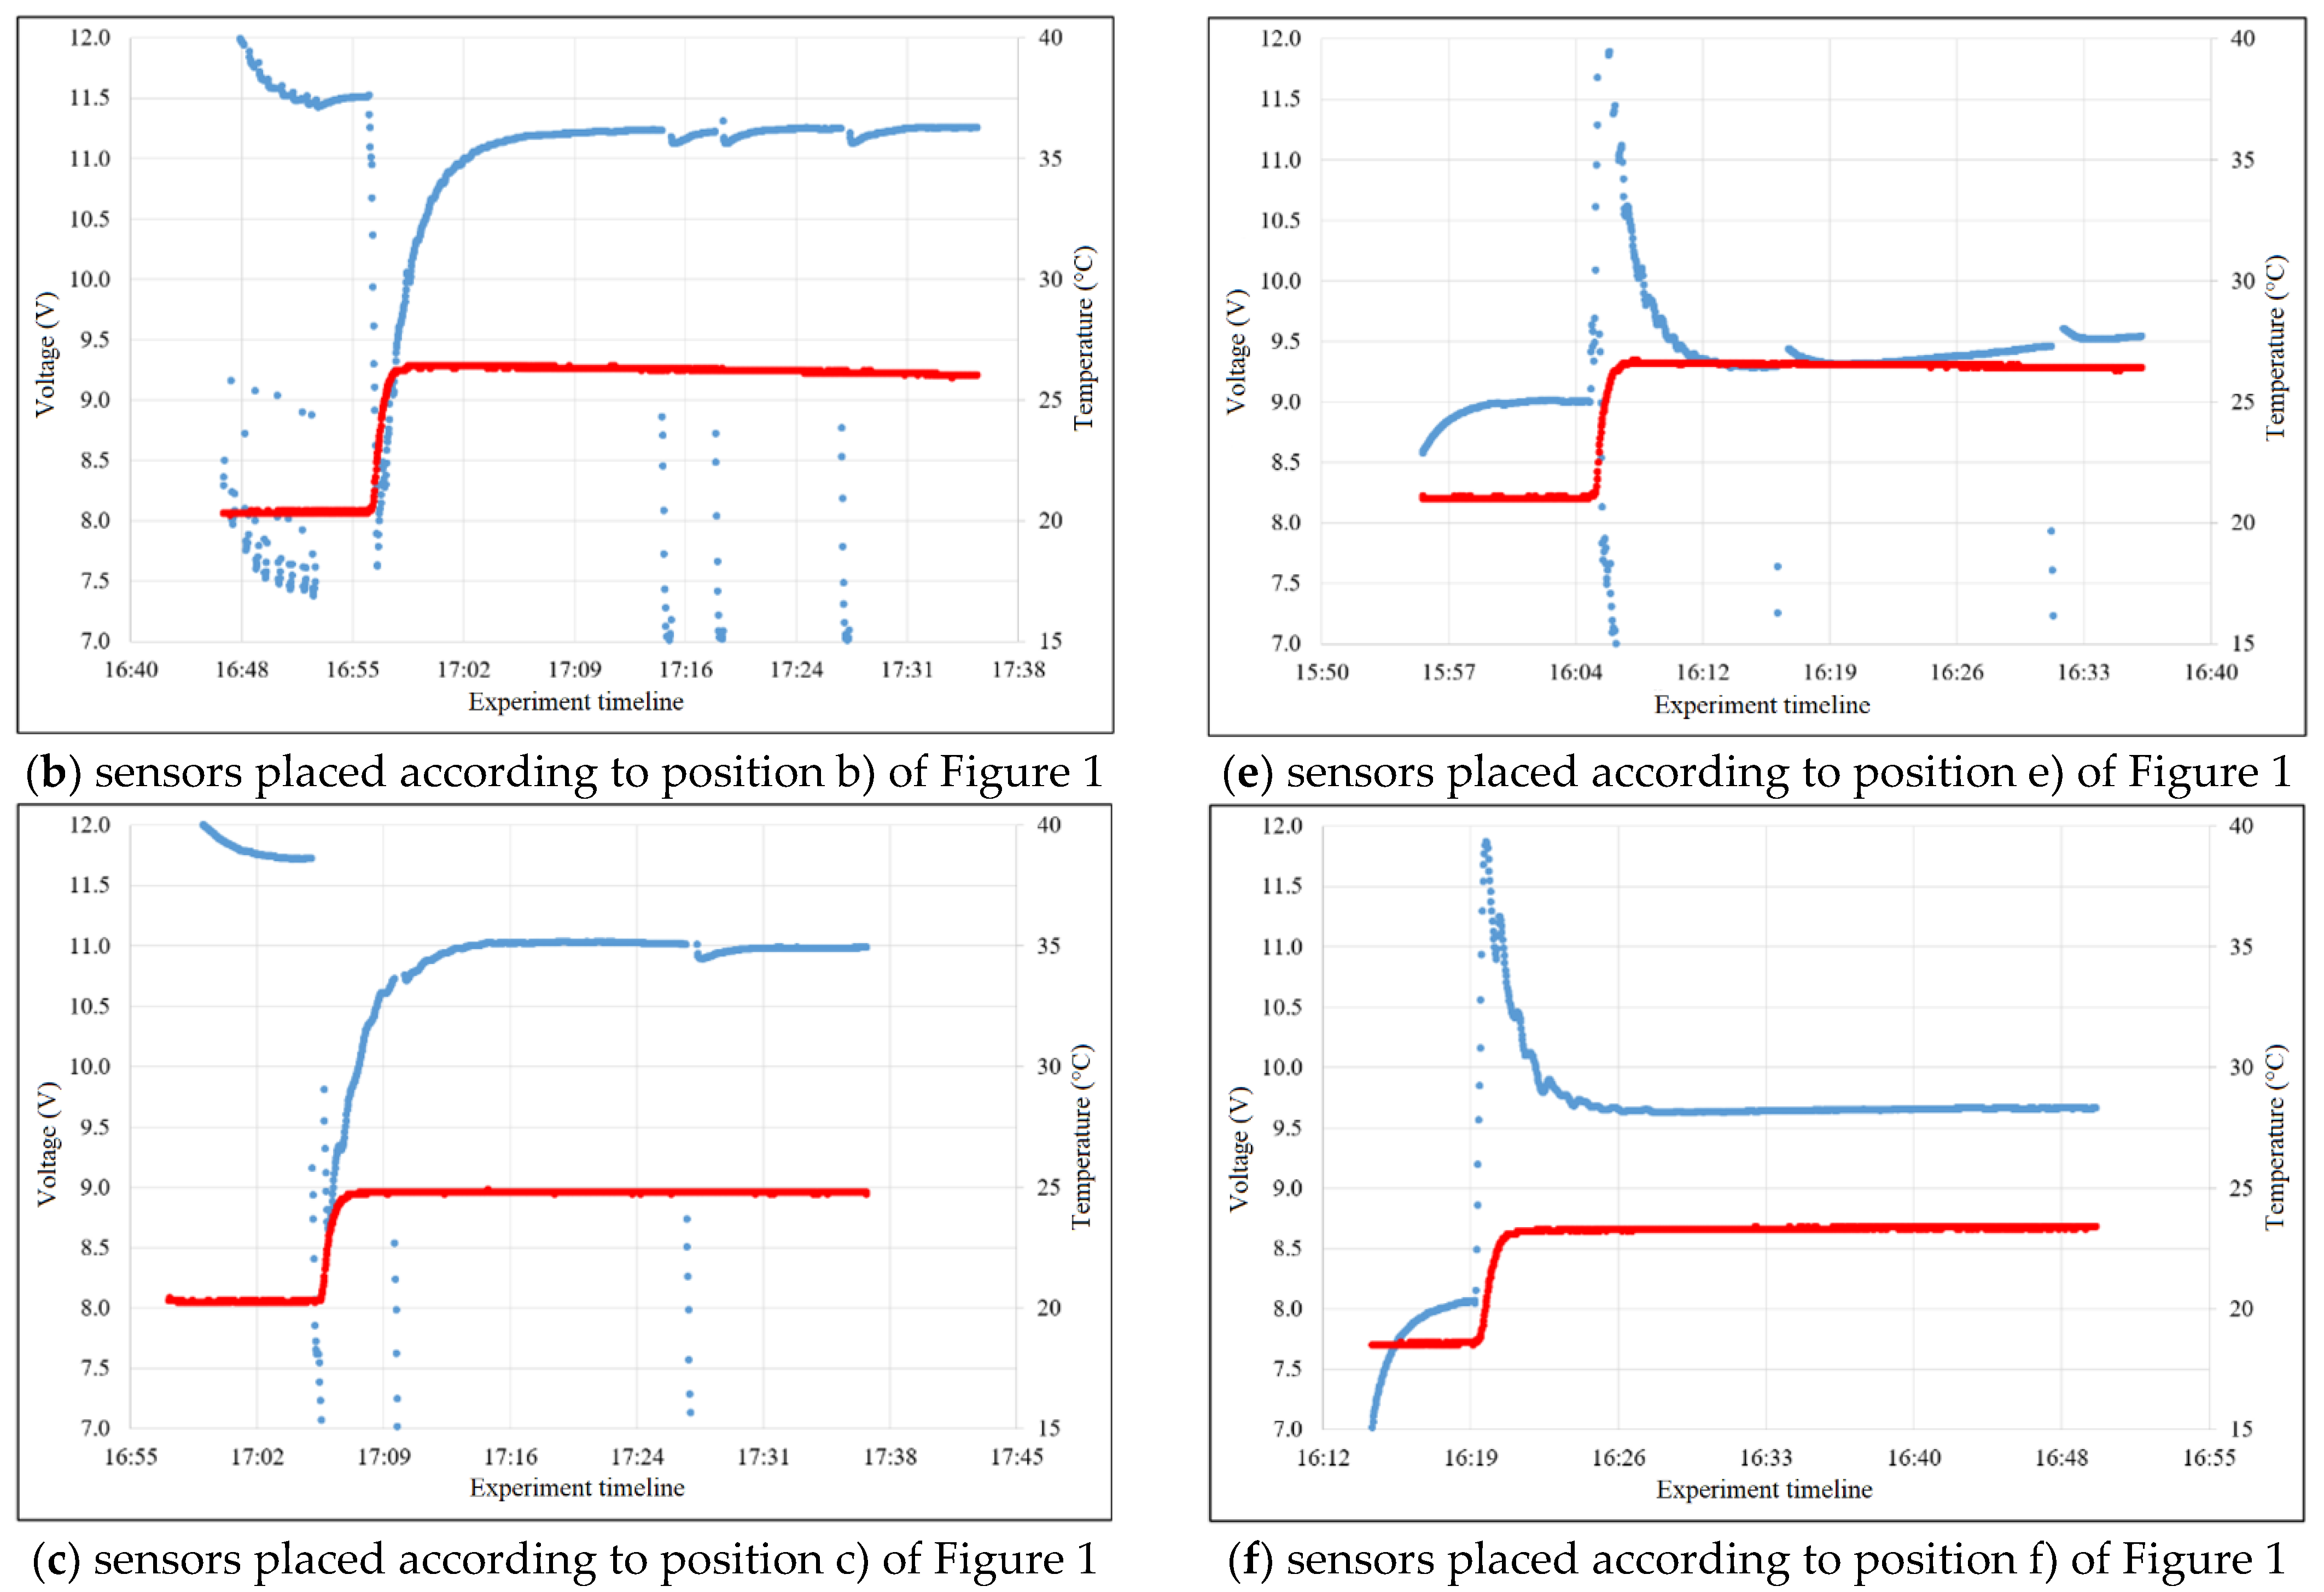
3.1.1. Effect of Sensor Position on TDS Output Response
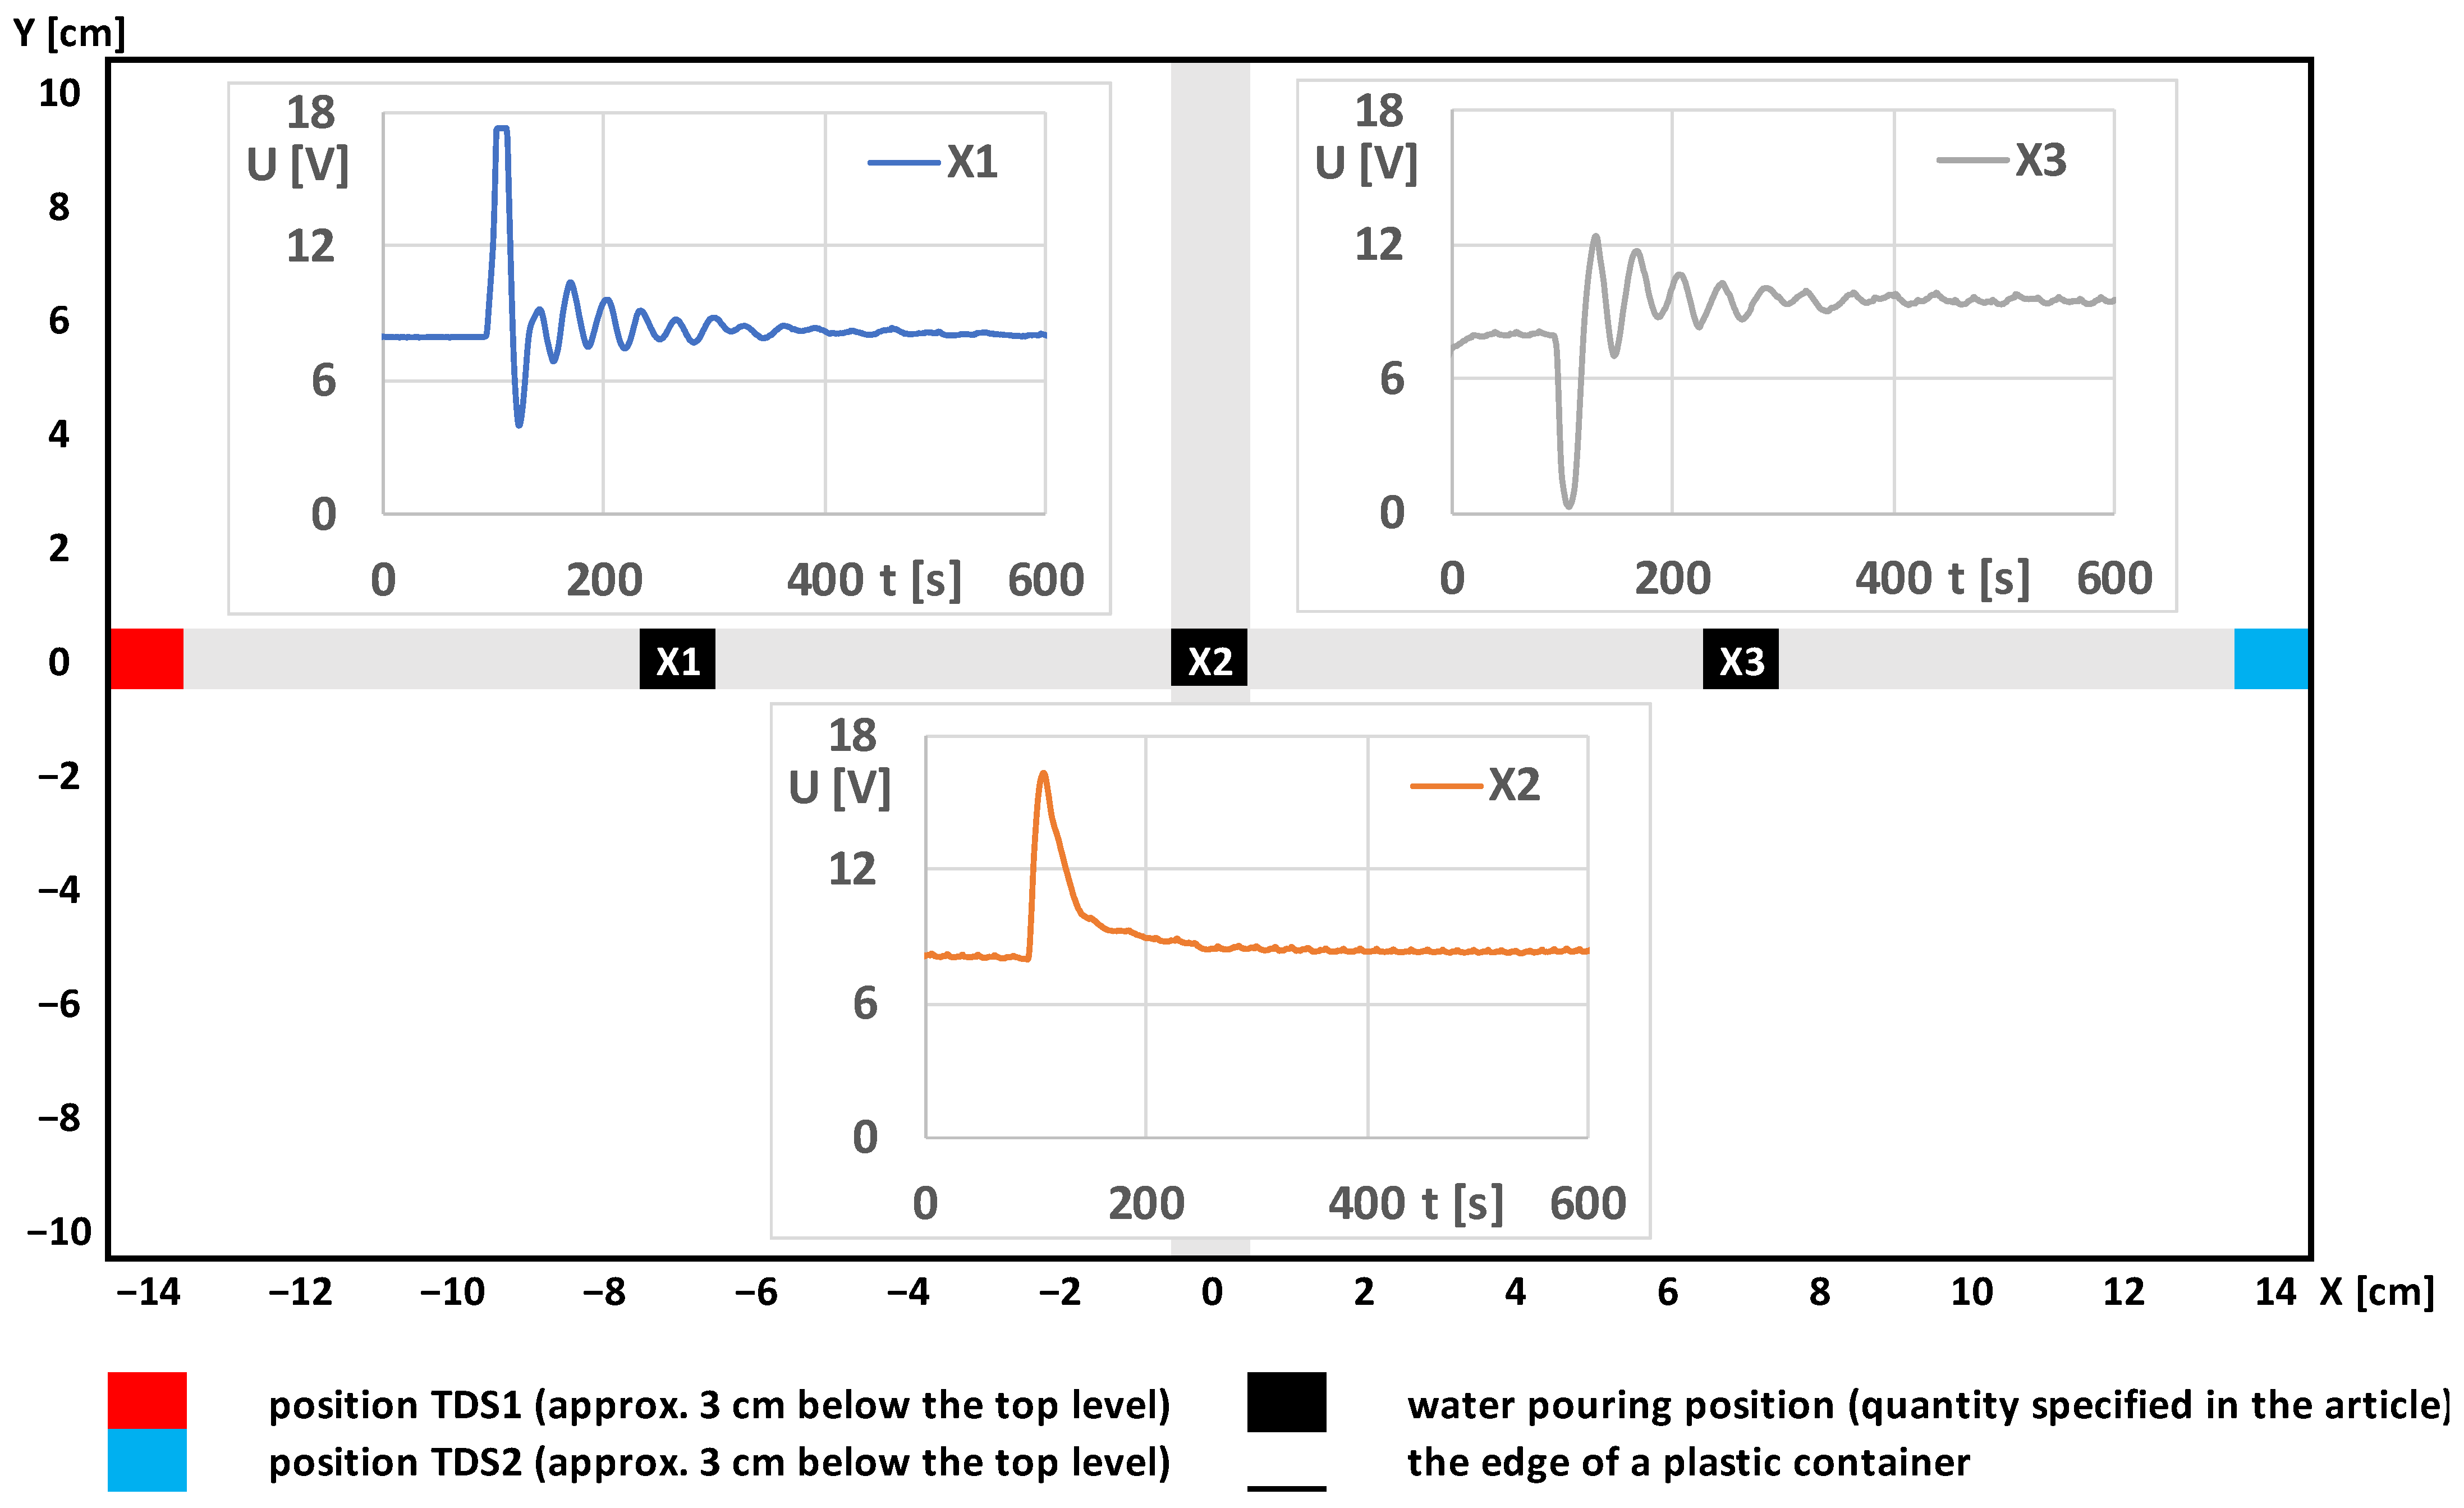
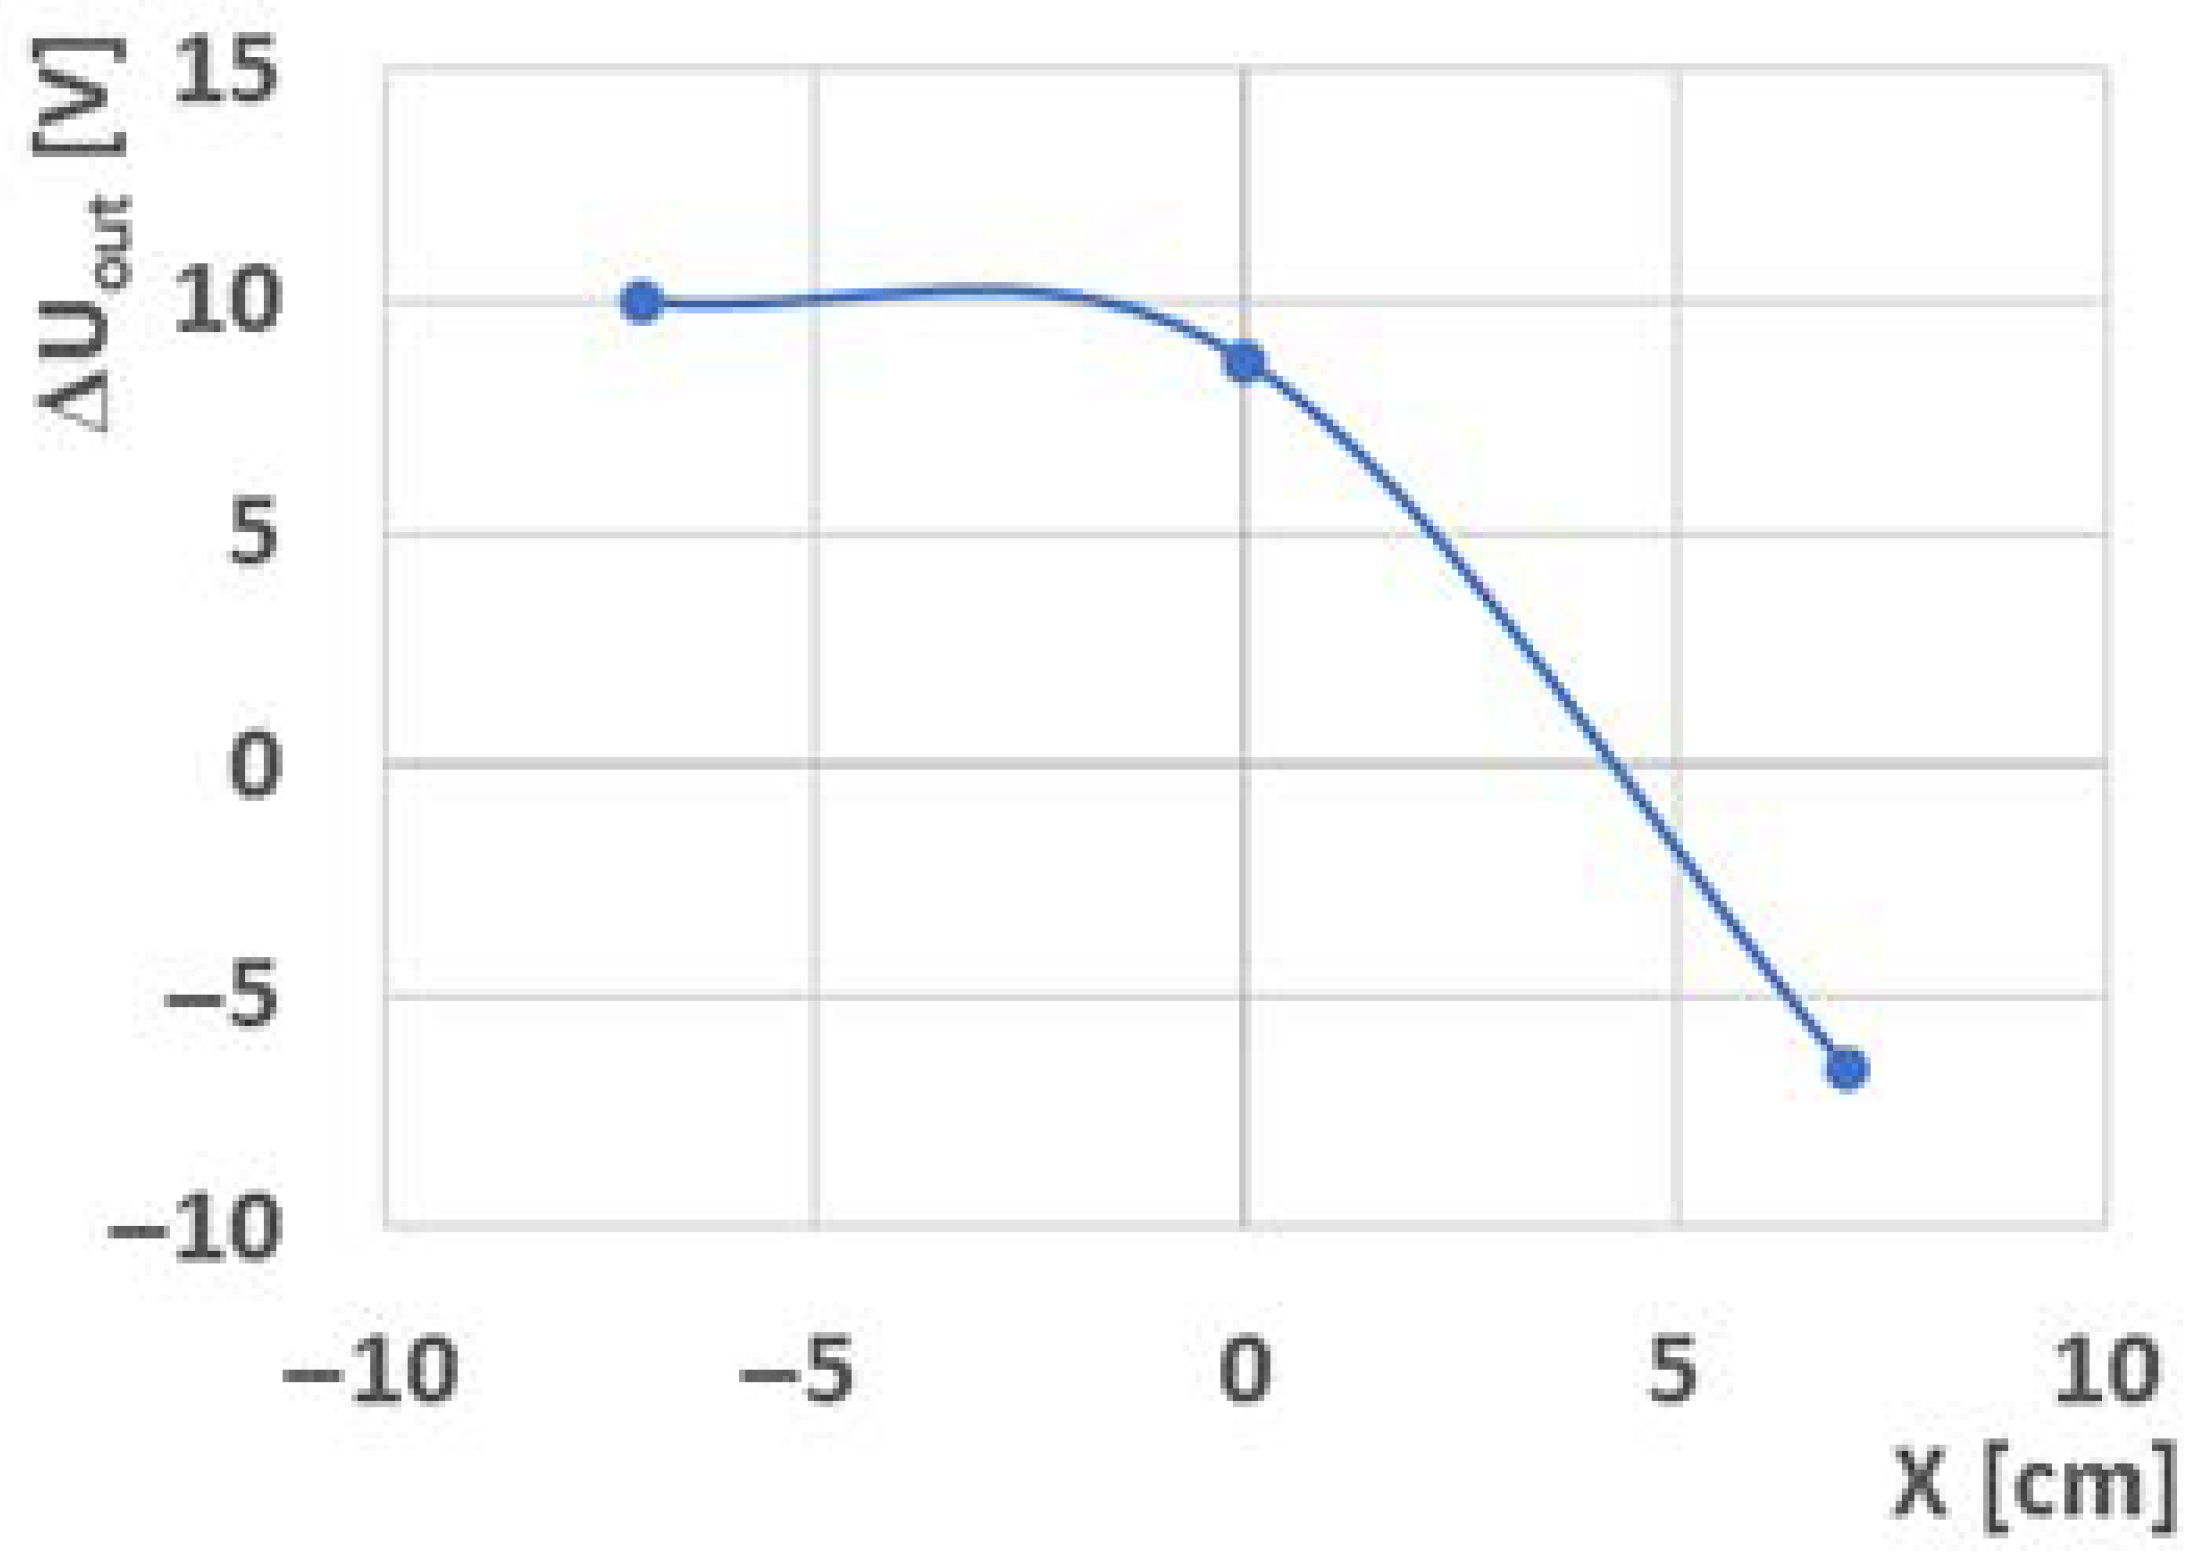
3.1.2. Effect of Signal Source Position on TDS Output Response
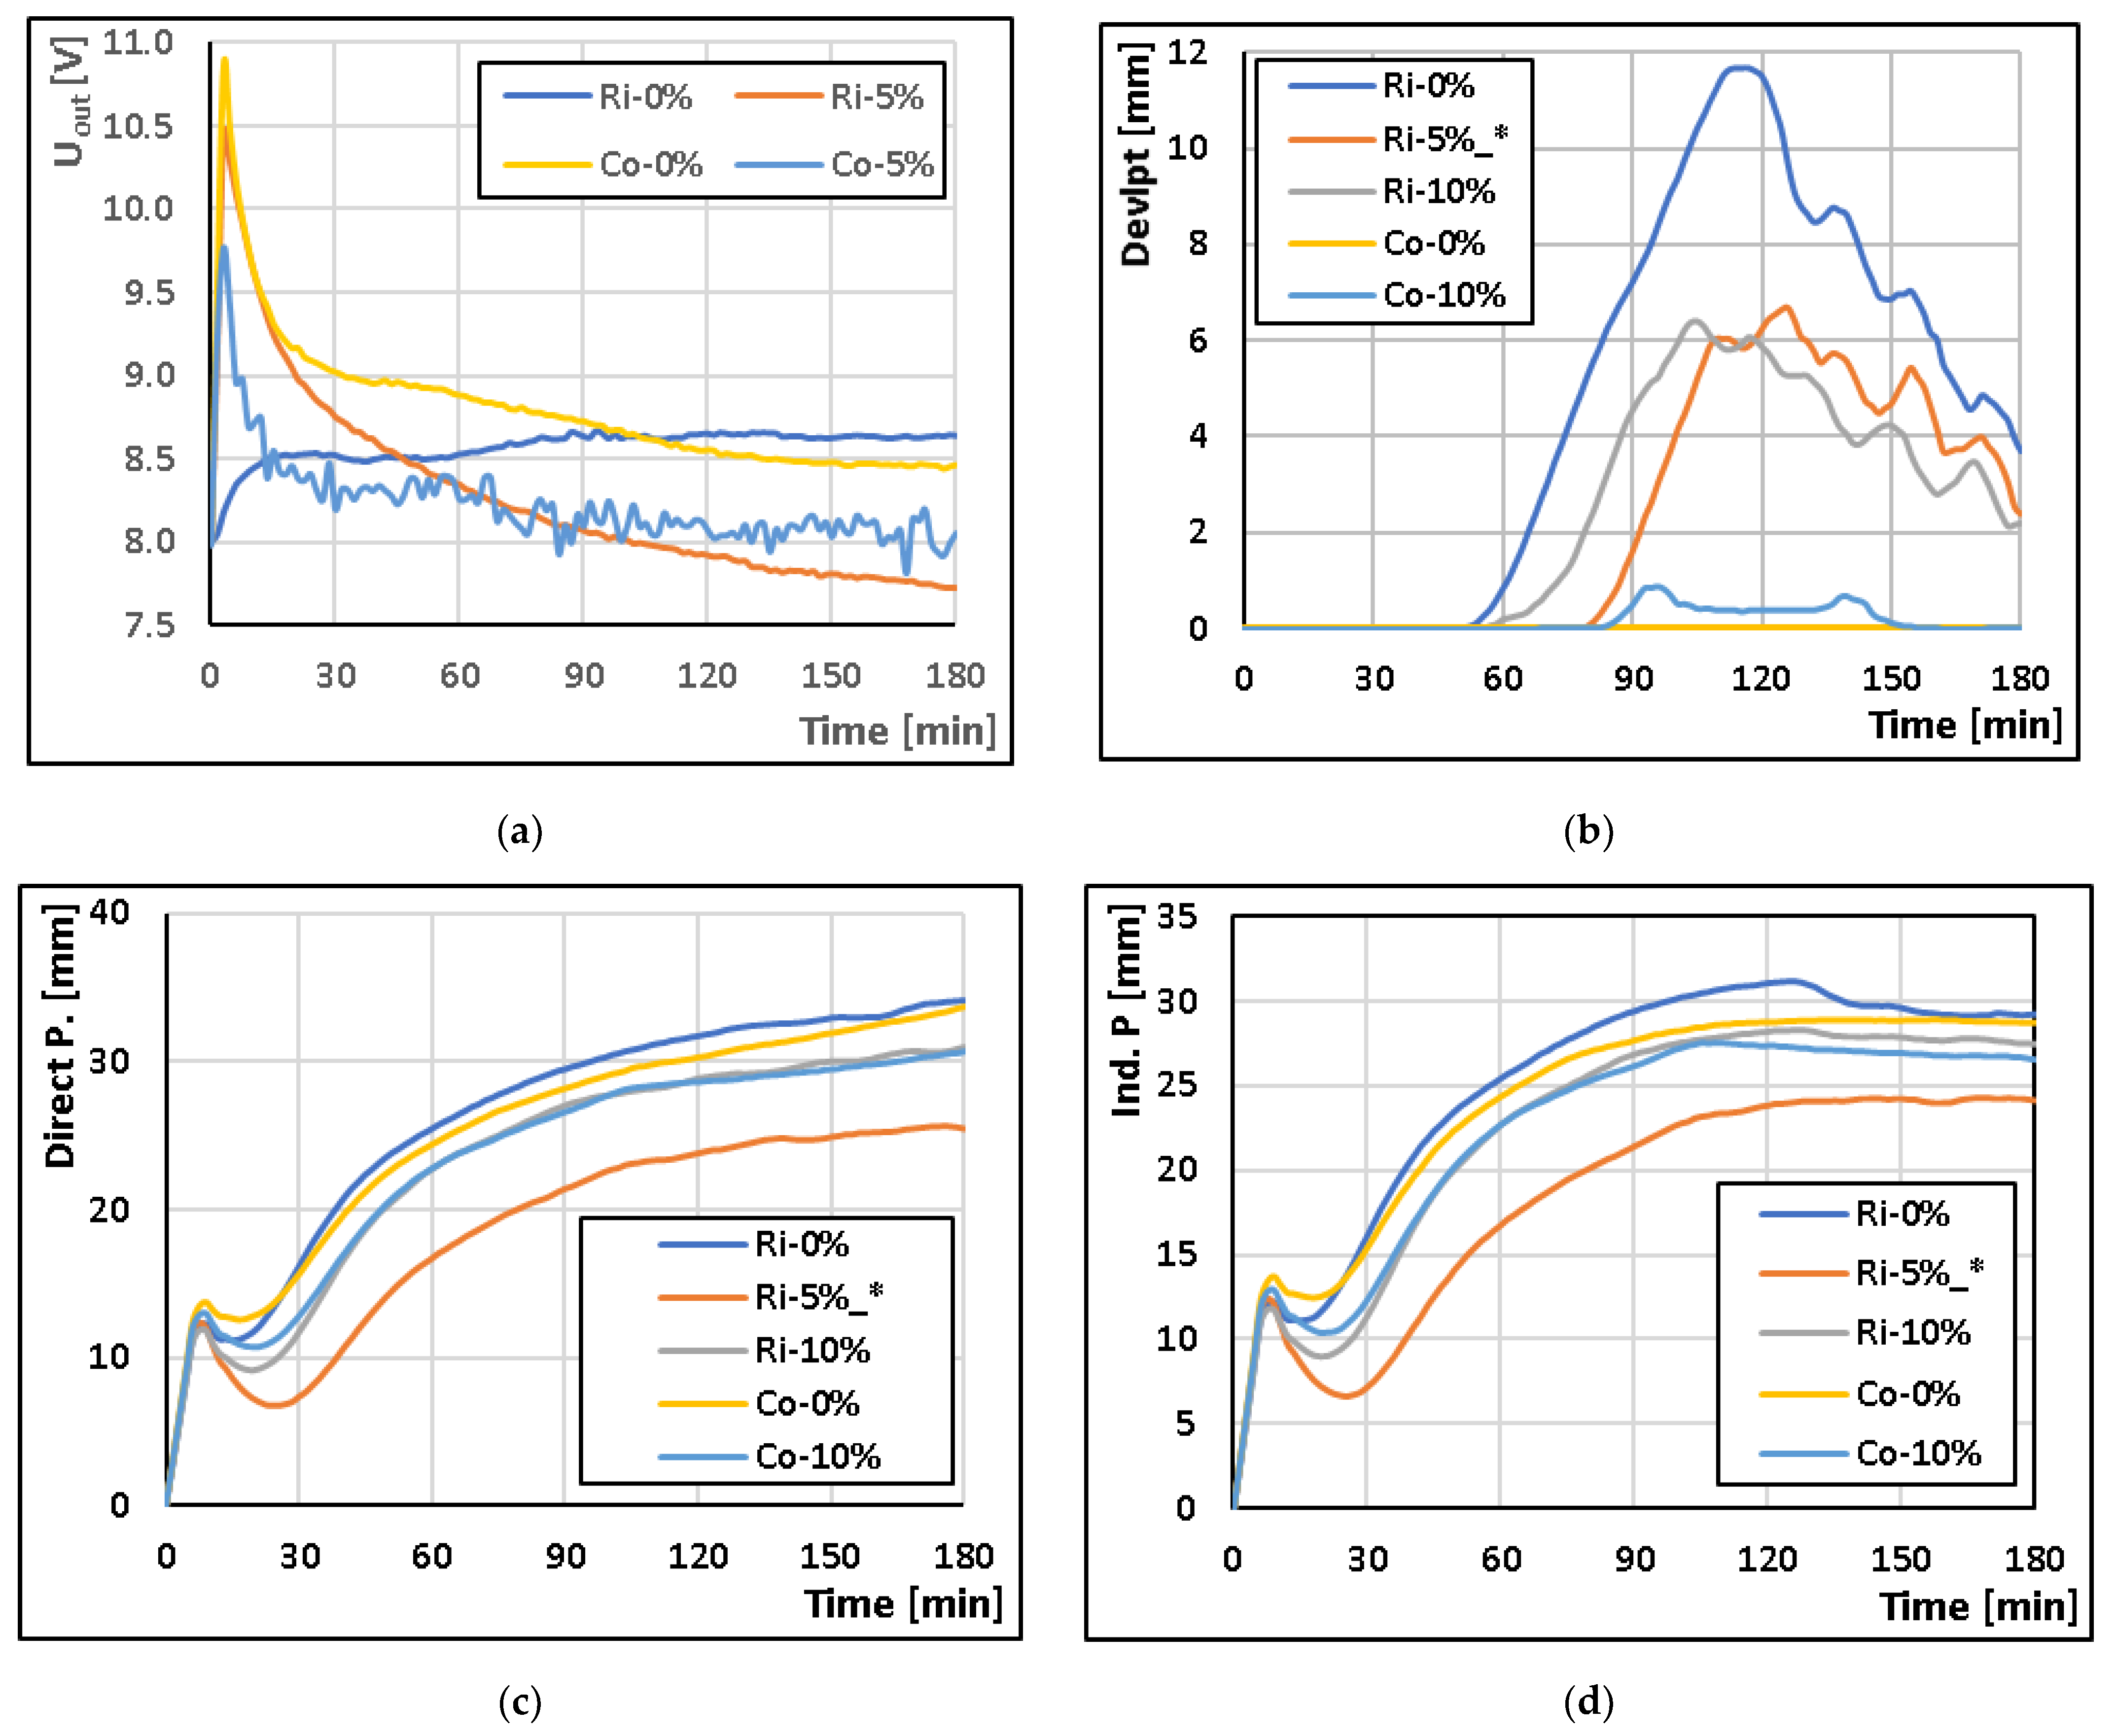
3.2. Dough-Rising Monitoring with Experimental TDS and Professional Rheo F4 Rheofermentometer
3.3. Comparison of Dough with and without Edible Insect Fortification
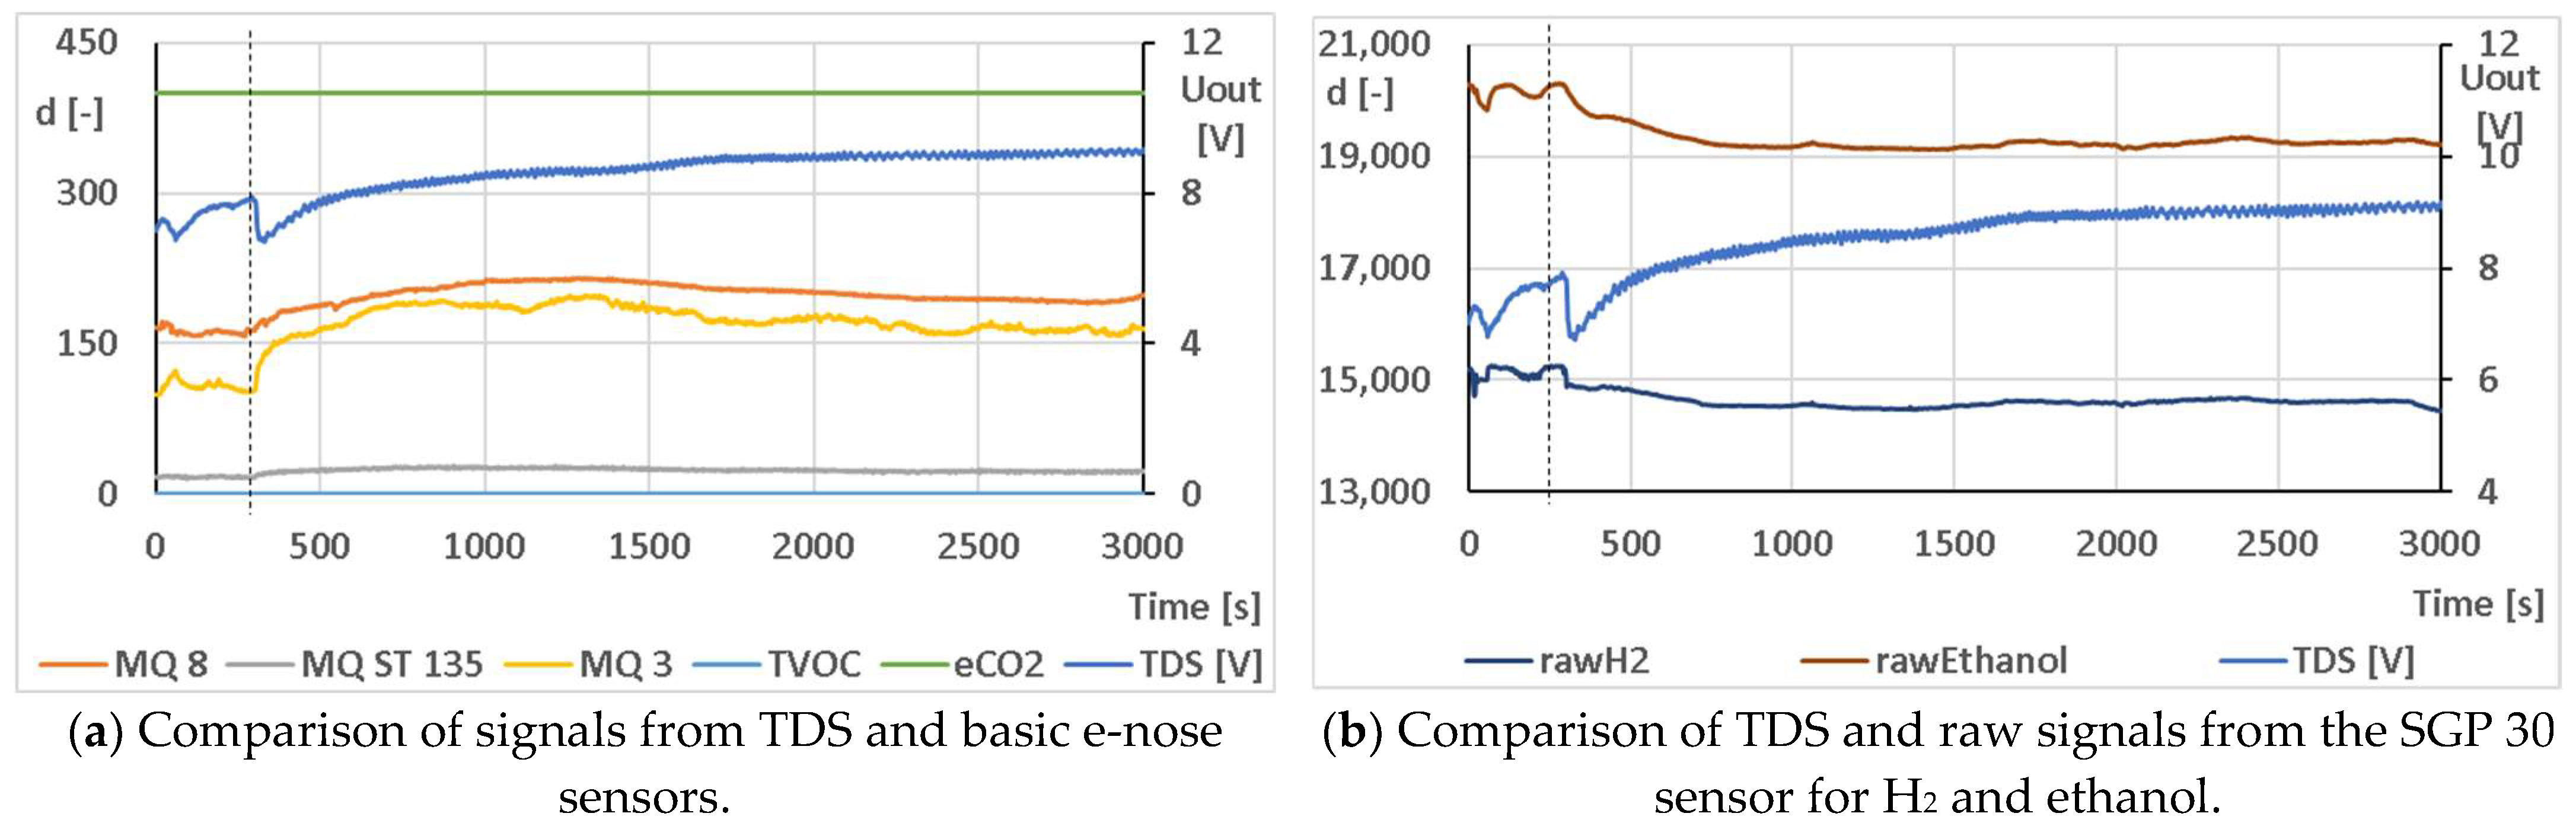
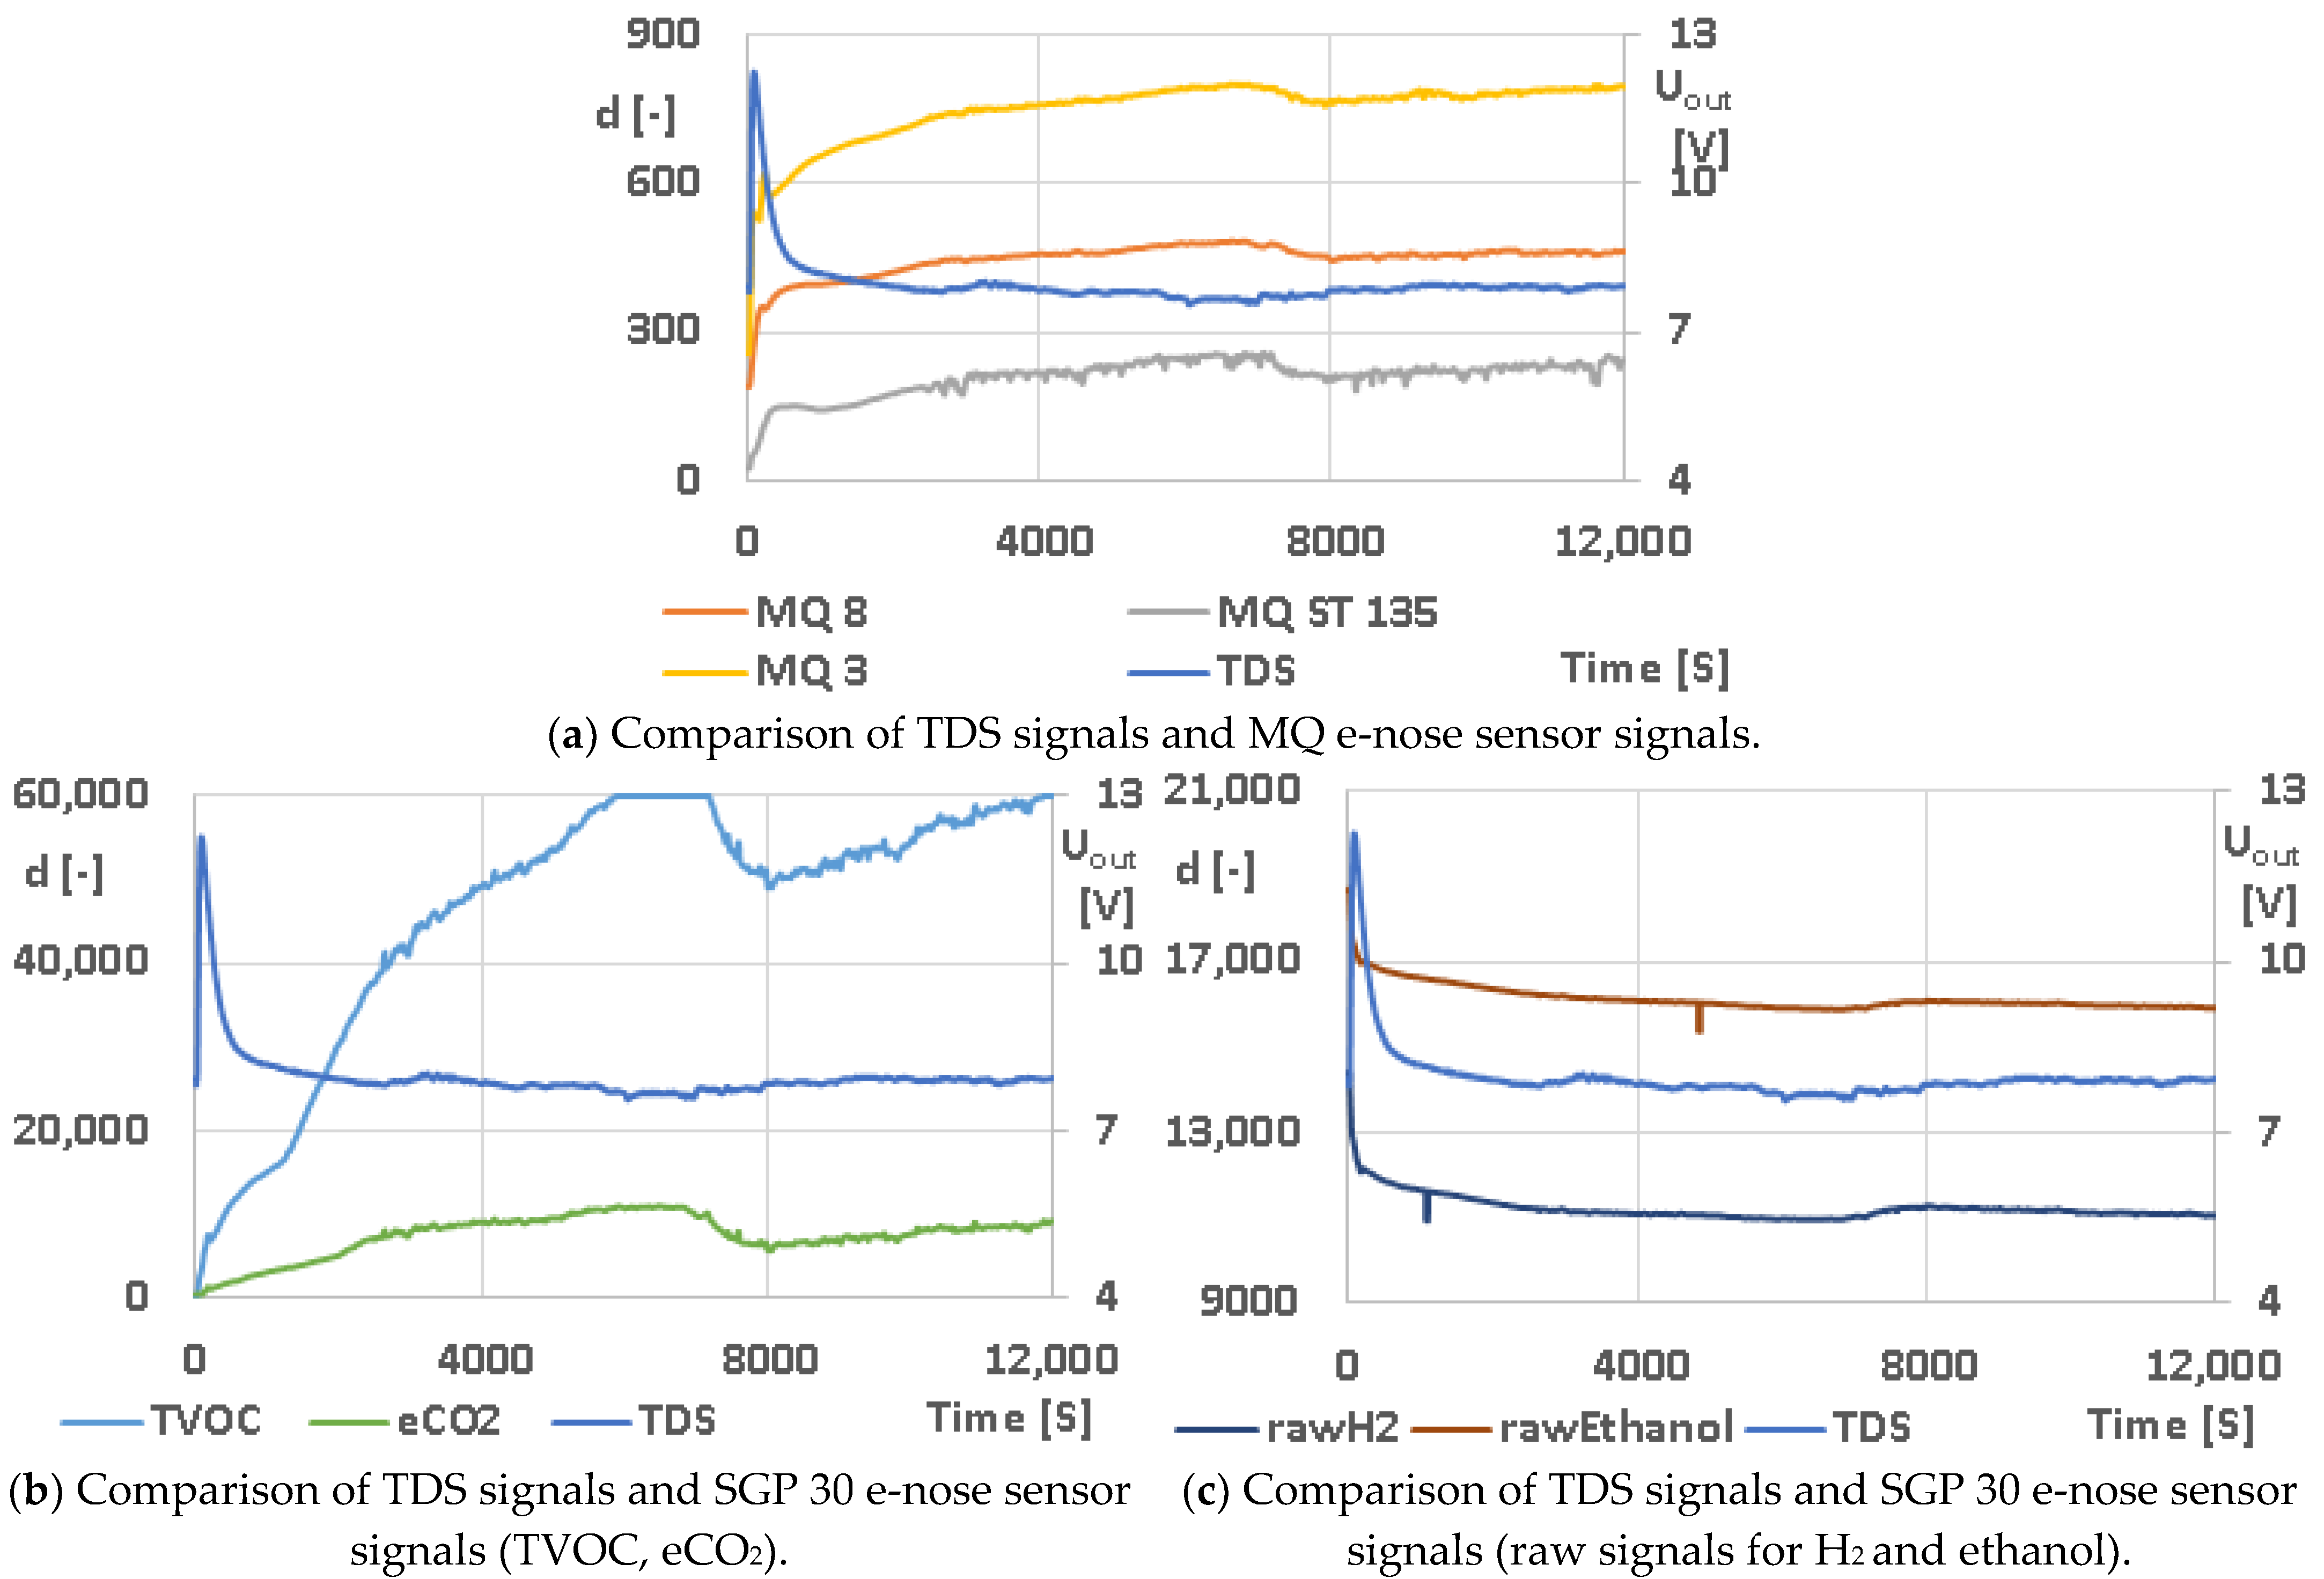
3.4. Comparison of Response from the TDS and Experimental e-Nose
4. Conclusions
Author Contributions
Funding
Institutional Review Board Statement
Informed Consent Statement
Data Availability Statement
Acknowledgments
Conflicts of Interest
References
- Řezníček, M.; Szendiuch, I.; Řezníček, M. Thermodynamic sensors new opportunities for measuring and control in industrial applications. In Proceedings of the IEEE 3rd Electronics System Integration Technology Conference ESTC, Berlin, Germany, 13–16 September 2010; Volume 5, pp. 1–5. [Google Scholar]
- Adámek, M.; Řezníček, M.; Adámková, A. The Simple Thermodynamic Sensors for Process Monitoring in Milk Production. ElectroScope 2010, 3, 1–3. [Google Scholar]
- Adámek, M.; Adámková, A.; Řezníček, M.; Kouřimská, L. The estimated possibilities of process monitoring in milk production by the simple thermodynamic sensors. Potravinarstvo 2016, 10, 643–648. [Google Scholar] [CrossRef] [PubMed] [Green Version]
- Adámek, M.; Adámková, A.; Mlček, J.; Vojáčková, K.; Faměra, O.; Búran, M.; Hlobilová, V.; Bučková, M.; Baroň, M.; Sochor, J. Sensor systems for detecting dough properties fortified with grape pomace and mealworm powders. Sensors 2020, 20, 3569. [Google Scholar] [CrossRef] [PubMed]
- Soltesz, K.; Mosebach, J.; Paruch, E.; Covino, J. Updates on the diagnosis and management of celiac disease. JAAPA 2022, 35, 39–44. [Google Scholar] [CrossRef] [PubMed]
- Gao, Y.; Janes, M.E.; Chaiya, B.; Brennan, M.A.; Brennan, C.S.; Prinyawiwatkul, W. Gluten-free bakery and pasta products: Prevalence and quality improvement. Int. J. Food Sci. 2018, 53, 19–32. [Google Scholar] [CrossRef] [Green Version]
- Capelli, A.; Oliva, N.; Cini, E. A Systematic Review of Gluten-Free Doughand Bread: Dough Rheology, Bread Characteristics, and Improvement Strategies. Appl. Sci. 2020, 10, 6559. [Google Scholar] [CrossRef]
- Burešová, I.; Kubínek, R. The behavior of amaranth, chickpea, millet, corn, quinoa, buckwheat and rice doughs under shear oscillatory and uniaxial elongational tests simulating proving and baking. J. Texture Stud. 2016, 47, 423–431. [Google Scholar] [CrossRef]
- Anton, A.A.; Artfield, S.D. Hydrocolloids in gluten-free breads: A review. Int. J. Food Sci. Nutr. 2008, 59, 11–23. [Google Scholar] [CrossRef]
- Gallagher, E.; Gormley, T.R.; Arendt, E.K. Recent advances in the formulation of gluten-free cereal-based products. Trends Food Sci. Technol. 2004, 15, 143–152. [Google Scholar] [CrossRef]
- van Huis, A. Nutrition and health of edible insects. Curr. Opin. Clin. Nutr. Metab. Care 2020, 23, 228–231. [Google Scholar] [CrossRef]
- Kowalski, S.; Mikulec, A.; Mickowska, B.; Skotnicka, M.; Mazurek, A. Wheat bread supplementation with various edible insect flours. Influence of chemical composition on nutritional and technological aspects. LWT-Food Sci. Technol. 2022, 159, 113220. [Google Scholar] [CrossRef]
- de Oliveira, L.M.; da Silva Lucas, A.J.; Cadaval, C.L.; Mellado, M.S. Bread enriched with flour from cinereous cockroach (Nauphoeta cinerea). Innov. Food Sci. Emerg. Technol. 2017, 44, 30–35. [Google Scholar] [CrossRef]
- Haber, M.; Mishyna, M.; Itzhak Martinez, J.J.; Benjamin, O. The influence of grasshopper (Schistocerca gregaria) powder enrichment on bread nutritional and sensorial properties. LWT-Food Sci. Technol. 2019, 115, 108395. [Google Scholar] [CrossRef]
- Montevecchi, G.; Licciardello, F.; Masino, F.; Miron, L.T.; Antonelli, A. Fortification of wheat flour with black soldier fly prepupae. Evaluation of technological and nutritional parameters of the intermediate doughs and final baked products. Innov. Food Sci. Emerg. Technol. 2021, 69, 102666. [Google Scholar] [CrossRef]
- Roncolini, A.; Milanović, V.; Cardinali, F.; Osimani, A.; Garofalo, C.; Sabbatini, R.; Clementi, F.; Pasquini, M.; Mozzon, M.; Foligni, R.; et al. Protein fortification with mealworm (Tenebrio molitor L.) powder: Effect on textural, microbiological, nutritional and sensory features of bread. PLoS ONE 2019, 14, e0211747. [Google Scholar] [CrossRef] [PubMed] [Green Version]
- Machado, C.R.; Thys, R.C.S. Cricket powder (Gryllus assimilis) as a new alternative protein source for gluten-free breads. Innov. Food Sci. Emerg. Technol. 2019, 56, 102180. [Google Scholar] [CrossRef]
- Kowalczewski, P.L.; Walkoviak, K.; Masewicz, L.; Bartczak, O.; Lewandowicz, J.; Kubiak, P.; Baranowska, H.M. Gluten-Free Bread with Cricket Powder—Mechanical Properties and Molecular Water Dynamics in Dough and Ready Product. Foods 2019, 8, 240. [Google Scholar] [CrossRef] [Green Version]
- Kowalczewski, P.L.; Walkowiak, K.; Masewicz, L.; Smarzyński, K.; Thanh-Blicharz, J.L.; Kačániová, M.; Baranowska, H.M. LF NMR spectroscopy analysis of water dynamics and texture of Gluten-Free bread with cricket powder during storage. Food Sci. Technol. Int. 2021, 27, 776–785. [Google Scholar] [CrossRef]
- Adámek, M.; Matyáš, J.; Adámková, A.; Mlček, J.; Búran, M.; Černeková, M.; Ševčíková, V.; Zvonková, M.; Slobodian, P.; Olejník, R. A Study on the Applicability of Thermodynamic Sensors in Fermentation Processes in Selected Foods. Sensors 2022, 22, 1997. [Google Scholar] [CrossRef]
- Albert Dukátové Buchtičky s Vanilkovým Krémem. (in Czech, Albert Ducat Buns with Vanilla Cream). Available online: https://www.albert.cz/recepty/buchticky-se-sodo (accessed on 3 October 2021).
- Gómez, M.; Talegón, M.; de la Hera, E. Influence of Mixing on Quality of Gluten-Free Bread. J. Food Qual. 2013, 7, 139–144. [Google Scholar] [CrossRef]
- Vasilica, B.T.B.; Chis, M.S.; Alexa, E.; Pop, C.; Păucean, A.; Man, S.; Igual, M.; Haydee, K.M.; Dalma, K.E.; Stănilă, S.; et al. The Impact of Insect Flour on Sourdough Fermentation-Fatty Acids, Amino-Acids, Minerals and Volatile Profile. Insects 2022, 13, 576. [Google Scholar] [CrossRef] [PubMed]
- Corsetti, A.; Settanni, L. Lactobacilli in sourdough fermentation. Food Res. Int. 2007, 40, 539–558. [Google Scholar] [CrossRef]


| Amount | Ingredients | Producer |
|---|---|---|
| 500 g | Universal gluten-free baking mix (Nature’s Promise Bio) * | HAMMERMÜHLE, KIRRWEILER, Německo |
| Plain rice flour * | Extrudo Bečice s.r.o., Bečice, Czech Republic | |
| Plain corn flour (Nature’s Promise Bio) * | PRO-BIO, Obchodní společnost S.R.O., Staré Město, Czech Republic | |
| 25 mL | Sunflower oil | Bunge Zrt., Budapest, Hungary |
| 375 mL | Long-life whole milk | Mlékárna Pragolaktos, a.s., Prague, Czech Republic |
| 100 g | Granulated sugar | Tereos TTD, Dobrovice, Czech Republic |
| 25 g | Saf-instant instant yeast (1 × 500 g packet; gluten-free, lactose-free and sugar-free) | S.I.L. 137 rue Gabriel Péri, 59703 Marcq-en-Baroeul |
| 3 g | Solsanka® Sea salt with iodine and fluorine | Solsan, a.s., Prague, Czech Republic |
| 0–10% | Edible insect flour (see Table 2) |
| Designation | Basic Flour Type | Insect Meal Content |
|---|---|---|
| Co-0% | Corn | 0% |
| Co-5% | Corn | 5% |
| Co-10% | Corn | 10% |
| Ri-0% | Rice | 0% |
| Ri-5% | Rice | 5% |
| Ri-10% | Rice | 10% |
| 1. Curve | 2. Curve | Pearson Correlation Coefficient |
|---|---|---|
| Dough development curve | ||
| Ri-0% (RF-4) | Ri-0% (TDS) | −0.618404265 |
| Ri-10% (RF-4) | Ri-5% (TDS) | −0.549489715 |
| Co-0% (RF-4) | Co-0% (TDS) | CNBD * |
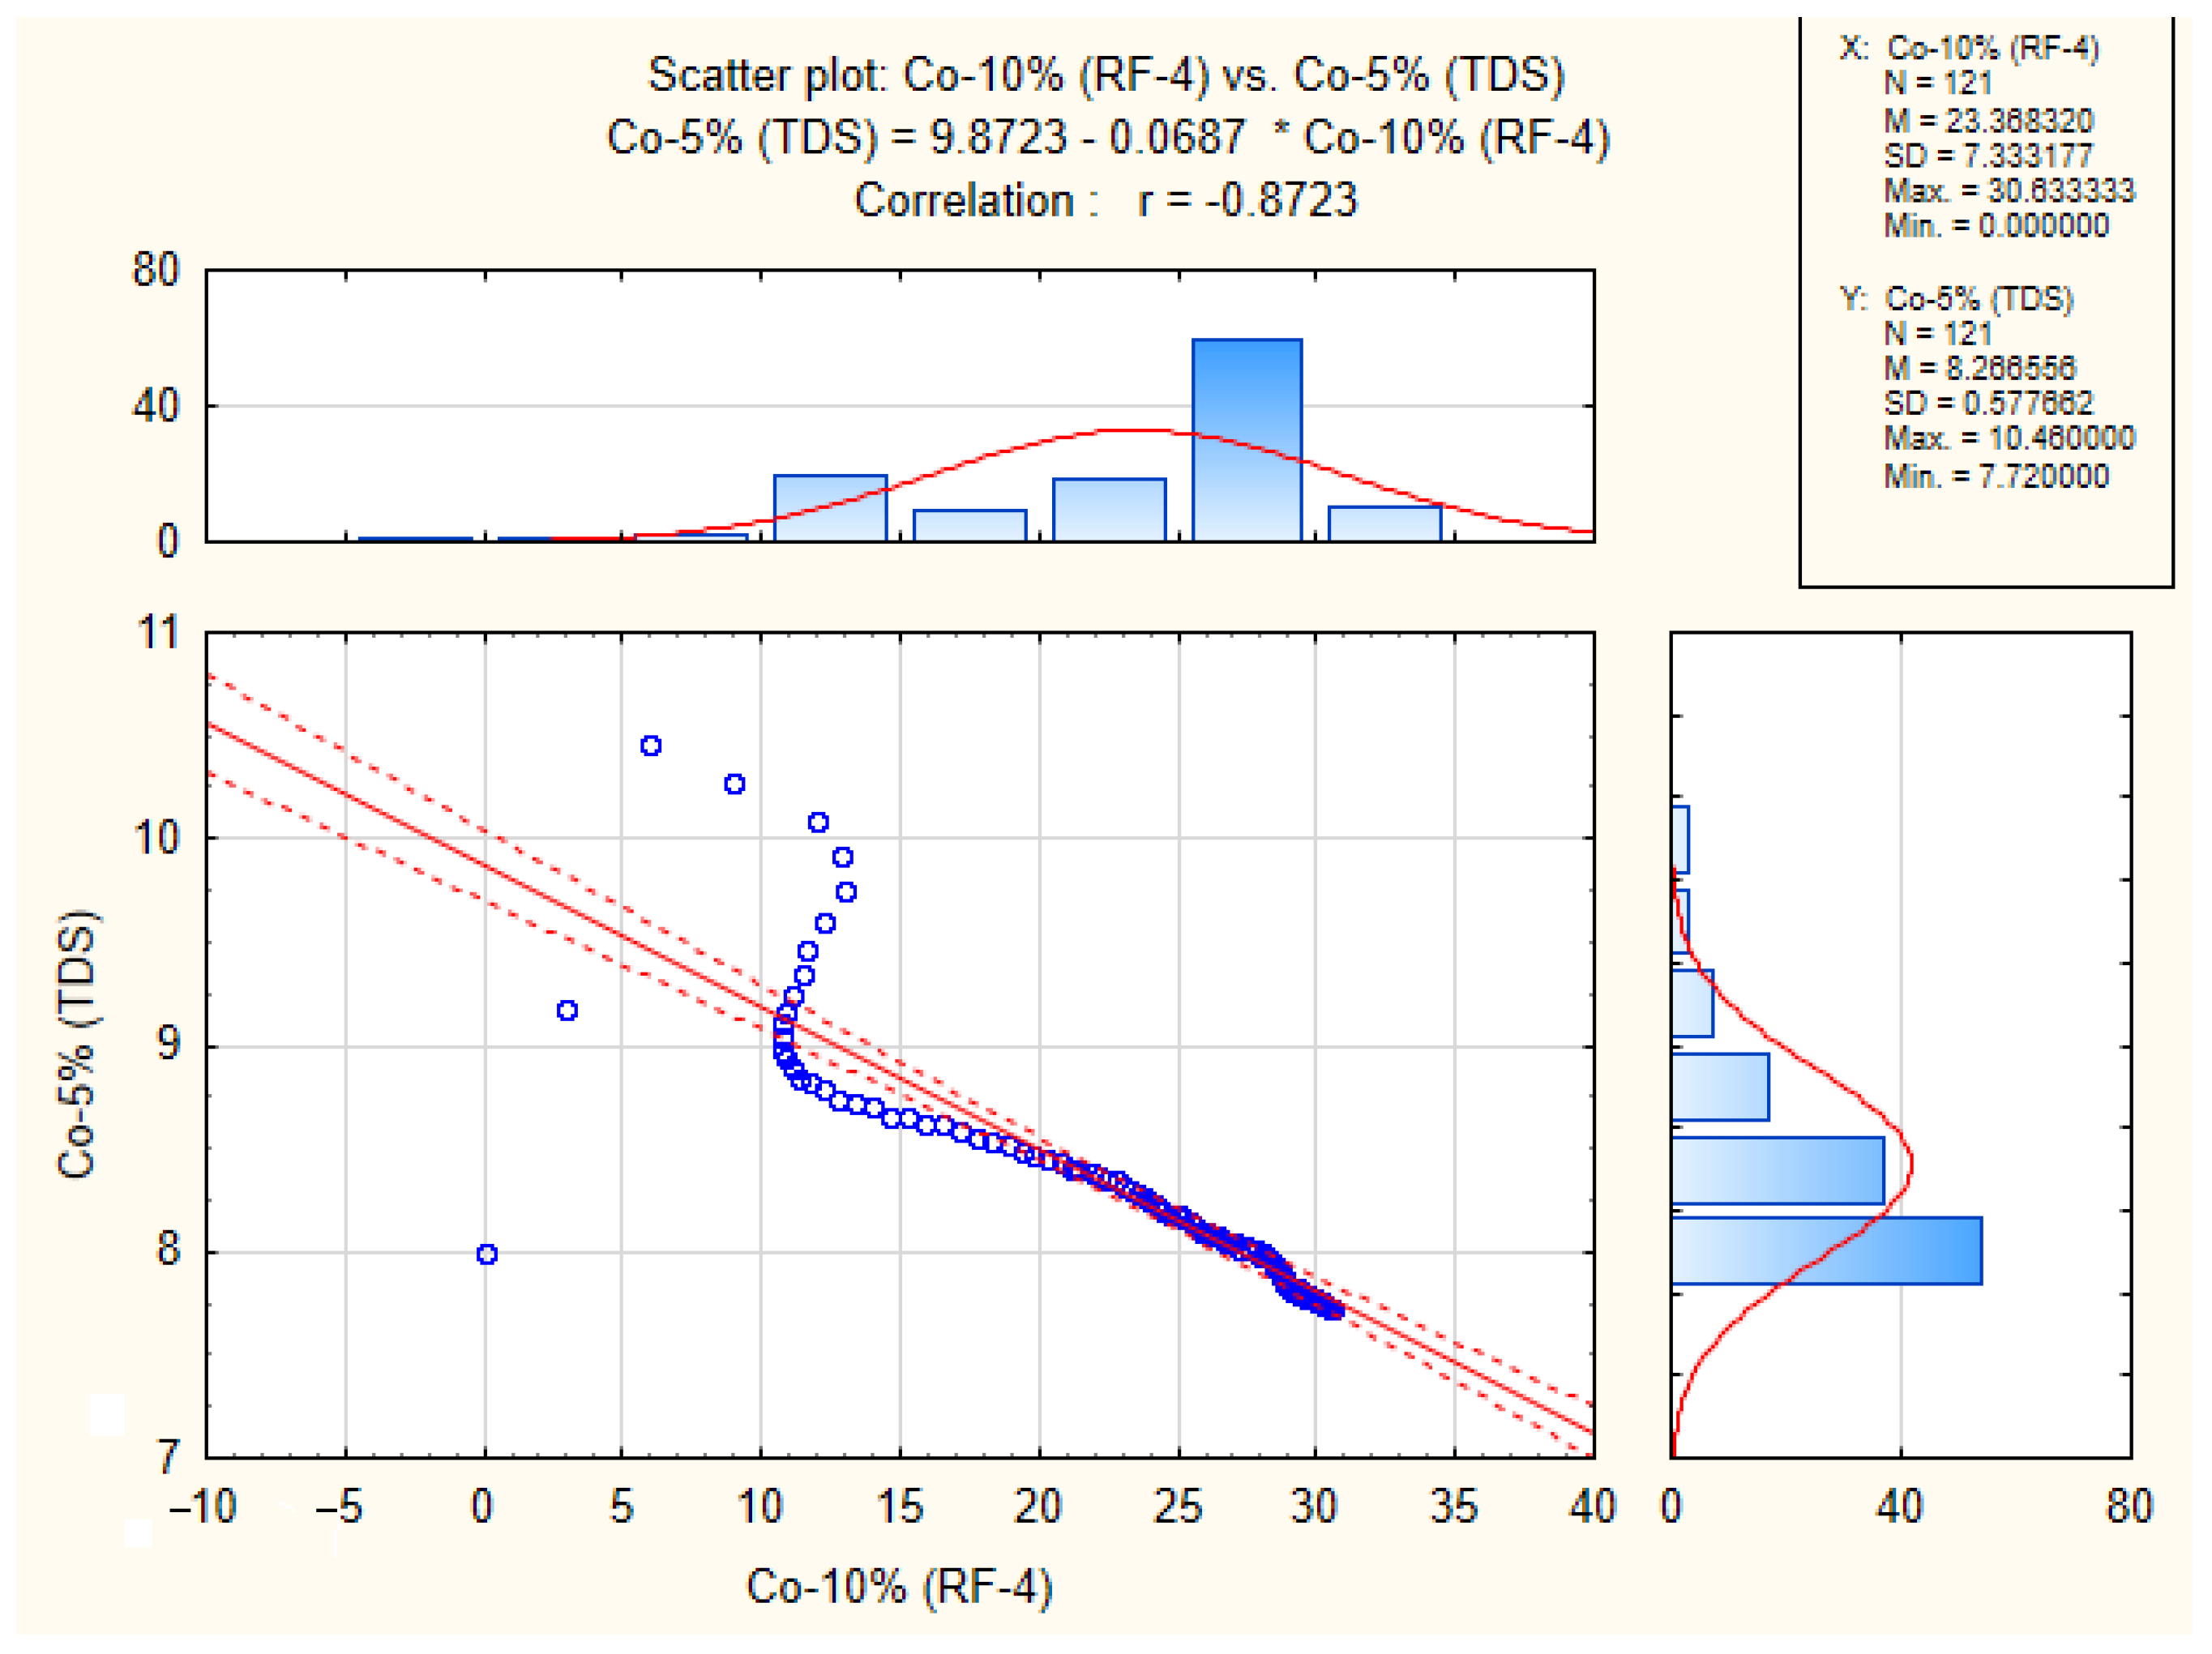
| Co-10% (RF-4) | Co-5% (TDS) | −0.418418132 |
| Gas release curve—Total volume | ||
| Ri-0% (RF-4) | Ri-0% (TDS) | −0.787737988 |
| Ri-10% (RF-4) | Ri-5% (TDS) | −0.718690282 |
| Co-0% (RF-4) | Co-0% (TDS) | 0.866863649 |
| Co-10% (RF-4) | Co-5% (TDS) | −0.872280125 |
| Gas release curve—Retention volume | ||
| Ri-0% (RF-4) | Ri-0% (TDS) | −0.760860732 |
| Ri-10% (RF-4) | Ri-5% (TDS) | −0.712353433 |
| Co-0% (RF-4) | Co-0% (TDS) | 0.878552143 |
| Co-10% (RF-4) | Co-5% (TDS) | −0.853351929 |
| Parameters | Co-0% | Co-10% |
|---|---|---|
| Dough development curve | ||
| Hm [mm] | 0.0 ± 0.0 | 1.4 ± 0.7 |
| h [mm] | 0.0 ± 0.0 | 0.0 ± 0.0 |
| (Hm-h)/Hm [%] | 23 ± 21 | 67 ± 33 |
| T1 [min] | 178 ± 1 | 138 ± 25 |
| T2 [min] | CNBD * | CNBD * |
| T’2 [min] | CNBD * | CNBD * |
| T2-T’2 [min] | CNBD * | CNBD * |
| Gas release curve | ||
| H’m [mm] | 33.7 ± 0.8 | 30.6 ± 1.9 |
| T’1 [min] | 180.0 ± 0.0 | 180.0 ± 0.0 |
| Tx [min] | CNBD * | CNBD * |
| Vt [mL] (Total) | 715 ± 22 | 659 ± 47 |
| Vr [mL] (Retention) | 681 ± 20 | 631 ± 42 |
| Vc [mL] (CO2) | 34 ± 3 | 29 ± 6 |
| Vr/Vt [%] (CR) | 95 ± 1 | 96 ± 1 |
| Parameters | Corn Flour | Rice Flour | ||||||
|---|---|---|---|---|---|---|---|---|
| MCo-0% | MCo-10% | t | p | MRi-0% | MRi-10% | t | p | |
| Dough development curve | ||||||||
| Hm [mm] | 0.0 | 1.4 | −2.152 | 0.098 | 12.23 | 6.8 | 1.228 | 0.287 |
| h [mm] | 0.0 | 0.03 | −1.000 | 0.374 | 3.7 | 2.2 | 0.701 | 0.522 |
| (Hm-h)/Hm [%] | 23.2 | 66.7 | −1.099 | 0.333 | 70.87 | 74.93 | −0.244 | 0.819 |
| T1 [min] | 178.0 | 137.5 | 1.610 | 0.183 | 110.5 | 103 | 0.414 | 0.700 |
| Gas release curve | ||||||||
| H’m [mm] | 33.7 | 30.6 | 1.512 | 0.205 | 34.2 | 31.0 | 1.674 | 0.169 |
| Vt [mL] (Total) | 715.3 | 659.3 | 1.074 | 0.343 | 737.3 | 658.7 | 1.746 | 0.156 |
| Vr [mL] (Retention) | 680.7 | 631.3 | 1.060 | 0.349 | 706.3 | 637.3 | 1.887 | 0.132 |
| Vc [mL] (CO2) | 34.3 | 28.7 | 0.909 | 0.415 | 31 | 21.3 | 1.028 | 0.362 |
| Vr/Vt [%] (CR) | 95.2 | 95.7 | −0.930 | 0.405 | 95.9 | 96.8 | −0.862 | 0.437 |
| Variable | Correlation Labeled Correlations Are Significant at the p < 0.05000 Level N = 2708 (Full Cases Omitted for ChD) | |||||||
|---|---|---|---|---|---|---|---|---|
| M | SD | TDS [V] | MQ 8 | MQ ST 135 | MQ 3 | Raw H2 | Raw Ethanol | |
| TDS [V] | 8.86 | 0.61 | 1.00 | 0.52 | 0.13 | 0.27 | −0.80 | −0.70 |
| MQ 8 | 198.66 | 11.98 | 0.52 | 1.00 | 0.82 | 0.89 | −0.84 | −0.91 |
| MQ ST 135 | 22.84 | 2.14 | 0.13 | 0.82 | 1.00 | 0.92 | −0.54 | −0.73 |
| MQ 3 | 165.83 | 18.40 | 0.27 | 0.89 | 0.92 | 1.00 | −0.64 | −0.85 |
| raw H2 | 14,561.11 | 182.19 | −0.80 | −0.84 | −0.54 | −0.64 | 1.00 | 0.89 |
| raw ethanol | 19,325.57 | 245.37 | −0.70 | −0.91 | −0.73 | −0.85 | 0.89 | 1.00 |
| Variable | Correlation Labeled Correlations Are Significant at the p < 0.05000 Level N = 7376 (Entire Cases Omitted for ChD) | |||||||||
|---|---|---|---|---|---|---|---|---|---|---|
| M | SD | TDS [V] | MQ 8 | MQ ST 135 | MQ 3 | TVOC | eCO2 | Raw H2 | Raw Ethanol | |
| TDS [V] | 7.96 | 0.47 | 1.00 | −0.73 | −0.65 | −0.66 | −0.60 | −0.61 | 0.69 | 0.66 |
| MQ 8 | 451.12 | 31.73 | −0.73 | 1.00 | 0.94 | 0.97 | 0.91 | 0.89 | −0.97 | −0.97 |
| MQ ST 135 | 215.39 | 35.63 | −0.65 | 0.94 | 1.00 | 0.94 | 0.95 | 0.91 | −0.89 | −0.94 |
| MQ 3 | 760.42 | 58.04 | −0.66 | 0.97 | 0.94 | 1.00 | 0.95 | 0.87 | −0.95 | −0.99 |
| TVOC | 49,028.01 | 14,770.10 | −0.60 | 0.91 | 0.95 | 0.95 | 1.00 | 0.91 | −0.85 | −0.94 |
| eCO2 | 7824.22 | 2359.49 | −0.61 | 0.89 | 0.91 | 0.87 | 0.91 | 1.00 | −0.86 | −0.88 |
| raw H2 | 11,179.76 | 297.66 | 0.69 | −0.97 | −0.89 | −0.95 | −0.85 | −0.86 | 1.00 | 0.95 |
| raw ethanol | 16,087.07 | 294.93 | 0.66 | −0.97 | −0.94 | −0.99 | −0.94 | −0.88 | 0.95 | 1.00 |
Disclaimer/Publisher’s Note: The statements, opinions and data contained in all publications are solely those of the individual author(s) and contributor(s) and not of MDPI and/or the editor(s). MDPI and/or the editor(s) disclaim responsibility for any injury to people or property resulting from any ideas, methods, instructions or products referred to in the content. |
© 2023 by the authors. Licensee MDPI, Basel, Switzerland. This article is an open access article distributed under the terms and conditions of the Creative Commons Attribution (CC BY) license (https://creativecommons.org/licenses/by/4.0/).
Share and Cite
Adamek, M.; Zvonkova, M.; Buresova, I.; Buran, M.; Sevcikova, V.; Sebestikova, R.; Adamkova, A.; Skowronkova, N.; Mlcek, J. Use of a Thermodynamic Sensor in Monitoring Fermentation Processes in Gluten-Free Dough Proofing. Sensors 2023, 23, 534. https://doi.org/10.3390/s23010534
Adamek M, Zvonkova M, Buresova I, Buran M, Sevcikova V, Sebestikova R, Adamkova A, Skowronkova N, Mlcek J. Use of a Thermodynamic Sensor in Monitoring Fermentation Processes in Gluten-Free Dough Proofing. Sensors. 2023; 23(1):534. https://doi.org/10.3390/s23010534
Chicago/Turabian StyleAdamek, Martin, Magdalena Zvonkova, Iva Buresova, Martin Buran, Veronika Sevcikova, Romana Sebestikova, Anna Adamkova, Nela Skowronkova, and Jiri Mlcek. 2023. "Use of a Thermodynamic Sensor in Monitoring Fermentation Processes in Gluten-Free Dough Proofing" Sensors 23, no. 1: 534. https://doi.org/10.3390/s23010534