Author Contributions
Conceptualization, I.H.; methodology, I.H. and M.A.H.; software, I.H., R.J., M.A.B., M.U., Y.K. and A.R.M.K.; validation, I.H. and M.A.H.; formal analysis, I.H., R.J., M.A.B., M.U. and A.R.M.K.; investigation, I.H.; resources, J.-S.K.; data curation, I.H., R.J., M.A.B., M.U. and A.R.M.K.; writing—original draft preparation, I.H.; writing—review and editing, I.H., M.A.H., R.J., M.A.B., M.U., A.R.M.K., Y.K. and J.-S.K.; visualization, I.H.; supervision, J.-S.K.; project administration, I.H., M.A.H. and J.-S.K.; funding acquisition, J.-S.K. All authors have read and agreed to the published version of the manuscript.
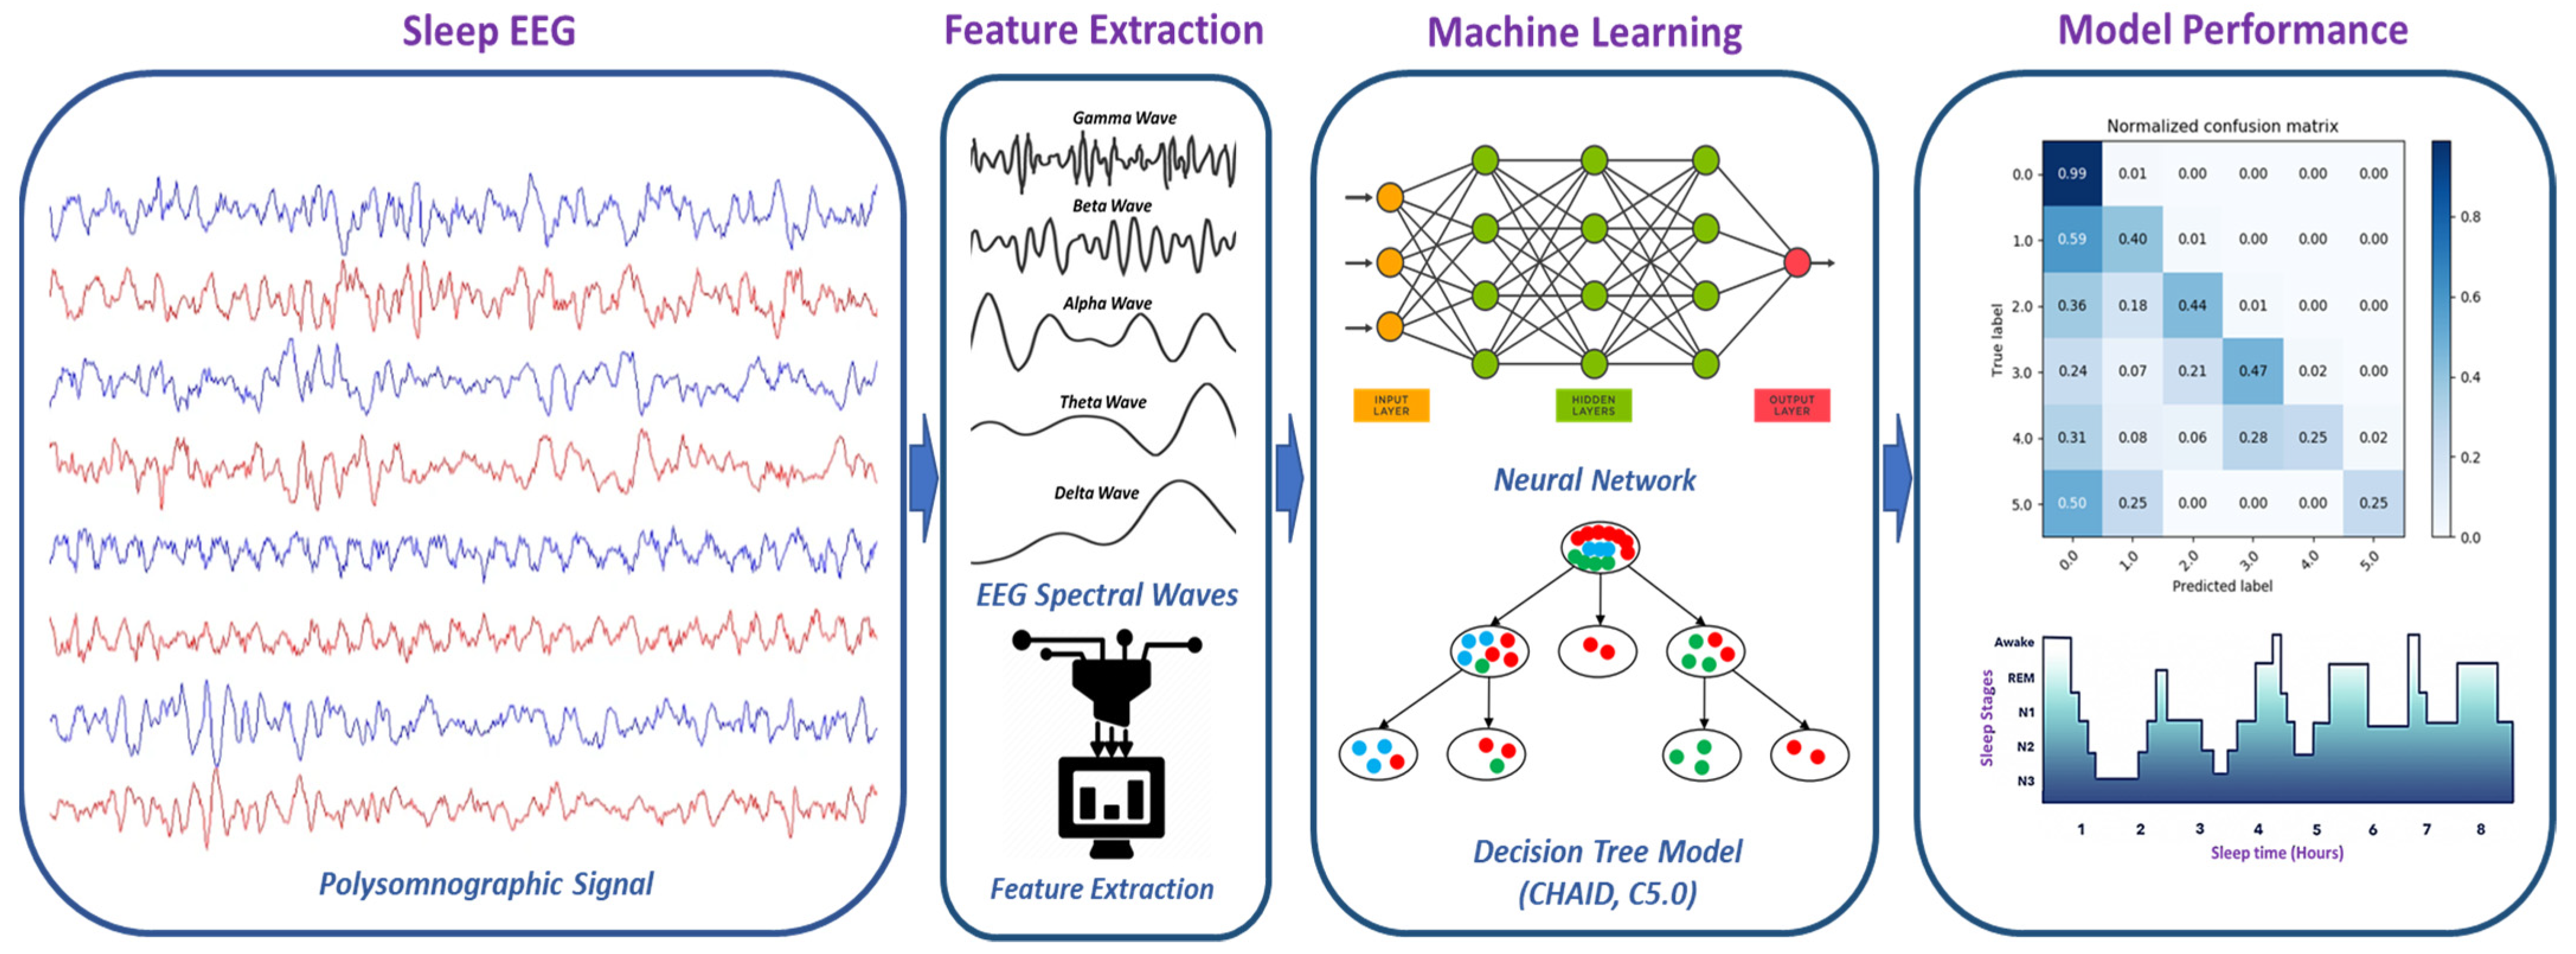
Figure 1.
Methodology of EEG-based sleep stages classification using a machine-learning approach.
Figure 1.
Methodology of EEG-based sleep stages classification using a machine-learning approach.
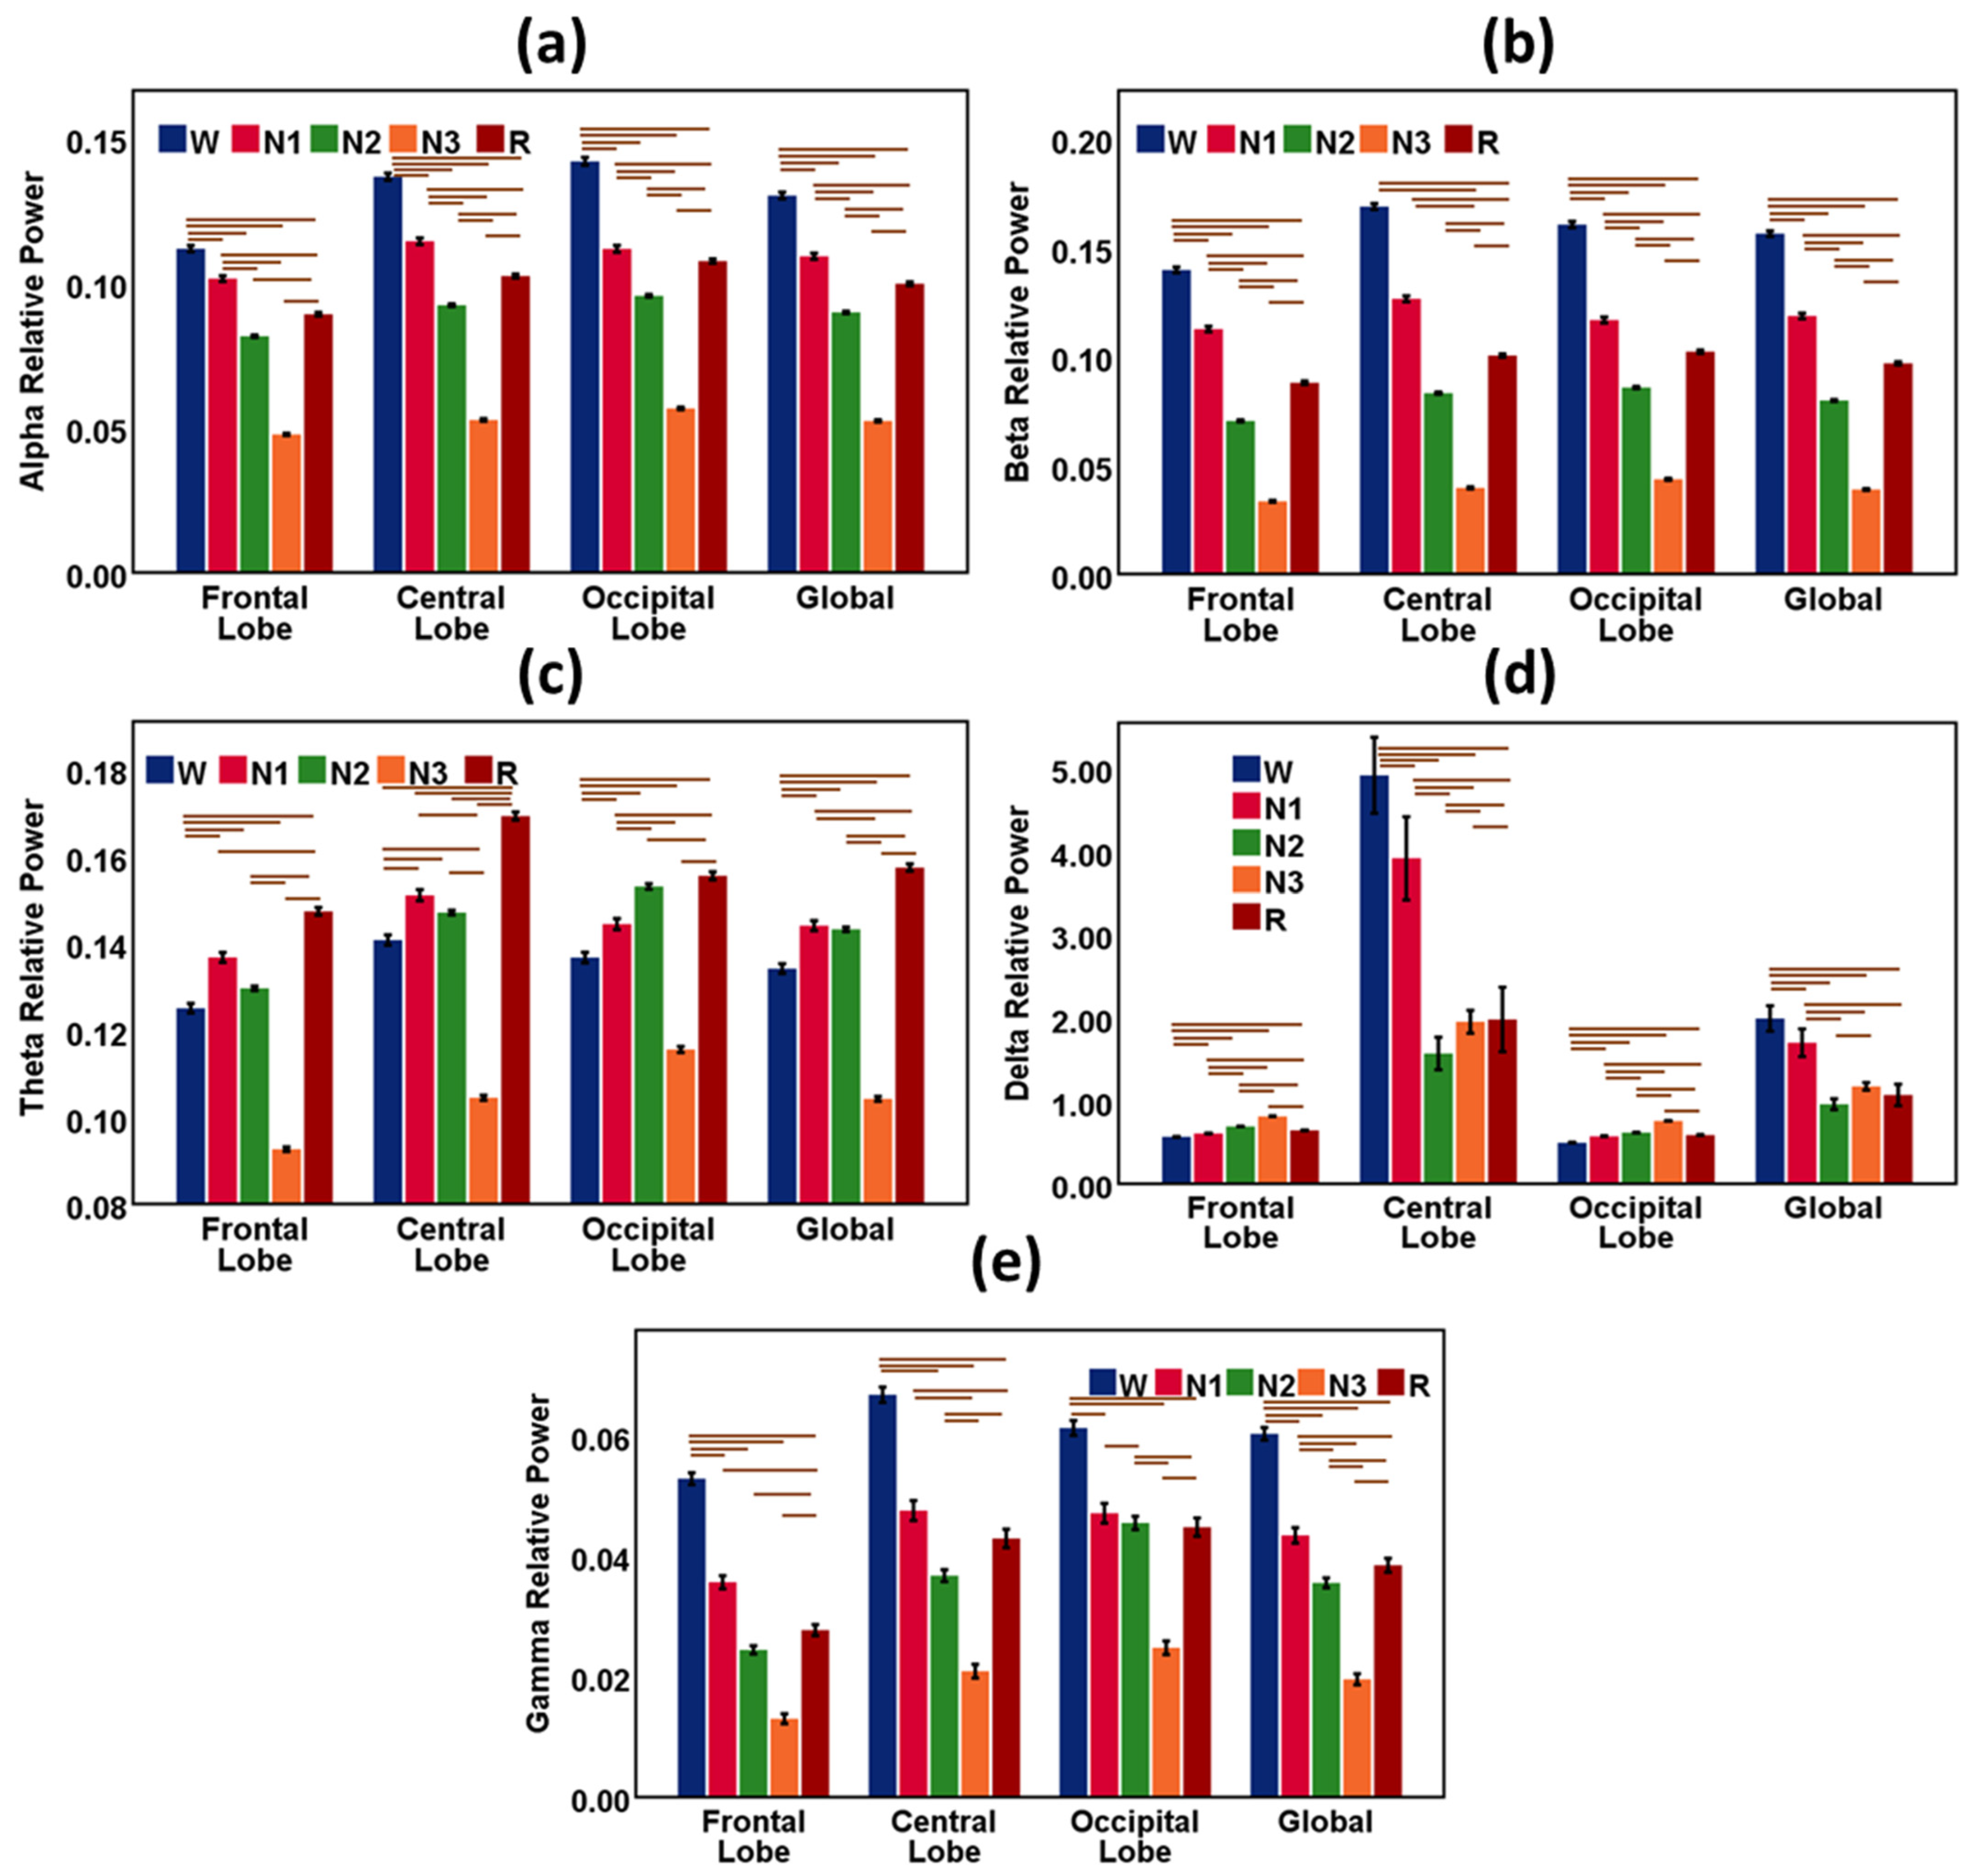
Figure 2.
Results from EEG spectral power features during sleep stages W, N1, N2, N-3, and R. The bar chart describes the relative mean power of the EEG waves, and the vertical error bar (black color) is the 95% CI. (a) Alpha relative power for sleep stages in the frontal lobe, central lobe, occipital lobe, and global. (b) Beta relative power for sleep stages in the frontal lobe, central lobe, occipital lobe, and global. (c) Theta relative power for sleep stages in the frontal lobe, central lobe, occipital lobe, and global. (d) Delta relative power for sleep stages in the frontal lobe, central lobe, occipital lobe, and global. (e) Gamma relative power for sleep stages in the frontal lobe, central lobe, occipital lobe, and global. Global indicates the average measures of features of the frontal, central, and occipital lobes. The horizontal bars (brown color) are the outcomes of the hypothesis tests and indicate significant differences (p < 0.05) in EEG features among the sleep stages.
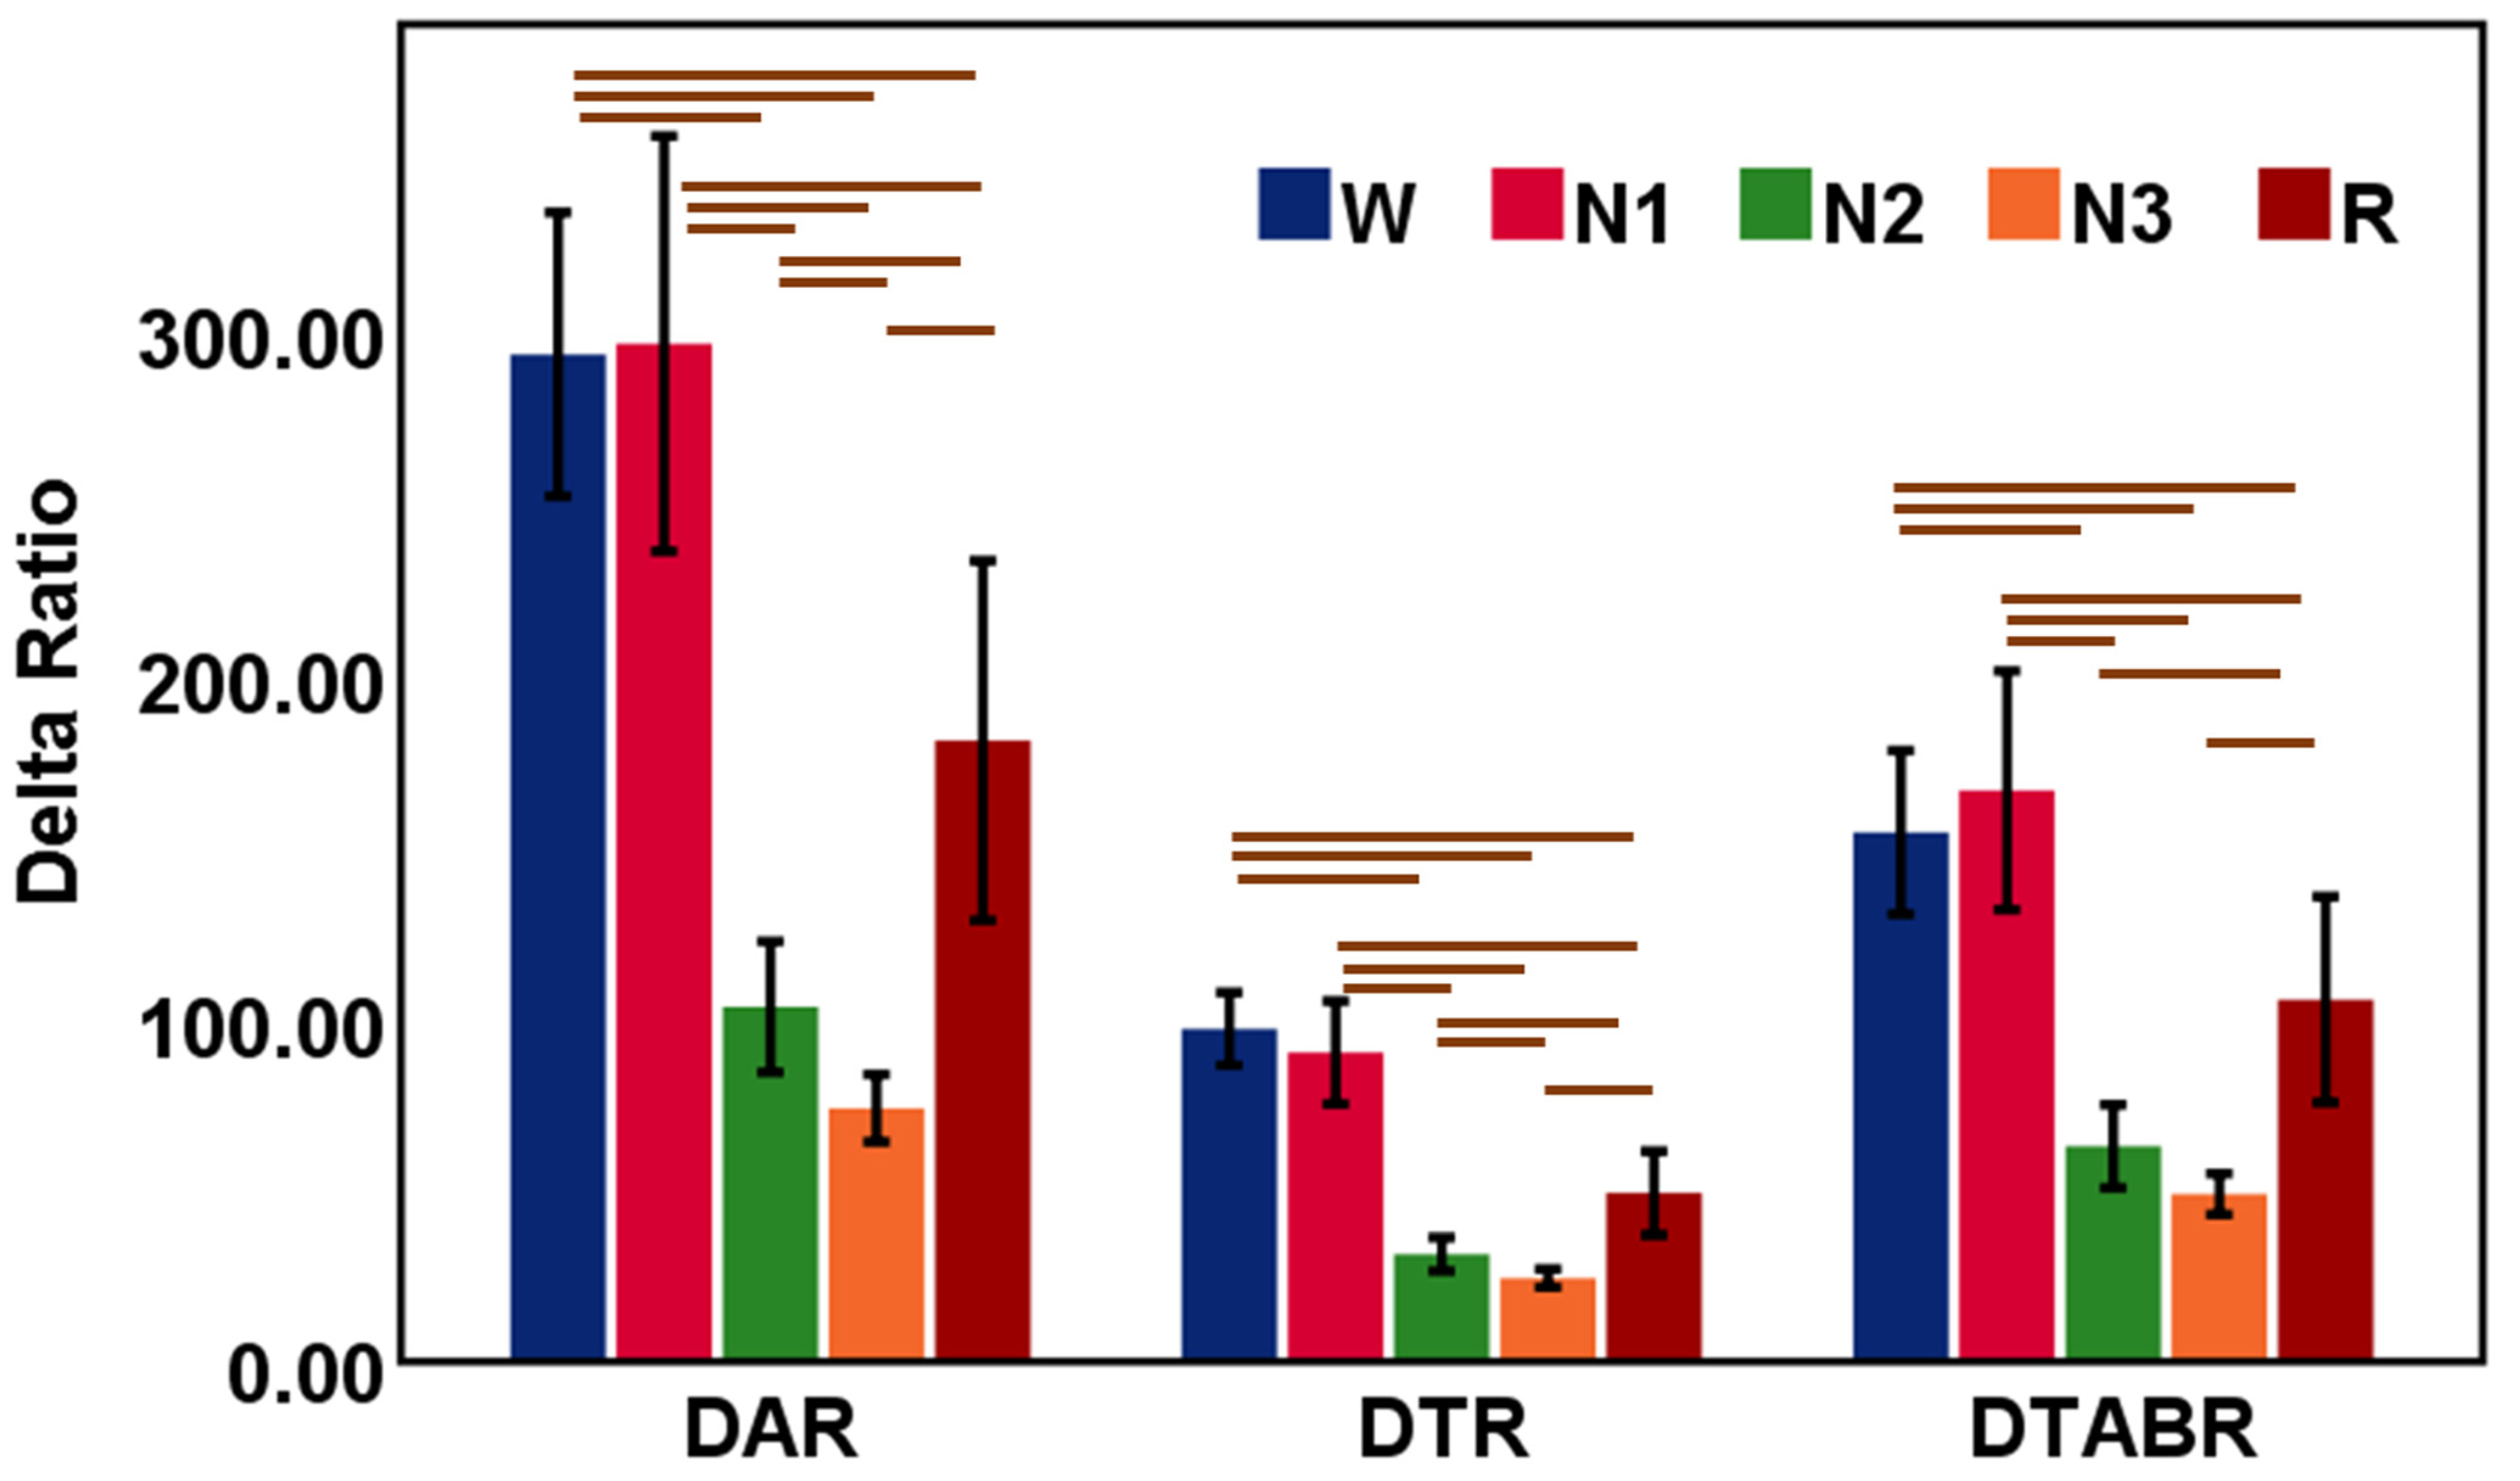
Figure 3.
Results from DAR, DTR, and DTABR during sleep stages W, N1, N2, N-3, and R. The bar chart describes the relative mean power of the EEG waves and the vertical error bar (black color) is the 95% CI. Global indicates the average measures of features of the frontal, central, and occipital lobes. The horizontal bars (brown color) are the outcomes of the hypothesis tests and indicate significant differences (p < 0.05) in EEG features among the sleep stages.
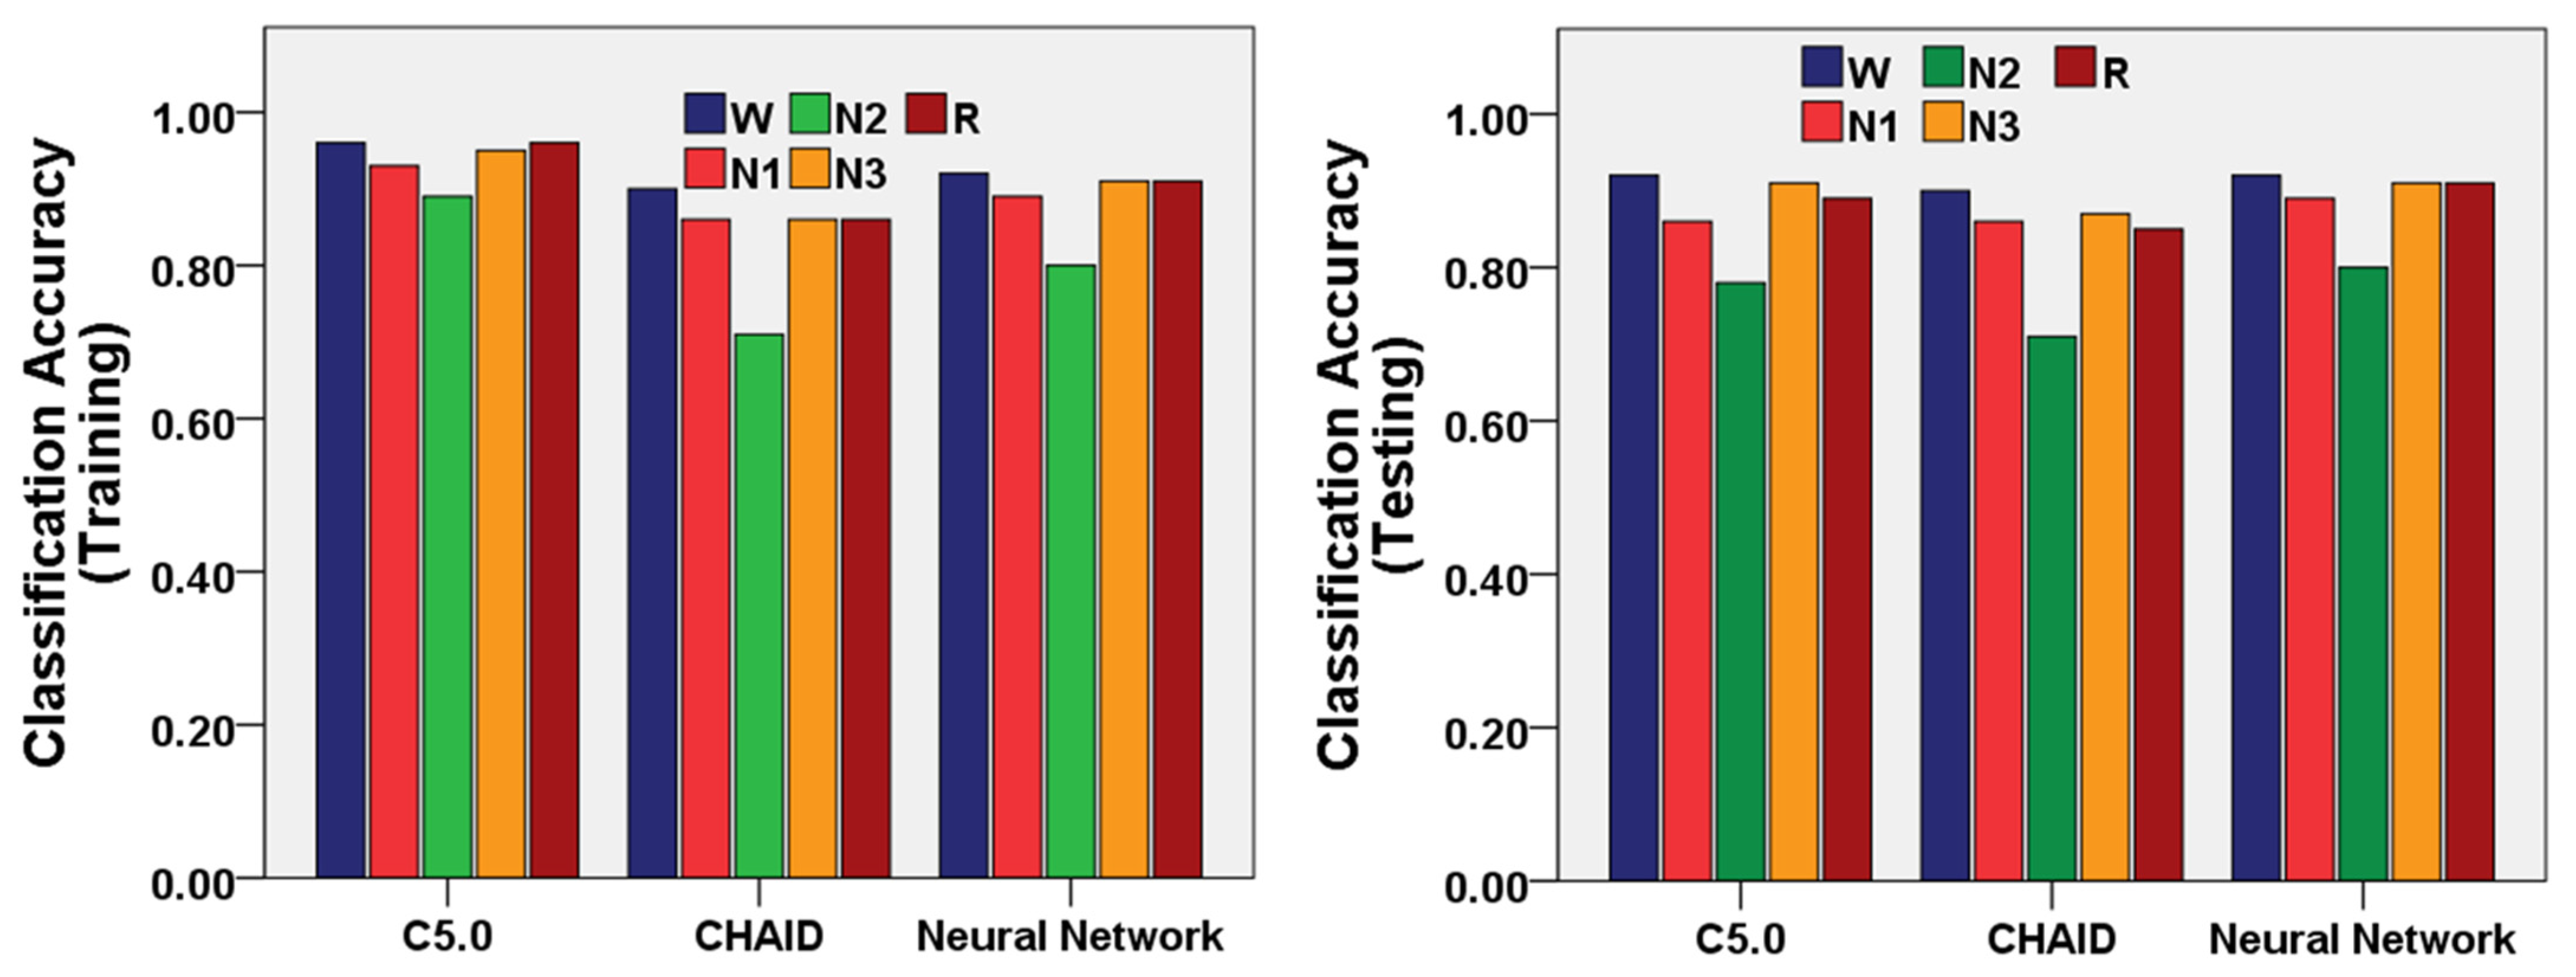
Figure 4.
Performance of the three machine-learning models (C5.0, Neural Network, and CHAID Models) to classify the sleep stages W, N1, N2, N-3, and R using training and testing datasets of EEG features.
Figure 4.
Performance of the three machine-learning models (C5.0, Neural Network, and CHAID Models) to classify the sleep stages W, N1, N2, N-3, and R using training and testing datasets of EEG features.
Table 1.
Features extracted from the EEG signal. The Global channel is averaged over F4, C4, and O2 electrodes.
Table 1.
Features extracted from the EEG signal. The Global channel is averaged over F4, C4, and O2 electrodes.
| EEG Channel | EEG Spectral Waves | EEG Feature | Number of Features |
|---|
| F4, C4, and O2 | δ, θ, α, β, and γ | Mean Power | 15 |
| F4, C4, and O2 | δ, θ, α, β, and γ | Median Frequency | 15 |
| F4, C4, and O2 | δ, θ, α, β, and γ | Mean Frequency | 15 |
| F4, C4, and O2 | δ, θ, α, β, and γ | Spectral Edge | 15 |
| F4, C4, and O2 | δ, θ, α, β, and γ | Peak Frequency | 15 |
| Global | δ, θ, α, β, and γ | Mean Power | 5 |
| F4, C4, and O2 | DAR (δ/α) and DTR (δ/θ) | Mean Power | 6 |
| F4, C4, and O2 | - | Total Mean Power | 3 |
Table 2.
Statistical results (Mean and Standard Deviation) of EEG spectral features (δ, θ, α, β, and γ) in the frontal, central, and occipital lobes during sleep stages W, N1, N2, N-3, and R. Global indicates the average measures of features of the frontal, central, and occipital lobes.
Table 2.
Statistical results (Mean and Standard Deviation) of EEG spectral features (δ, θ, α, β, and γ) in the frontal, central, and occipital lobes during sleep stages W, N1, N2, N-3, and R. Global indicates the average measures of features of the frontal, central, and occipital lobes.
| | EEG
Feature | N1 | N2 | N3 | R | W |
|---|
| Mean | Std. Dev. | Mean | Std. Dev. | Mean | Std. Dev. | Mean | Std. Dev. | Mean | Std. Dev. |
|---|
| Frontal Lobe | Alpha | 0.102 | 0.056 | 0.082 | 0.042 | 0.048 | 0.028 | 0.089 | 0.042 | 0.112 | 0.079 |
| Beta | 0.113 | 0.070 | 0.070 | 0.045 | 0.033 | 0.028 | 0.088 | 0.051 | 0.140 | 0.092 |
| Theta | 0.137 | 0.064 | 0.130 | 0.051 | 0.093 | 0.037 | 0.147 | 0.058 | 0.125 | 0.078 |
| Delta | 0.613 | 0.186 | 0.694 | 0.144 | 0.813 | 0.108 | 0.648 | 0.148 | 0.570 | 0.234 |
| Gamma | 0.036 | 0.061 | 0.024 | 0.070 | 0.013 | 0.061 | 0.028 | 0.060 | 0.053 | 0.071 |
| Central Lobe | Alpha | 0.115 | 0.062 | 0.092 | 0.045 | 0.053 | 0.032 | 0.102 | 0.044 | 0.137 | 0.087 |
| Beta | 0.126 | 0.075 | 0.083 | 0.048 | 0.040 | 0.033 | 0.100 | 0.050 | 0.169 | 0.097 |
| Theta | 0.151 | 0.069 | 0.147 | 0.053 | 0.104 | 0.043 | 0.169 | 0.060 | 0.141 | 0.084 |
| Delta | 3.922 | 27.494 | 1.572 | 19.725 | 1.954 | 10.219 | 1.982 | 25.349 | 4.922 | 32.353 |
| Gamma | 0.048 | 0.092 | 0.037 | 0.101 | 0.021 | 0.085 | 0.043 | 0.101 | 0.067 | 0.092 |
| Occipital Lobe | Alpha | 0.112 | 0.064 | 0.096 | 0.046 | 0.057 | 0.032 | 0.108 | 0.048 | 0.142 | 0.097 |
| Beta | 0.117 | 0.074 | 0.086 | 0.050 | 0.043 | 0.033 | 0.102 | 0.048 | 0.161 | 0.101 |
| Theta | 0.144 | 0.071 | 0.153 | 0.064 | 0.116 | 0.052 | 0.156 | 0.060 | 0.137 | 0.086 |
| Delta | 0.580 | 0.207 | 0.620 | 0.170 | 0.759 | 0.136 | 0.590 | 0.156 | 0.499 | 0.261 |
| Gamma | 0.047 | 0.091 | 0.046 | 0.112 | 0.025 | 0.084 | 0.045 | 0.100 | 0.061 | 0.089 |
| Global | Alpha | 0.109 | 0.058 | 0.090 | 0.041 | 0.052 | 0.028 | 0.100 | 0.041 | 0.130 | 0.084 |
| Beta | 0.119 | 0.070 | 0.080 | 0.045 | 0.039 | 0.029 | 0.097 | 0.046 | 0.156 | 0.090 |
| Theta | 0.144 | 0.064 | 0.143 | 0.050 | 0.104 | 0.040 | 0.157 | 0.054 | 0.134 | 0.079 |
| Delta | 1.701 | 9.200 | 0.960 | 6.591 | 1.175 | 3.422 | 1.071 | 8.468 | 1.994 | 10.825 |
| Gamma | 0.043 | 0.071 | 0.036 | 0.084 | 0.020 | 0.068 | 0.038 | 0.076 | 0.060 | 0.075 |
Table 3.
Statistical results (Mean and Standard Deviation) of EEG Delta features (DAR, DTR, and DTABR) in the Global cortex during sleep stages W, N1, N2, N-3, and R. Global indicates the average measures of features of the frontal, central, and occipital lobes.
Table 3.
Statistical results (Mean and Standard Deviation) of EEG Delta features (DAR, DTR, and DTABR) in the Global cortex during sleep stages W, N1, N2, N-3, and R. Global indicates the average measures of features of the frontal, central, and occipital lobes.
| | EEG
Feature | N1 | N2 | N3 | R | W |
|---|
| Mean | Std. Dev. | Mean | Std. Dev. | Mean | Std. Dev. | Mean | Std. Dev. | Mean | Std. Dev. |
|---|
| Global | DAR | 296.0 | 3326.7 | 103.0 | 1917.7 | 73.6 | 723.5 | 180.5 | 3406.5 | 292.8 | 2914.9 |
| DTR | 89.8 | 824.5 | 31.2 | 486.4 | 24.3 | 195.8 | 48.9 | 790.4 | 96.6 | 748.6 |
| DTABR | 166.0 | 1912.7 | 62.5 | 1219.8 | 48.6 | 440.1 | 105.1 | 1950.1 | 153.8 | 1678.6 |
Table 4.
Confusion matrix of the C5.0 Model using training and testing datasets for the classification of EEG features of the sleep stages W, N1, N2, N-3, and R.
Table 4.
Confusion matrix of the C5.0 Model using training and testing datasets for the classification of EEG features of the sleep stages W, N1, N2, N-3, and R.
| C5.0 | Prediction |
|---|
| N1 | N2 | N3 | REM | Wake | N1 | N2 | N3 | REM | Wake |
|---|
| Actual | N1 | 5760 | 1529 | 78 | 705 | 1451 | 748 | 632 | 42 | 383 | 585 |
| N2 | 837 | 27,581 | 1849 | 842 | 481 | 493 | 5713 | 858 | 548 | 226 |
| N3 | 88 | 2262 | 14,656 | 66 | 63 | 38 | 976 | 3083 | 38 | 20 |
| REM | 665 | 1110 | 103 | 11,046 | 233 | 400 | 676 | 55 | 2060 | 117 |
| Wake | 622 | 443 | 37 | 152 | 14,192 | 391 | 237 | 25 | 86 | 3170 |
Table 5.
Confusion matrix of the Neural Network Model using training and testing datasets for the classification of EEG features of the sleep stages W, N1, N2, N-3, and R.
Table 5.
Confusion matrix of the Neural Network Model using training and testing datasets for the classification of EEG features of the sleep stages W, N1, N2, N-3, and R.
| Neural Network | Prediction |
|---|
| N1 | N2 | N3 | REM | Wake | N1 | N2 | N3 | REM | Wake |
|---|
| Actual | N1 | 2197 | 2634 | 88 | 1948 | 2656 | 550 | 666 | 29 | 470 | 675 |
| N2 | 845 | 24,746 | 3078 | 1883 | 1038 | 196 | 6149 | 753 | 483 | 257 |
| N3 | 22 | 4250 | 12,647 | 42 | 174 | 7 | 1039 | 3066 | 13 | 30 |
| REM | 699 | 2504 | 86 | 9331 | 537 | 176 | 624 | 21 | 2372 | 115 |
| Wake | 980 | 796 | 68 | 318 | 13,284 | 243 | 212 | 23 | 78 | 3353 |
Table 6.
Confusion matrix of the CHAID Model using training and testing datasets for the classification of EEG features of the sleep stages W, N1, N2, N-3, and R.
Table 6.
Confusion matrix of the CHAID Model using training and testing datasets for the classification of EEG features of the sleep stages W, N1, N2, N-3, and R.
| CHAID | Prediction |
|---|
| N1 | N2 | N3 | REM | Wake | N1 | N2 | N3 | REM | Wake |
|---|
| Actual | N1 | 2109 | 2946 | 270 | 1817 | 2381 | 541 | 741 | 54 | 451 | 603 |
| N2 | 1392 | 21,380 | 4679 | 3175 | 964 | 338 | 5305 | 1121 | 834 | 240 |
| N3 | 80 | 5835 | 10,913 | 147 | 160 | 16 | 1418 | 2659 | 31 | 31 |
| REM | 1366 | 4547 | 422 | 6210 | 612 | 354 | 1152 | 103 | 1560 | 139 |
| Wake | 1970 | 1697 | 199 | 479 | 11,101 | 535 | 407 | 66 | 124 | 2777 |
Table 7.
Classification Performance parameters of the C5.0 Model using training and testing datasets for the classification of EEG features of the sleep stages W, N1, N2, N-3, and R.
Table 7.
Classification Performance parameters of the C5.0 Model using training and testing datasets for the classification of EEG features of the sleep stages W, N1, N2, N-3, and R.
| C5.0 | Training (Average Accuracy = 94%) | Testing (Average Accuracy = 87%) |
|---|
| Accuracy | Sensitivity | Specificity | Precision | Negative Predictive Value | Accuracy | Sensitivity | Specificity | Precision | Negative Predictive Value |
|---|
| N1 | 0.93 | 0.60 | 0.971 | 0.72 | 0.95 | 0.86 | 0.31 | 0.931 | 0.36 | 0.92 |
| N2 | 0.89 | 0.87 | 0.903 | 0.84 | 0.93 | 0.78 | 0.73 | 0.817 | 0.69 | 0.84 |
| N3 | 0.95 | 0.86 | 0.970 | 0.88 | 0.96 | 0.91 | 0.74 | 0.944 | 0.76 | 0.94 |
| R | 0.96 | 0.84 | 0.976 | 0.86 | 0.97 | 0.89 | 0.62 | 0.942 | 0.66 | 0.93 |
| W | 0.96 | 0.92 | 0.969 | 0.86 | 0.98 | 0.92 | 0.81 | 0.946 | 0.77 | 0.96 |
Table 8.
Confusion matrix of the Neural Network Model using training and testing datasets for the classification of EEG features of the sleep stages W, N1, N2, N-3, and R.
Table 8.
Confusion matrix of the Neural Network Model using training and testing datasets for the classification of EEG features of the sleep stages W, N1, N2, N-3, and R.
| Neural Network | Training (Average Accuracy = 89%) | Testing (Average Accuracy = 89%) |
|---|
| Accuracy | Sensitivity | Specificity | Precision | Negative Predictive Value | Accuracy | Sensitivity | Specificity | Precision | Negative Predictive Value |
|---|
| N1 | 0.89 | 0.23 | 0.97 | 0.46 | 0.91 | 0.89 | 0.23 | 0.97 | 0.47 | 0.91 |
| N2 | 0.80 | 0.78 | 0.82 | 0.71 | 0.87 | 0.80 | 0.78 | 0.82 | 0.71 | 0.87 |
| N3 | 0.91 | 0.74 | 0.95 | 0.79 | 0.94 | 0.91 | 0.74 | 0.95 | 0.79 | 0.94 |
| R | 0.91 | 0.71 | 0.94 | 0.69 | 0.95 | 0.91 | 0.72 | 0.94 | 0.69 | 0.95 |
| W | 0.92 | 0.86 | 0.94 | 0.75 | 0.97 | 0.92 | 0.86 | 0.94 | 0.76 | 0.97 |
Table 9.
Confusion matrix of the CHAID Model using training and testing datasets for the classification of EEG features of the sleep stages W, N1, N2, N-3, and R.
Table 9.
Confusion matrix of the CHAID Model using training and testing datasets for the classification of EEG features of the sleep stages W, N1, N2, N-3, and R.
| CHAID | Training (Average Accuracy = 84%) | Testing (Average Accuracy = 84%) |
|---|
| Accuracy | Sensitivity | Specificity | Precision | Negative Predictive Value | Accuracy | Sensitivity | Specificity | Precision | Negative Predictive Value |
|---|
| N1 | 0.86 | 0.22 | 0.94 | 0.30 | 0.91 | 0.86 | 0.23 | 0.94 | 0.30 | 0.91 |
| N2 | 0.71 | 0.68 | 0.73 | 0.59 | 0.80 | 0.71 | 0.68 | 0.73 | 0.59 | 0.80 |
| N3 | 0.86 | 0.64 | 0.92 | 0.66 | 0.91 | 0.87 | 0.64 | 0.92 | 0.66 | 0.91 |
| R | 0.86 | 0.47 | 0.92 | 0.53 | 0.91 | 0.85 | 0.47 | 0.92 | 0.52 | 0.91 |
| W | 0.90 | 0.72 | 0.94 | 0.73 | 0.94 | 0.90 | 0.71 | 0.94 | 0.73 | 0.94 |
Table 10.
Comparative analysis of the methods and outcomes of the proposed work with other sleep studies.
Table 10.
Comparative analysis of the methods and outcomes of the proposed work with other sleep studies.
| Study | Year | Study Subject | Dataset (Year)/Signal | Class | Algorithm | Accuracy % |
|---|
| Tzimourta et al. [40] | 2018 | 100 subjects | ISRUC-Sleep dataset (2009–2013)/EEG | Five-class {W, N1, N2, N3, and REM} | Random Forest | 75.29 |
| Kalbkhani et al. [41] | 2018 | 100 subjects | ISRUC-Sleep dataset (2009–2013)/EEG | Five-class {W, N1, N2, N3, and REM} | SVM | 82.33 |
| Tripathi et al. [42] | 2020 | 25 subjects | Cyclic Alternating Pattern (CAP) (2001)/EEG | Six-class {W, S1, S2, S3, S4, and REM} | Hybrid Classifier | 71.68 |
| Widasari et al. [43] | 2020 | 51 subjects | Cyclic Alternating Pattern (CAP) (2001)/EEG | Four-class {W, Light sleep (S1 + S2), Deep sleep (S3 + S4), and REM} | Ensemble of bagged tree (EBT) | 86.26 |
| Wang et al. [44] | 2020 | 157 subjects | Sleep-EDF Expanded (Sleep-EDFX) (2000)/EEG and EOG | Five-class {W, N1, N2, N3, and REM} | Ensembles of EEGNet-BiLSTM | 82 |
| Sharma et al. [45] | 2021 | 80 subjects | Cyclic Alternating Pattern (CAP) (2001)/EEG | Six-class {W, S1, S2, S3, S4, and REM} | Ensemble of Bagged Tree (EBT) | 85.3 |
| Proposed work | 2022 | 157 subjects | HMC-Haaglanden Medisch Centrum (2021)/EEG | Five-class {W, N1, N2, N3, and REM} | C5.0, Neural Network, and CHAID | C5.0 (91%), Neural Network (92%), and CHAID (84%) |


 ,
, 


