Article

Surface Recombination and Space-Charge-Limited Photocurrent-Voltage (PC-V) Measurements in (Cd,Mn)Te Samples–Kinetics of Photocurrent (PC)

by
Andrzej Mycielski
1,*,
Dominika M. Kochanowska
1,
Aneta Wardak
1,
Krzysztof Gościński
1,
Michał Szot
1,2,
Witold Dobrowolski
1,
Gabriela Janusz
1,
Małgorzata Górska
1,
Łukasz Janiak
3,
Wiesław Czarnacki
3,
Łukasz Świderski
3,
Joanna Iwanowska-Hanke
3 and
Marek Moszyński
3
1
Institute of Physics, Polish Academy of Sciences, Aleja Lotników 32/46, 02-668 Warsaw, Poland
2
International Research Centre MagTop, Institute of Physics, Polish Academy of Sciences, Aleja Lotników 32/46, 02-668 Warsaw, Poland
3
National Centre for Nuclear Research, Andrzeja Sołtana 7, 05-400 Otwock, Poland
*
Author to whom correspondence should be addressed.
Sensors 2022, 22(8), 2941; https://doi.org/10.3390/s22082941
Submission received: 16 February 2022 / Revised: 8 April 2022 / Accepted: 9 April 2022 / Published: 12 April 2022
(This article belongs to the Section Optical Sensors)

Abstract

:
Photocurrent-voltage characteristic (PC-V) is a method of determining the critical parameter in X-ray and gamma-ray detector plates, i.e., the carrier mobility-lifetime product, μτ. We show for the (Cd,Mn)Te samples that the measurement results depend strongly on the surface treatment and the space charge distribution. The PC-V characteristics obtained for ħω > Eg and ħω ~ Eg indicated that etching with 20% HCl caused an appearance of a significant concentration of very shallow surface traps at the (Cd,Mn)Te sample surface. These traps seriously changed the results of measurements of PC-V characteristics and PC kinetics. We also noticed a small contribution of holes to photoconductivity in the PC kinetics. The measurements of PC-V characteristics for ħω > Eg may test the detector plate surface quality.

1. Introduction

(Cd,Mn)Te is a wide bandgap semiconducting compound. We want to make it competitive with commonly used CdTe and (Cd,Zn)Te compounds for X-ray and gamma-ray detectors. The attained values of the resistivity, ρ~1010 Ω cm, and the μτ product, μτ > 10−3 cm2V−1, make us hope for the commercial use of the material. A review of (Cd,Mn)Te studies as material for those detectors may be found in Reference [1]. One of the critical parameters is the μeτe product, where μe is the carrier mobility (here electrons) and τe is the carrier lifetime (here also electrons). It is not easy to attain a large μeτe parameter (>5 × 10⁻³ cm2V−1), uniform in the whole volume of the sample with an area of 20 × 20 mm2 or more. Usually, the μeτe parameter is determined by illuminating the sample with alpha particles or gamma rays and investigating the charge collection efficiency (CCE). CCE is defined as the fraction of injected charges that is collected in the external circuit. For alpha particles with energy of 5.5 MeV, the penetration depth is about 20 µm. Concerning the typical sample thickness (~2000–3000 µm), it is like a surface effect. The penetration is much deeper for the gamma radiation (Am-241 59.5 keV). The incident gamma radiation with energy of 60 keV is absorbed in 90% at a distance of about 600 µm; it is ~20% of the sample thickness. The CCE value may be obtained by fitting the experimental PC-V data with the Hecht–Many function [2,3], where the fitting parameters are μeτe and the surface recombination velocity, se.
The Hecht–Many model assumes no space charge in the sample in stationary conditions. Therefore, the internal electric field is uniform: E = VL−1, where E is the field, V is the applied voltage, and L is the sample thickness. The model also assumes that the parameters µe and τe are uniform in the sample volume. This means that μeμe(a) and τeτe(a), where a is distance from the illuminated cathode to the anode. Next, in this model an electric charge is generated just below the sample surface at a distance δ much smaller than the sample thickness, L. For (Cd,Zn)Te, Cui et al. [4,5] have shown that the μeτe product may be determined by measuring the photocurrent as a function of the applied voltage (PC-V). The energy of the light used for the electron injection was either higher or smaller than the energy gap, Eg. The experiments indicated that the results strongly depended on the surface conditions and the surface processing methods. The authors recall similar observations of the impact of surface conditions on the carrier transport measurements in HgI2 [6,7,8].
The aim of our study was to perform comparable measurements for (Cd,Mn)Te by using the PC-V technique and different methods of sample surface preparation. Similar experimental and theoretical studies were performed for (Cd,Zn)Te [9,10,11,12,13]. Shen et al. [14] showed interesting results of processing the (Cd,Mn)Te surfaces. The main conclusion of that study was that the final etching with 5% HCl created the smoothest surface with the average value of the surface roughness, Ra, 0.84 nm. We decided to test Shen’s method. We etched the polished surfaces of the (Cd,Mn)Te samples with HCl, changing the concentration of the solution.
In the next sections, we present results of measurements of the PC-V characteristics. The results obtained by using LED light were compared with the measurements performed by using the gamma rays (Am-241 59.5 keV). We show that the results of the PC-V investigation are significantly different for different methods of the sample surface preparation. Finally, we present the PC-V characteristics for the excitation by the light with the energy above Eg and slightly below Eg.

2. Materials and Methods

The crystals of Cd0.95Mn0.05Te:In ([In] ≈ 1 × 1017 cm−3) were prepared by the low-pressure Bridgman (LPB) method in the vertical configuration. The diameters of the crystals were 2 or 3 inches and the weight 500 g and 1500 g, respectively. Usually a few twins which pass from the bottom to the top of the crystal are visible (see, e.g., Figure 22 in Reference [1]). Single-crystal blocks allowed us to obtain monocrystalline plates with dimensions of 20 × 20 mm2, 30 × 30 mm2, or more. The concentration of Te inclusions is ≤5 × 103 cm−3. To obtain semi-insulating materials with ρ~1010 Ω cm, the crystals were doped with indium. To obtain deep donors TeCd2+ [15,16], tellurium was added in proportion 50–100 mg Te per 100 g of material. The crystallization speed was 0.5–1.0 mmh−1. Before cutting, the crystals were etched with the Durose etchant [17,18] to reveal twins and grain boundaries. Durose etchant reveals the polarity of the CdTe plate cut along the (111) plane, i.e., the twin plane. Then, the Cd-face is (111)-oriented and is named A-face, and the Te-face is ( 1 ¯ 1 ¯ 1 ¯ ) -oriented and is named B-face. The etched Cd-face is matt black and the Te-face is shiny. The (Cd,Mn)Te crystal usually consists of a few, differently oriented monocrystalline blocks and a few twins. Basing on the shade of gray of differently oriented grains in the (Cd,Mn)Te crystal, one can clearly determine the position of grain boundaries and twin planes. Then, the samples were cut parallel to the twin planes (111). The samples were initially ground and etched with Durose etchant to determine the planes A (cadmium) and B (tellurium). After that, the samples were mechanically ground by using a water suspension of 4.5 μm SiC powder, and mechano-chemically polished in 2% bromine-methanol solution. The mechano-chemical polishing of the samples was followed by etching with HCl acid.
Min Shen et al. [14] described interesting methods of preparing surfaces of (Cd,Mn)Te samples for depositing contacts. The results inspired us to use HCl in the procedure of the sample surface preparation. The last stage of the authors’ method is chemical polishing (CP) with 5% HCl. We prepared three sets of samples, the surfaces (A and B) of which were treated with differently concentrated HCl, namely: 10%, 15%, or 20% for 10–20 s. In the next sections we will show that these three sets of samples can be divided into two groups depending on the observed surface effects. The first group of samples was etched with 10% or 15% HCl. We do not observe any effects related to the generation of surface traps for this group. The second set of samples was etched with 20% HCl. The density of generated surface traps is significant for this group.
Onto both types of surfaces, A and B, thin contact layers with thicknesses ~30 nm were deposited by using the sputtering method. For this purpose, we used two types of metal alloys: Au/Pd or Pt/Pd, where the proportion of Au or Pt to Pd was 80:20. Palladium added to Au or Pt target increases adhesion. The monocrystalline samples had dimensions of 10 × 10 mm2 or 20 × 20 mm2 and thicknesses roughly of 1–3 mm. In the center of the sample surface the metal contact layers (anode and cathode) had diameters φ = 5 mm for samples with dimensions 10 × 10 mm2 and φ = 8 mm for samples with dimensions 20 × 20 mm2. On the surfaces close to the sample edges, rings, whose role was to insulate the current between the anode and the cathode from the leakage current on the sidewalls of the sample, were deposited by sputtering. For PC-V measurements, the light sources were light-emitting diodes (LEDs), and the light passed through interference filters (IF) to reduce the width of a spectral range of the exciting radiation. The Full Width at Half Maxima (FWHM) of the IF will be shown in Section 3.1. The central part of the cathode was illuminated through an aperture with d = 3 mm for samples with dimensions 10 × 10 mm2 and d = 5 mm for samples with dimensions 20 × 20 mm2. The incident light power in μW, converted to eV/s and divided by the photon energy, enabled us to determine the number of incident photons.
Each photon, reaching the sample surface through the metal contact, especially with the energy ħω > Eg, creates an electron-hole pair. We believe that for thin (approximately 30 nm) metal contacts, the loss of light intensity is mainly due to reflection. We estimate that at least 30% photon flux reaches the sample. The energy gap, Eg, of Cd0.95Mn0.05Te crystals is 1.575 eV at room temperature. For ħω greater than Eg (e.g., Eg + 30 meV) the absorption coefficient in our samples is about 2 × 104 cm−1 [19,20]. The radiation is absorbed at a distance from the surface smaller than 1 µm. Holes quickly return to the cathode and electrons conduct the electric current.
So, the current measured in the PC-V characteristic is an electron current. The PC-V characteristics were measured at a constant illumination of the middle part of the cathode by increasing the bias voltage. Kinetics of photocurrent was measured at a selected constant bias voltage by applying a nearly rectangular light pulse (pulse rise time ~0.5 ms). As will be shown in Section 3.2, the increase and stabilization of the PC signal after sample illumination, and the extinction of the PC signal after turning off the light source last longer than 1 s. Therefore, we did not use a chopper in the experiments of photocurrent kinetics. We excited the samples with photon energies ħω ~ Eg and ħω > Eg, i.e., ħω = Eg + x, where x changed from 15 meV to 76 meV and Eg = 1.575 eV.
The experiments of PC-V characteristics with the use of LEDs and photocurrent kinetics were performed with the use of the following equipment:
  • The PC-V measurements were carried out by using the samples with rings. The grounded cathode was illuminated by LED. The cathode and ring on the cathode side were biased with the same negative voltage, and the anode and the ring on the anode side were biased with the same positive voltage. Two Keithley 6517B Electrometers were used to apply the bias voltage and to measure the current between cathode and anode and the current between rings on the cathode and anode sides.
  • Illuminating Thorlabs LEDs were powered by the Keithley 6220 Precision Current Source. We used six types of LEDs, the maximum light intensities of which are at energies: 1.434 eV, 1.507 eV, 1.556 eV, 1.590 eV, 1.602 eV and 1.656 eV. The FWHM of the LED emitted spectra is approximately 58 meV. The interference filters we used are characterized by maximum transmissions at 1.461 eV, 1.509 eV, 1.556 eV, 1.608 eV and 1.651 eV. The FWHM of IF are from 16 to 23 meV. In our measurements in the energy range Eg − 15 meV > ħω > Eg + 15 meV a small value of IF FWHM is negligible but in measurements at ħω ~ Eg the IF FWHM may be misleading due to a sharp change of the absorption coefficient in this spectral range.
  • The LED light passing through IF was uncovered and covered by the Thorlabs SC10 Shutter Controller. The shutter open and close time was about 0.5 ms. Radiation power was measured by the Thorlabs PM100D Optical Power Meter.
  • PC kinetics was registered by the Tektronix MSO 54 Oscilloscope by using the pre-amplifier from the Keithley 6517B Electrometer.
  • The PC-V characteristics were measured at room temperature 294 K (21 °C) and at a higher temperature of 306 K (33 °C) by using a slightly heated sample holder.
We also made measurements as follows:
  • The room-temperature current-voltage (I-V) characteristic was measured at a voltage up to ±700 V by using the Keithley 6517B voltage source.
  • The resistivity map was obtained by a contactless method, i.e., the Time-Dependent Charge Measurement (TDCM) method [21], with the use of the EU-ρ-μτ-SCAN apparatus. In the TDCM method the sample is placed into a capacitor as a lossy dielectric substance and the resistivity is evaluated by measuring a time-dependent charge transient observed after application of a voltage step. The measurement is non-contacting, i.e., it avoids the problems connected with the fabrication of ohmic contacts [22].
  • Measurement of the absorption coefficient (absorption edge) was performed at room temperature on a 100 µm thick sample by using the Fluorolog 3 spectrometer equipped with a photomultiplier as a detector.
  • The measurements of the gamma-ray response current were made by using the Am-241 gamma source, the activity of which was 925 MBq (single-encapsulated stainless steel source). A small lead collimator with a hole diameter of 3 mm and a length of 3 cm was used. The current flowing through the sample under X-ray irradiation was measured with a digital multimeter Keysight 2901A.
  • Alpha particle energy spectra for (Cd,Mn)Te samples were examined with a spectrometric system. This system consisted of a charge preamplifier, a spectrometric amplifier and a multichannel analyzer. Alpha particle energy was 5.5 MeV.
  • The measurement of the X-ray spectrum centroid as a function of the applied voltage was made by using the Spectroscopic Pixel Mapping apparatus by Eurorad. The activity of the Co-57 source used by us was 398 kBq. The sample was polarized by a negative high voltage. The spectrum was performed via a multichannel analyzer, which was connected to the amplifier.
  • In the experiments with the use of alpha particles and X- and gamma rays, the application of rings was eliminated. The incident particles or radiation passed through a collimator and reached the sample from the cathode side.

3. Results and Discussion

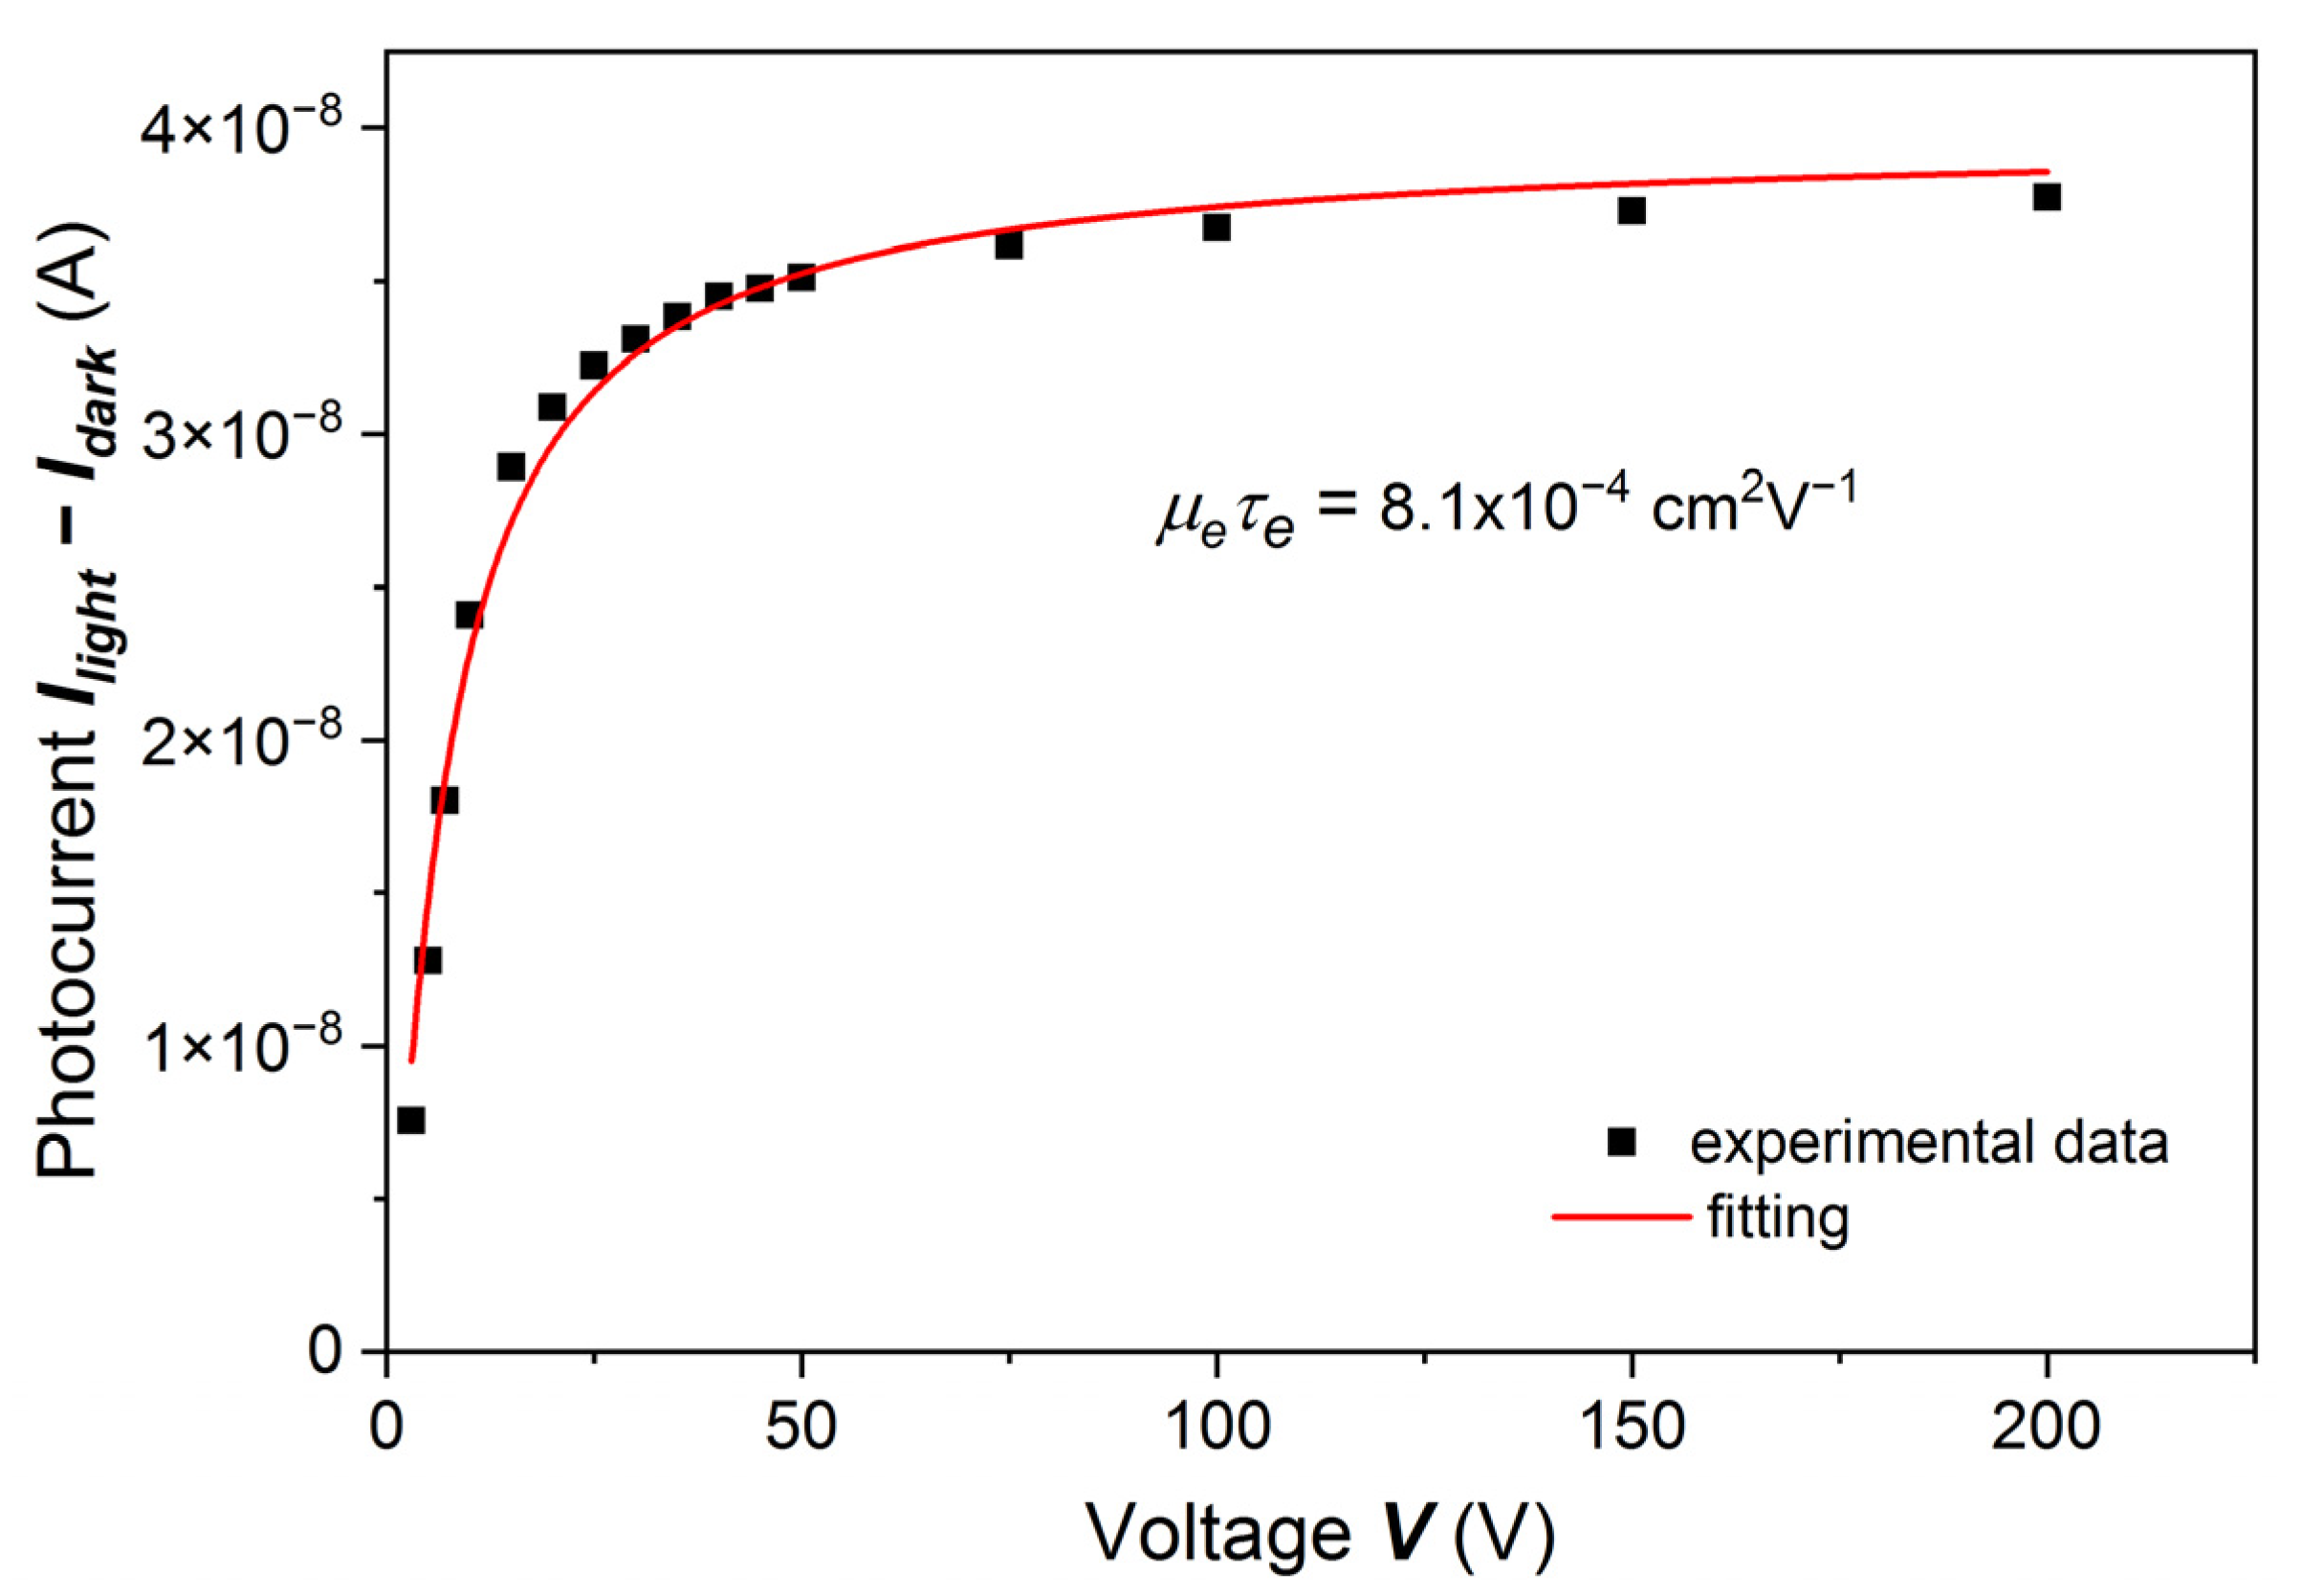
3.1. Photocurrent-Voltage Characteristic

In the first set of Cd0.95Mn0.05Te:In samples, the sample surfaces were etched with 10% or 15% HCl. The PC-V characteristic of one of the samples is shown in Figure 1. We assume that μeμe(a), τeτe(a) and δL, as was mentioned in Section 1. The experimental points were fitted with the Hecht formula:
I = I 0 μ e τ e E L   [ 1 exp ( L μ e τ e E ) ] ,  
where I0 is the saturation photocurrent, μe is the electron mobility, τe is the electron lifetime, E is the electric field intensity, and L is the sample thickness. The fitting parameters were µeτe and I0. The agreement of the model with the experimental data was checked by R-squared test. The µeτe value obtained from the fit was about 8.1 × 10⁻⁴ cm2V−1, and I0 = 3.9 × 10⁻⁸ A. The energy of the illuminating LED light was slightly above the energy gap, ħω = 1.590 eV (Eg + 15 meV). The absorption coefficient for this light energy is α > 104 cm−1, so the light is absorbed at a distance from the sample surface smaller than 1 µm.
For the same sample, the results of which are shown in Figure 1, we measured the gamma-ray-induced current by using 59.5 keV gamma rays from an Am-241 source. The Hecht formula may be applied when the charge carriers are generated just below the surface. However, we were curious about whether we would get a fundamentally different result by excitation with X-rays from the Am-241 source. The results fitted with the Hecht formula are shown in Figure 2. The fitted curve has the same shape as the curve obtained from the PC-V measurement, and the fitting parameters are µeτe = 7.6 × 10⁻⁴ cm2V–1, I0 = 0.49 × 10⁻⁹ A.
Moreover, we measured the CCE of this (Cd,Mn)Te sample by using alpha particles. The µeτe value obtained from the Hecht equation (Equation (1)) for alpha particles is µeτe = 3.1 × 10⁻⁴ cm2V–1 with a standard error of 0.15 × 10⁻⁴ cm2V–1. In the experiment with the use of alpha particles the background noise was quite high. Nevertheless, we were able to register the X-ray spectrum centroid as a function of the applied voltage.
In References [4,5], the authors observed a considerable difference in the PC-V characteristics measured on A and B surfaces of the investigated samples. We also measured PC-V characteristics of both surfaces of our samples. The results are shown in Figure 3. Results for both surfaces were fitted with the Hecht formula, and the fitting parameters were slightly different. For the A surface we obtained µeτe = 5.85 × 10⁻⁴ cm2V−1, I0 = 6.9 × 10⁻⁷ A, and for B µeτe = 4.62 × 10⁻⁴ cm2V−1, I0 = 7.1 × 10⁻⁷ A.
Comparing the results shown in Figure 1, Figure 2 and Figure 3, we concluded that for the first group of samples, i.e., when the sample surfaces were treated by less concentrated HCl, namely 10% or 15%, the results of both experiments, i.e., photocurrent measurements with the use of LED and Am-241 radiation sources, can be well described by the Hecht formula. Below we will discuss certain shortcomings of this method.
Before the PC-V characteristics, resistivity maps of all investigated samples were obtained. A typical result is shown in Figure 4. Let us pay attention to the upper left corner of the map, the sample border (and the crystal border). We see that the leakage side current may influence the measurement result up to about 3 mm from the side. Therefore, in measurements of PC-V and I-V we used rings close to the sample sides.
Semi-insulating samples, chosen for measurements of PC-V characteristics and PC kinetics, had resistivities with average values from 5 × 10⁹ Ω cm to 2 × 10¹⁰ Ω cm.
As was mentioned in Section 2, the samples were cut out of the crystals parallel to the (111) plane. Metal contact layers, deposited onto polished and etched surfaces, had thicknesses ~30 nm. In the I-V measurements, we noticed that when the anode (+) was on the A (cadmium) side, the current had a lower value than when the current was applied in the opposite direction, especially for the high voltage. This is due to the non-ohmic contacts. A typical I-V characteristic is shown in Figure 5. The right side of the plot shows the case when the anode is on the A (cadmium) side. This effect was checked on many samples with surfaces prepared by different methods. Experimentalists may pay attention to that.
PC-V characteristics measured for the second group of samples treated with 20% HCl are shown in Figure 6. Let us look at the first part of the PC-V curve in the range 1–75 V. It is not concave, like in the Hecht or Hecht–Many exponential formula, but slightly convex. The sample was illuminated by photons with energies of 1.590 eV, slightly above the Eg (Eg = 1.575 eV). This result caused us to start a series of investigations on (Cd,Mn)Te samples with surfaces prepared by etching with 20% HCl. We performed experiments with the use of interference filters, in the energy range ħω > Eg and ħω ~ Eg, and for different light intensities. These results will be shown below.
In Figure 7 we show the tail of the absorption edge for one of the Cd0.95Mn0.05Te:In samples. For absorption measurement we used a sample prepared by mechano-chemical polishing with 2% bromine-methanol solution. The sample thickness was L = 100 μm and the reflection R = 0.18 (18%). In Figure 7 there are also marked energies, wavelengths and the bandwidths of the light passing through the interference filters. For example, for the interference filter 797 nm (1.556 eV), for which the absorption coefficient is α ~ 200 cm−1, about 90% of the radiation is absorbed at a distance of ~100 µm.
To interpret the surprising results for the sample etched with 20% HCl, shown in Figure 6, we measured the PC-V characteristics by using the photon energy ħω = 1.651 eV (Eg + 76 meV), for which the absorption coefficient α ~ 2 × 104 cm−1 [19]. By exciting the sample with photons with such energy, one generates charge carriers at a distance smaller than 1 µm from the sample surface. In Figure 8 current density, J, is shown as a function of voltage, V. It was measured at the mean photon flux F = 8.49 × 1012 cm−2s−1. With increasing voltage, the current density increases at first as a power function, then reaches saturation and does not change up to the highest applied voltage. The experimental results shown in Figure 8 could not be fitted with the Hecht formula, and even less with the Hecht–Many formula:
I = I 0 1 + s e μ e   E   μ e τ e E L   [ 1 exp ( L μ e τ e E ) ] ,
where se is the surface recombination velocity.
We measured the PC-V characteristics at different photon fluxes for the same sample, the results of which are shown in Figure 6 and Figure 8. The results of calculated current densities as a function of voltage are shown in Figure 9. Solid lines in Figure 9 are fitted to the Ridzonova et al. model [13]. The fitting parameters are listed in Table 1. For the lowest photon flux, F = 1.39 × 1012 cm−2s−1, the photocurrent saturation is reached at 150 V. For the highest photon flux, F = 2.36 × 1013 cm−2s−1, the saturation is reached at 450 V.
To interpret the results shown in Figure 9, we followed the model proposed by Ridzonova et al. [13] (Equation (9) in that cited paper):
V = ε 0   ε r μ e   θ 3 J   { [ ( s e J μ e ( F * e J ) ) 2 + 2 J L ε 0   ε r μ e θ ] 3 2 ( s e J μ e ( F * e J ) ) 3 } ,
where J represents the current density, ε0, εr, V, F*, and e are the vacuum and the relative permittivity, the applied bias voltage, the photon flux which reaches the sample passing the metal layer and the elementary charge, respectively. Parameter θ is defined as follows:
θ = n n + n t   ,
where n is the free electron density, and nt is the trapped electron density. Usually nt >> n, so θ = n n t . In this model, the fitting parameters were θ and se. The F* value was determined from the saturation of photocurrent versus voltage [13].
The model considers surface effects and the non-uniform electric field distribution in the sample, especially in the vicinity of the cathode. Fits of the experimental data with the model from Reference [13] are shown in Figure 9.
We can see that for the sample etched with 20% HCl, the photocurrent measured at different photon fluxes changes exponentially with applied bias voltage, with the exponent close to 3/2, which is shown in Figure 10. Such behavior may be expected for traps generating a “Coulomb-attractive” potential. This effect is similar to the Poole–Frenkel model [23,24] analyzed in Reference [25]. In that paper, the de-trapping mechanism is described by the relation E3/2, following the change of the capture cross section proportional to E−3/2. Such a relationship was obtained in Reference [26], where in lithium-doped germanium detectors a decrease of the trapping cross section as a function of electric field was observed (see Figure 17 in Reference [26]). The results and their interpretation indicate quite deep traps.
For a sample etched with 20% HCl, the results of which are indicated in Figure 6, Figure 8, Figure 9 and Figure 10, we registered X-ray spectra using Co-57 source. According to our interpretation, saying that a treatment of (Cd,Mn)Te sample with 20% HCl causes a formation of surface traps, we cannot expect sharp peaks in the detected spectra. Instead of peaks we observed broad maxima shifting with the applied voltage up to 450 V. The position of a maximum is stabilized in a voltage region from 500 V to 700 V.
In order to explain the results presented in Figure 6, Figure 8, Figure 9 and Figure 10, we measured PC-V characteristics for another (Cd,Mn)Te sample at two slightly different temperatures: 294 K and 306 K. The result is shown in Figure 11. The small temperature change (~4%) caused an evident change in the measured PC-V curve. The dependence changed from a power function to a nearly exponential function at the low voltage, resembling the Hecht–Many function. Because of the presented results, we believe that we observe very shallowly localized (i.e., localized close to the sample surface) traps capturing electrons moving from the cathode, where they are generated by light. The increasing voltage causes de-trapping, and at the higher voltage the PC-V curve saturates. Figure 11 indicates that in a low voltage region a temperature change from 294 K to 306 K causes an increase of the PC-V signal by a factor of 2.5. We estimated that the ionization energy of these surface traps is approximately 0.6 eV below the conduction band. It is valid for semiconductors partially compensated [27]. Their ionization at low voltage may be similar to the Poole–Frenkel effect. Moreover, for (Cd,Mn)Te crystals, the measurements of the Pockels effect and Pockels E-field profiling [28,29,30] indicated at the high voltage the non-uniform distribution of the electric field in the sample up to about 200 μm from the cathode. Therefore, we cannot consider the electric field inside the sample, E as VL−1, because the field is not uniform. We can only take into consideration the applied voltage, as was done in Reference [13].
Due to the fact that from the Ridzonova model [13] we could not determine the μeτe value, we made an attempt to roughly estimate this value. We used the relation:
J = e   N e   μ e V L   ,
where Ne is the free electron concentration. Here we assume μe = 800 cm2V−1s−1 [31,32,33]. From this relation and the PC-V saturation current, we obtained the free electron concentration, Ne, given in Table 1.
In Figure 9, we see for each PC-V curve a definite knee, above which the current saturates. Therefore, we believe that all electrons generated by light reach the anode for the bias voltage, V, corresponding to the knee. That would mean that the mean drift time, τdr, corresponds to the electron lifetime, τe (τdrτe).
We are aware of the possible non-uniform electric field distribution, especially for high bias voltage and high photon flux. However, we try to estimate the μeτe product from the relation:
v d r = μ e   E = L τ d r   ,
Then, L   μ e   τ e   E and μ e   τ e   L 2 V .
We estimated the μeτe value for the lowest photon flux F = 1.39 × 1012 cm−2s−1 as approximately 7 × 10⁻⁴ cm2V–1. For the highest photon flux F = 2.36 × 1013 cm−2s−1 in Figure 9, the knee is at the highest voltage, about 400 V, and the μeτe value is three times smaller. We realize that the electric field distribution is not uniform for higher photon fluxes and bias voltages, as was observed by the Pockels effect [28,29,30], and the estimated μeτe is several times smaller.

3.2. Kinetics of Photocurrent

The kinetics of photocurrent was measured for the sample, the PC-V characteristics of which are presented in Figure 8 and Figure 9. A bias voltage was applied to the sample and a dark current stabilized after some time. Then a shutter was opened, and a nearly rectangular light illumination was applied on the cathode side. The shutter open time was about 0.5 ms. The light passed through an interference filter. The light energies were ħω > Eg and ħω ~ Eg. Photocurrent was registered as a function of time. Then, a higher bias voltage was applied and the measurement was repeated.
The same bias voltage was applied to the electrodes and to the rings at the sample edges for every run. The current was measured with the Keithley 6517B electrometer, displayed on the Tektronix MSO 54 Oscilloscope, and registered. The time base was 180 s. Using stable light with energy 1.608 eV, which is ~33 meV above the energy gap and which enters the sample at a distance smaller than 1 μm, we apply consecutively higher bias voltages to obtain the results shown in Figure 12. The sharp peak at t ~ 0 in Figure 12 is probably an artifact from electronics. At the lowest voltage (50 V), the signal rise time till stabilization is about 40–50 s. The signal amplitude at 50 V is about ten times smaller than the one at the highest voltage (500 V). At the highest voltage, the signal rise and stabilization time reduce to ~3 s.
The saturation current values increase with bias voltage like in the spectra shown in Figure 9. However, after shutting (shutter close time ~0.5 ms) the photocurrent decay is fast and does not depend on the bias voltage. Decay time has two components: (1) Very short time, much less than 1 s; (2) time about 5–8 s. The time decay was not analyzed in detail in the present work.
The kinetics of photocurrent for the photon energy ħω = 1.531 eV (Eg − 44 meV) is very different from the one observed when ħω > Eg (Figure 12), and is shown in Figure 13. For such photon energy in the tail of the absorption edge, the absorption coefficient is about 20 cm−1. The LED light with energy of 1.531 eV is absorbed in 90% at a distance of about 350 μm, which is about 10% of the thickness of this sample (3210 μm). For comparison, Am-241 gamma radiation with energy of 60 keV is absorbed in 90% at a distance of about 600 µm, as was mentioned in Section 1. If defects created by etching the sample surface with 20% HCl are surface defects, we can expect different PC characteristics for ħω > Eg and ħω < Eg. The light of energy ħω > Eg is absorbed close to the sample surface and can interact with surface defects. The light of energy ħω < Eg penetrates the sample deeper and to a lesser extent generates charge carriers near the surface. A similar phenomenon takes place if the sample is illuminated by gamma rays from Am-241 59.5 keV. Therefore, the Am-241 source cannot be used in photocurrent kinetics investigations. In Figure 13, we can see that after opening the shutter, the signal rise time at the lowest voltage (5 V) is about 2 s, and at the highest voltage (300 V) is about 1 s. Decay time, like for ħω > Eg, is at first very fast and thereafter several seconds and does not depend on the bias voltage. For ħω = 1.531 eV the saturation current values increase with bias voltage like in the Hecht–Many formula. When we compare the results presented in Figure 12 and Figure 13, taking into account the penetration depth of the radiation, we come to important observations.
We may estimate a possible influence of holes flowing back to the cathode on the kinetics of photocurrent. For photons with energy below Eg, the PC kinetics is very fast, on the order of single seconds, and the hole contribution to the electric current is nearly negligible. However, at high bias voltages, V ≥ 100 V, the signal after the first rapid rise (~1 s) increases slightly till about 100 s. This effect we attribute to the contribution of holes to the electric current.
We also investigated samples etched with 10% HCl. The results we obtained by sample excitation with photons of energy of ħω = 1.608 eV = Eg + 33 meV (like in Figure 12) as well as those obtained by using energy of ħω = 1.531 eV = Eg − 44 meV (like in Figure 13) are identical with the results shown in Figure 13. The etching of the sample with 10% HCl does not generate surface traps.
Thus, we can see that the PC kinetics strongly depends on the surface states and surface charge. The PC-V characteristics at lower voltages and the PC kinetics for ħω > Eg provide a method to check for the presence of surface traps.

4. Conclusions

At present, photocurrent-voltage characteristics are increasingly used to determine the µeτe, which is an essential parameter for X-ray and gamma-ray detectors. The present paper shows PC-V characteristics of semi-insulating (Cd,Mn)Te:In samples with differently prepared surfaces. We show that the different preparations of the surface lead to very different results, and in some cases the Hecht–Many model cannot be applied. Furthermore, the PC-V characteristic features significantly changed with the concentration of HCl used after the polishing process.
We applied the final etching with 20% HCl for some of our samples, measured the PC-V characteristics and fitted our results with the formula given by Ridzonova et al. [13]. The model considers surface states and space charges in the sample volume. We noticed that in the voltage region below saturation, the current is proportional to V3/2 (in the case of uniform E that would correspond to E3/2). This is in agreement with the Poole–Frenkel model [23,24]. The I ~ V3/2 dependence is observed even at voltages as low as about 30 V (for our samples with thicknesses ~0.3 cm that would correspond to E ~ 100 Vcm−1). We have shown that the PC-V method that uses excitation with energy of ħω > Eg + z, where z varies from 20 to 30 meV, is the most suitable for surface effect measurements.
We also noticed that a change in the sample temperature by 4% significantly changed the PC-V characteristic. We roughly estimated that the ionization energy of these surface traps is approximately 0.6 eV below the conduction band.
We measured the PC kinetics for samples with a high density of surface electron traps. The results obtained by excitation with phonon energy ħω = 1.608 eV (Eg + 33 meV) differ from those obtained by exciting with ħω = 1.531 eV (Eg − 44 meV). Our results show that the measurements of the PC kinetics by using the photons with energies ħω = 1.608 eV are sensitive to the quality of the surface and may be used to test methods of preparation of detector plates.
The PC kinetics measured for ħω > Eg and ħω < Eg indicated a minor influence of holes on the observed phenomena.
We described our results with three models: Hecht [2], Hecht–Many [3] and Ridzonova et al. [13]. The best agreement was obtained for the model by Ridzonova et al. The model considers the non-uniform distribution of the electric field.
We also point out that when the metallic contacts (Au/Pd, Pt/Pd) are deposited directly onto the surface of a high-resistive (Cd,Mn)Te sample with orientation (111), it is better to place the anode on the A (cadmium) side of the plate to obtain high resistivities.

Author Contributions

Conceptualization, A.M., D.M.K., M.M.; methodology, A.M., D.M.K., K.G., Ł.J., Ł.Ś., J.I.-H.; software, W.D.; validation, W.C.; formal analysis, D.M.K., A.W., M.S., W.D., Ł.J.; investigation, A.M., D.M.K., A.W., K.G., M.S., G.J., Ł.J., W.C.; resources, A.M., D.M.K., K.G.; data curation, Ł.J.; writing—original draft preparation, A.M., M.G.; writing—review and editing, D.M.K., A.W., K.G., M.S., W.D., Ł.J., M.M.; visualization, D.M.K., A.W.; supervision, A.M., J.I.-H., M.M. All authors have read and agreed to the published version of the manuscript.

Funding

This research was funded by the Polish National Centre for Research and Development, grant number TECHMATSTRATEG1/346720/8/NCBR/2017, and by the Foundation for Polish Science through the IRA Program co-financed by EU within SG OP, grant number MAB/2017/1.

Institutional Review Board Statement

Not applicable.

Informed Consent Statement

Not applicable.

Data Availability Statement

The data presented in this study are available on request from the corresponding author.

Acknowledgments

The authors would like to gratefully acknowledge Marek Zubrzycki, Stanisław Jabłoński, Janusz Gdański, Adam Marciniak, Michał Kochański and Marcin Dopierała for their technical support during experiments. The authors would like to warmly thank Roman Grill from Charles University in Prague (Czech Republic) for the insightful discussion and valuable comments on the manuscript.

Conflicts of Interest

The authors declare no conflict of interest. The funders had no role in the design of the study; in the collection, analyses, or interpretation of data; in the writing of the manuscript, or in the decision to publish the results.

References

  1. Mycielski, A.; Wardak, A.; Kochanowska, D.; Witkowska-Baran, M.; Szot, M.; Jakieła, R.; Domagała, J.Z.; Kowalczyk, L.; Kochański, M.; Janusz, G.; et al. CdTe-based crystals with Mg, Se, or Mn as materials for X and gamma ray detectors: Selected physical properties. Prog. Cryst. Growth Charact. Mater. 2021, 67, 100543. [Google Scholar] [CrossRef]
  2. Hecht, K. Zum Mechanismus des lichtelektrischen Primärstromes in isolierenden Kristallen. Z. Phys. 1932, 77, 235–245. [Google Scholar] [CrossRef]
  3. Many, A. High-field effects in photoconducting cadmium sulphide. J. Phys. Chem. Solids 1965, 26, 575–585. [Google Scholar] [CrossRef]
  4. Cui, Y.; Wright, G.W.; Ma, X.; Chattopadhyay, K.; James, R.B.; Burger, A. DC photoconductivity study of semi-insulating Cd1-xZnxTe crystals. J. Electron. Mater. 2001, 30, 774–778. [Google Scholar] [CrossRef]
  5. Cui, Y.; Groza, M.; Hillman, D.; Burger, A.; James, R.B. Study of surface recombination velocity of Cd1-xZnxTe radiation detectors by direct current photoconductivity. J. Appl. Phys. 2002, 92, 2556–2560. [Google Scholar] [CrossRef]
  6. Levi, A.; Schieber, M.M.; Burshtein, Z. Carrier surface recombination in HgI2 photon detectors. J. Appl. Phys. 1983, 54, 2472–2476. [Google Scholar] [CrossRef]
  7. Levi, A.; Burger, A.; Nissenbaum, J.; Schieber, M.; Burshtein, Z. Search for improved surface treatment procedures in fabrication of HgI2 X-ray spectrometers. Nucl. Instrum. Methods 1983, 213, 35–38. [Google Scholar] [CrossRef]
  8. Burshtein, Z.; Akujieze, J.K.; Silberman, E. Carrier surface generation and recombination effects in photoconduction of HgI2 single crystals. J. Appl. Phys. 1986, 60, 3182–3187. [Google Scholar] [CrossRef]
  9. Zappettini, A.; Zha, M.; Marchini, L.; Calestani, D.; Mosca, R.; Gombia, E.; Zanotti, L.; Zanichelli, M.; Pavesi, M.; Auricchio, N.; et al. Boron oxide encapsulated vertical Bridgman grown CdZnTe crystals as X-ray detector material. In Proceedings of the 2008 IEEE Nuclear Science Symposium Conference Record, Dresden, Germany, 19–25 October 2008; pp. 118–121. [Google Scholar]
  10. Zanichelli, M.; Pavesi, M.; Zappettini, A.; Marchini, L.; Auricchio, N.; Caroli, E.; Manfredi, M. Characterization of bulk and surface transport mechanisms by means of the photocurrent technique. IEEE Trans. Nucl. Sci. 2009, 56, 3591–3596. [Google Scholar] [CrossRef]
  11. Zanichelli, M.; Santi, A.; Pavesi, M.; Zappettini, A. Charge collection in semi-insulator radiation detectors in the presence of a linear decreasing electric field. J. Phys. D Appl. Phys. 2013, 46, 365103. [Google Scholar] [CrossRef]
  12. Ling, Y.; Min, J.; Liang, X.; Zhang, J.; Yang, L.; Zhang, Y.; Li, M.; Liu, Z.; Wang, L. Carrier transport performance of Cd0.9Zn0.1Te detector by direct current photoconductive technology. J. Appl. Phys. 2017, 121, 034502. [Google Scholar] [CrossRef]
  13. Ridzonova, K.; Belas, E.; Grill, R.; Pekarek, J.; Praus, P. Space-charge-limited photocurrents and transient currents in (Cd,Zn)Te radiation detectors. Phys. Rev. Appl. 2020, 13, 064054. [Google Scholar] [CrossRef]
  14. Shen, M.; Zhang, J.; Wang, L.; Min, J.; Wang, L.; Liang, X.; Huang, J.; Tang, K.; Liang, W.; Meng, H. Investigation on the surface treatments of CdMnTe single crystals. Mater. Sci. Semicond. Process. 2015, 31, 536–542. [Google Scholar] [CrossRef]
  15. Fiederle, M.; Eiche, C.; Salk, M.; Schwarz, R.; Benz, K.W.; Stadler, W.; Hofmann, D.M.; Meyer, B.K. Modified compensation model of CdTe. J. Appl. Phys. 1998, 84, 6689–6692. [Google Scholar] [CrossRef]
  16. Chu, M.; Terterian, S.; Ting, D.; Wang, C.C.; Gurgenian, H.K.; Mesropian, S. Tellurium antisites in CdZnTe. Appl. Phys. Lett. 2001, 79, 2728–2730. [Google Scholar] [CrossRef]
  17. Durose, K. Structural Defects in CdTe. Ph.D. Thesis, University of Durham, Durham, UK, 1986. [Google Scholar]
  18. Brown, P.D.; Durose, K.; Russell, G.J.; Woods, J. The absolute determination of CdTe crystal polarity. J. Cryst. Growth 1990, 101, 211–215. [Google Scholar] [CrossRef]
  19. Horodyský, P.; Hlídek, P. Free-exciton absorption in bulk CdTe: Temperature dependence. Phys. Status Solidi B 2006, 243, 494–501. [Google Scholar] [CrossRef]
  20. Horodyský, P.; Grill, R.; Hlídek, P. Band-edge photoluminescence in CdTe. Phys. Status Solidi B 2006, 243, 2882–2891. [Google Scholar] [CrossRef]
  21. Stibal, R.; Windscheif, J.; Jantz, W. Contactless evaluation of semi-insulating GaAs wafer resistivity using the time-dependent charge measurement. Semicond. Sci. Technol. 1991, 6, 995–1001. [Google Scholar] [CrossRef]
  22. Eurorad. EU-ρ-μτ-SCAN: Contactless Resistivity (ρ) and μτ Products Mapping System for Semiconductor Materials; Instruction’s Manual; Eurorad: Eckbolsheim, France, 2010. [Google Scholar]
  23. Frenkel, J. On pre-breakdown phenomena in insulators and electronic semi-conductors. Phys. Rev. 1938, 54, 647–648. [Google Scholar] [CrossRef]
  24. Hartke, J.L. The Three-Dimensional Poole-Frenkel Effect. J. Appl. Phys. 1968, 39, 4871–4873. [Google Scholar] [CrossRef]
  25. Dussel, G.A.; Bube, R.H. Electric field effects in trapping processes. J. Appl. Phys. 1966, 37, 2797–2804. [Google Scholar] [CrossRef]
  26. Martini, M.; McMath, T.A. Trapping and detrapping effects in lithium-drifted germanium and silicon detectors. Nucl. Instrum. Methods 1970, 79, 259–276. [Google Scholar] [CrossRef]
  27. Smith, R.A. Semiconductors; Cambridge University Press: London, UK; New York, NY, USA, 1959; p. 90. [Google Scholar]
  28. Bale, D.S.; Szeles, C. Nature of polarization in wide-bandgap semiconductor detectors under high-flux irradiation: Application to semi-insulating Cd1-xZnxTe. Phys. Rev. B 2008, 77, 035205. [Google Scholar] [CrossRef] [Green Version]
  29. Franc, J.; Dědič, V.; Sellin, P.J.; Grill, R.; Veeramani, P. Radiation induced control of electric field in Au/CdTe/In structures. Appl. Phys. Lett. 2011, 98, 232115. [Google Scholar] [CrossRef] [Green Version]
  30. Wardak, A.; Szot, M.; Witkowska-Baran, M.; Avdonin, A.; Kochanowska, D.; Łusakowska, E.; Mycielski, A. Internal electric field in (Cd,Mn)Te and (Cd,Mg)Te studied by the Pockels effect. J. Cryst. Growth 2019, 526, 125217. [Google Scholar] [CrossRef]
  31. Owens, A.; Peacock, A. Compound semiconductor radiation detectors. Nucl. Instrum. Methods Phys. Res. A 2004, 531, 18–37. [Google Scholar] [CrossRef]
  32. Najam, L.A.; Jamil, N.Y.; Yousif, R.M. Comparison in Mobility, Transit Time and Quality Factor Between CdMnTe and CdZnTe Detectors. Afr. Rev. Phys. 2012, 7, 269–272. [Google Scholar]
  33. Rafiei, R.; Reinhard, M.I.; Kim, K.; Prokopovich, D.A.; Boardman, D.; Sarbutt, A.; Watt, G.C.; Bolotnikov, A.E.; Bignell, L.J.; James, R.B. High-purity CdMnTe radiation detectors: A high-resolution spectroscopic evaluation. IEEE Trans. Nucl. Sci. 2013, 60, 1450–1456. [Google Scholar] [CrossRef]
Figure 1. Room-temperature electron photocurrent as a function of a bias voltage for the Cd0.95Mn0.05Te: In sample etched with 10% HCl. The illuminating light energy was ħω = 1.590 eV (Eg + 15 meV). The solid line is a fit with the Hecht equation. The value of the µeτe parameter is 8.1 × 10⁻⁴ cm2V−1 with a standard error of 0.47 × 10⁻⁴ cm2V−1. The contacts were sputtered ~30 nm thick Au/Pd layers.
Sensors 22 02941 g001
Figure 2. Room-temperature Am-241 gamma-ray response current for the (Cd,Mn)Te:In sample measured in Figure 1. Gamma radiation energy is 59.5 keV. The solid line is a fit with the Hecht equation, μeτe = 7.6 × 10⁻⁴ cm2V−1 with a standard error of 0.44 × 10⁻⁴ cm2V−1.
Sensors 22 02941 g002
Figure 3. PC-V characteristic for two opposite surfaces (A and B) of a (Cd,Mn)Te:In sample etched with 15% HCl. Red and black symbols and curves represent results and fittings obtained for the Cd side (A) and Te side (B), respectively. The fitting was made with the Hecht equation. The standard error of µeτe is 0.3 × 10⁻⁴ cm2V−1. The contacts on both surfaces of the sample were sputtered Au/Pd layers with thicknesses ~30 nm.
Sensors 22 02941 g003
Figure 4. Resistivity map of a (Cd,Mn)Te:In sample measured by the EU-ρ-μτ-SCAN apparatus. The upper left corner is the border of the sample (and of the crystal). The side surface leakage current influences the measured sample resistivity up to about 3 mm from the side.
Sensors 22 02941 g004
Figure 5. Room-temperature dark I-V characteristic for a (Cd,Mn)Te:In sample cut parallel to the (111) plane. After preliminary preparation, the sample was etched with 20% HCl. The contacts were sputtered Pt/Pd layers. The current is much lower when the anode is on the cadmium surface (A), especially at high bias voltage.
Sensors 22 02941 g005
Figure 6. PC-V characteristics for a (Cd,Mn)Te:In sample etched with 20% HCl. At voltages up to ~75 V the curve does not look like the exponential Hecht–Many function, rather like a straight line or power-like function. The illumination photons energy was very close to Eg, i.e., ħω = 1.590 eV = Eg + 15 meV.
Sensors 22 02941 g006
Figure 7. The tail of the absorption edge as a function of light wavelength and photon energy for a Cd0.95Mn0.05Te:In sample with a thickness of 100 μm. To obtain the PC-V characteristic the light was emitted by LEDs and passed through interference filters. Half widths of some filters are marked.
Sensors 22 02941 g007
Figure 8. Current density J as a function of voltage V at the mean photon flux F = 8.49 × 1012 cm−2s−1 measured on a (Cd,Mn)Te:In sample etched with 20% HCl. The excitation energy was equal to ħω = 1.651 eV = Eg + 76 meV. The dashed line is a fit with the Hecht formula, solid line is a fit with the Ridzonova et al. model [13].
Sensors 22 02941 g008
Figure 9. Current density J as a function of voltage V obtained for a (Cd,Mn)Te:In sample etched with 20% HCl. PC-V characteristics were measured at different photon fluxes. The excitation energy was equal to ħω = 1.651 eV = Eg + 76 meV. For the lowest photon flux, F = 1.39 × 1012 cm−2s−1, the saturation is reached at 150 V. For the highest photon flux, F = 2.36 × 1013 cm−2s−1, the saturation is reached at 450 V. Solid lines are fitted to the Ridzonova et al. model.
Sensors 22 02941 g009
Figure 10. PC-V characteristics from Figure 9 in logarithmic scale. The excitation energy was equal to ħω = 1.651 eV = Eg + 76 meV. Photocurrent increased with the bias voltage roughly like V3/2. When the current is inversely proportional to the cross section for Coulomb trapping, it should depend on the electric field like E3/2 [23,24,25,26].
Sensors 22 02941 g010
Figure 11. PC-V characteristics measured at two slightly different temperatures. The results were obtained on a (Cd,Mn)Te:In sample etched with 20% HCl but different from the one whose results were presented in Figure 6, Figure 8, Figure 9 and Figure 10. The excitation energy was equal to ħω = 1.608 eV = Eg + 33 meV. Below 30 V at 294 K, the dependence is power like. It changes shape after raising temperature up to 306 K (by about 4%) and resembles the Hecht–Many function. The conducting electrons may appear due to thermal ionization of surface trapping. In this sample deep traps must also exist, e.g., tellurium antisites TeCd2+. Deep traps can be emptied by the application of higher voltages. Thus, in a voltage range higher than 50 V the increase of the PC-V signal is noticed.
Sensors 22 02941 g011
Figure 12. PC kinetics after rapid (~0.5 ms) turning on the illuminating light, F = 1.55 × 1012 cm−2s−1, ħω = 1.608 eV (Eg + 33 meV), at different voltages. Charge carriers are generated at the surface of the sample. The PC time dependence does not change much above 250 V.
Sensors 22 02941 g012
Figure 13. PC kinetics for the sample shown in Figure 12, F = 3.83 × 1012 cm−2s−1, ħω = 1.531 eV (Eg − 44 meV). Charge carriers are generated inside the sample, not only at the surface. The shape of the PC time dependence does not depend on the bias voltage; only the amplitude depends on the bias voltage. The slight rise of the PC signal with time at V ≥ 100 V was attributed to the influence of holes.
Sensors 22 02941 g013
Table 1. Parameters obtained from the analysis of the PC-V data for different photon fluxes according to the Ridzonova et al. model [13]: θ and se are fitting parameters, Ne was determined from the saturation current and μeτe was estimated for the lowest photon flux (see text).
LED Current [mA]Photon Flux F [cm−2s−1] Measuredθse
[cm1s−1]
Photon Flux F* [cm−2s−1] from FittingNe [cm−3]μeτe [cm2V−1]
0.071.39 × 10125.24 × 10−44.933 × 1047.48 × 10111.7 × 1067 × 10−4
0.133.76 × 10125.25 × 10−43.685 × 1041.75 × 10123.1 × 106-
0.228.49 × 10125.08 × 10−44.793 × 1043.94 × 10125.0 × 106-
0.301.34 × 10134.41 × 10−48.280 × 1035.84 × 10126.5 × 106-
0.452.36 × 10134.67 × 10−41.038 × 1041.05 × 10138.6 × 106-
Publisher’s Note: MDPI stays neutral with regard to jurisdictional claims in published maps and institutional affiliations.

