
Prediction of Inflammatory Bowel Disease Course Based on Fecal Scent

 , ,
, ,  ,
,
Abstract
:1. Introduction
2. Materials and Methods
2.1. Study Participants
2.2. Sample Collection
2.3. GC-IMS Instrumentation
2.4. Sample Preparation and Volatile Organic Compound Analyses
2.5. Statistical Analysis
3. Results
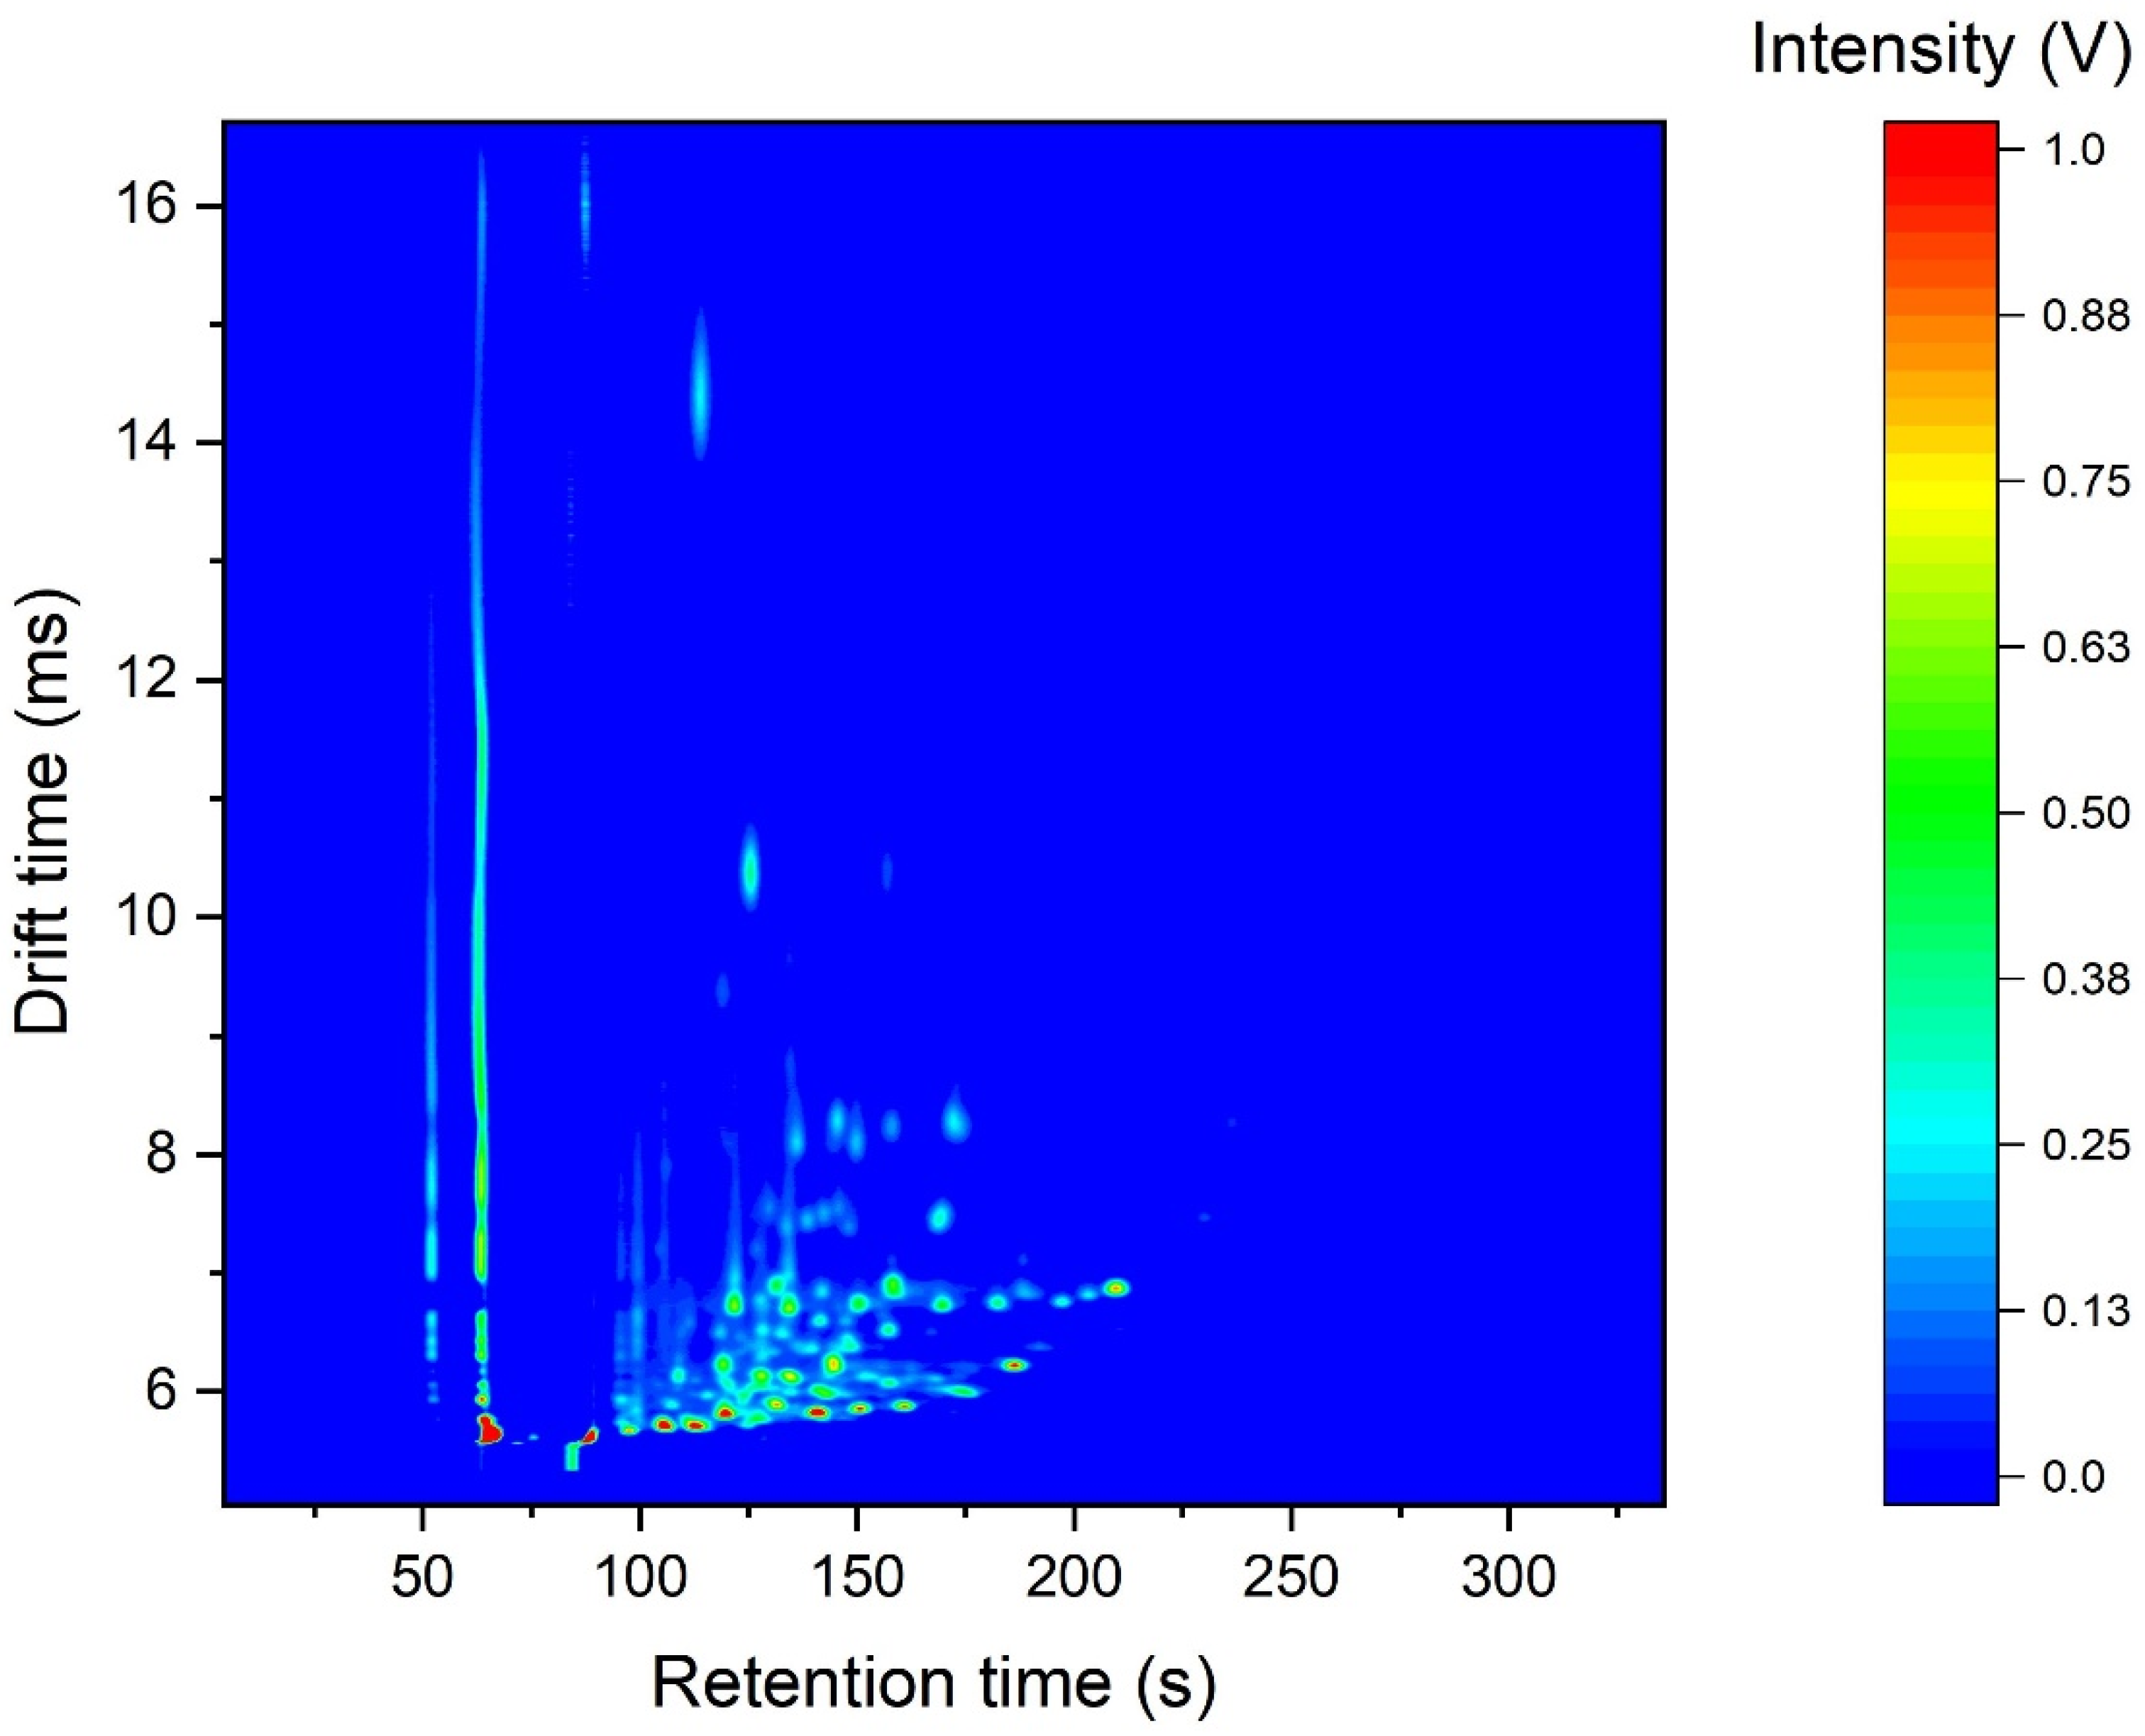
3.1. GC-IMS Data
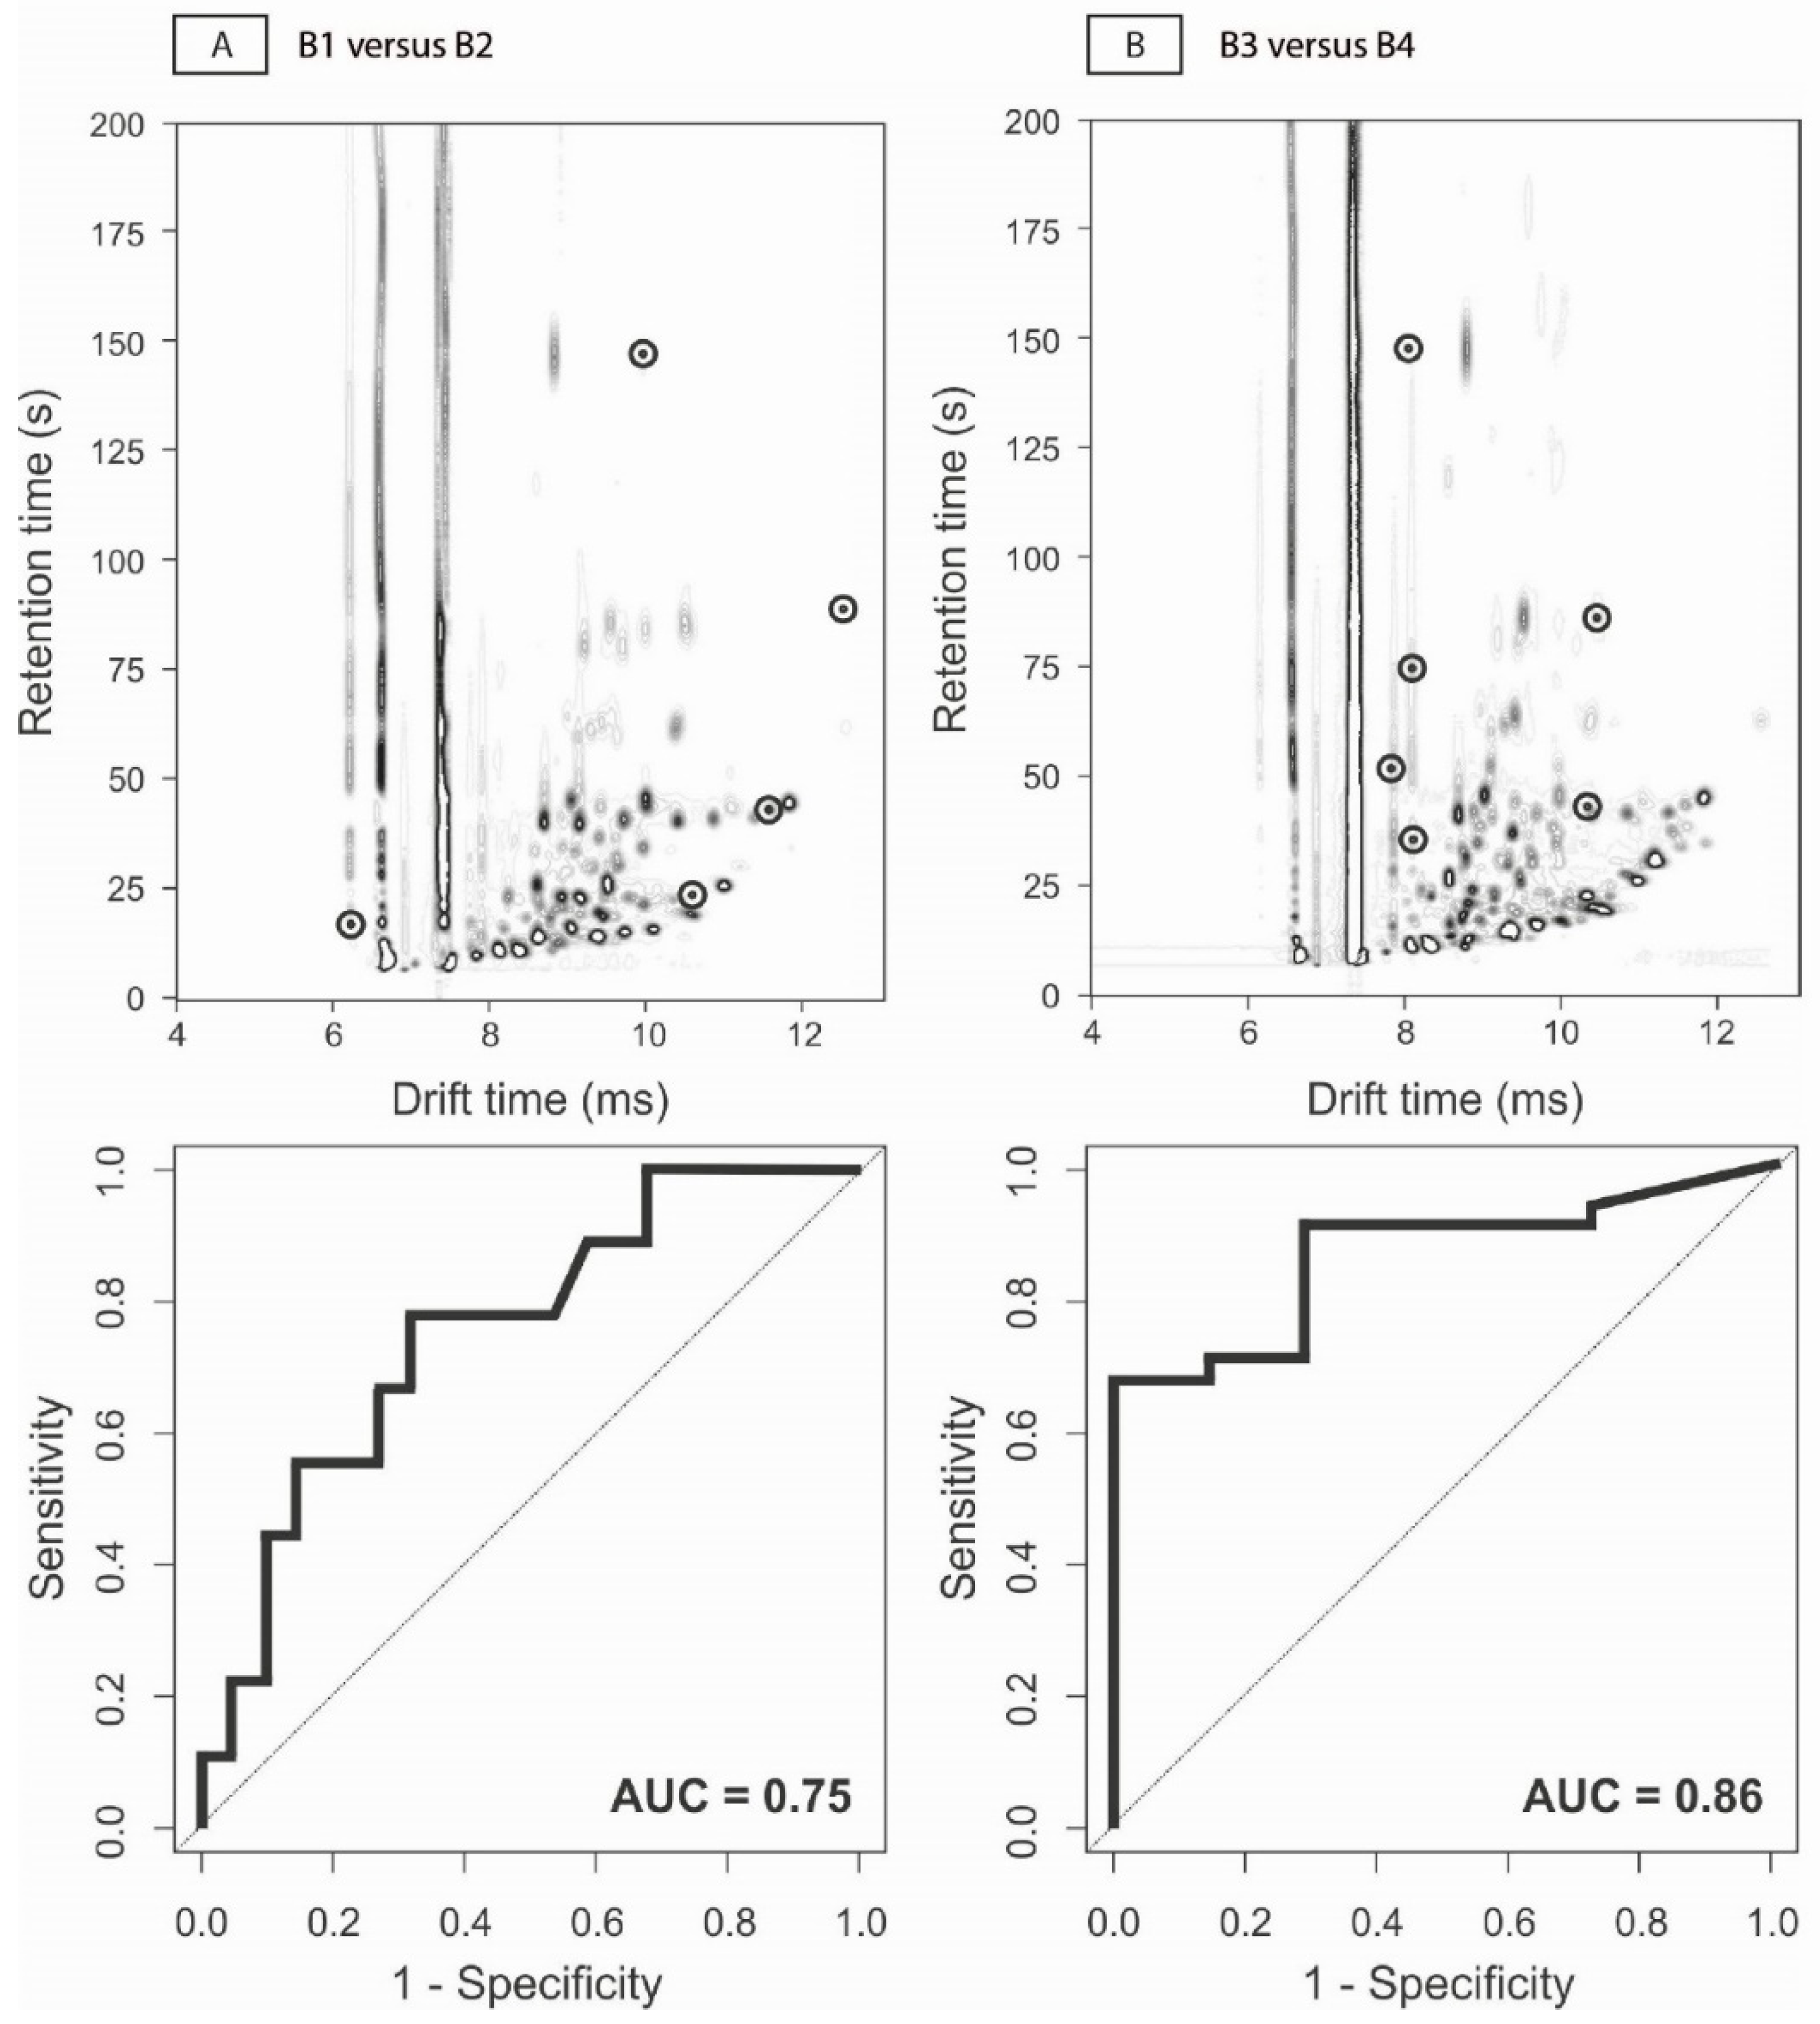
3.2. Prediction of Clinical Disease Course
4. Discussion
Author Contributions
Funding
Institutional Review Board Statement
Informed Consent Statement
Data Availability Statement
Conflicts of Interest
References
- Ng, S.C.; Shi, H.Y.; Hamidi, N.; Underwood, F.E.; Tang, W.; Benchimol, E.I.; Panaccione, R.; Ghosh, S.; Wu, J.C.Y.; Chan, F.K.L.; et al. Worldwide incidence and prevalence of inflammatory bowel disease in the 21st century: A systematic review of population-based studies. Lancet 2018, 390, 2769–2778. [Google Scholar] [CrossRef]
- Lichtenstein, G.R.; Loftus, E.V.; Isaacs, K.L.; Regueiro, M.D.; Gerson, L.B.; Sands, B.E. ACG Clinical Guideline: Management of Crohn’s Disease in Adults. Am. J. Gastroenterol. 2018, 113, 481–517. [Google Scholar] [CrossRef] [PubMed]
- Koliani-Pace, J.L.; Siegel, C.A. Prognosticating the Course of Inflammatory Bowel Disease. Gastrointest. Endosc. Clin. N. Am. 2019, 29, 395–404. [Google Scholar] [CrossRef]
- Colombel, J.F.; Panaccione, R.; Bossuyt, P.; Lukas, M.; Baert, F.; Vanasek, T.; Danalioglu, A.; Novacek, G.; Armuzzi, A.; Hebuterne, X.; et al. Effect of tight control management on Crohn’s disease (CALM): A multicentre, randomised, controlled phase 3 trial. Lancet 2018, 390, 2779–2789. [Google Scholar] [CrossRef]
- Adler, J.; Rangwalla, S.C.; Dwamena, B.A.; Higgins, P.D. The prognostic power of the NOD2 genotype for complicated Crohn’s disease: A meta-analysis. Am. J. Gastroenterol. 2011, 106, 699–712. [Google Scholar] [CrossRef] [PubMed]
- Rajca, S.; Grondin, V.; Louis, E.; Vernier-Massouille, G.; Grimaud, J.C.; Bouhnik, Y.; Laharie, D.; Dupas, J.L.; Pillant, H.; Picon, L.; et al. Alterations in the intestinal microbiome (dysbiosis) as a predictor of relapse after infliximab withdrawal in Crohn’s disease. Inflamm. Bowel Dis. 2014, 20, 978–986. [Google Scholar] [CrossRef]
- Schirmer, M.; Denson, L.; Vlamakis, H.; Franzosa, E.A.; Thomas, S.; Gotman, N.M.; Rufo, P.; Baker, S.S.; Sauer, C.; Markowitz, J.; et al. Compositional and Temporal Changes in the Gut Microbiome of Pediatric Ulcerative Colitis Patients Are Linked to Disease Course. Cell Host Microbe 2018, 24, 600–610.e4. [Google Scholar] [CrossRef] [PubMed] [Green Version]
- Kennedy, N.A.; Jones, G.R.; Plevris, N.; Patenden, R.; Arnott, I.D.; Lees, C.W. Association Between Level of Fecal Calprotectin and Progression of Crohn’s Disease. Clin. Gastroenterol. Hepatol. 2019, 17, 2269–2276.e4. [Google Scholar] [CrossRef] [Green Version]
- Boots, A.W.; Smolinska, A.; van Berkel, J.J.; Fijten, R.R.; Stobberingh, E.E.; Boumans, M.L.; Moonen, E.J.; Wouters, E.F.; Dallinga, J.W.; Van Schooten, F.J. Identification of microorganisms based on headspace analysis of volatile organic compounds by gas chromatography-mass spectrometry. J. Breath Res. 2014, 8, 027106. [Google Scholar] [CrossRef]
- Garner, C.E.; Smith, S.; de Lacy Costello, B.; White, P.; Spencer, R.; Probert, C.S.; Ratcliffe, N.M. Volatile organic compounds from feces and their potential for diagnosis of gastrointestinal disease. FASEB J. 2007, 21, 1675–1688. [Google Scholar] [CrossRef] [Green Version]
- Buijck, M.; Berkhout, D.J.; de Groot, E.F.; Benninga, M.A.; van der Schee, M.P.; Kneepkens, C.M.; de Boer, N.K.; de Meij, T.G. Sniffing out paediatric gastrointestinal diseases: The potential of volatile organic compounds as biomarkers for disease. J. Pediatr. Gastroenterol. Nutr. 2016, 63, 585–591. [Google Scholar] [CrossRef] [PubMed] [Green Version]
- Ahmed, I.; Greenwood, R.; Costello, B.; Ratcliffe, N.; Probert, C.S. Investigation of faecal volatile organic metabolites as novel diagnostic biomarkers in inflammatory bowel disease. Aliment. Pharmacol. Ther. 2016, 43, 596–611. [Google Scholar] [CrossRef] [Green Version]
- Bosch, S.; van Gaal, N.; Zuurbier, R.P.; Covington, J.A.; Wicaksono, A.N.; Biezeveld, M.H.; Benninga, M.A.; Mulder, C.J.; de Boer, N.K.H.; de Meij, T.G.J. Differentiation Between Pediatric Irritable Bowel Syndrome and Inflammatory Bowel Disease Based on Fecal Scent: Proof of Principle Study. Inflamm. Bowel Dis. 2018, 24, 2468–2475. [Google Scholar] [CrossRef] [PubMed]
- Bosch, S.; Wintjens, D.S.J.; Wicaksono, A.; Kuijvenhoven, J.; van der Hulst, R.; Stokkers, P.; Daulton, E.; Pierik, M.J.; Covington, J.A.; de Meij, T.G.J.; et al. The faecal scent of inflammatory bowel disease: Detection and monitoring based on volatile organic compound analysis. Dig. Liver Dis. 2020, 52, 745–752. [Google Scholar] [CrossRef] [PubMed]
- El Manouni El Hassani, S.; Bosch, S.; Lemmen, J.P.M.; Brizzio Brentar, M.; Ayada, I.; Wicaksono, A.N.; Covington, J.A.; Benninga, M.A.; de Boer, N.K.H.; de Meij, T.G.J. Simultaneous Assessment of Urinary and Fecal Volatile Organic Compound Analysis in De Novo Pediatric IBD. Sensors 2019, 19, 4496. [Google Scholar] [CrossRef] [PubMed] [Green Version]
- Bodelier, A.G.; Smolinska, A.; Baranska, A.; Dallinga, J.W.; Mujagic, Z.; Vanhees, K.; van den Heuvel, T.; Masclee, A.A.; Jonkers, D.; Pierik, M.J.; et al. Volatile Organic Compounds in Exhaled Air as Novel Marker for Disease Activity in Crohn’s Disease: A Metabolomic Approach. Inflamm. Bowel Dis. 2015, 21, 1776–1785. [Google Scholar] [CrossRef] [PubMed] [Green Version]
- D’Haens, G.; Ferrante, M.; Vermeire, S.; Baert, F.; Noman, M.; Moortgat, L.; Geens, P.; Iwens, D.; Aerden, I.; Van Assche, G.; et al. Fecal calprotectin is a surrogate marker for endoscopic lesions in inflammatory bowel disease. Inflamm. Bowel Dis. 2012, 18, 2218–2224. [Google Scholar] [CrossRef] [PubMed]
- Lobaton, T.; Lopez-Garcia, A.; Rodriguez-Moranta, F.; Ruiz, A.; Rodriguez, L.; Guardiola, J. A new rapid test for fecal calprotectin predicts endoscopic remission and postoperative recurrence in Crohn’s disease. J. Crohn Colitis 2013, 7, e641–e651. [Google Scholar] [CrossRef] [PubMed] [Green Version]
- Tibble, J.A.; Sigthorsson, G.; Bridger, S.; Fagerhol, M.K.; Bjarnason, I. Surrogate markers of intestinal inflammation are predictive of relapse in patients with inflammatory bowel disease. Gastroenterology 2000, 119, 15–22. [Google Scholar] [CrossRef]
- Benitez, J.M.; Meuwis, M.A.; Reenaers, C.; Van Kemseke, C.; Meunier, P.; Louis, E. Role of endoscopy, cross-sectional imaging and biomarkers in Crohn’s disease monitoring. Gut 2013, 62, 1806–1816. [Google Scholar] [CrossRef]
- Cellier, C.; Sahmoud, T.; Froguel, E.; Adenis, A.; Belaiche, J.; Bretagne, J.F.; Florent, C.; Bouvry, M.; Mary, J.Y.; Modigliani, R. Correlations between clinical activity, endoscopic severity, and biological parameters in colonic or ileocolonic Crohn’s disease. A prospective multicentre study of 121 cases. The Groupe d’Etudes Therapeutiques des Affections Inflammatoires Digestives. Gut 1994, 35, 231–235. [Google Scholar] [CrossRef] [PubMed] [Green Version]
- Jorgensen, L.G.; Fredholm, L.; Hyltoft Petersen, P.; Hey, H.; Munkholm, P.; Brandslund, I. How accurate are clinical activity indices for scoring of disease activity in inflammatory bowel disease (IBD)? Clin. Chem. Lab. Med. 2005, 43, 403–411. [Google Scholar] [CrossRef] [PubMed]
- Arasaradnam, R.P.; McFarlane, M.J.; Ryan-Fisher, C.; Westenbrink, E.; Hodges, P.; Thomas, M.G.; Chambers, S.; O’Connell, N.; Bailey, C.; Harmston, C.; et al. Detection of colorectal cancer (CRC) by urinary volatile organic compound analysis. PLoS ONE 2014, 9, e108750. [Google Scholar] [CrossRef] [PubMed]
- Becker, C.; Neurath, M.F.; Wirtz, S. The Intestinal Microbiota in Inflammatory Bowel Disease. ILAR J. 2015, 56, 192–204. [Google Scholar] [CrossRef] [Green Version]
- Martinez, I.; Muller, C.E.; Walter, J. Long-term temporal analysis of the human fecal microbiota revealed a stable core of dominant bacterial species. PLoS ONE 2013, 8, e69621. [Google Scholar] [CrossRef]
- Faith, J.J.; Guruge, J.L.; Charbonneau, M.; Subramanian, S.; Seedorf, H.; Goodman, A.L.; Clemente, J.C.; Knight, R.; Heath, A.C.; Leibel, R.L.; et al. The long-term stability of the human gut microbiota. Science 2013, 341, 1237439. [Google Scholar] [CrossRef] [Green Version]
- Martinez, C.; Antolin, M.; Santos, J.; Torrejon, A.; Casellas, F.; Borruel, N.; Guarner, F.; Malagelada, J.R. Unstable composition of the fecal microbiota in ulcerative colitis during clinical remission. Am. J. Gastroenterol. 2008, 103, 643–648. [Google Scholar] [CrossRef]
- Halfvarson, J.; Brislawn, C.J.; Lamendella, R.; Vazquez-Baeza, Y.; Walters, W.A.; Bramer, L.M.; D’Amato, M.; Bonfiglio, F.; McDonald, D.; Gonzalez, A.; et al. Dynamics of the human gut microbiome in inflammatory bowel disease. Nat. Microbiol. 2017, 2, 17004. [Google Scholar] [CrossRef] [Green Version]
- Machiels, K.; Joossens, M.; Sabino, J.; De Preter, V.; Arijs, I.; Eeckhaut, V.; Ballet, V.; Claes, K.; Van Immerseel, F.; Verbeke, K.; et al. A decrease of the butyrate-producing species Roseburia hominis and Faecalibacterium prausnitzii defines dysbiosis in patients with ulcerative colitis. Gut 2014, 63, 1275–1283. [Google Scholar] [CrossRef]
- Manichanh, C.; Rigottier-Gois, L.; Bonnaud, E.; Gloux, K.; Pelletier, E.; Frangeul, L.; Nalin, R.; Jarrin, C.; Chardon, P.; Marteau, P.; et al. Reduced diversity of faecal microbiota in Crohn’s disease revealed by a metagenomic approach. Gut 2006, 55, 205–211. [Google Scholar] [CrossRef] [Green Version]
- Frank, D.N.; St. Amand, A.L.; Feldman, R.A.; Boedeker, E.C.; Harpaz, N.; Pace, N.R. Molecular-phylogenetic characterization of microbial community imbalances in human inflammatory bowel diseases. Proc. Natl. Acad. Sci. USA 2007, 104, 13780–13785. [Google Scholar] [CrossRef] [PubMed] [Green Version]
- Walker, A.W.; Sanderson, J.D.; Churcher, C.; Parkes, G.C.; Hudspith, B.N.; Rayment, N.; Brostoff, J.; Parkhill, J.; Dougan, G.; Petrovska, L. High-throughput clone library analysis of the mucosa-associated microbiota reveals dysbiosis and differences between inflamed and non-inflamed regions of the intestine in inflammatory bowel disease. BMC Microbiol. 2011, 11, 7. [Google Scholar] [CrossRef] [PubMed] [Green Version]
- Wills, E.S.; Jonkers, D.M.; Savelkoul, P.H.; Masclee, A.A.; Pierik, M.J.; Penders, J. Fecal microbial composition of ulcerative colitis and Crohn’s disease patients in remission and subsequent exacerbation. PLoS ONE 2014, 9, e90981. [Google Scholar] [CrossRef] [PubMed] [Green Version]


| A1 (n = 40) | A2 (n = 12) | A3 (n = 30) | A4 (n = 14) | B1 (n = 41) | B2 (n = 9) | B3 (n = 30) | B4 (n = 7) | ||
|---|---|---|---|---|---|---|---|---|---|
| Age (y, median (IQR)) | 42.5 (32–58) | 53.5 (42–65.5) | 51.5 (43.8–60) | 53.5 (43–60.3) | 47 (38–57.5) | 49 (35–59.5) | 39.5 (32–57) | 51 (28–66) | |
| Gender (n males (%)) | 22 (55) | 6 (50) | 7 (23.3) | 7 (50) | 16 (39) | 3 (33.6) | 19 (63.6) | 2 (28.6) | |
| Smoking status | |||||||||
| Active (n (%)) | 2 (5) | 1 (8.3) | 4 (13.3) | 2 (14.3) | 9 (22) | 1 (11.1) | 1 (3.3) | 1 (14.3) | |
| Stopped (n (%)) | 16 (40) | 5 (41.7) | 13 (43.3) | 6 (42.9) | 12 (29.3) | 4 (44.4) | 14 (46.7) | 3 (42.9) | |
| Never smoked (n (%)) | 22 (55) | 6 (50) | 10 (33.3) | 5 (35.7) | 19 (46.3) | 4 (44.4) | 15 (50) | 2 (28.6) | |
| IBD subtype (n CD (%)) | 24 (60) | 9 (75) | 21 (70) | 12 (85.7) | 23 (56.1) | 3 (33.3) | 16 (53.3) | 3 (42.9) | |
| Montreal classification at inclusion | |||||||||
| Age at diagnosis (n (%)) | |||||||||
| A1 | ≤16 years | 4 (10) | 0 (0) | 2 (6.7) | 1 (7.1) | 1 (2.4) | 0 (0) | 4 (13.3) | 0 (0) |
| A2 | 17–40 years | 22 (55) | 7 (58.3) | 16 (53.3) | 8 (57.1) | 27 (65.9) | 6 (66.7) | 19 (63.6) | 4 (57.1) |
| A3 | >40 years | 14 (35) | 5 (41.7) | 12 (40) | 5 (35.7) | 13 (31.7) | 3 (33.3) | 7 (23.3) | 3 (42.9) |
| Localization CD (n (% of CD)) | |||||||||
| L1 | Terminal ileum | 8 (33.3) | 5 (55.6) | 7 (33.3) | 6 (50) | 13 (56.5) | 1 (33.3) | 2 (6.7) | 2 (66.7) |
| L2 | Colon | 9 (37.5) | 2 (22.2) | 3 (14.3) | 3 (25) | 6 (26.0) | 1 (33.3) | 5 (31.3) | 1 (33.3) |
| L3 | Ileocolic | 7 (29.2) | 2 (22.2) | 9 (42.9) | 3 (25) | 5 (21.7) | 1 (33.3) | 9 (56.3) | 0 (0) |
| L4 | Involvement Upper GI tract | 3 (12.5) | 1 (11.1) | 5 (23.8) | 3 (25) | 5 (21.7) | 0 (0) | 0 (0) | 1 (33.3) |
| Behavior CD (n (% of CD)) | |||||||||
| B1 | NSNP | 16 (66.7) | 4 (44.4) | 11 (52.3) | 8 (66.7) | 14 (60.9) | 1 (33.3) | 11 (68.8) | 2 (66.7) |
| B2 | Stricturing | 4 (16.7) | 4 (44.4) | 7 (33.3) | 3 (25) | 7 (30.4) | 2 (66.6) | 4 (25) | 1 (33.3) |
| B3 | Penetrating | 4 (16.7) | 1 (11.1) | 3 (14.3) | 1 (8.3) | 3 (13.0) | 0 (0) | 1 (6.3) | 0 |
| p | Peri-anal | 4 (16.7) | 3 (33.3) | 2 (9.5) | 2 (16.7) | 5 (21.7) | 1 (33.3) | 2 (12.5) | 0 |
| Extent UC (n (% of UC)) | |||||||||
| E1 | Proctitis | 3 (18.8) | 1 (33.3) | 0 (0) | 1 (50) | 1 (5.6) | 1 (16.7) | 3 (21.4) | 0 |
| E2 | Left-sided | 4 (25) | 0 (0) | 3 (33.3) | 0 (0) | 9 (50) | 0 (0) | 4 (28.6) | 2 (50) |
| E3 | Pancolitis | 9 (56.3) | 2 (66.7) | 6 (66.7) | 1 (50) | 8 (44.4) | 5 (83.3) | 7 (50) | 2 (50) |
| AUC (95% CI) | Sensitivity | Specificity | PPV | NPV | p-Value | |
|---|---|---|---|---|---|---|
| Support Vector Machine classification | ||||||
| Clinical disease activity | ||||||
| A1 versus A2 | 0.62 (0.41–0.82) | 0.75 | 0.58 | 0.35 | 0.88 | 0.89 |
| A3 versus A4 | 0.53 (0.33–0.72) | 0.67 | 0.50 | 0.74 | 0.41 | 0.62 |
| Biochemical disease activity | ||||||
| B1 versus B2 | 0.75 (0.58–0.93) | 0.78 | 0.68 | 0.35 | 0.93 | 0.009 |
| B3 versus B4 | 0.86 (0.73–0.99) | 0.67 | 1 | 1 | 0.41 | 0.002 |
| Random Forest classification | ||||||
| Clinical disease activity | ||||||
| A1 versus A2 | 0.57 (0.34–0.79) | 0.5 | 0.78 | 0.4 | 0.84 | 0.76 |
| A3 versus A4 | 0.49 (0.29–0.71) | 0.93 | 0.21 | 0.72 | 0.6 | 0.51 |
| Biochemical disease activity | ||||||
| B1 versus B2 | 0.65 (0.41–0.90) | 0.67 | 0.73 | 0.35 | 0.91 | 0.076 |
| B3 versus B4 | 0.82 (0.68–0.96) | 0.63 | 1 | 1 | 0.39 | 0.004 |
Publisher’s Note: MDPI stays neutral with regard to jurisdictional claims in published maps and institutional affiliations. |
© 2022 by the authors. Licensee MDPI, Basel, Switzerland. This article is an open access article distributed under the terms and conditions of the Creative Commons Attribution (CC BY) license (https://creativecommons.org/licenses/by/4.0/).
Share and Cite
Bosch, S.; Wintjens, D.S.J.; Wicaksono, A.; Pierik, M.; Covington, J.A.; de Meij, T.G.J.; de Boer, N.K.H. Prediction of Inflammatory Bowel Disease Course Based on Fecal Scent. Sensors 2022, 22, 2316. https://doi.org/10.3390/s22062316
Bosch S, Wintjens DSJ, Wicaksono A, Pierik M, Covington JA, de Meij TGJ, de Boer NKH. Prediction of Inflammatory Bowel Disease Course Based on Fecal Scent. Sensors. 2022; 22(6):2316. https://doi.org/10.3390/s22062316
Chicago/Turabian StyleBosch, Sofie, Dion S. J. Wintjens, Alfian Wicaksono, Marieke Pierik, James A. Covington, Tim G. J. de Meij, and Nanne K. H. de Boer. 2022. "Prediction of Inflammatory Bowel Disease Course Based on Fecal Scent" Sensors 22, no. 6: 2316. https://doi.org/10.3390/s22062316