
Minimal Gluten Exposure Alters Urinary Volatile Organic Compounds in Stable Coeliac Disease

 ,
,  and
and
Abstract
:1. Introduction
2. Materials and Methods
2.1. Patients
2.2. Study Design
2.3. Sample Collection and Storage
2.4. Sample Analysis
2.4.1. FAIMS
2.4.2. GC-TOF-MS
2.4.3. TTG
2.5. Statistical Methods
3. Results
3.1. Urinary VOCs
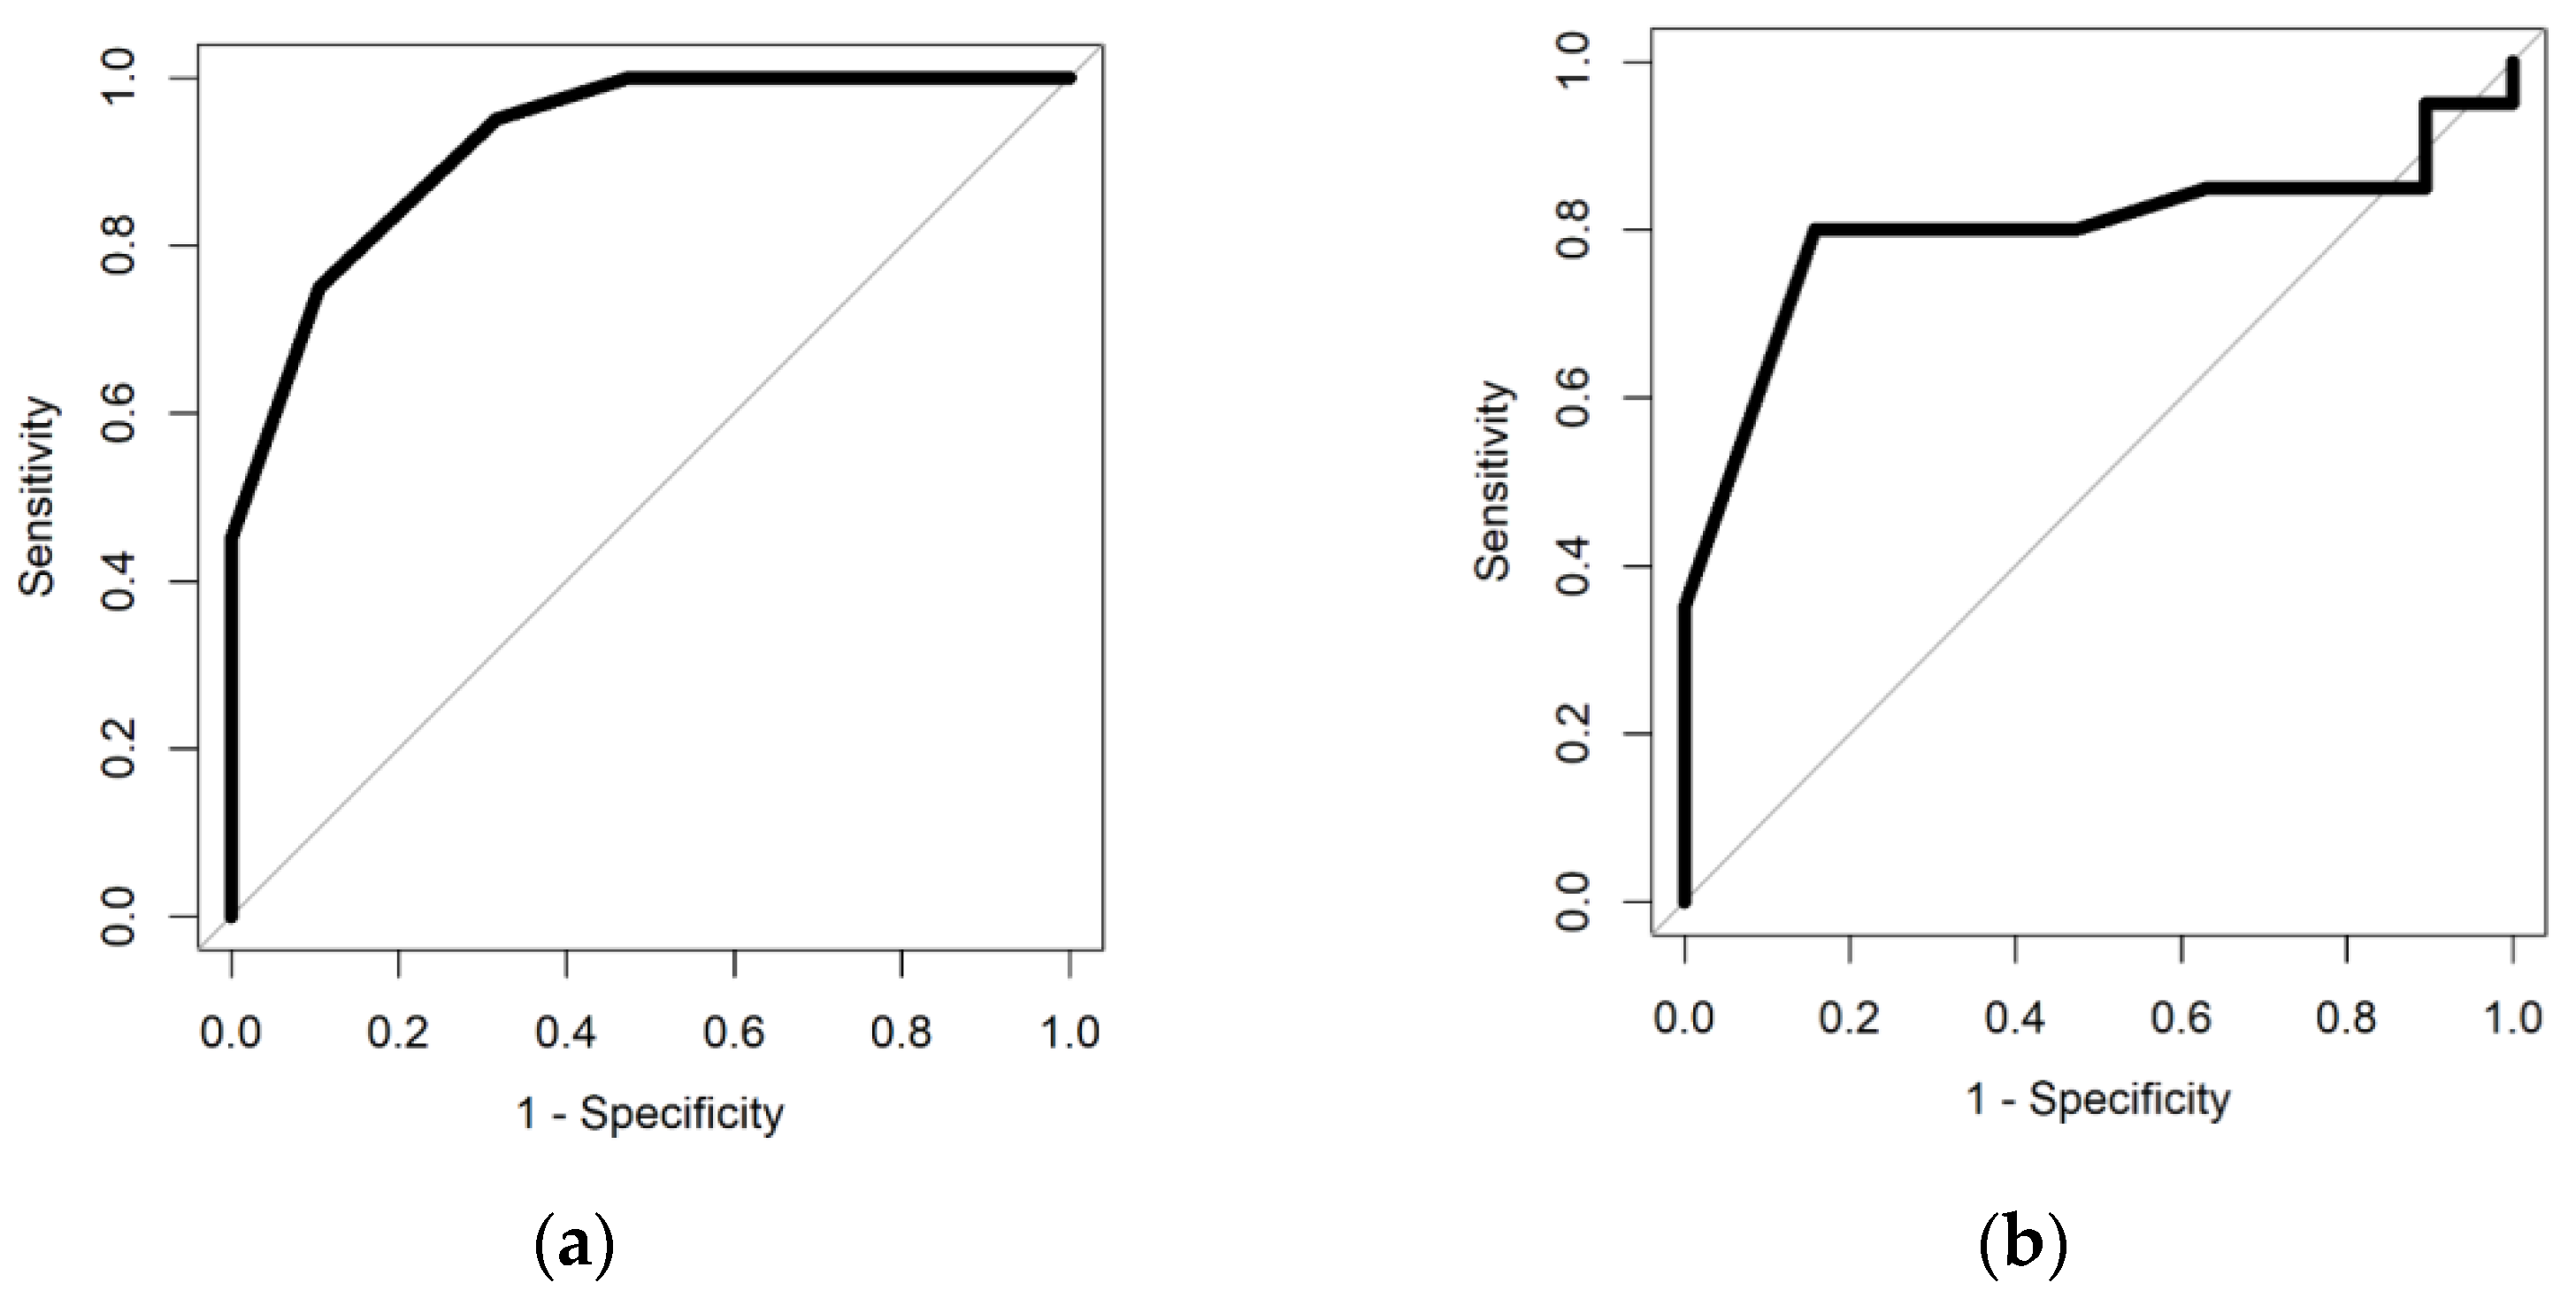
3.1.1. FAIMS
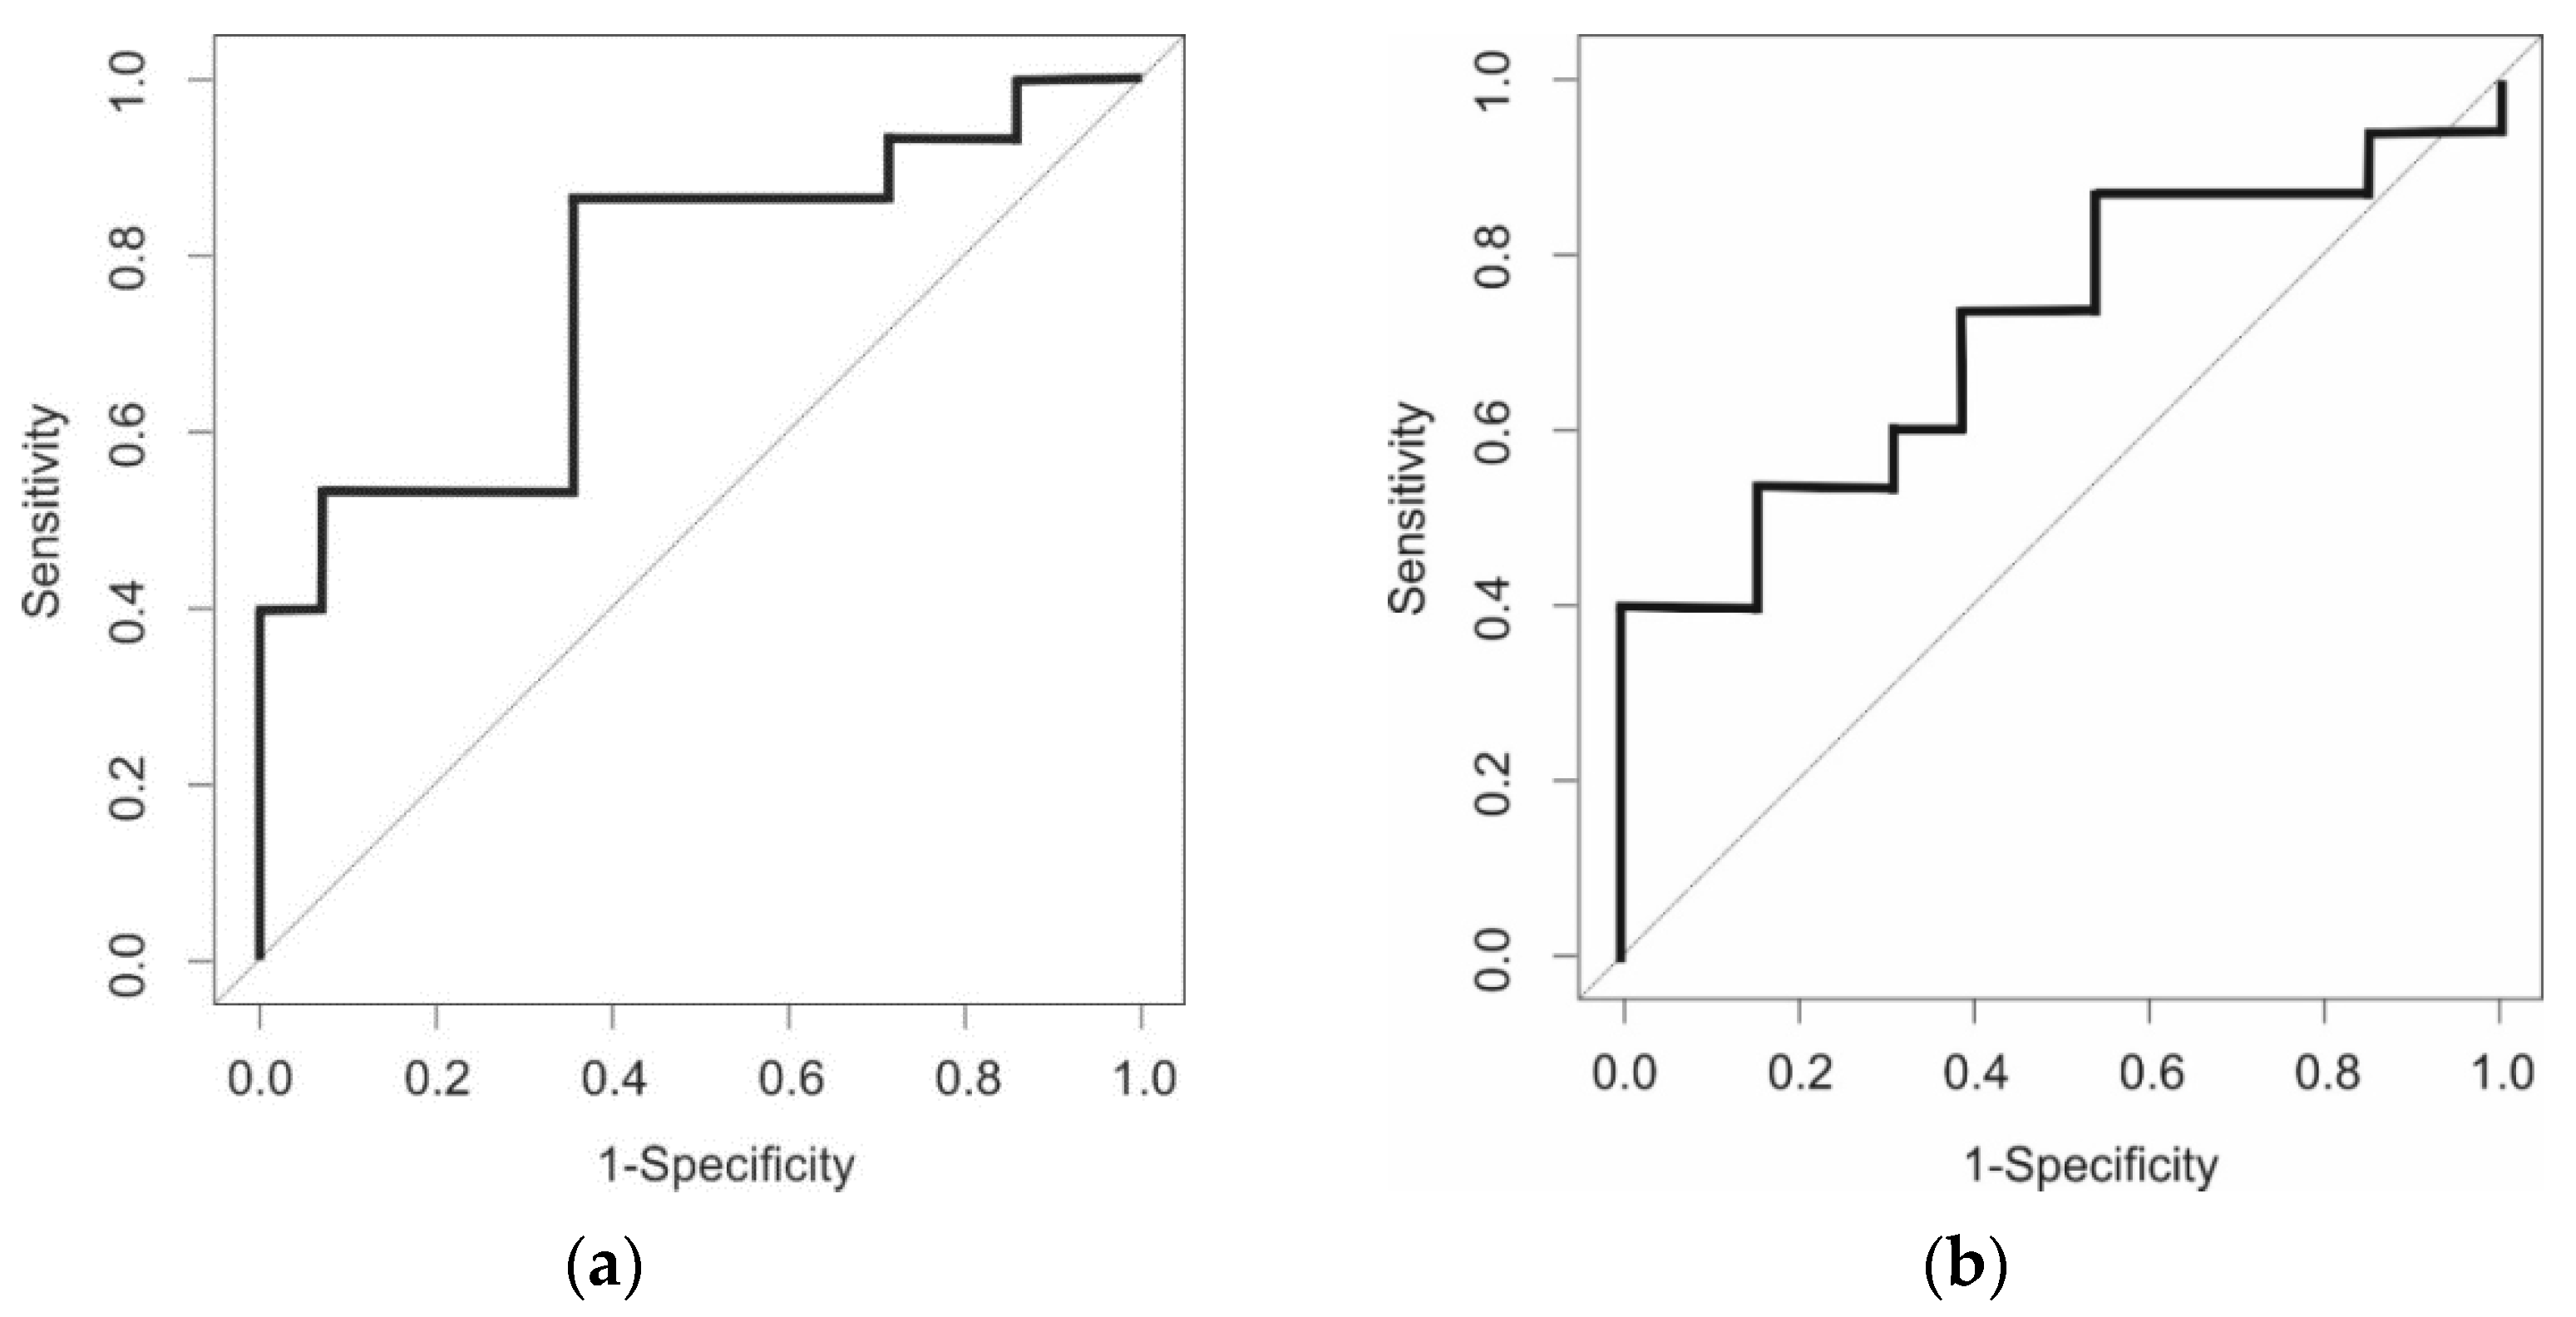
3.1.2. GC-TOF-MS
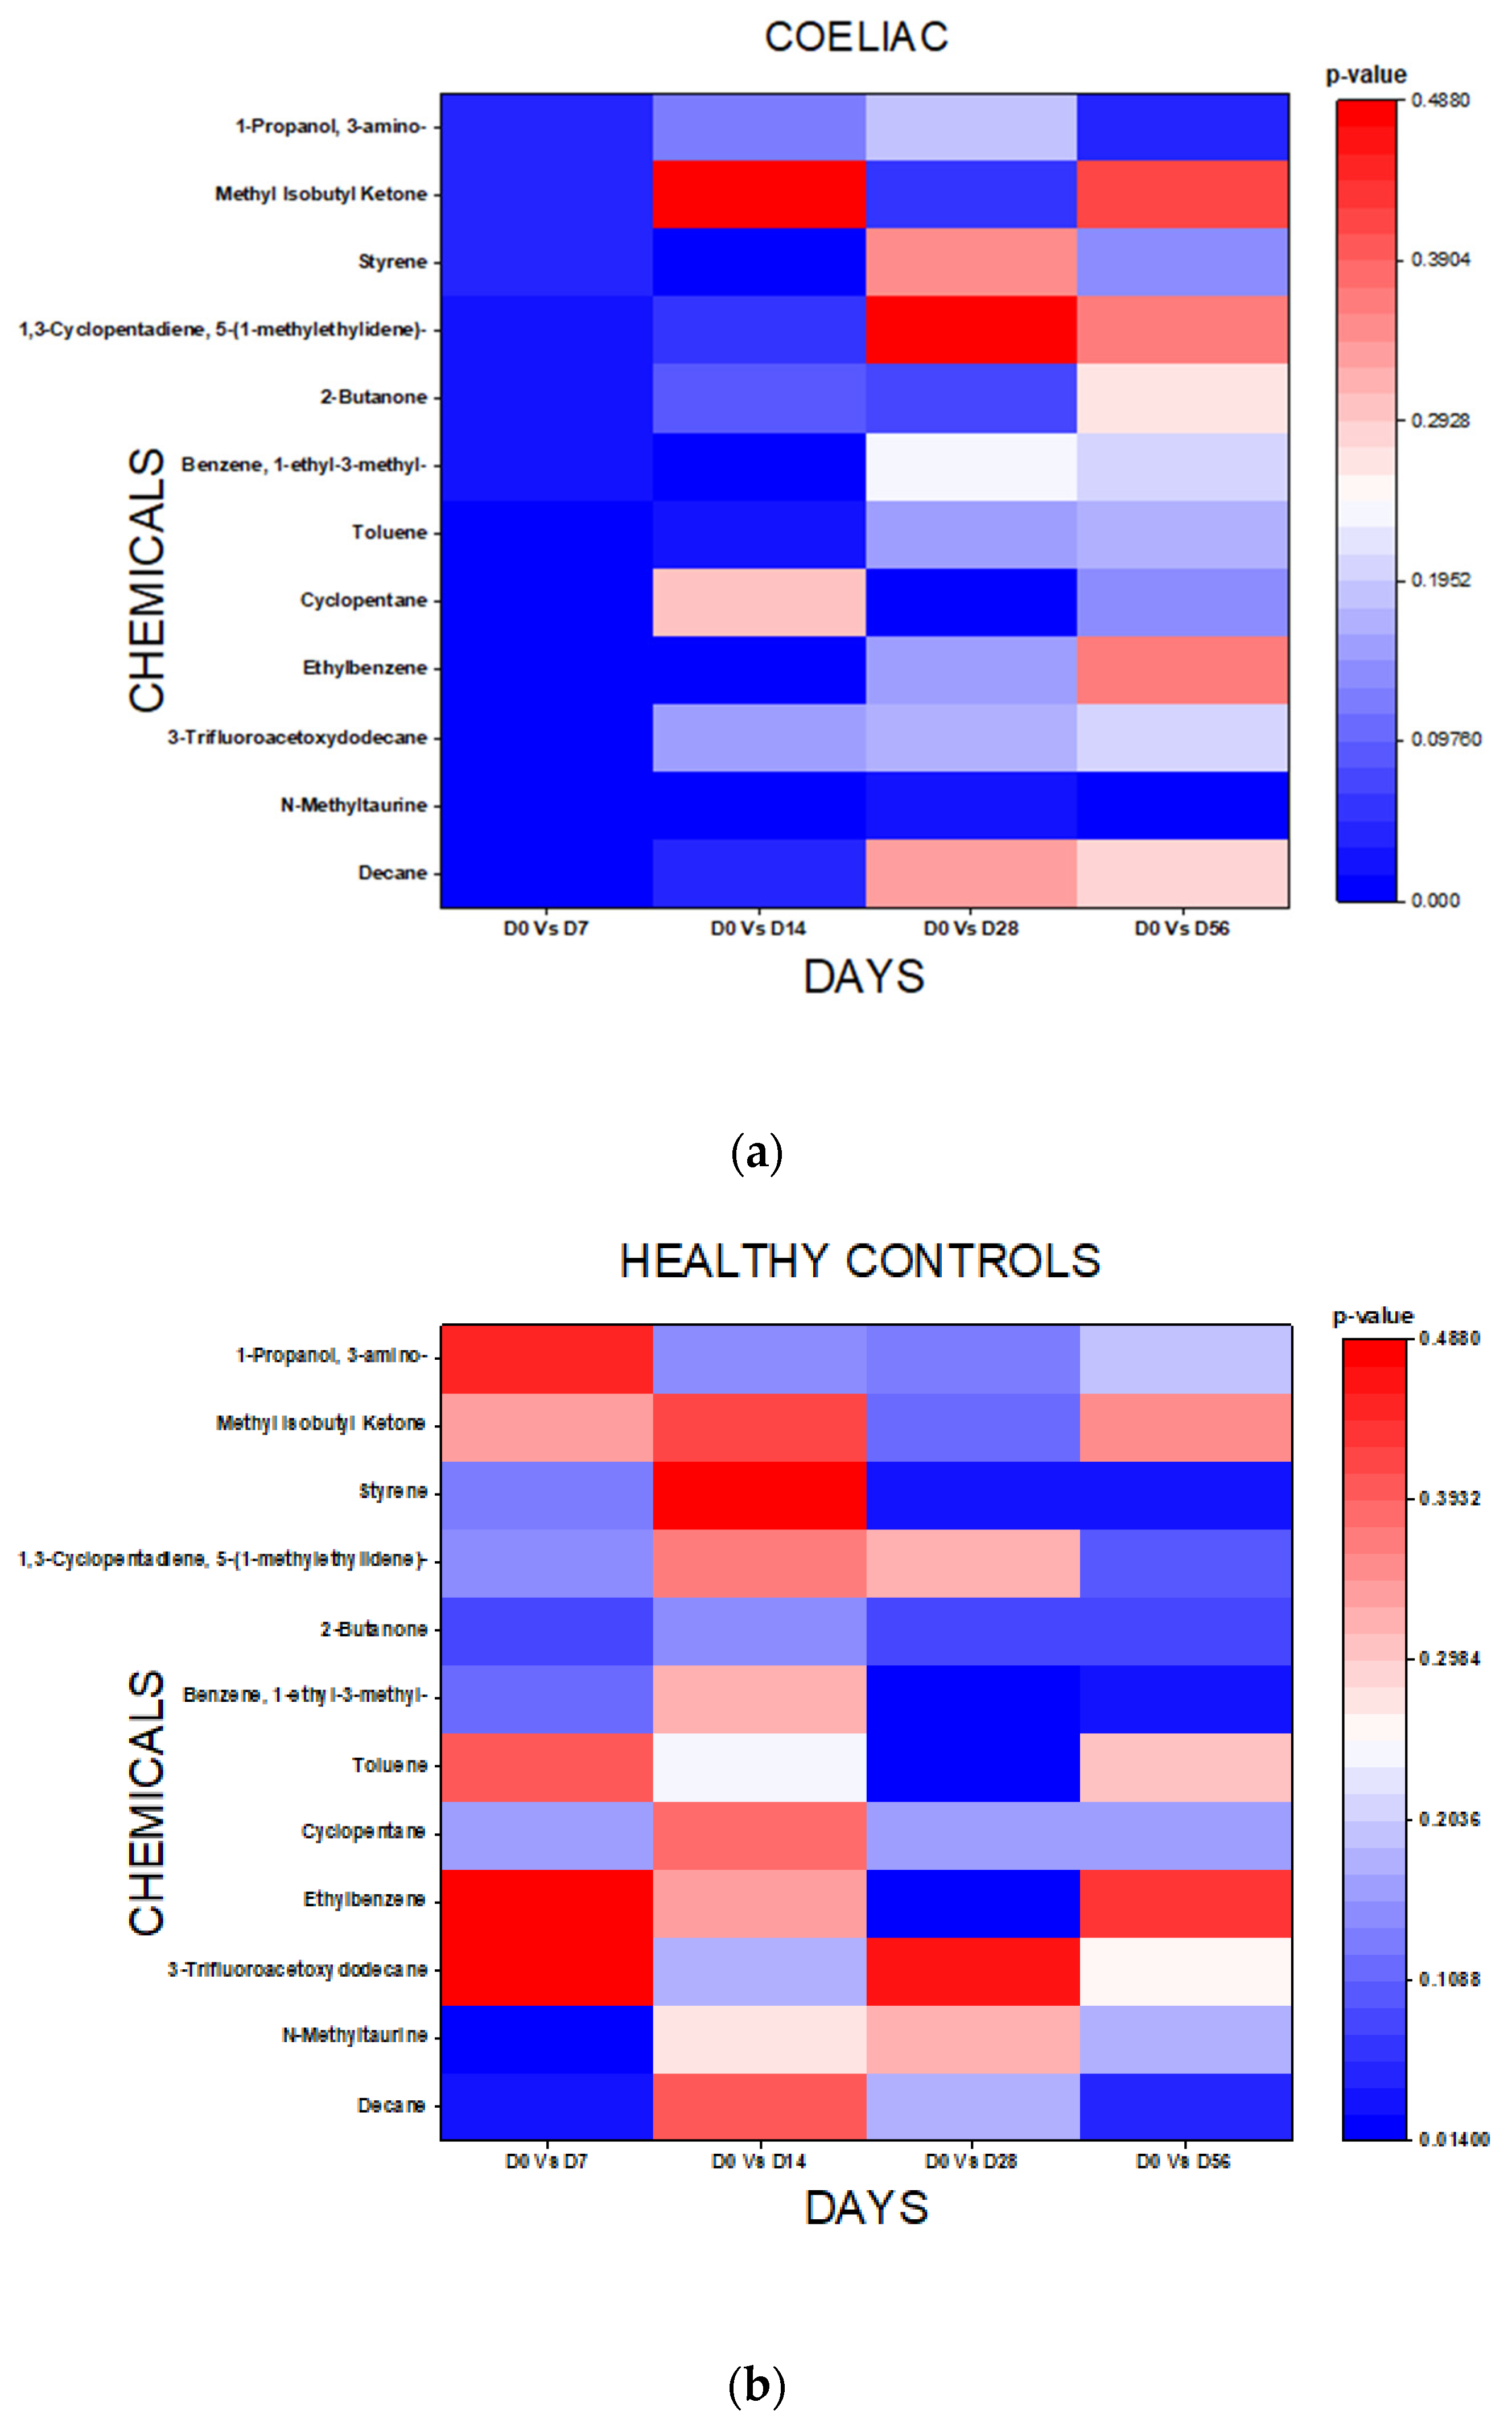
3.2. Chemical Analysis
3.3. Symptom Diaries
3.4. TTG
4. Discussion
5. Conclusions
Author Contributions
Funding
Institutional Review Board Statement
Informed Consent Statement
Data Availability Statement
Conflicts of Interest
References
- Singh, P.; Arora, A.; Strand, T.A.; Leffler, D.A.; Catassi, C.; Green, P.H.; Kelly, C.P.; Ahuja, V.; Makharia, G.K. Global Prevalence of Celiac Disease: Systematic Review and Meta-analysis. Clin. Gastroenterol. Hepatol. 2018, 16, 823–836.e2. [Google Scholar] [CrossRef] [PubMed] [Green Version]
- Harrison, E.; Li, K.K.; Petchey, M.; Nwokolo, C.; Loft, D.; Arasaradnam, R.P. Selective measurement of anti-tTG antibodies in coeliac disease and IgA deficiency: An alternative pathway. Postgrad. Med. J. 2013, 89, 4–7. [Google Scholar] [CrossRef] [PubMed] [Green Version]
- Reeves, G.E.; Squance, M.L.; Duggan, A.E.; Murugasu, R.R.; Wilson, R.J.; Wong, R.C.; Gibson, R.A.; Steele, R.H.; Pollock, W.K. Diagnostic accuracy of coeliac serological tests: A prospective study. Eur. J. Gastroenterol. Hepatol. 2006, 18, 493–501. [Google Scholar] [CrossRef] [PubMed]
- Hopper, A.D.; Hadjivassiliou, M.; Hurlstone, D.P.; Lobo, A.J.; McAlindon, M.E.; Egner, W.; Wild, G.; Sanders, D.S. What is the role of serologic testing in celiac disease? A prospective, biopsy-confirmed study with economic analysis. Clin. Gastroenterol. Hepatol. 2008, 6, 314–320. [Google Scholar] [CrossRef] [PubMed]
- Vahedi, K.; Mascart, F.; Mary, J.Y.; Laberenne, J.E.; Bouhnik, Y.; Morin, M.C.; Ocmant, A.; Velly, C.; Colombel, J.F.; Matuchansky, C. Reliability of antitransglutaminase antibodies as predictors of gluten-free diet compliance in adult celiac disease. Am. J. Gastroenterol. 2003, 98, 1079–1087. [Google Scholar] [CrossRef] [PubMed]
- Dahle, C.; Hagman, A.; Ignatova, S.; Ström, M. Antibodies against deamidated gliadin peptides identify adult coeliac disease patients negative for antibodies against endomysium and tissue transglutaminase. Aliment. Pharmacol. Ther. 2008, 32, 254–260. [Google Scholar] [CrossRef]
- McGowan, K.E.; Lyon, M.E.; Butzner, J.D. Celiac disease and IgA deficiency: Complications of serological testing approaches encountered in the clinic. Clin. Chem. 2008, 54, 1203–1209. [Google Scholar] [CrossRef] [Green Version]
- Rostrom, A.; Murray, J.; Kagnoff, M. American Gastroenterological Association (AGA) Institute technical review on the diagnosis and management of coeliac disease. Gastroenterology 2006, 131, 1981–2002. [Google Scholar] [CrossRef] [Green Version]
- Leffler, D.; Schuppan, D.; Pallav, K.; Najarian, R.; Goldsmith, J.; Hansen, J.; Kabbani, T.; Dennis, M.; Kelly, C. Kinetics of the histological, serological and symptomatic resposnes to gluten challenege in adults with coeliac disease. Gut 2013, 62, 996–1004. [Google Scholar] [CrossRef] [Green Version]
- Leonard, M.M.; Silvester, J.A.; Leffler, D.; Fasano, A.; Kelly, C.P.; Lewis, S.K.; Goldsmith, J.D.; Greenblatt, E.; Kwok, W.W.; McAuliffe, W.J.; et al. Evaluating Responses to Gluten Challenge: A Randomized, Double-Blind, 2-Dose Gluten Challenge Trial. Gastroenterology 2021, 160, 720–733.e8. [Google Scholar] [CrossRef]
- Sarna, V.K.; Skodje, G.I.; Reims, H.M.; Risnes, L.F.; Dahal-Koirala, S.; Sollid, L.M.; Lundin, K.E.A. HLA-DQ:gluten tetramer test in blood gives better detection of coeliac patients than biopsy after 14-day gluten challenge. Gut 2018, 67, 1606–1613. [Google Scholar] [CrossRef] [PubMed] [Green Version]
- Peng, G.; Hakim, M.; Broza, Y.Y.; Billan, S.; Abdah-Bortnyak, R.; Kuten, A.; Tisch, U.; Haick, H. Detection of lung, breast, colorectal, and prostate cancers from exhaled breath using a single array of nanosensors. Br. J. Cancer 2010, 103, 542–551. [Google Scholar] [CrossRef]
- De Meij, T.G.; Larbi, I.B.; van der Schee, M.P.; Lentferink, Y.E.; Paff, T.; Terhaar sive Droste, J.S.; Mulder, C.J.; van Bodegraven, A.A.; de Boer, N.K. Electronic nose can discriminate colorectal carcinoma advanced adenomas by fecal volatile biomarker analysis: Proof of principle study. Int. J. Cancer 2014, 134, 1013–1255. [Google Scholar]
- Arasaradnam, R.P.; Ouaret, N.; Thomas, M.; Quraishi, N.; Heatherington, E.; Nwokolo, C.U.; Bardhan, K.D.; Covington, J. A novel tool for noninvasive diagnosis and tracking of patients with inflammatory bowel disease. Inflamm. Bowel Dis. 2013, 19, 999–1003. [Google Scholar] [CrossRef]
- Covington, J.A.; Wedlake, L.; Andreyev, J.; Ouaret, N.; Thomas, M.G.; Nwokolo, C.U.; Bardhan, K.D.; Arasaradnam, R.P. The detection of patients at risk of gastrointestinal toxicity during pelvic radiotherapy by electronic nose and FAIMS: A pilot study. Sensors 2012, 12, 13002–13018. [Google Scholar] [CrossRef] [PubMed] [Green Version]
- Covington, J.A.; Westenbrink, E.W.; Ouaret, N.; Harbord, R.; Bailey, C.; O’Connell, N.; Cullis, J.; Williams, N.; Nwokolo, C.U.; Bardhan, K.D.; et al. Application of a novel tool for diagnosing bile acid diarrhoea. Sensors 2013, 13, 11899–11912. [Google Scholar] [CrossRef] [PubMed]
- Arasaradnam, R.P.; Covington, J.; Harmston, C.; Nwokolo, C.U. Next generation diagnostic modalities in gastroenterology—Gas phase volatile compound biomarker detection. Aliment. Pharmacol. Ther. 2014, 39, 780–789. [Google Scholar] [CrossRef]
- Arasaradnam, R.P.; Westenbrink, E.; McFarlane, M.J.; Harbord, R.; Chambers, S.; O’Connell, N.; Bailey, C.; Nwokolo, C.U.; Bardhan, K.D.; Savage, R.; et al. Differentiating coeliac disease from irritable bowel syndrome by urinary volatile organic compound analysis—A pilot study. PLoS ONE 2014, 9, e107312. [Google Scholar] [CrossRef]
- Rouvroye, M.D.; Wicaksono, A.; Bosch, S.; Savelkoul, E.; Covington, J.A.; Beaumont, H.; Mulder, C.J.; Bouma, G.; de Meij, T.G.J.; de Boer, N.K.H. Faecal Scent as a Novel Non-Invasive Biomarker to Discriminate between Coeliac Disease and Refractory Coeliac Disease: A Proof of Principle Study. Biosensors 2019, 9, 69. [Google Scholar] [CrossRef] [Green Version]
- Bruins, M.J. The clinical response to gluten challenge: A review of the literature. Nutrients 2013, 5, 4614–4641. [Google Scholar] [CrossRef]
- Bannaga, A.S.; Tyagi, H.; Daulton, E.; Covington, J.A.; Arasaradnam, R.P. Exploratory Study Using Urinary Volatile Organic Compounds for the Detection of Hepatocellular Carcinoma. Molecules 2021, 26, 2447. [Google Scholar] [CrossRef] [PubMed]
- McFarlane, M.; Mozdiak, E.; Daulton, E.; Arasaradnam, R.; Covington, J.; Nwokolo, C. Pre-analytical and analytical variables that influence urinary volatile organic compound measurements. PLoS ONE 2020, 15, e0236591. [Google Scholar] [CrossRef] [PubMed]
- Meister, I.; Zhang, P.; Sinha, A.; Sköld, C.M.; Wheelock, M.; Izumi, T.; Chaleckis, R.; Wheelock, C.E. High-Precision Automated Workflow for Urinary Untargeted Metabolomic Epidemiology. Anal. Chem. 2021, 93, 5248–5258. [Google Scholar] [CrossRef] [PubMed]
- Francavilla, R.; Ercolini, D.; Piccolo, M.; Vannini, L.; Siragusa, S.; De Filippis, F.; De Pasquale, I.; Di Cagno, R.; Di Toma, M.; Gozzi, G.; et al. Salivary microbiota and metabolome associated with celiac disease. Appl. Environ. Microbiol. 2014, 80, 3416–3425. [Google Scholar] [CrossRef] [Green Version]
- Di Cagno, R.; Rizzello, C.G.; Gagliardi, F.; Ricciuti, P.; Ndagijimana, M.; Francavilla, R.; Guerzoni, M.E.; Crecchio, C.; Gobbetti, M.; De Angelis, M. Different fecal microbiotas and volatile organic compounds in treated and untreated children with celiac disease. Appl. Environ. Microbiol. 2009, 75, 3963–3971. [Google Scholar] [CrossRef] [Green Version]
- Valitutti, F.; Cucchiara, S.; Fasano, A. Celiac Disease and the Microbiome. Nutrients 2019, 11, 2403. [Google Scholar] [CrossRef] [Green Version]
- Goel, G.; Tye-Din, J.A.; Qiao, S.W.; Russell, A.K.; Mayassi, T.; Ciszewski, C.; Sarna, V.K.; Wang, S.; Goldstein, K.E.; Dzuris, J.L.; et al. Cytokine release and gastrointestinal symptoms after gluten challenge in celiac disease. Sci. Adv. 2019, 5, eaaw7756. [Google Scholar] [CrossRef] [Green Version]


| Day | Gluten Challenge (Cohort 1) | Controls (Cohort 2) |
|---|---|---|
| Day 0 | Provide urine and Blood (TTG) sample | Provide urine and Blood (TTG) sample |
| Day 1 | Begin GCh | Remain on GFD |
| Day 7 | Provide urine sample | Provide urine sample |
| Day 14 | Complete GCh Provide urine and Blood (TTG) sample | Provide urine and Blood (TTG) sample |
| Day 15 | Return to GFD | - |
| Day 28 | Provide urine sample | Provide urine sample |
| Day 56 | Provide urine and Blood (TTG) sample | Provide urine and Blood (TTG) sample |
| Day 57 | End of study | End of study |
| Demographic | GCh Patients (n = 19) | Non-GCh Patients (n = 17) |
|---|---|---|
| Mean age in years (SD) | 60.8 (13.1) | 60.1 (13.3) |
| Sex (M:F) | 9:11 | 5:15 |
| Mean BMI (SD) | 27.2 (5.6) | 27.5 (4.0) |
| Mean Cigarettes Smoked/day (SD) | 0 (0) | 0 (0) |
| Mean Alcohol Units/week (SD) | 4.3 (4.2) | 4.14 (3.8) |
| FAIMS Sparse Logistic Regression 100 Features | |||||||
|---|---|---|---|---|---|---|---|
| AUC (±95% CI) | Sensitivity (±95% CI) | Specificity (±95% CI) | PPV | NPV | p Values | ||
| GCh | Day 0 | ||||||
| Day 7 | 0.92 (0.85–0.99) | 0.75 (0.51–0.91) | 0.89 (0.69–0.99) | 0.88 | 0.77 | 0.000002 | |
| Day 14 | 0.80 (0.64–0.95) | 0.80 (0.56–0.94) | 0.84 (0.60–0.97) | 0.84 | 0.80 | 0.0006 | |
| Day 28 | 0.71 (0.53–0.89) | 0.94 (0.71–0.99) | 0.47 (0.24–0.71) | 0.61 | 0.90 | 0.014 | |
| Day 56 | 0.77 (0.62–0.93) | 0.73 (0.44–0.92) | 0.68 (0.43–0.87) | 0.65 | 0.76 | 0.003 | |
| Non-GCh | Day 0 | ||||||
| Day 7 | 0.79 (0.63–0.95) | 0.69 (0.41–0.89) | 0.86 (0.57–0.98) | 0.85 | 0.71 | 0.002 | |
| Day 14 | 0.40 (0.18–0.61) | 0.56 (0.30–0.80) | 0.57 (0.29–0.82) | 0.60 | 0.53 | 0.84 | |
| Day 28 | 0.52 (0.29–0.76) | 1 (0.71–1) | 0.21 (0.05–0.51) | 0.50 | 1 | 0.52 | |
| Day 56 | 0.58 (0.34–0.83) | 0.27 (0.06–0.61) | 1 (0.77–1) | 1 | 0.64 | 0.25 | |
| GC-TOF-MS | |||||||
|---|---|---|---|---|---|---|---|
| AUC (±95% CI) | Sensitivity (±95% CI) | Specificity (±95% CI) | PPV | NPV | p Values | ||
| GCh patients | Day 0 | ||||||
| Day 7 | 0.75 (0.59–0.89) | 0.65 (0.44–0.83) | 0.64 (0.42–0.85) | 0.69 | 0.60 | 0.02 | |
| Day 14 | 0.71 (0.53–0.87) | 0.71 (0.52–0.88) | 0.69 (0.45–0.90) | 0.75 | 0.64 | 0.05 | |
| Day 28 | 0.55 (0.38–0.74) | 0.65 (0.44–0.84) | 0.54 (0.31–0.78) | 0.65 | 0.54 | 0.63 | |
| Day 56 | 0.51 (0.31–0.70) | 0.71 (0.50–0.88) | 0.54 (0.30–0.75) | 0.67 | 0.58 | 0.93 | |
| Non-GCh patients | Day 0 | ||||||
| Day 7 | 0.48 (0.27–0.69) | 0.62 (0.38–0.83) | 0.22 (0.00–0.50) | 0.53 | 0.29 | 0.89 | |
| Day 14 | 0.44 (0.25–0.65) | 0.38 (0.15–0.62) | 0.38 (0.17–0.62) | 0.38 | 0.38 | 0.70 | |
| Day 28 | 0.46 (0.26–0.67) | 0.62 (0.38–0.83) | 0.33 (0.10–0.60) | 0.57 | 0.38 | 0.76 | |
| Day 56 | 0.53 (0.31–0.74) | 0.62 (0.38–0.83) | 0.33 (0.10–0.60) | 0.57 | 0.38 | 0.84 | |
| Day 0 | Day 14 | Day 56 | |
|---|---|---|---|
| GCh patients Mean TTG (U/mL) (SD) | 2.43 (3.11) | 3.60 (5.59) | 3.58 (5.41) |
| Control Cohort Mean TTG (U/mL) (SD) | 1.17 (0.38) | 1.29 (0.59) | 1.10 (0.28) |
Publisher’s Note: MDPI stays neutral with regard to jurisdictional claims in published maps and institutional affiliations. |
© 2022 by the authors. Licensee MDPI, Basel, Switzerland. This article is an open access article distributed under the terms and conditions of the Creative Commons Attribution (CC BY) license (https://creativecommons.org/licenses/by/4.0/).
Share and Cite
McFarlane, M.; Arasaradnam, R.P.; Reed, B.; Daulton, E.; Wicaksono, A.; Tyagi, H.; Covington, J.A.; Nwokolo, C. Minimal Gluten Exposure Alters Urinary Volatile Organic Compounds in Stable Coeliac Disease. Sensors 2022, 22, 1290. https://doi.org/10.3390/s22031290
McFarlane M, Arasaradnam RP, Reed B, Daulton E, Wicaksono A, Tyagi H, Covington JA, Nwokolo C. Minimal Gluten Exposure Alters Urinary Volatile Organic Compounds in Stable Coeliac Disease. Sensors. 2022; 22(3):1290. https://doi.org/10.3390/s22031290
Chicago/Turabian StyleMcFarlane, Michael, Ramesh P. Arasaradnam, Beryl Reed, Emma Daulton, Alfian Wicaksono, Heena Tyagi, James A. Covington, and Chuka Nwokolo. 2022. "Minimal Gluten Exposure Alters Urinary Volatile Organic Compounds in Stable Coeliac Disease" Sensors 22, no. 3: 1290. https://doi.org/10.3390/s22031290