
Simultaneous Sensitive Determination of δ13C, δ18O, and δ17O in Human Breath CO2 Based on ICL Direct Absorption Spectroscopy

 , , and
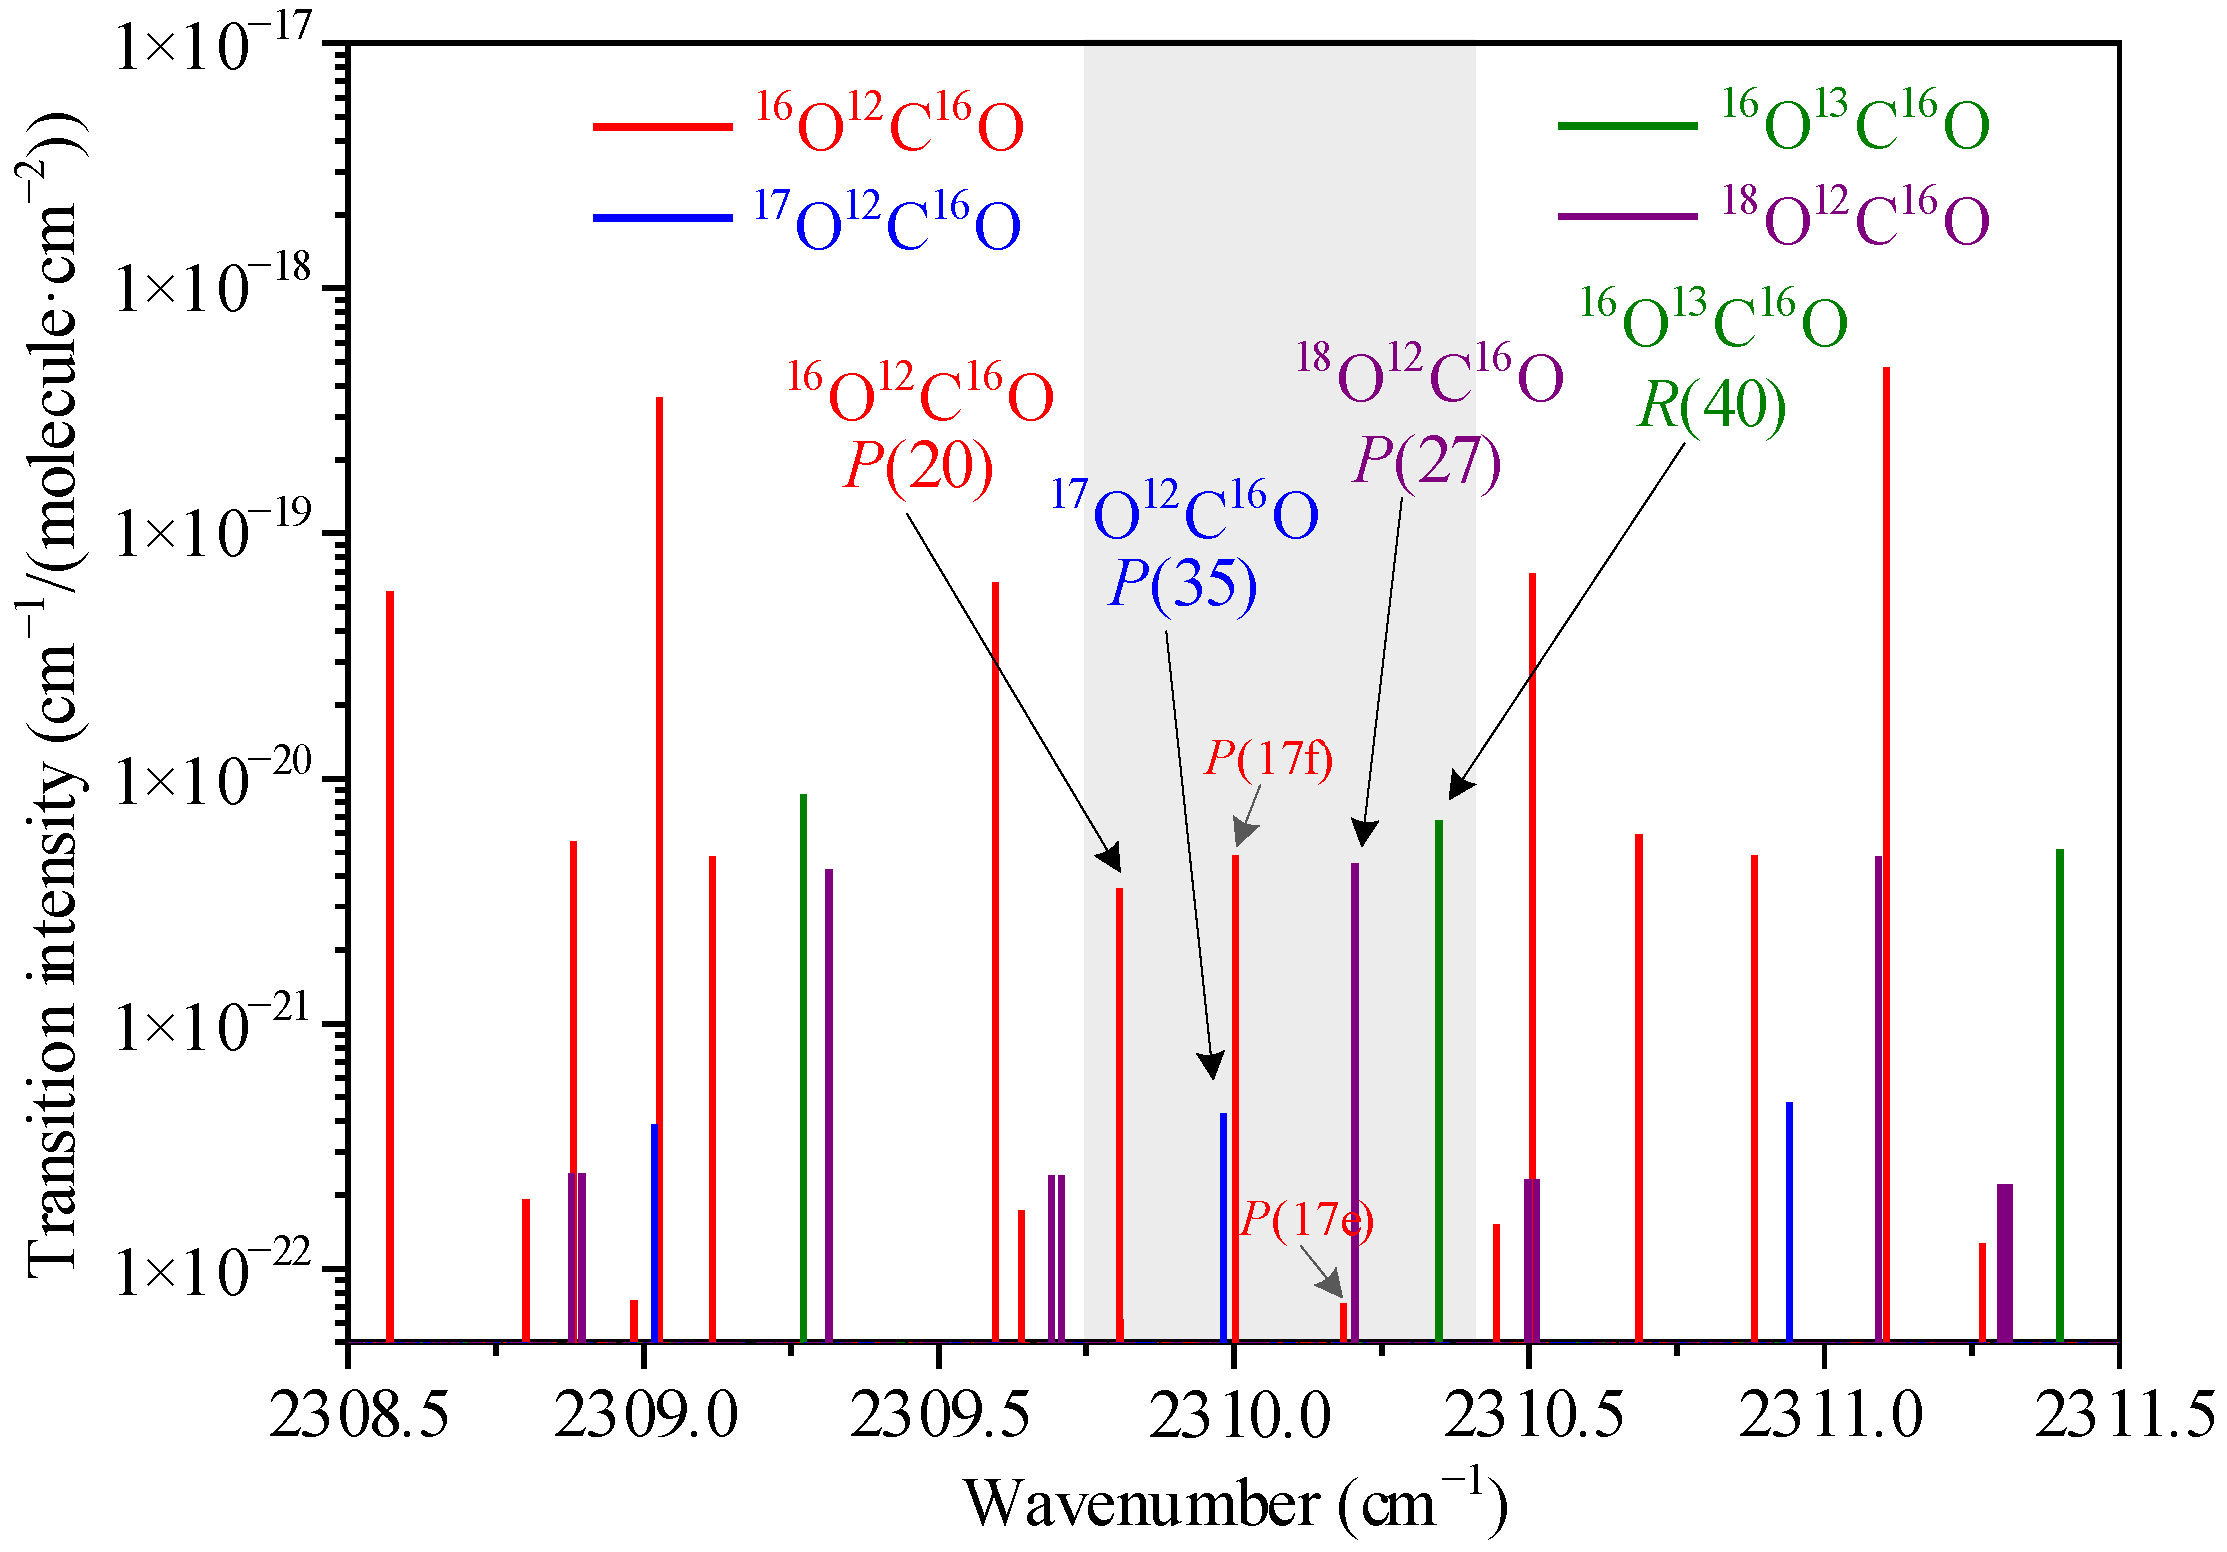
Abstract
:1. Introduction
2. Isotopes Experimental Theory
3. Sensor Structure and Optimization
3.1. Transitions Selection
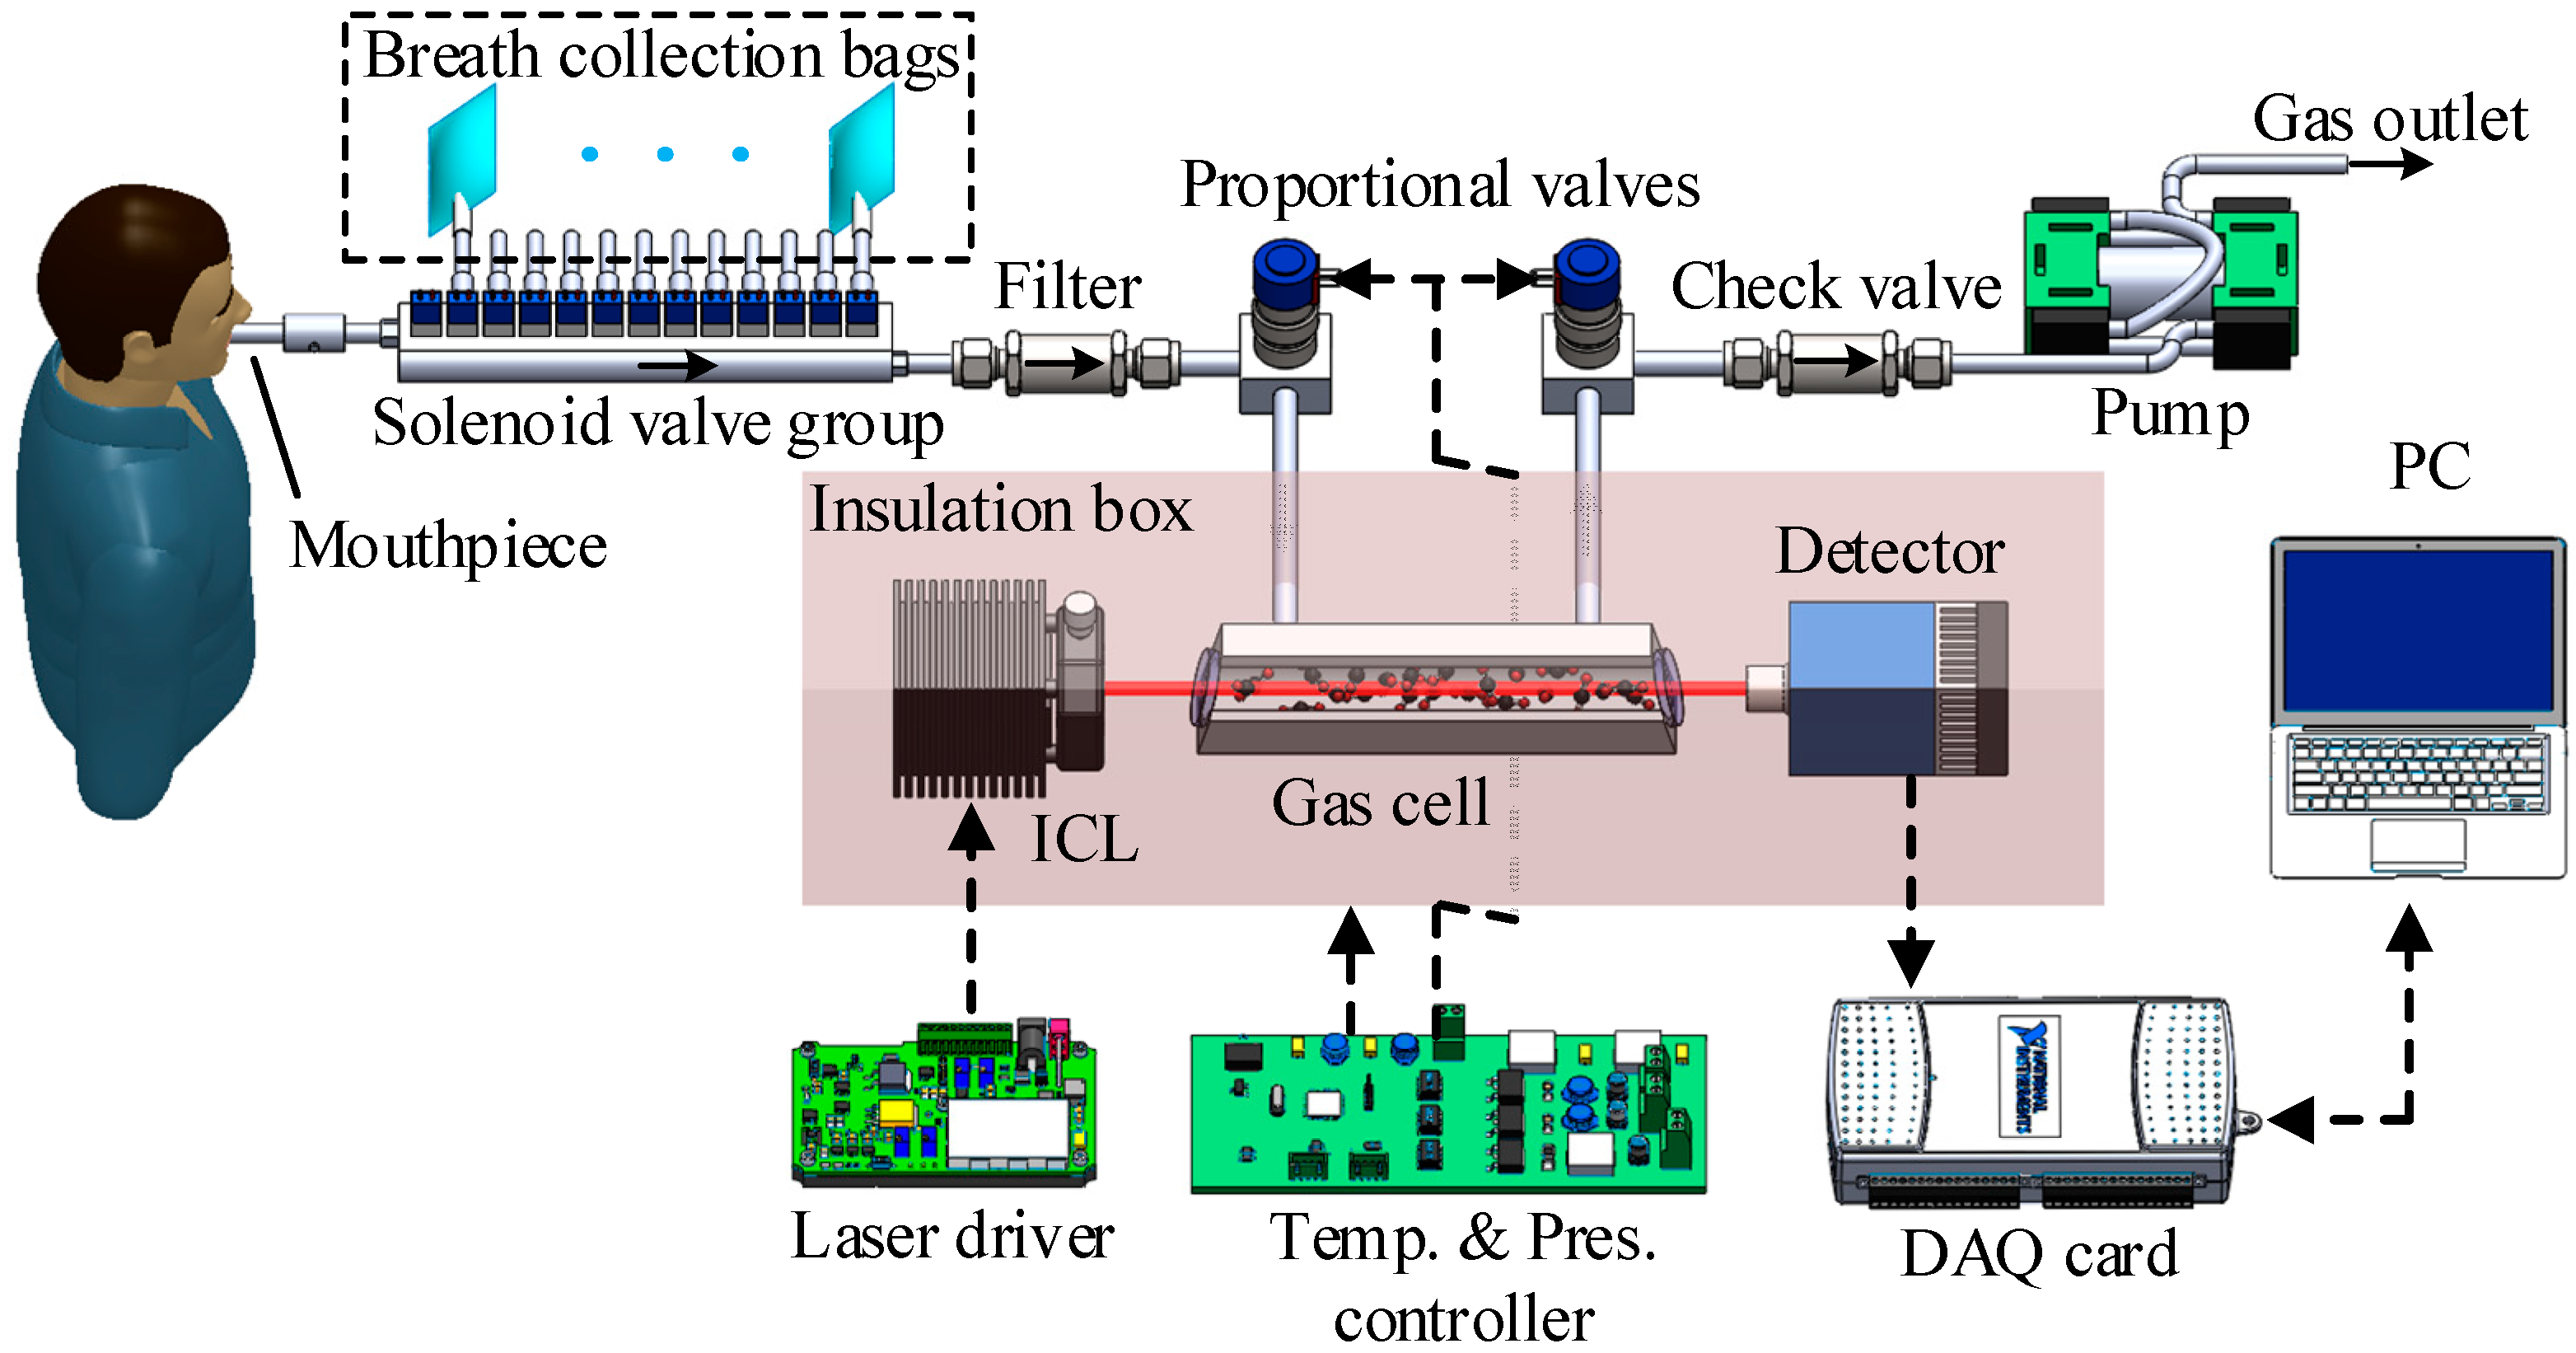
3.2. Experimental Setup
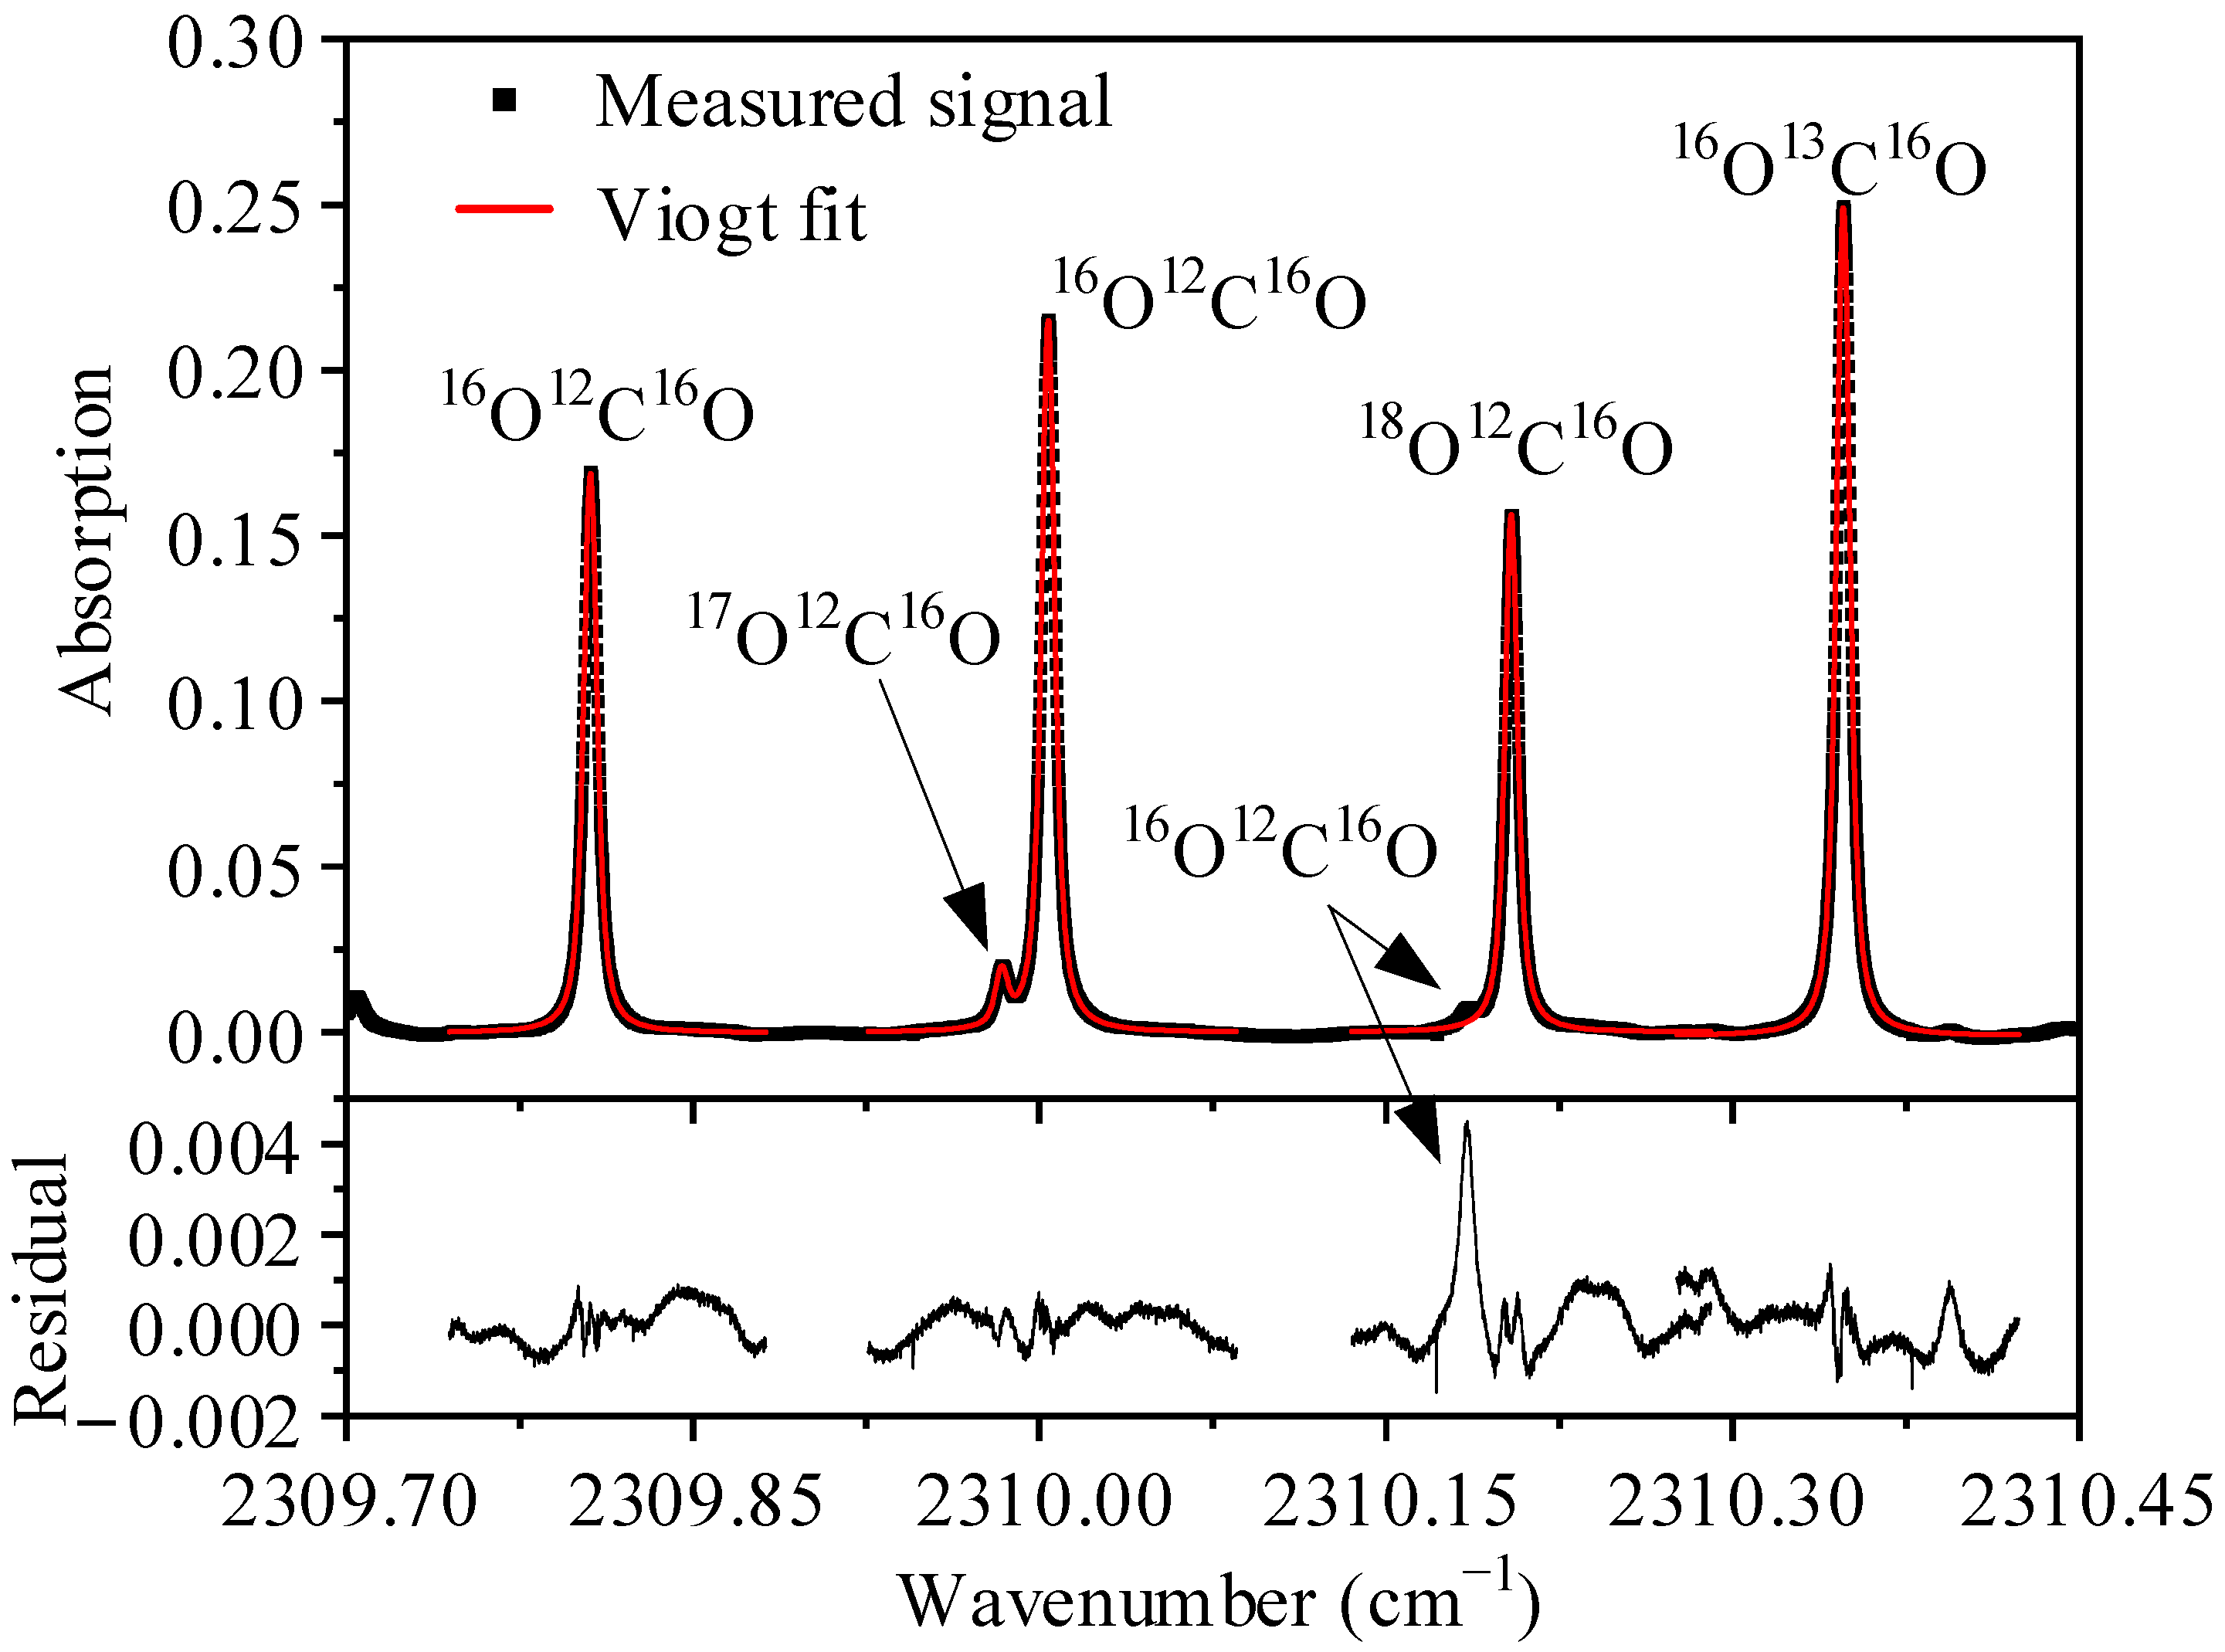
3.3. Spectrometer Optimization
4. Sensor Performance
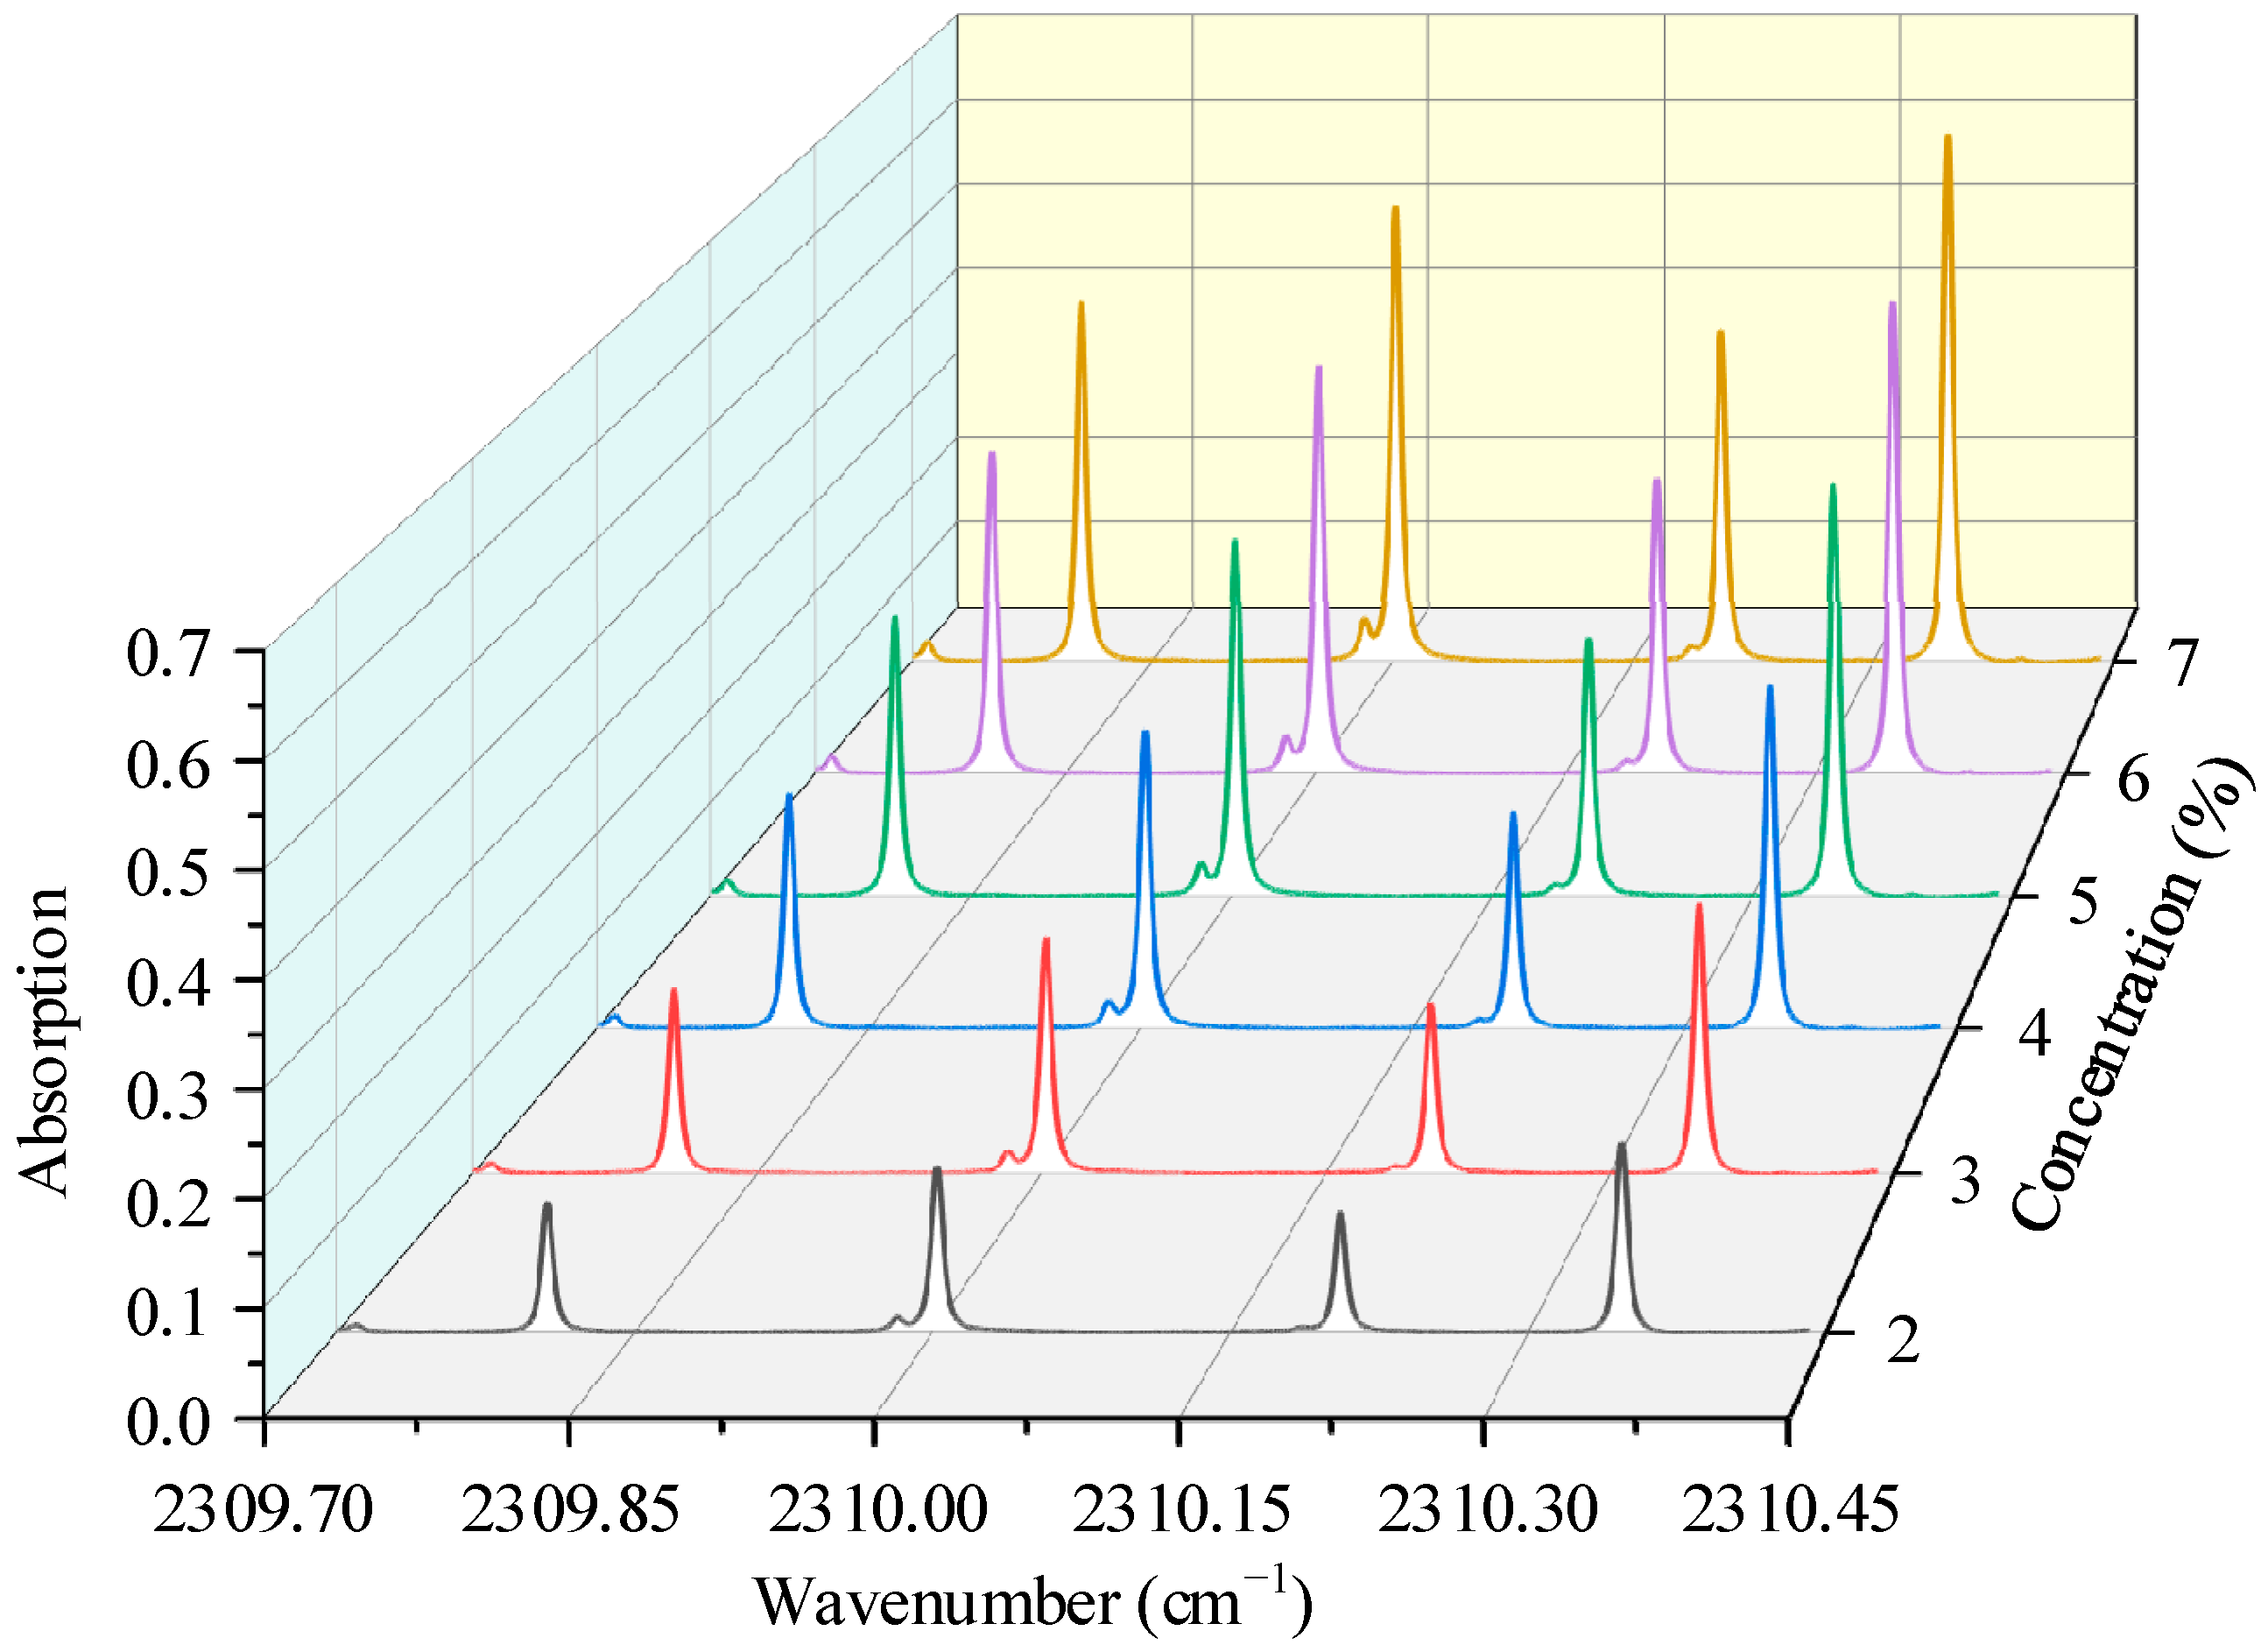
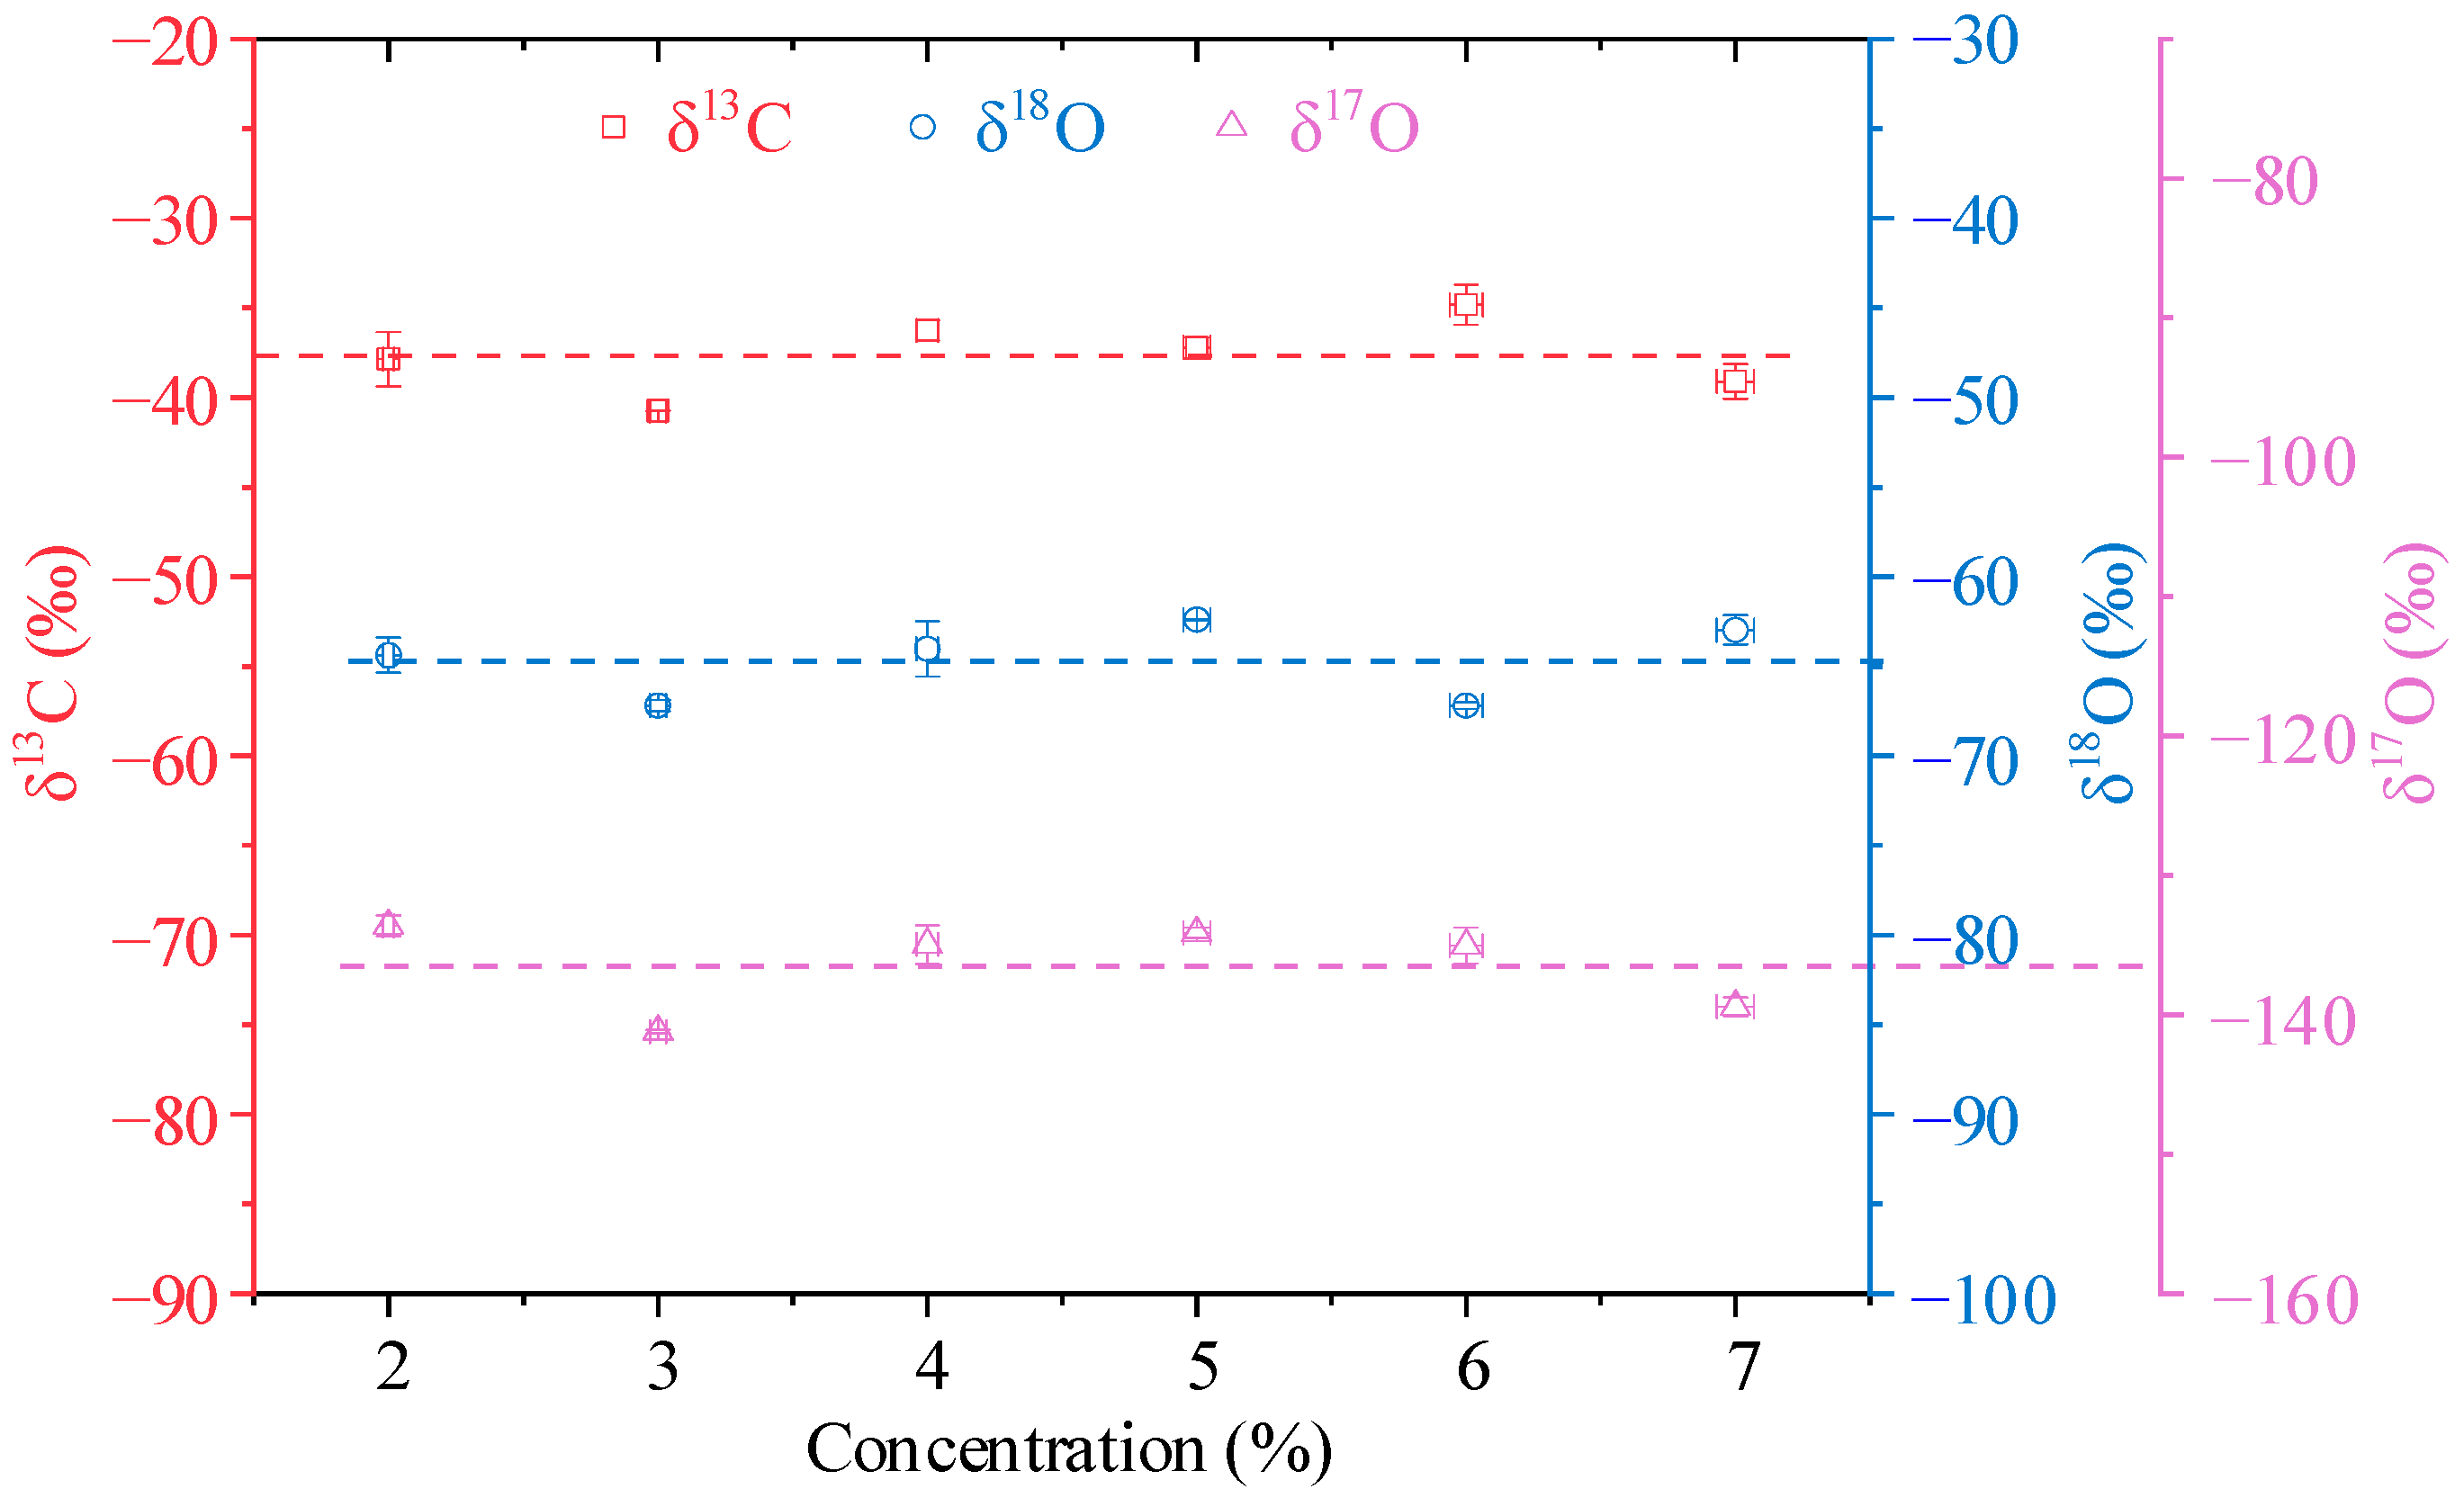
4.1. Concentration Dependence
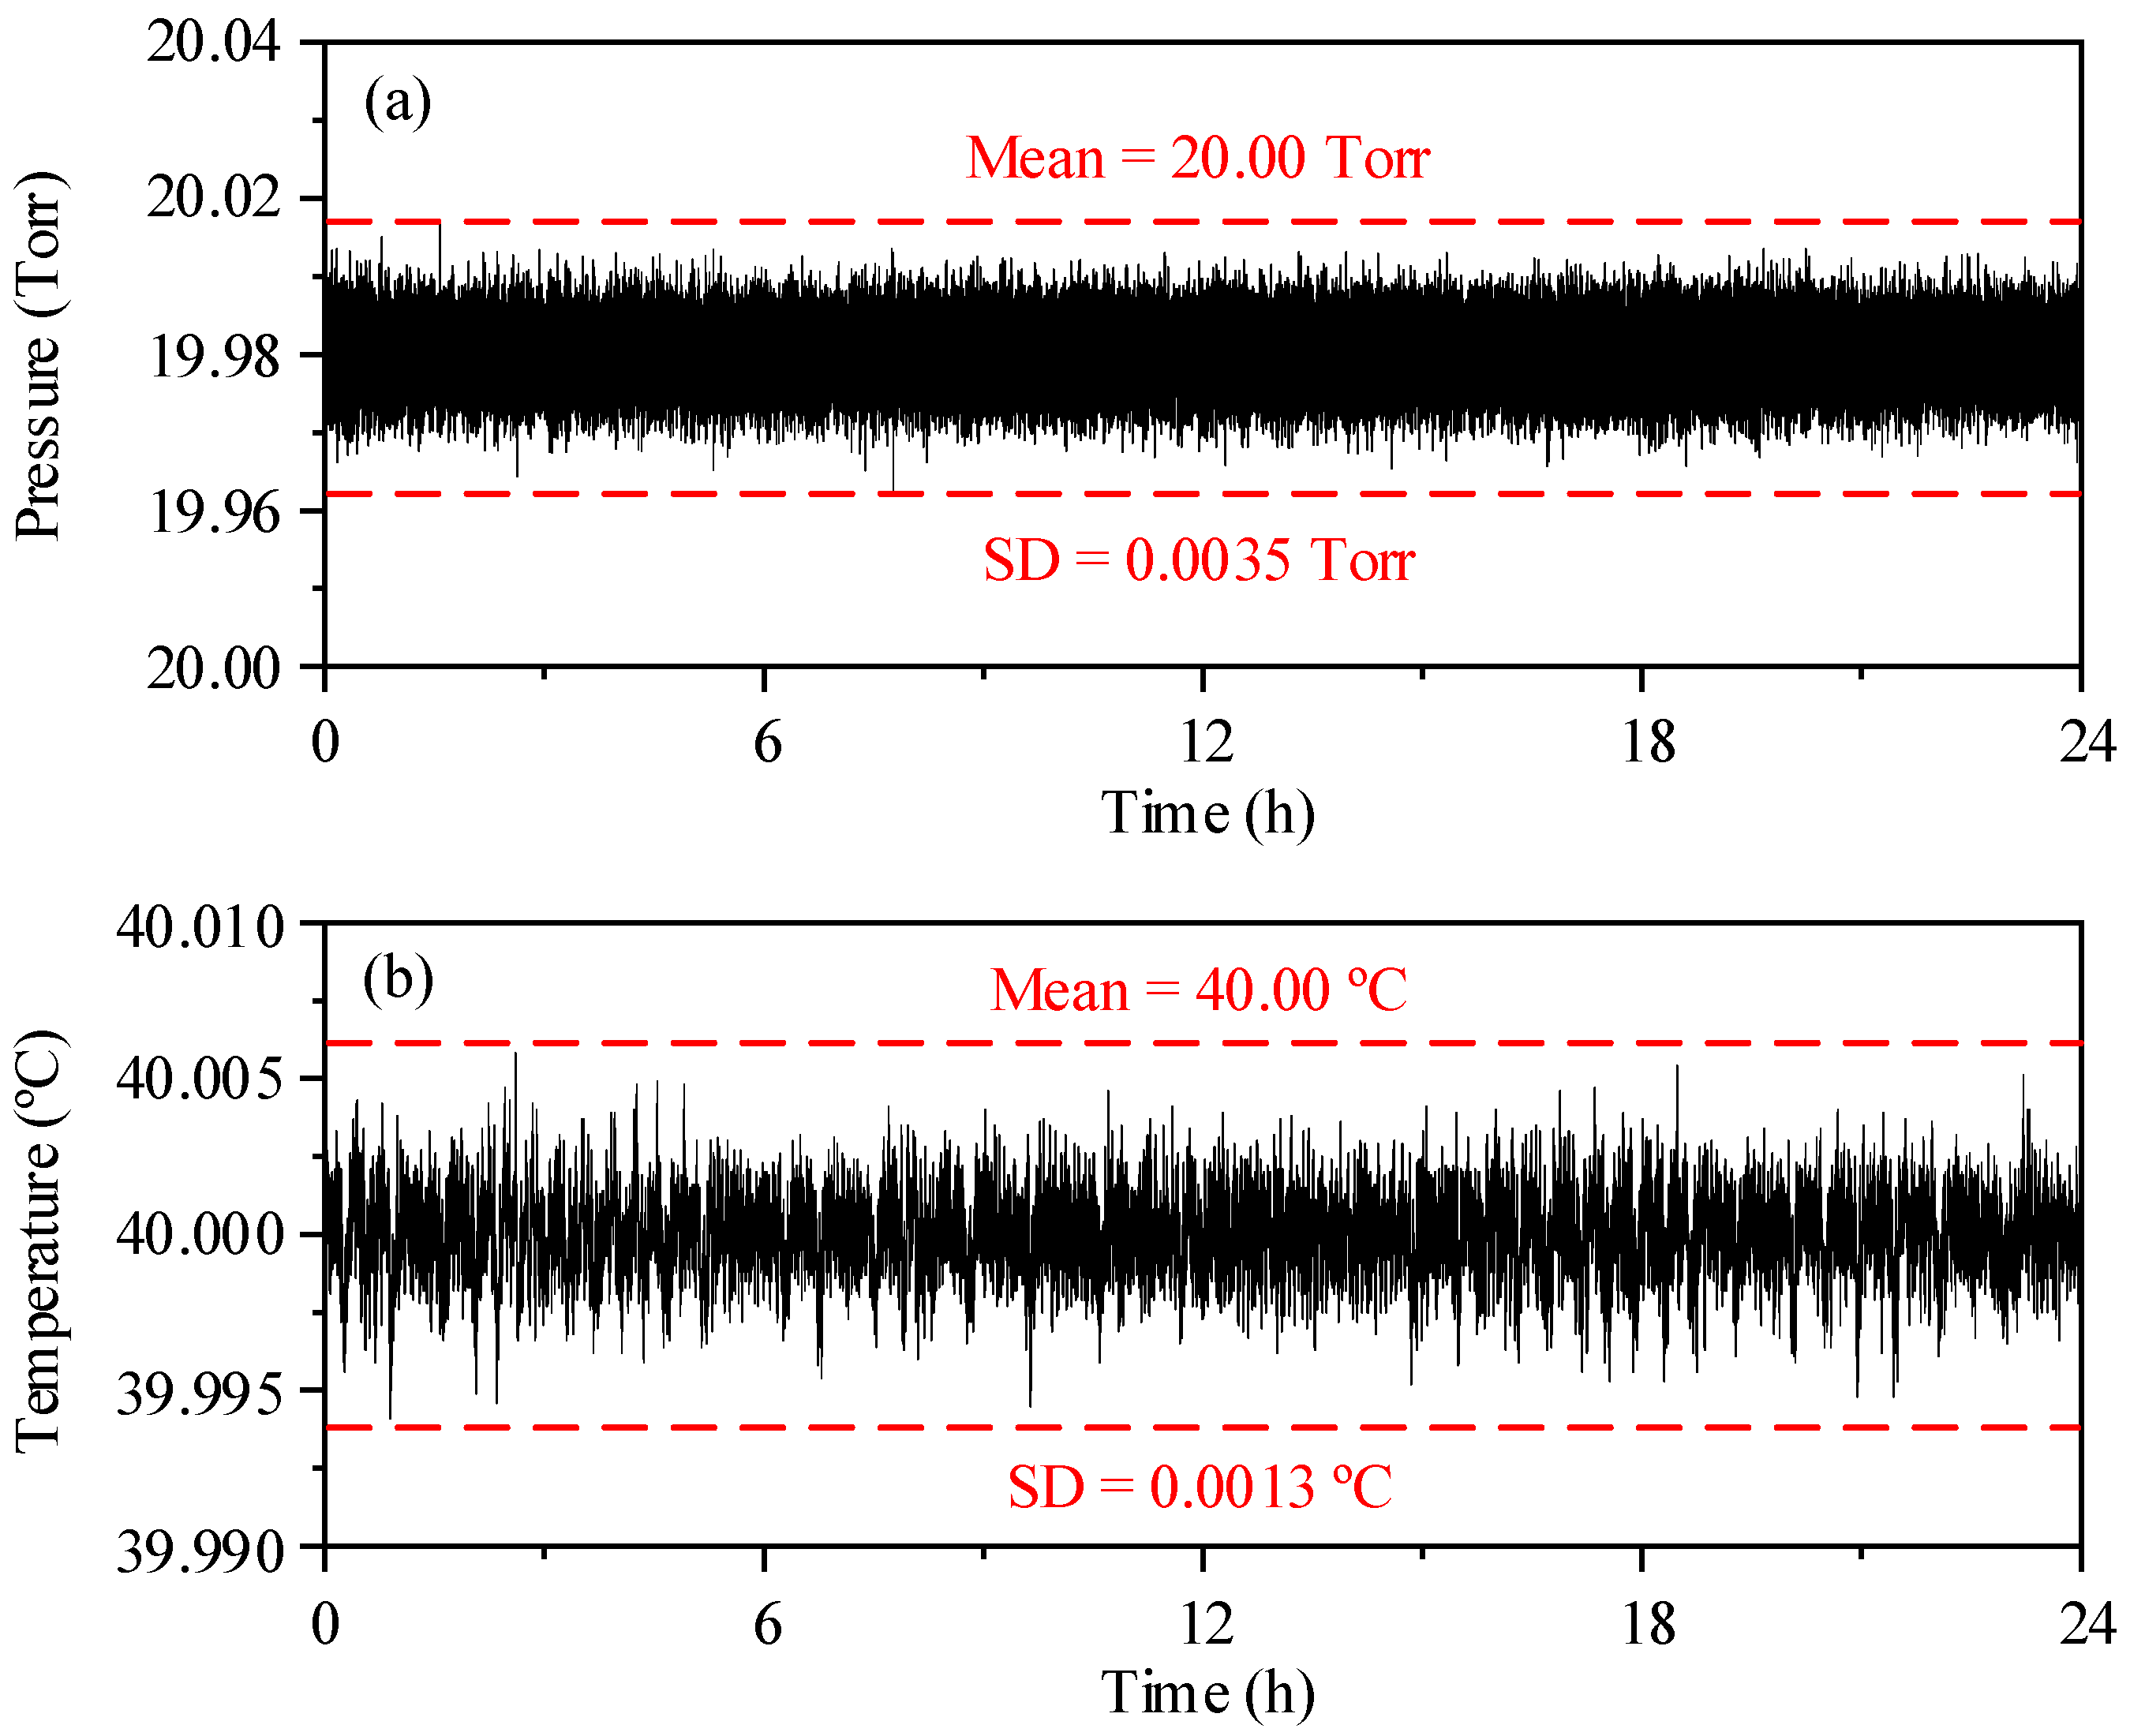
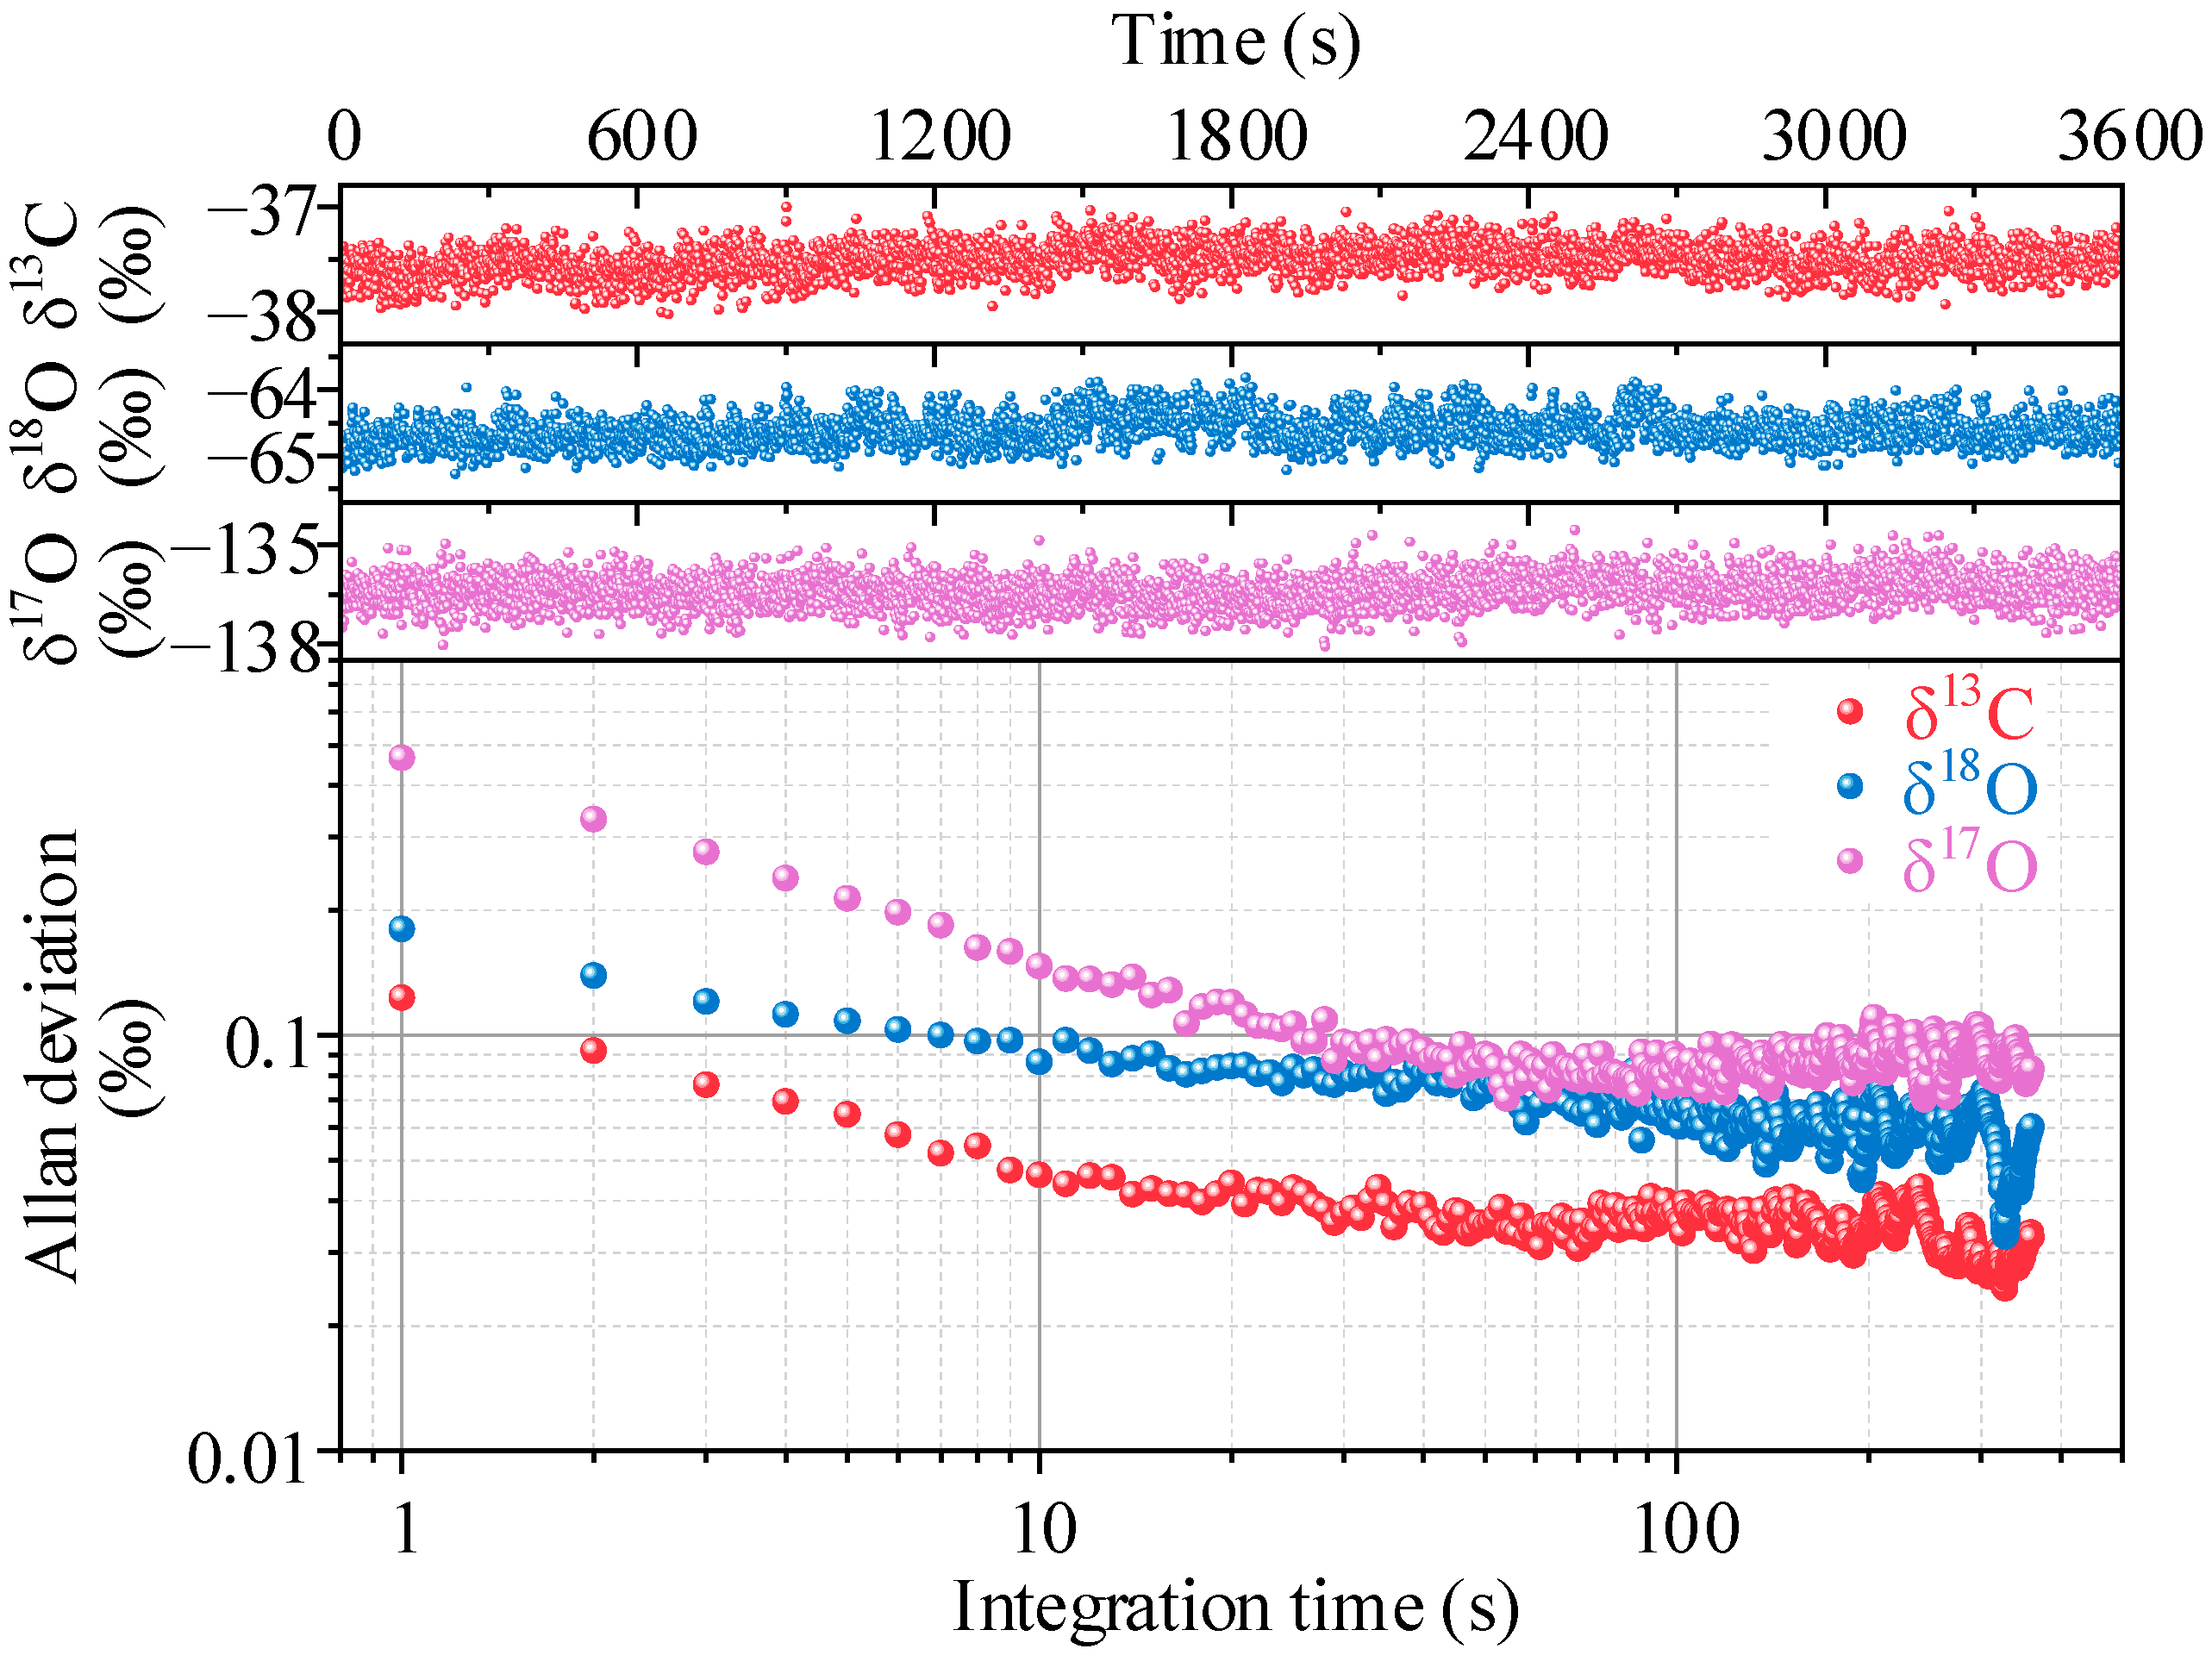
4.2. Stability and Detection Limit
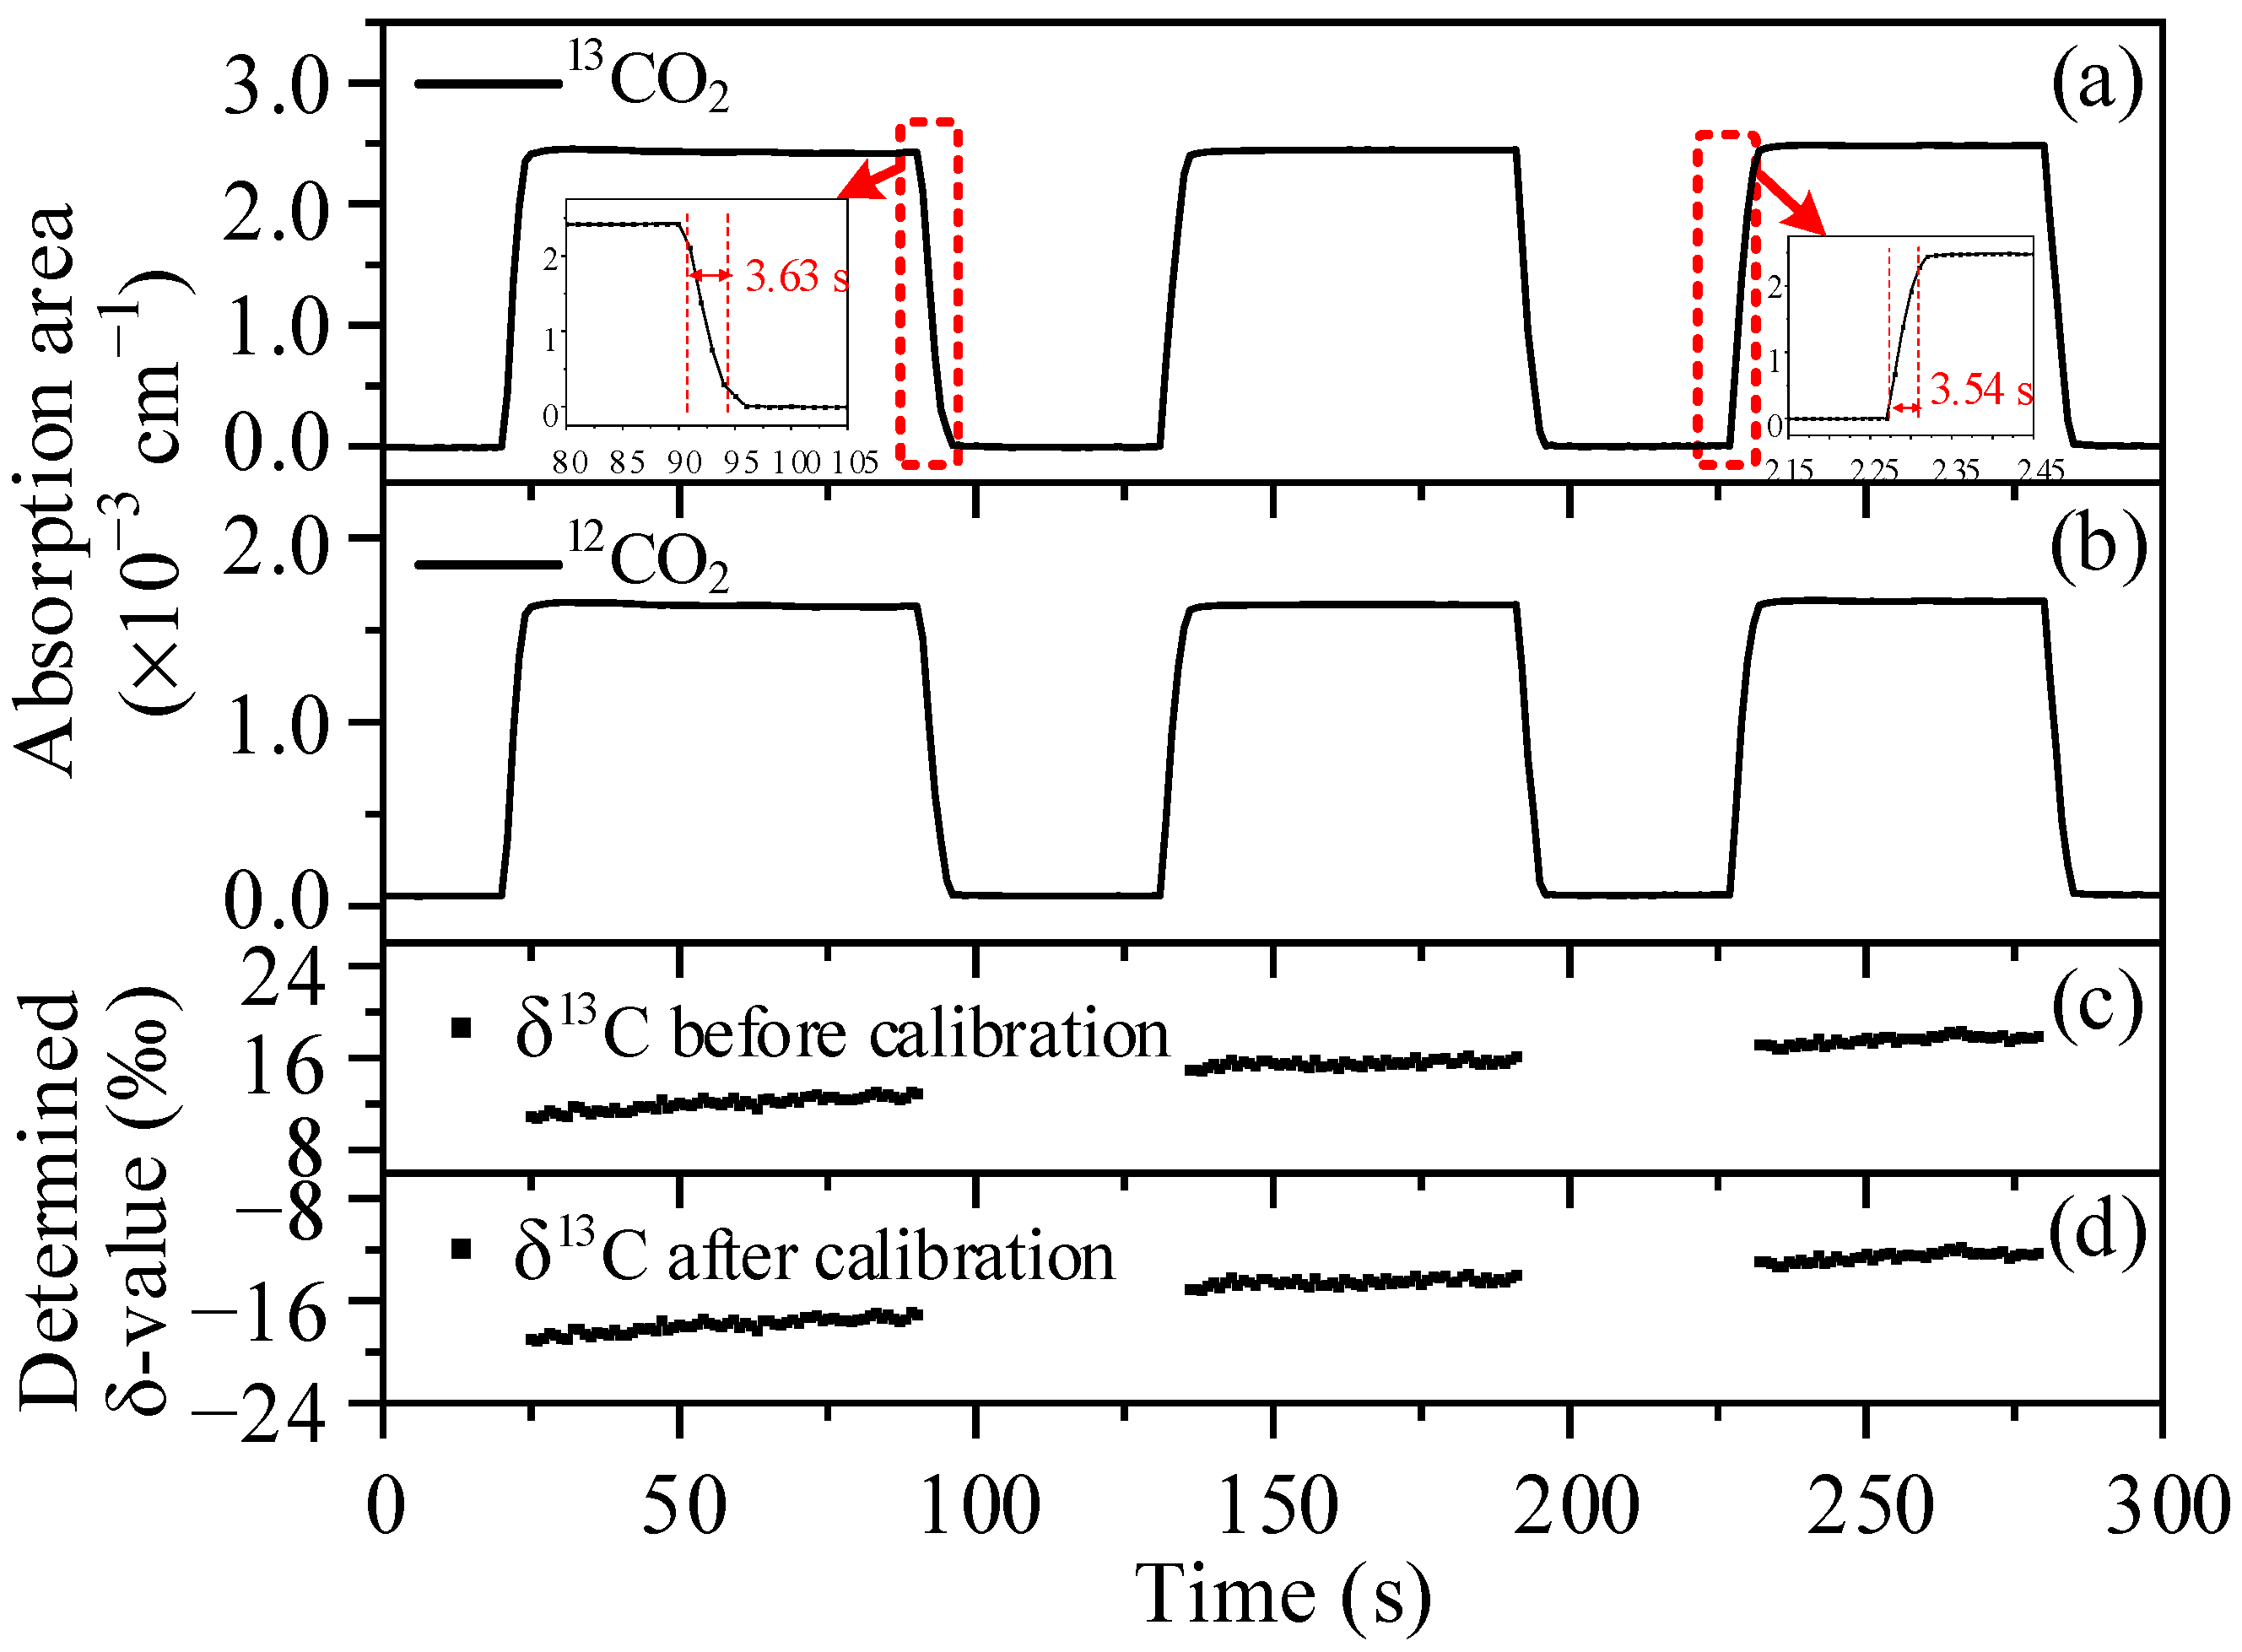
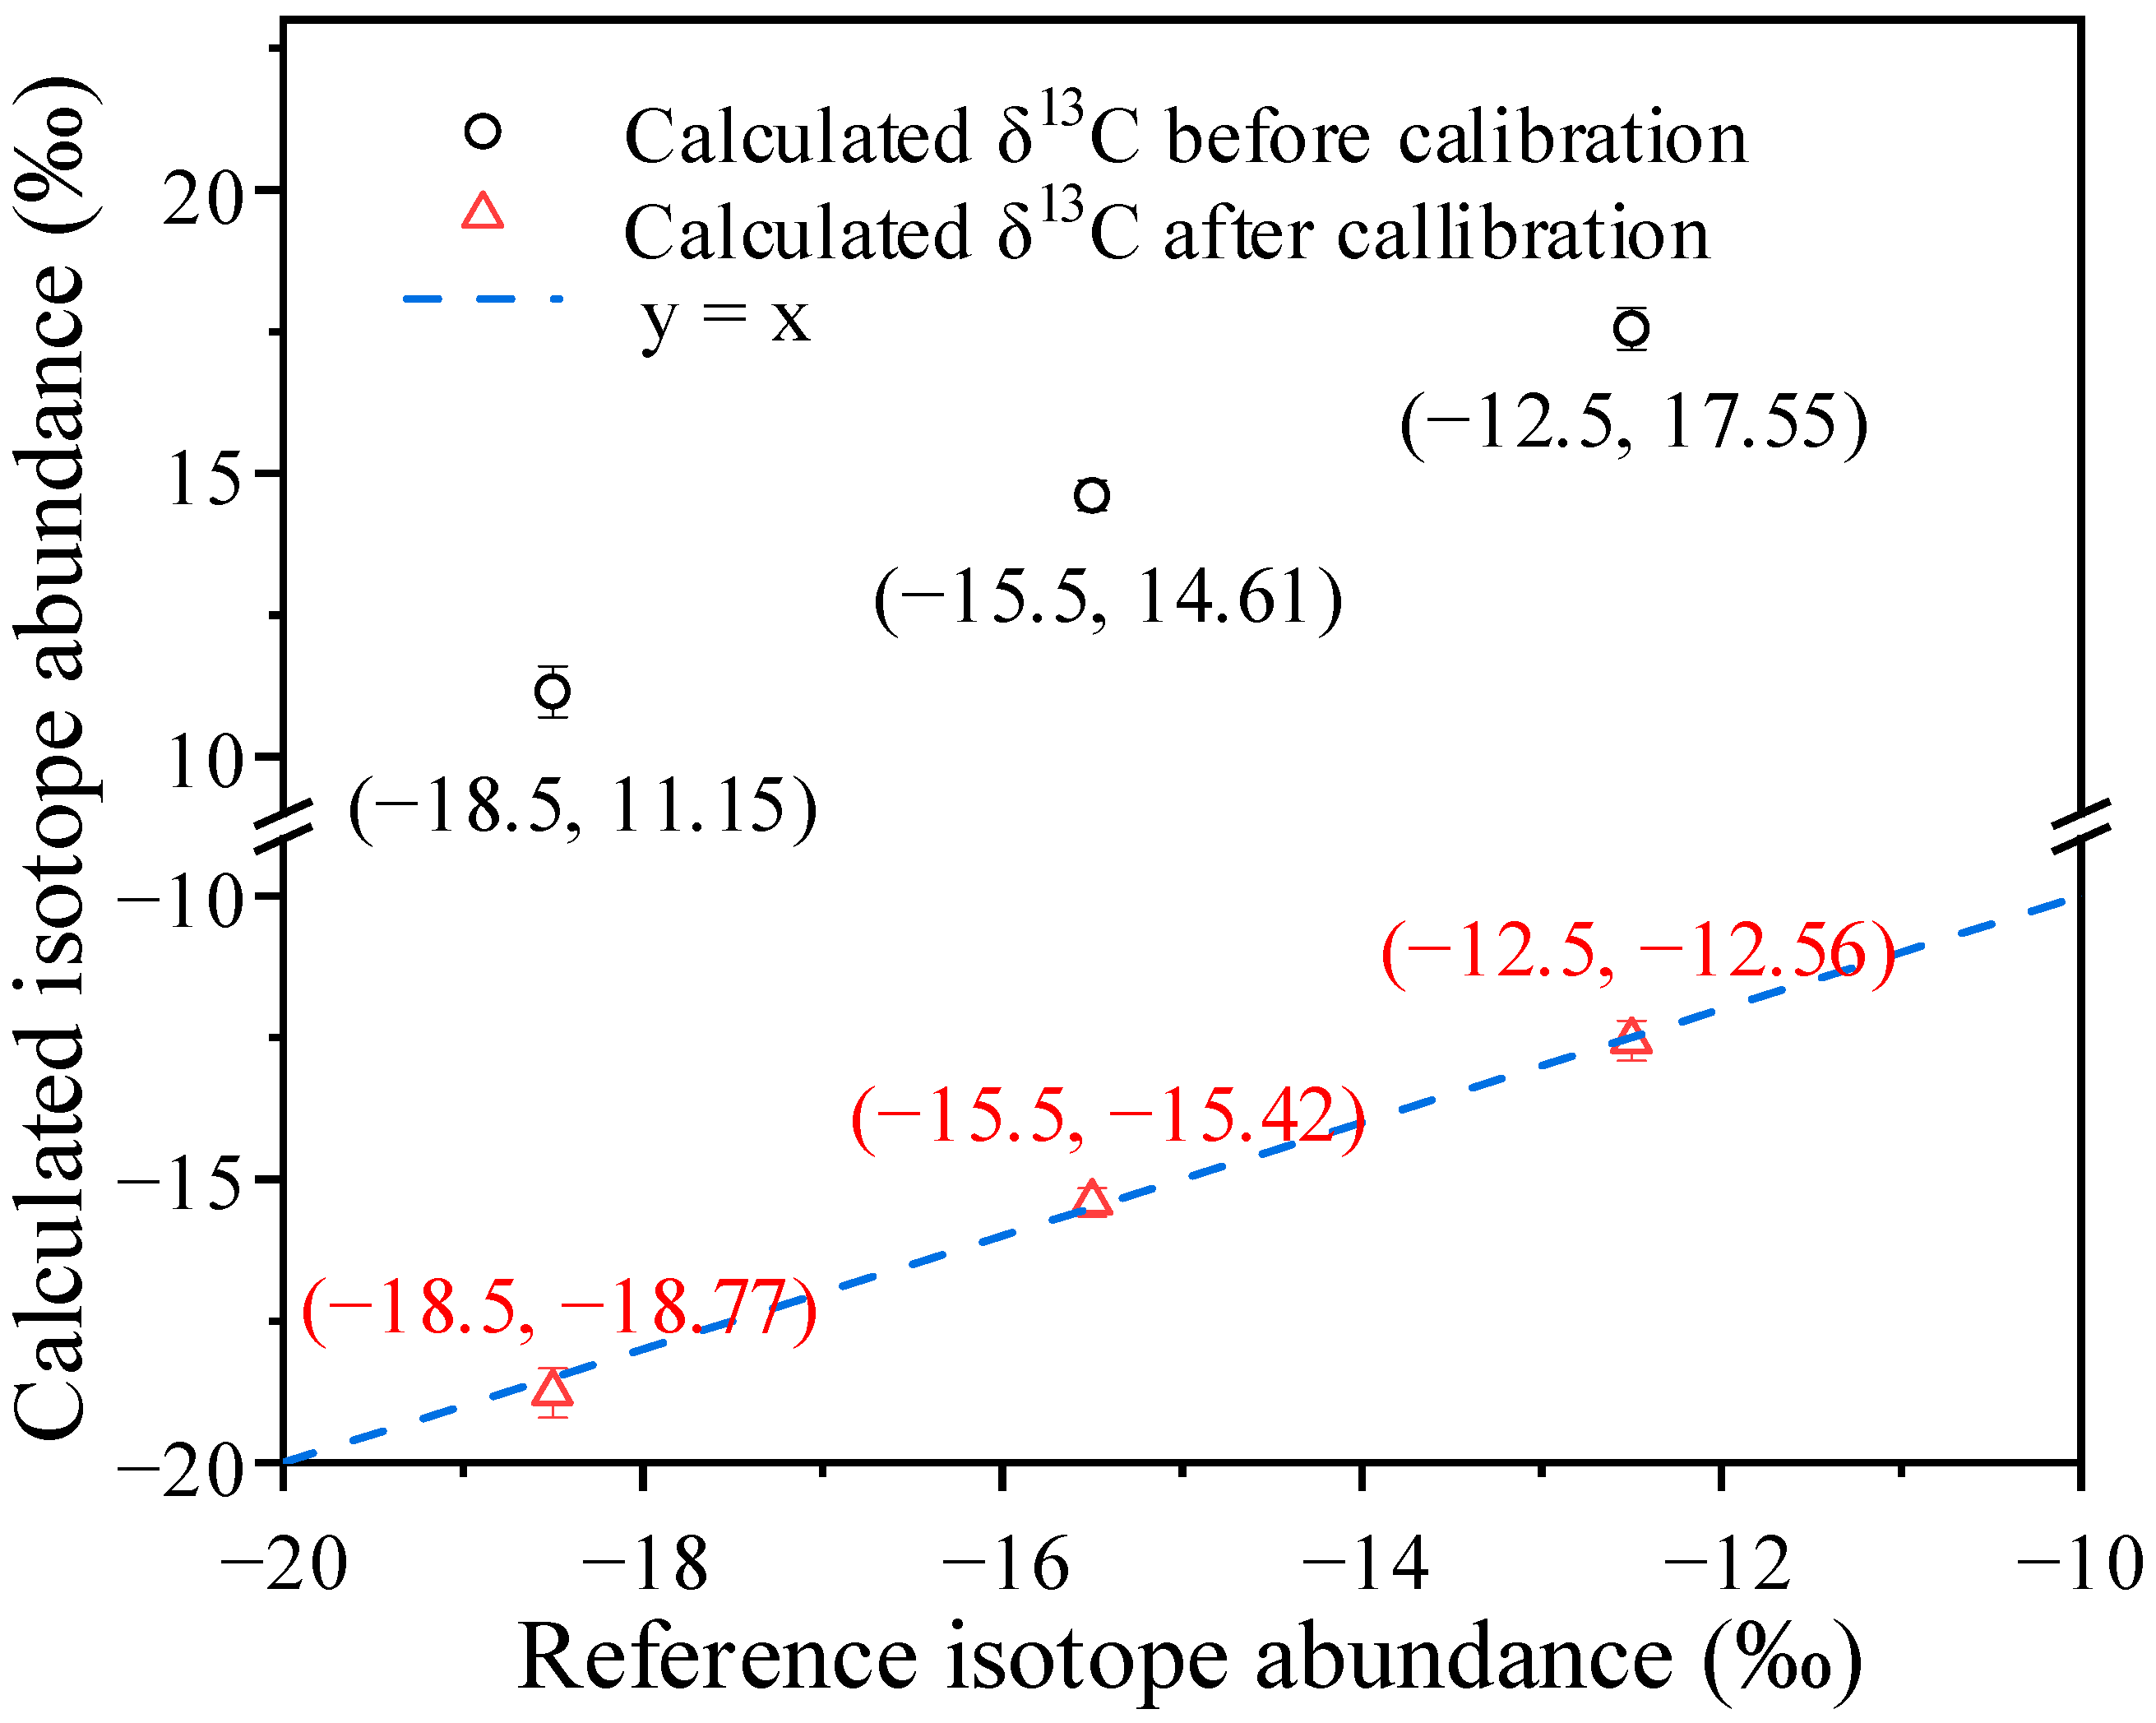
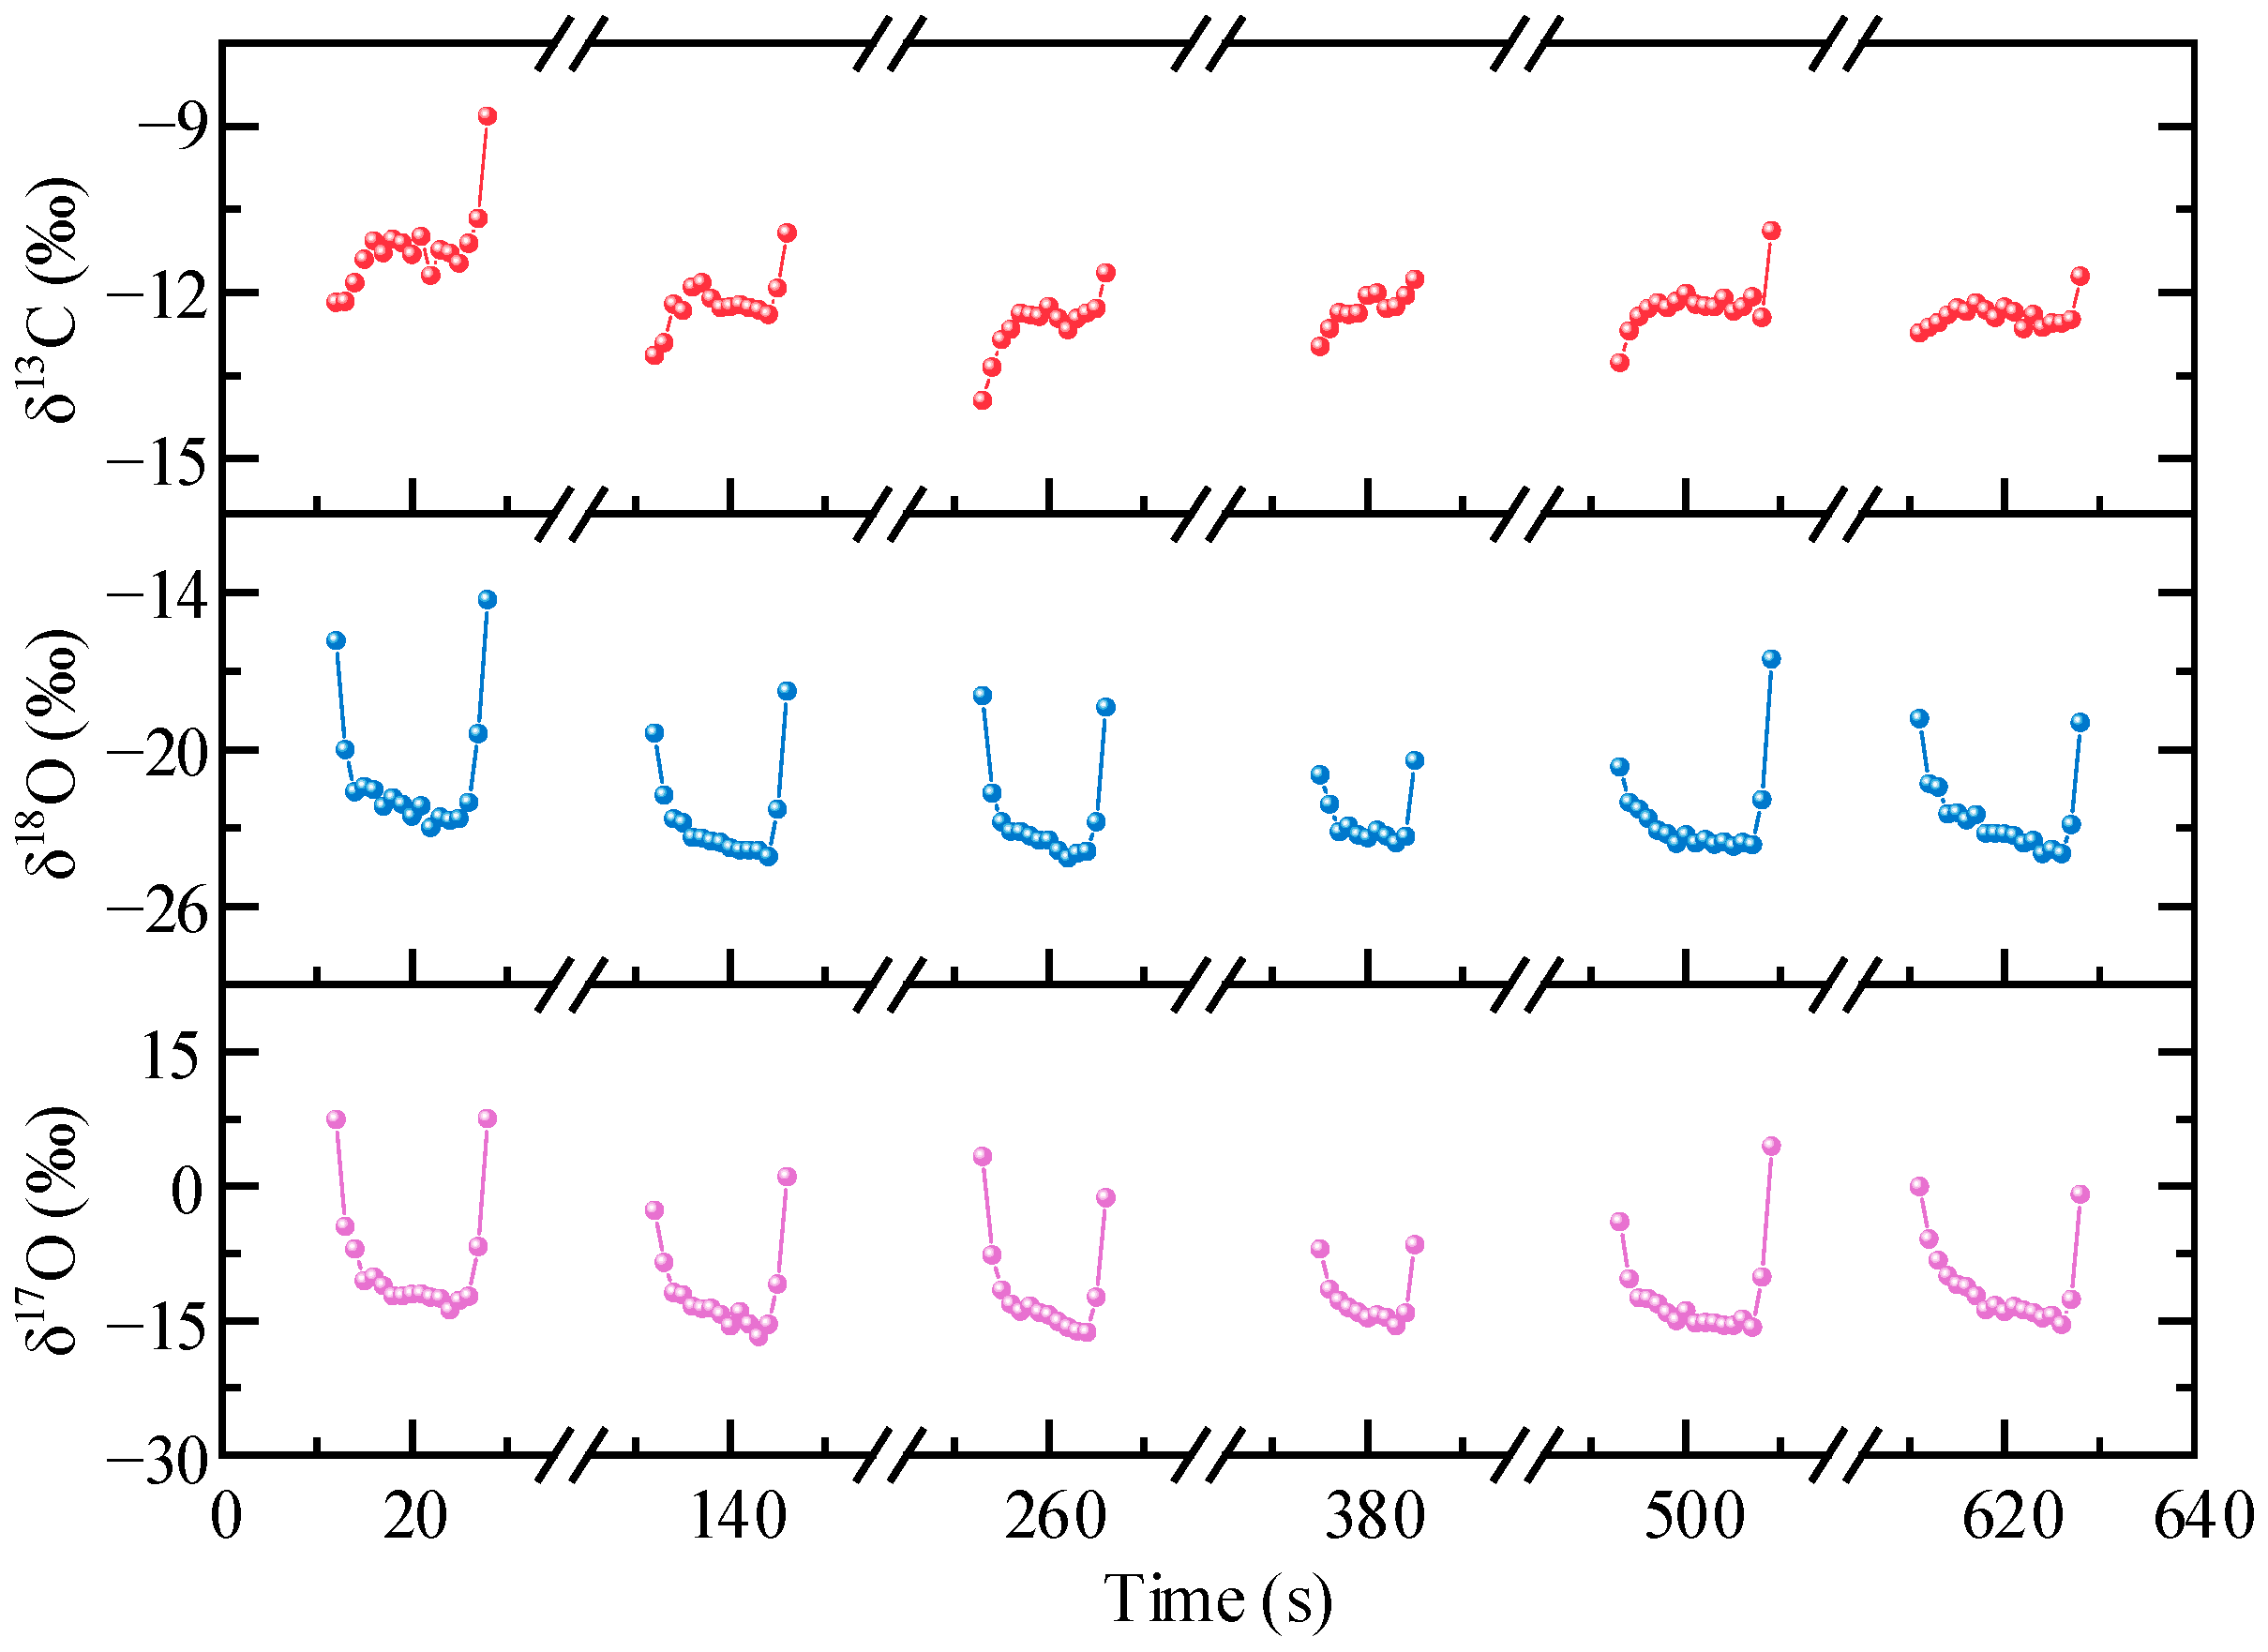
4.3. Real-Time Measurment of Human Breath
5. Discussion
6. Conclusions
Author Contributions
Funding
Conflicts of Interest
References
- Henderson, B.; Khodabakhsh, A.; Metsälä, M.; Ventrillard, I.; Schmidt, F.M.; Romanini, D.; Ritchie, G.A.D.; Hekkert, S.t.L.; Briot, R.; Risby, T.; et al. Laser spectroscopy for breath analysis: Towards clinical implementation. Appl. Phys. B 2018, 124, 161. [Google Scholar] [CrossRef] [PubMed] [Green Version]
- Chow, K.K.; Short, M.; Zeng, H. A comparison of spectroscopic techniques for human breath analysis. Biomed. Spectrosc. Ima. 2012, 1, 339–353. [Google Scholar] [CrossRef] [Green Version]
- Arslanov, D.D.; Swinkels, K.; Cristescu, S.M.; Harren, F.J.M. Real-time, subsecond, multicomponent breath analysis by Optical Parametric Oscillator based Off-Axis Integrated Cavity Output Spectroscopy. Opt. Express 2011, 19, 24078–24089. [Google Scholar] [CrossRef] [PubMed] [Green Version]
- Nguyen, P.Q.; Soenksen, L.R.; Donghia, N.M.; Angenent-Mari, N.M.; de Puig, H.; Huang, A.; Lee, R.; Slomovic, S.; Galbersanini, T.; Lansberry, G.; et al. Wearable materials with embedded synthetic biology sensors for biomolecule detection. Nat. Biotechnol. 2021, 39, 1366–1374. [Google Scholar] [CrossRef] [PubMed]
- Jin, Z.; Jorns, A.; Yim, W.; Wing, R.; Mantri, Y.; Zhou, J.; Zhou, J.; Wu, Z.; Moore, C.; Penny, W.F.; et al. Mapping Aerosolized Saliva on Face Coverings for Biosensing Applications. Anal. Chem. 2021, 93, 11025–11032. [Google Scholar] [CrossRef] [PubMed]
- Graham, D.Y.; Klein, P.D.; Evans, D.J., Jr.; Evans, D.G.; Alpert, L.C.; Opekun, A.R.; Boutton, T.W. Campylobacter pylori detected noninvasively by the 13C-urea breath test. Lancet 1987, 23, 1174–1177. [Google Scholar] [CrossRef]
- Savarino, V.; Vigneri, S.; Celle, G. The 13C urea breath test in the diagnosis of Helicobacter pylori infection. Gut 1999, 45, I18–I22. [Google Scholar] [CrossRef]
- El-Omar, E.M.; Carrington, M.; Chow, W.-H.; McColl, K.E.L.; Bream, J.H.; Young, H.A.; Herrera, J.; Lissowska, J.; Yuan, C.-C.; Rothman, N.; et al. Interleukin-1 polymorphisms associated with increased risk of gastric cancer. Nature 2000, 404, 398–402. [Google Scholar] [CrossRef] [Green Version]
- Covacci, A.; Telford, J.L.; Giudice, G.D.; Parsonnet, J.; Rappuoli, R. Helicobacter pylori Virulence and Genetic Geography. Science 1999, 284, 1328–1333. [Google Scholar] [CrossRef] [Green Version]
- Polk, D.B.; Peek, R.M., Jr. Helicobacter pylori: Gastric cancer and beyond. Nat. Rev. Cancer 2010, 10, 403–414. [Google Scholar] [CrossRef] [Green Version]
- Franceschi, F.; Gasbarrini, A.; Polyzos, S.A.; Kountouras, J. Extragastric Diseases and Helicobacter pylori. Helicobacter 2015, 20, 40–46. [Google Scholar] [CrossRef] [PubMed] [Green Version]
- Som, S.; Banik, G.D.; Maity, A.; Ghosh, C.; Chaudhuri, S.; Pradhan, M. Non-invasive diagnosis of type 2 diabetes in Helicobacter pylori infected patients using isotope-specific infrared absorption measurements. Isot. Environ. Health Stud. 2018, 54, 435–445. [Google Scholar] [CrossRef] [PubMed]
- Som, S.; De, A.; Banik, G.D.; Maity, A.; Ghosh, C.; Pal, M.; Daschakraborty, S.B.; Chaudhuri, S.; Jana, S.; Pradhan, M. Mechanisms linking metabolism of Helicobacter pylori to 18O and 13C-isotopes of human breath CO2. Sci. Rep. 2015, 5, 10936. [Google Scholar] [CrossRef] [PubMed] [Green Version]
- Maity, A.; Som, S.; Ghosh, C.; Banik, G.D.; Daschakraborty, S.B.; Ghosh, S.; Chaudhuri, S.; Pradhan, M. Oxygen-18 stable isotope of exhaled breath CO2 as a non-invasive marker of Helicobacter pylori infection. J. Anal. At. Spectrom. 2014, 29, 2251–2255. [Google Scholar] [CrossRef]
- Ghosh, C.; Mandal, S.; Banik, G.D.; Maity, A.; Mukhopadhyay, P.; Ghosh, S.; Pradhan, M. Targeting erythrocyte carbonic anhydrase and 18O-isotope of breath CO2 for sorting out type 1 and type 2 diabetes. Sci. Rep. 2016, 6, 35836. [Google Scholar] [CrossRef]
- Ghorbani, R.; Schmidt, F.M. ICL-based TDLAS sensor for real-time breath gas analysis of carbon monoxide isotopes. Opt. Express 2017, 25, 12743–12752. [Google Scholar] [CrossRef]
- McCurdy, M.R.; Bakhirkin, Y.; Wysocki, G.; Lewicki, R.; Tittel, F.K. Recent advances of laser-spectroscopy-based techniques for applications in breath analysis. J. Breath. Res. 2007, 1, 014001. [Google Scholar] [CrossRef] [Green Version]
- Shao, L.; Chen, J.; Wang, K.; Mei, J.; Tan, T.; Wang, G.; Liu, K.; Gao, X. Highly precise measurement of atmospheric N2O and CO using improved White cell and RF current perturbation. Sens. Actuators B 2022, 352, 130995. [Google Scholar] [CrossRef]
- Guo, X.; Zheng, F.; Li, C.; Yang, X.; Li, N.; Liu, S.; Wei, J.; Qiu, X.; He, Q. A portable sensor for in-situ measurement of ammonia based on near-infrared laser absorption spectroscopy. Opt. Laser Eng. 2019, 115, 243–248. [Google Scholar] [CrossRef]
- Tütüncü, E.; Nägele, M.; Becker, S.; Fischer, M.; Koeth, J.; Wolf, C.; Köstler, S.; Ribitsch, V.; Teuber, A.; Gröger, M.; et al. Advanced Photonic Sensors Based on Interband Cascade Lasers for Real-Time Mouse Breath Analysis. ACS Sens. 2018, 3, 1743–1749. [Google Scholar] [CrossRef]
- Crosson, E.R.; Ricci, K.N.; Richman, B.A.; Chilese, F.C.; Owano, T.G.; Provencal, R.A.; Todd, M.W.; Glasser, J.; Kachanov, A.A.; Paldus, B.A. Stable Isotope Ratios Using Cavity Ring-Down Spectroscopy: Determination of 13C/12C for Carbon Dioxide in Human Breath. Anal. Chem. 2002, 74, 2003–2007. [Google Scholar] [CrossRef] [PubMed]
- Kasyutich, V.L.; Martin, P.A.; Holdsworth, R.J. An off-axis cavity-enhanced absorption spectrometer at 1605 nm for the 12CO2/13CO2 measurement. Appl. phys. B 2006, 85, 413–420. [Google Scholar] [CrossRef]
- Andreev, S.N.; Mironchuk, E.S.; Nikolaev, I.V.; Ochkin, V.N.; Spiridonov, M.V.; Tskhai, S.N. High precision measurements of the 13CO2/12CO2 isotope ratio at atmospheric pressure in human breath using a 2 μm diode laser. Appl. Phys. B 2011, 104, 73–79. [Google Scholar] [CrossRef]
- Zhou, T.; Wu, T.; Wu, Q.; Chen, W.; Wu, M.; Ye, C.; He, X. Real-Time Monitoring of 13C- and 18O-Isotopes of Human Breath CO2 Using a Mid-Infrared Hollow Waveguide Gas Sensor. Anal. Chem. 2020, 92, 12943–12949. [Google Scholar] [CrossRef]
- Zhou, T.; Wu, T.; Wu, Q.; Ye, C.; Hu, R.; Chen, W.; He, X. Real-time measurement of CO2 isotopologue ratios in exhaled breath by a hollow waveguide based mid-infrared gas sensor. Opt. Express 2020, 28, 10970–10980. [Google Scholar] [CrossRef] [PubMed]
- Zhu, X.H.; Chen, W. In vivo oxygen-17 NMR for imaging brain oxygen metabolism at high field. Prog. Nucl. Magn. Reson. Spectrosc. 2011, 59, 319–335. [Google Scholar] [CrossRef] [PubMed] [Green Version]
- Hoffmann, S.H.; Begovatz, P.; Nagel, A.M.; Umathum, R.; Schommer, K.; Bachert, P.; Bock, M. A Measurement Setup for Direct 17O MRI at 7 T. Magn. Reson. Med. 2011, 66, 1109–1115. [Google Scholar] [CrossRef]
- Goldenstein, C.S.; Miller, V.A.; Mitchell Spearrin, R.; Strand, C.L. SpectraPlot.com: Integrated spectroscopic modeling of atomic and molecular gases. J. Quant. Spectrosc. Radiat. Transfer 2017, 200, 249–257. [Google Scholar] [CrossRef] [Green Version]
- Bergamaschi, P.; Schupp, M.; Harris, G.W. High-precision direct measurements of 13CH4/12CH4 and 12CH3D/12CH4 ratios in atmospheric methane sources by means of a long-path tunable diode laser absorption spectrometer. Appl. Opt. 1994, 33, 7704–7716. [Google Scholar] [CrossRef] [Green Version]
- Gordon, I.E.; Rothman, L.S.; Hargreaves, R.J.; Hashemi, R.; Karlovets, E.V.; Skinner, F.M.; Conway, E.K.; Hill, C.; Kochanov, R.V.; Tan, Y.; et al. The HITRAN2020 molecular spectroscopic database. J. Quant. Spectrosc. Radiat. Transfer 2022, 277, 107949. [Google Scholar] [CrossRef]
- Mills, G.A.; Urey, H.C. The Kinetics of Isotopic Exchange between Carbon Dioxide, Bicarbonate Ion, Carbonate Ion and Water. J. Am. Chem. Soc. 1940, 62, 1019–1026. [Google Scholar] [CrossRef]
- Mellon, E.A.; Beesam, R.S.; Baumgardner, J.E.; Borthakur, A.; Witschey, W.R., 2nd; Reddy, R. Estimation of the regional cerebral metabolic rate of oxygen consumption with proton detected 17O MRI during precision 17O2 inhalation in swine. J. Neurosci. Methods 2009, 179, 29–39. [Google Scholar] [CrossRef] [PubMed] [Green Version]
- Epstein, S.; Zeiri, L. Oxygen and carbon isotopic compositions of gases respired by humans. Proc. Natl. Acad. Sci. USA 1988, 85, 1727–1731. [Google Scholar] [CrossRef] [PubMed] [Green Version]


Publisher’s Note: MDPI stays neutral with regard to jurisdictional claims in published maps and institutional affiliations. |
© 2022 by the authors. Licensee MDPI, Basel, Switzerland. This article is an open access article distributed under the terms and conditions of the Creative Commons Attribution (CC BY) license (https://creativecommons.org/licenses/by/4.0/).
Share and Cite
Shao, L.; Mei, J.; Chen, J.; Tan, T.; Wang, G.; Liu, K.; Gao, X. Simultaneous Sensitive Determination of δ13C, δ18O, and δ17O in Human Breath CO2 Based on ICL Direct Absorption Spectroscopy. Sensors 2022, 22, 1527. https://doi.org/10.3390/s22041527
Shao L, Mei J, Chen J, Tan T, Wang G, Liu K, Gao X. Simultaneous Sensitive Determination of δ13C, δ18O, and δ17O in Human Breath CO2 Based on ICL Direct Absorption Spectroscopy. Sensors. 2022; 22(4):1527. https://doi.org/10.3390/s22041527
Chicago/Turabian StyleShao, Ligang, Jiaoxu Mei, Jiajin Chen, Tu Tan, Guishi Wang, Kun Liu, and Xiaoming Gao. 2022. "Simultaneous Sensitive Determination of δ13C, δ18O, and δ17O in Human Breath CO2 Based on ICL Direct Absorption Spectroscopy" Sensors 22, no. 4: 1527. https://doi.org/10.3390/s22041527