
Test-Retest Reliability of Kinematic and Temporal Outcome Measures for Clinical Gait and Stair Walking Tests, Based on Wearable Inertial Sensors


Abstract
:1. Introduction
2. Materials and Methods
2.1. Participants
2.2. The Clinical Test Battery
- (1)
- Gait 15 m at a comfortable speed;
- (2)
- Gait 15 m at a fast speed: the instruction was to “walk as fast as possible without running or losing balance, as if you are in a hurry to catch the bus”;
- (3)
- Stair walking at a comfortable speed, stair ascending followed by stair descending repeated 3 times (step height 17.5 cm, step depth 27.3 cm). During stair walking, the participant held the dominant (right) hand on the handrail, since this is how it would be done in the clinic to minimize the risk of falls when assessing a patient with gait disorders.
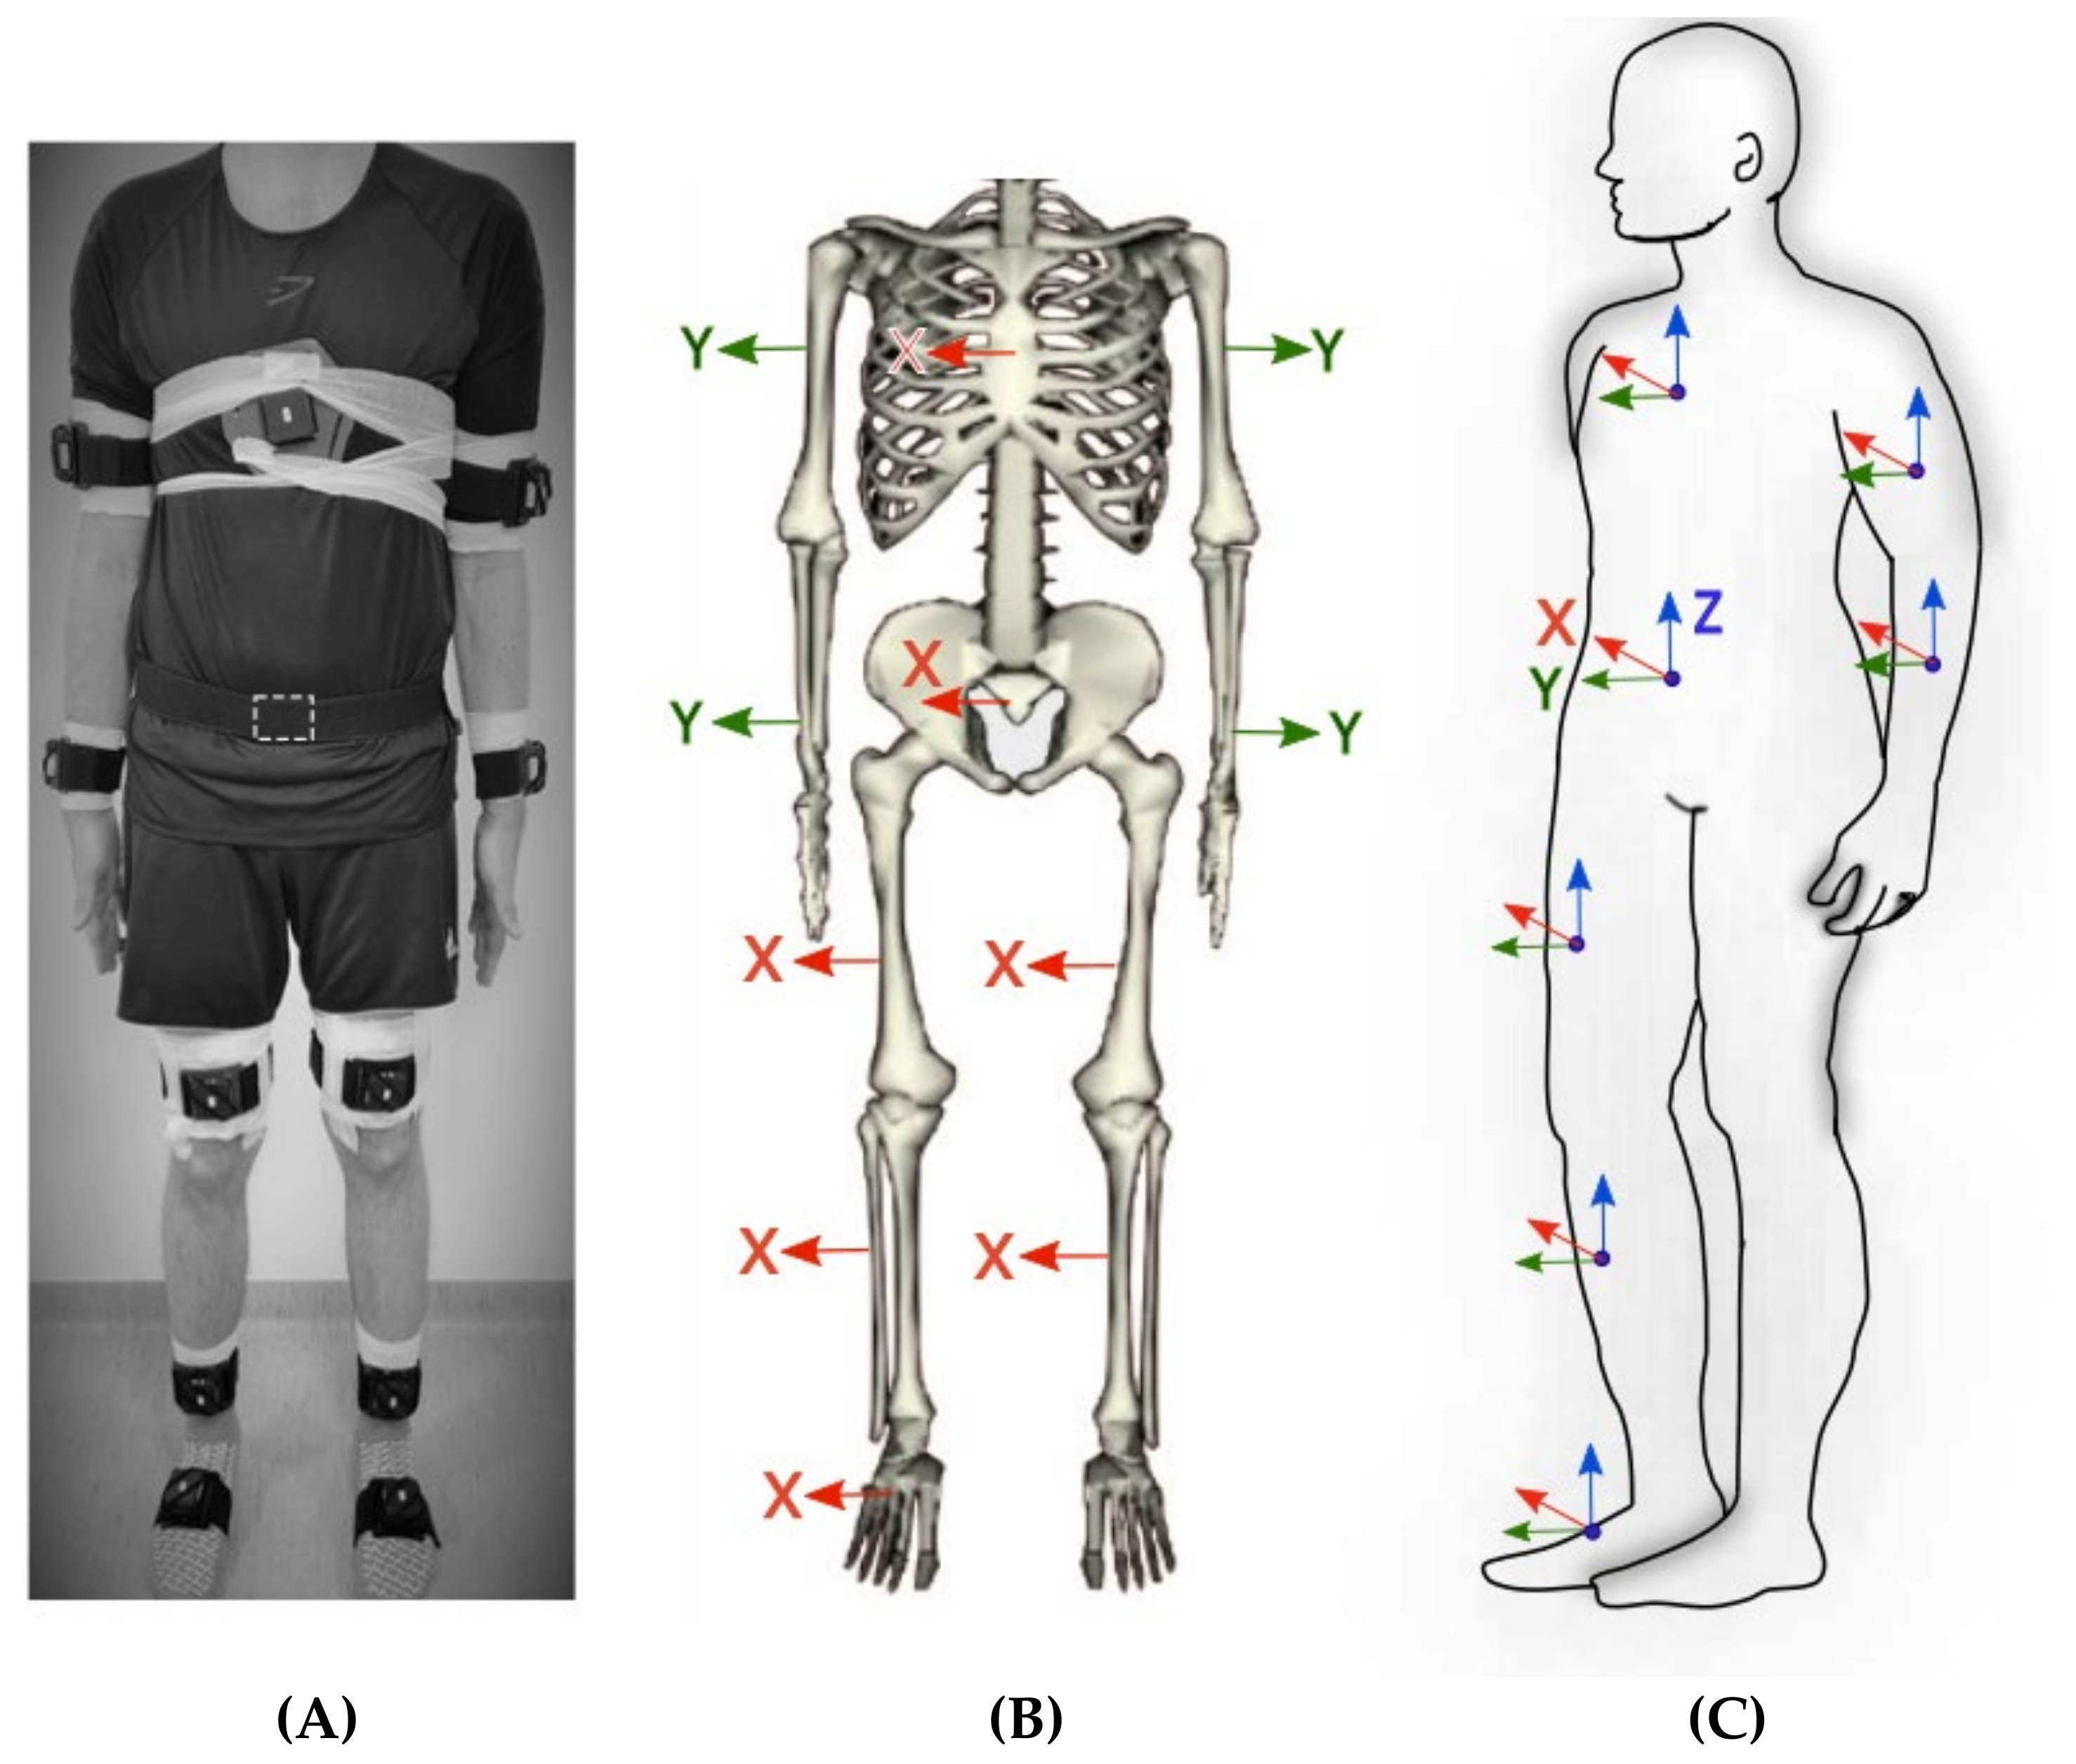
2.3. Equipment and Sensor Placement
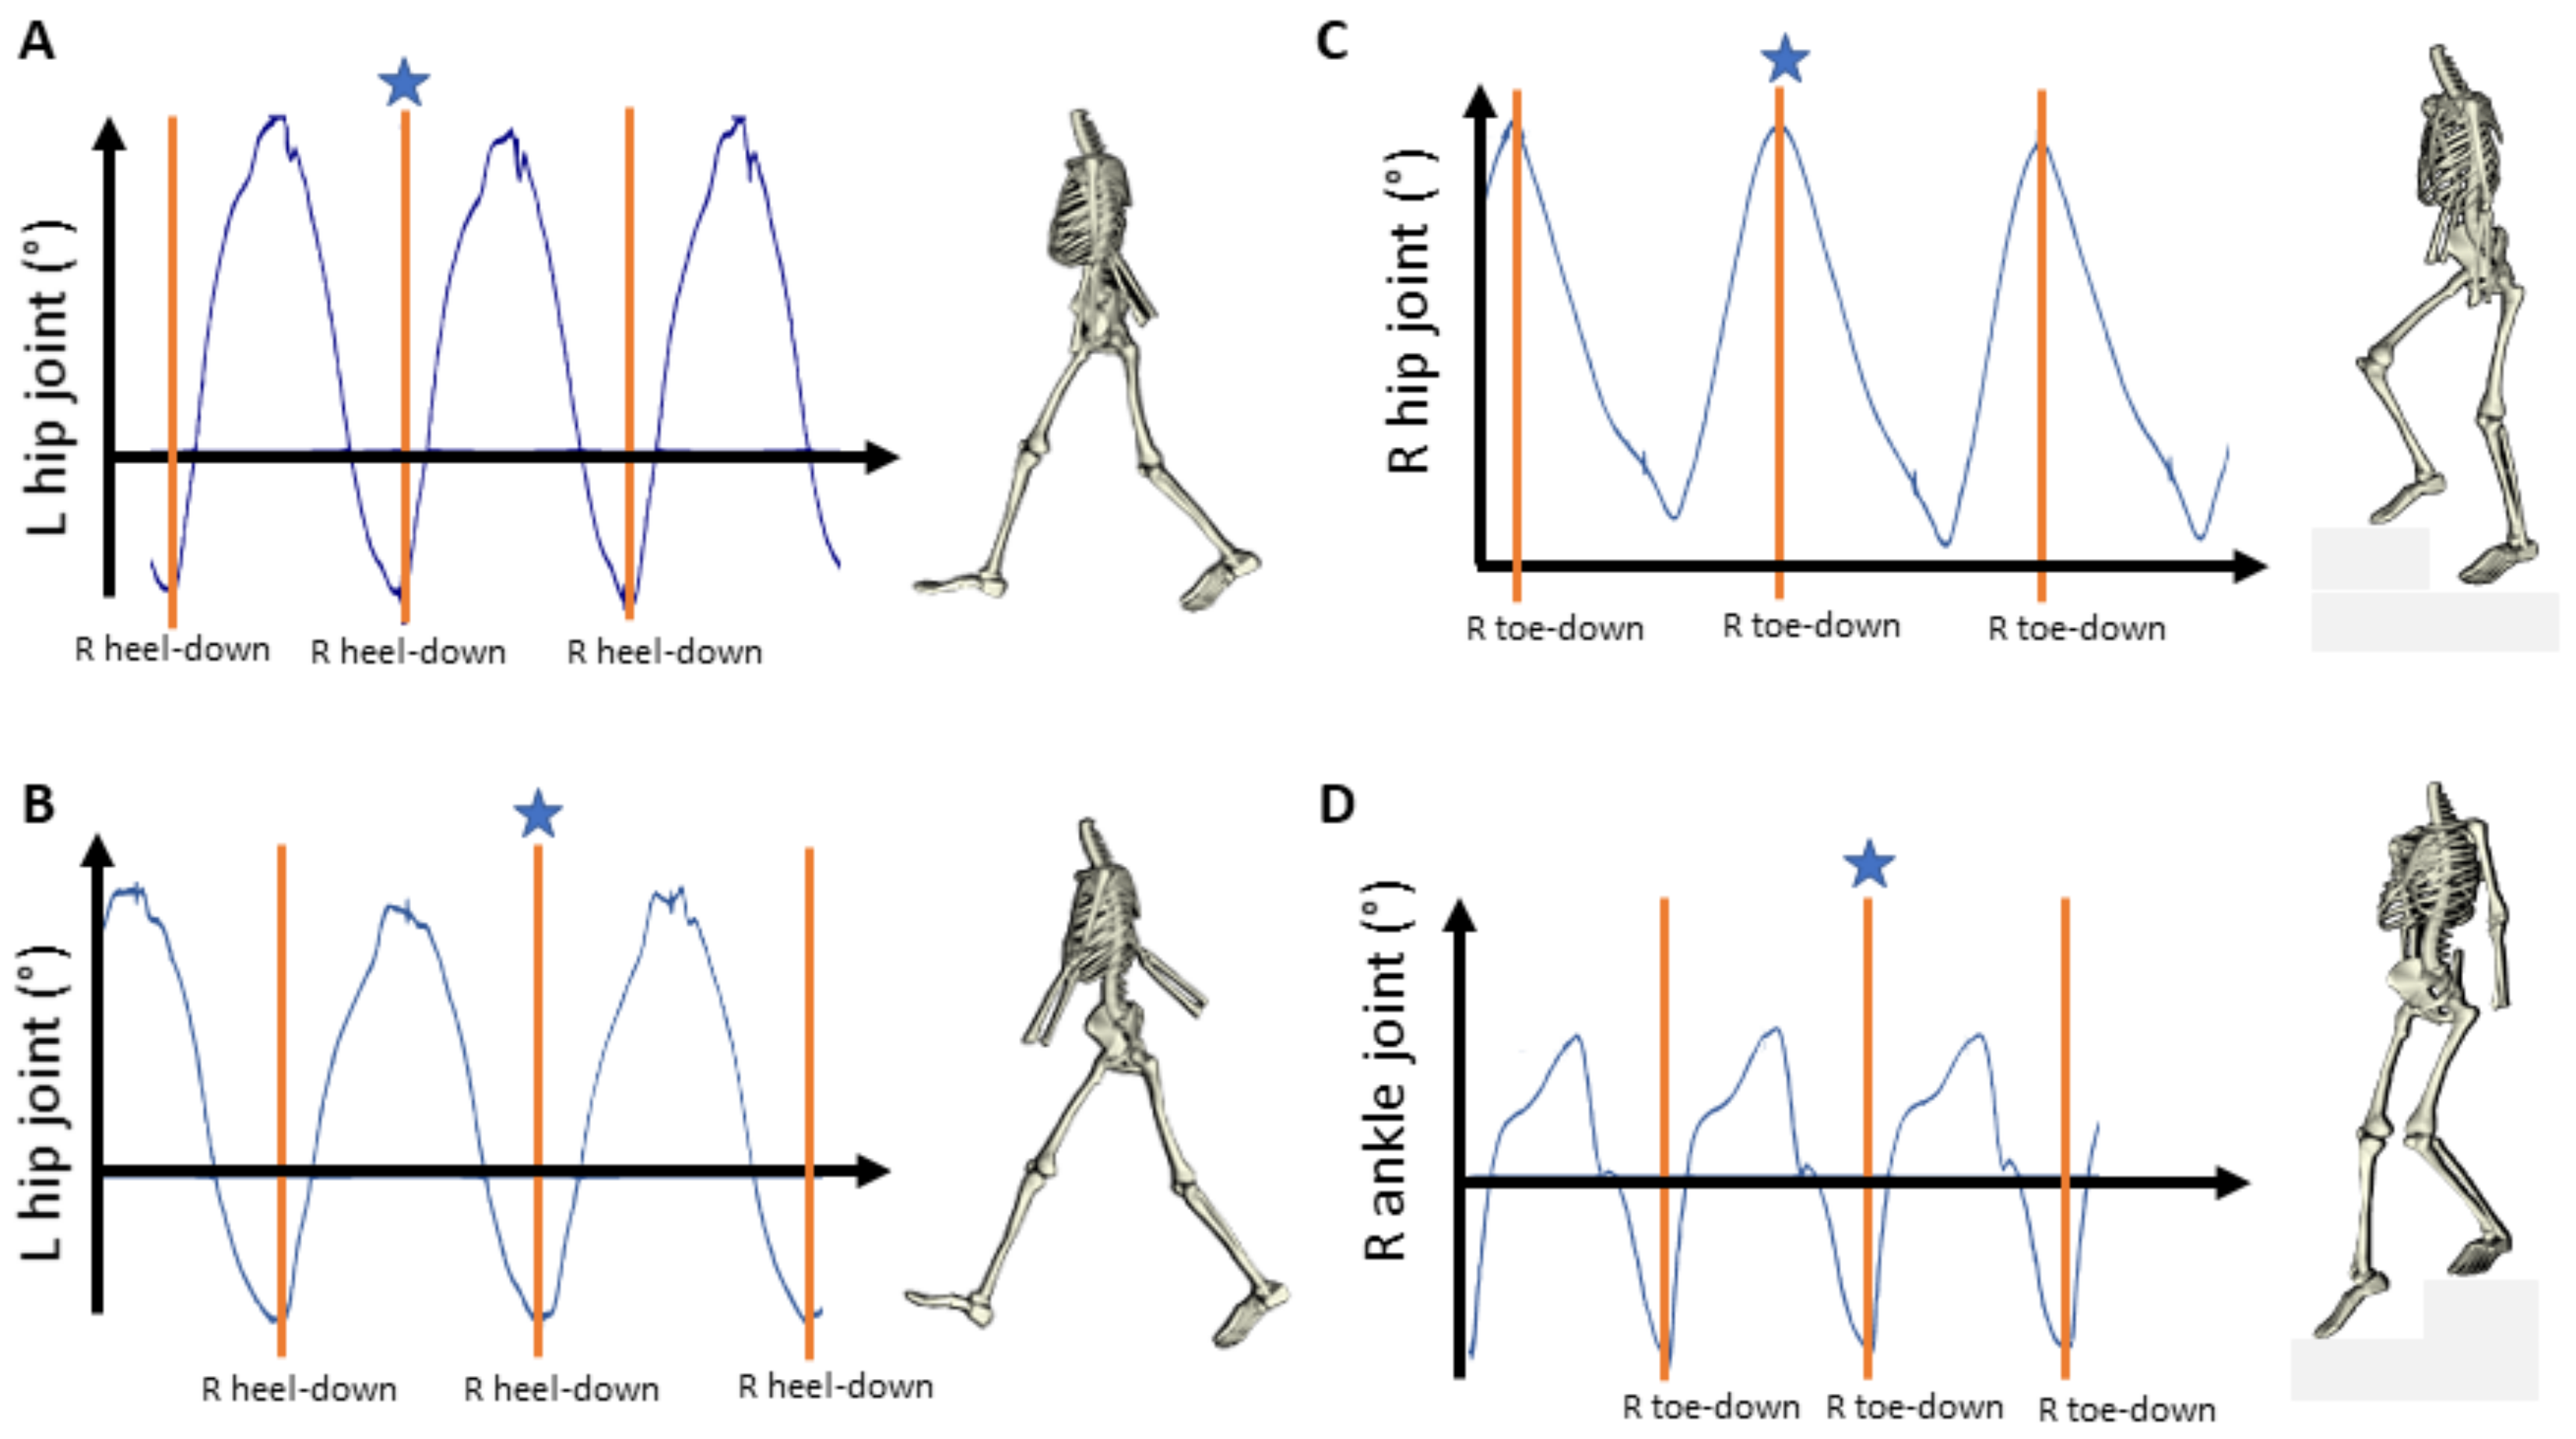
2.4. Data Preprocessing
- Pelvis flexion-extension (computed from the pelvis sensor).
- Shoulder flexion-extension (computed from the upper arm sensor relative to the thorax sensor).
- Thorax flexion-extension (computed from the thorax sensor relative to the pelvis sensor).
- Hip flexion extension (computed from the thigh sensor relative to the pelvis sensor).
- Knee flexion-extension (computed from the shank sensor relative to the thigh sensor).
- Foot dorsiflexion-plantarflexion (computed from the foot sensor relative to the shank sensor). Note that foot dorsiflexion (foot moving upwards) and foot plantarflexion (foot moving downwards) are the clinical terms for the ankle joint movement.
2.5. Statistics
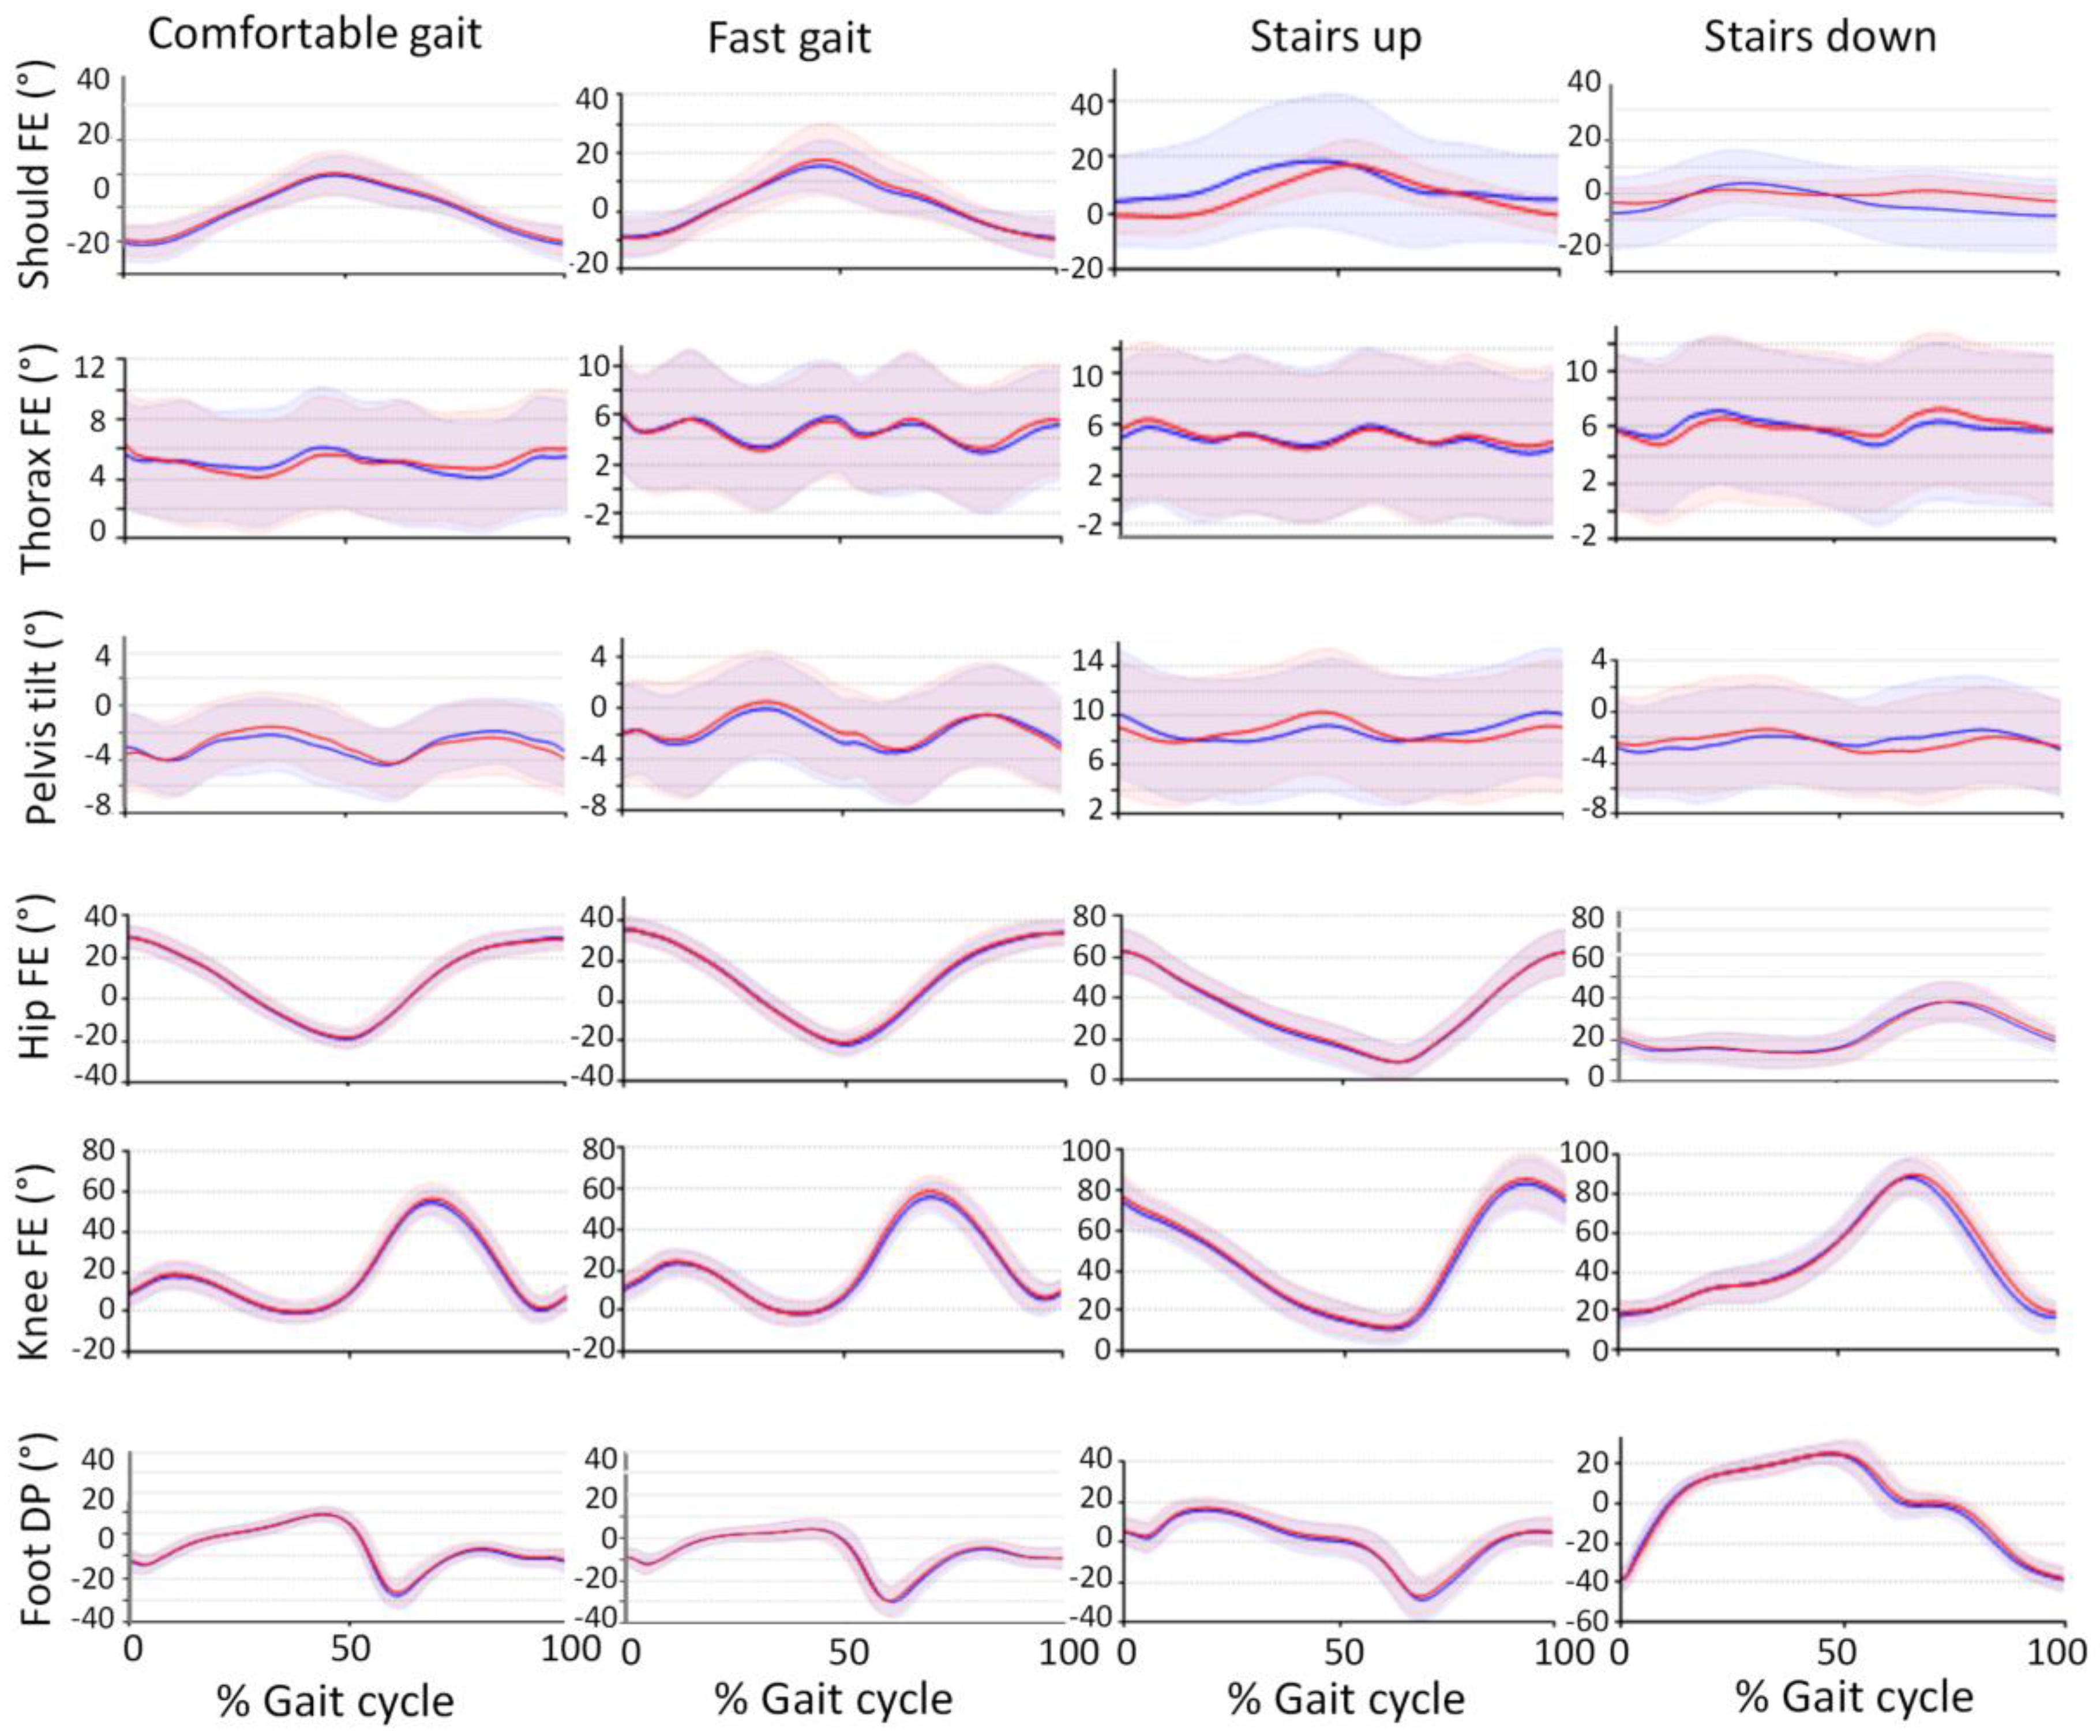
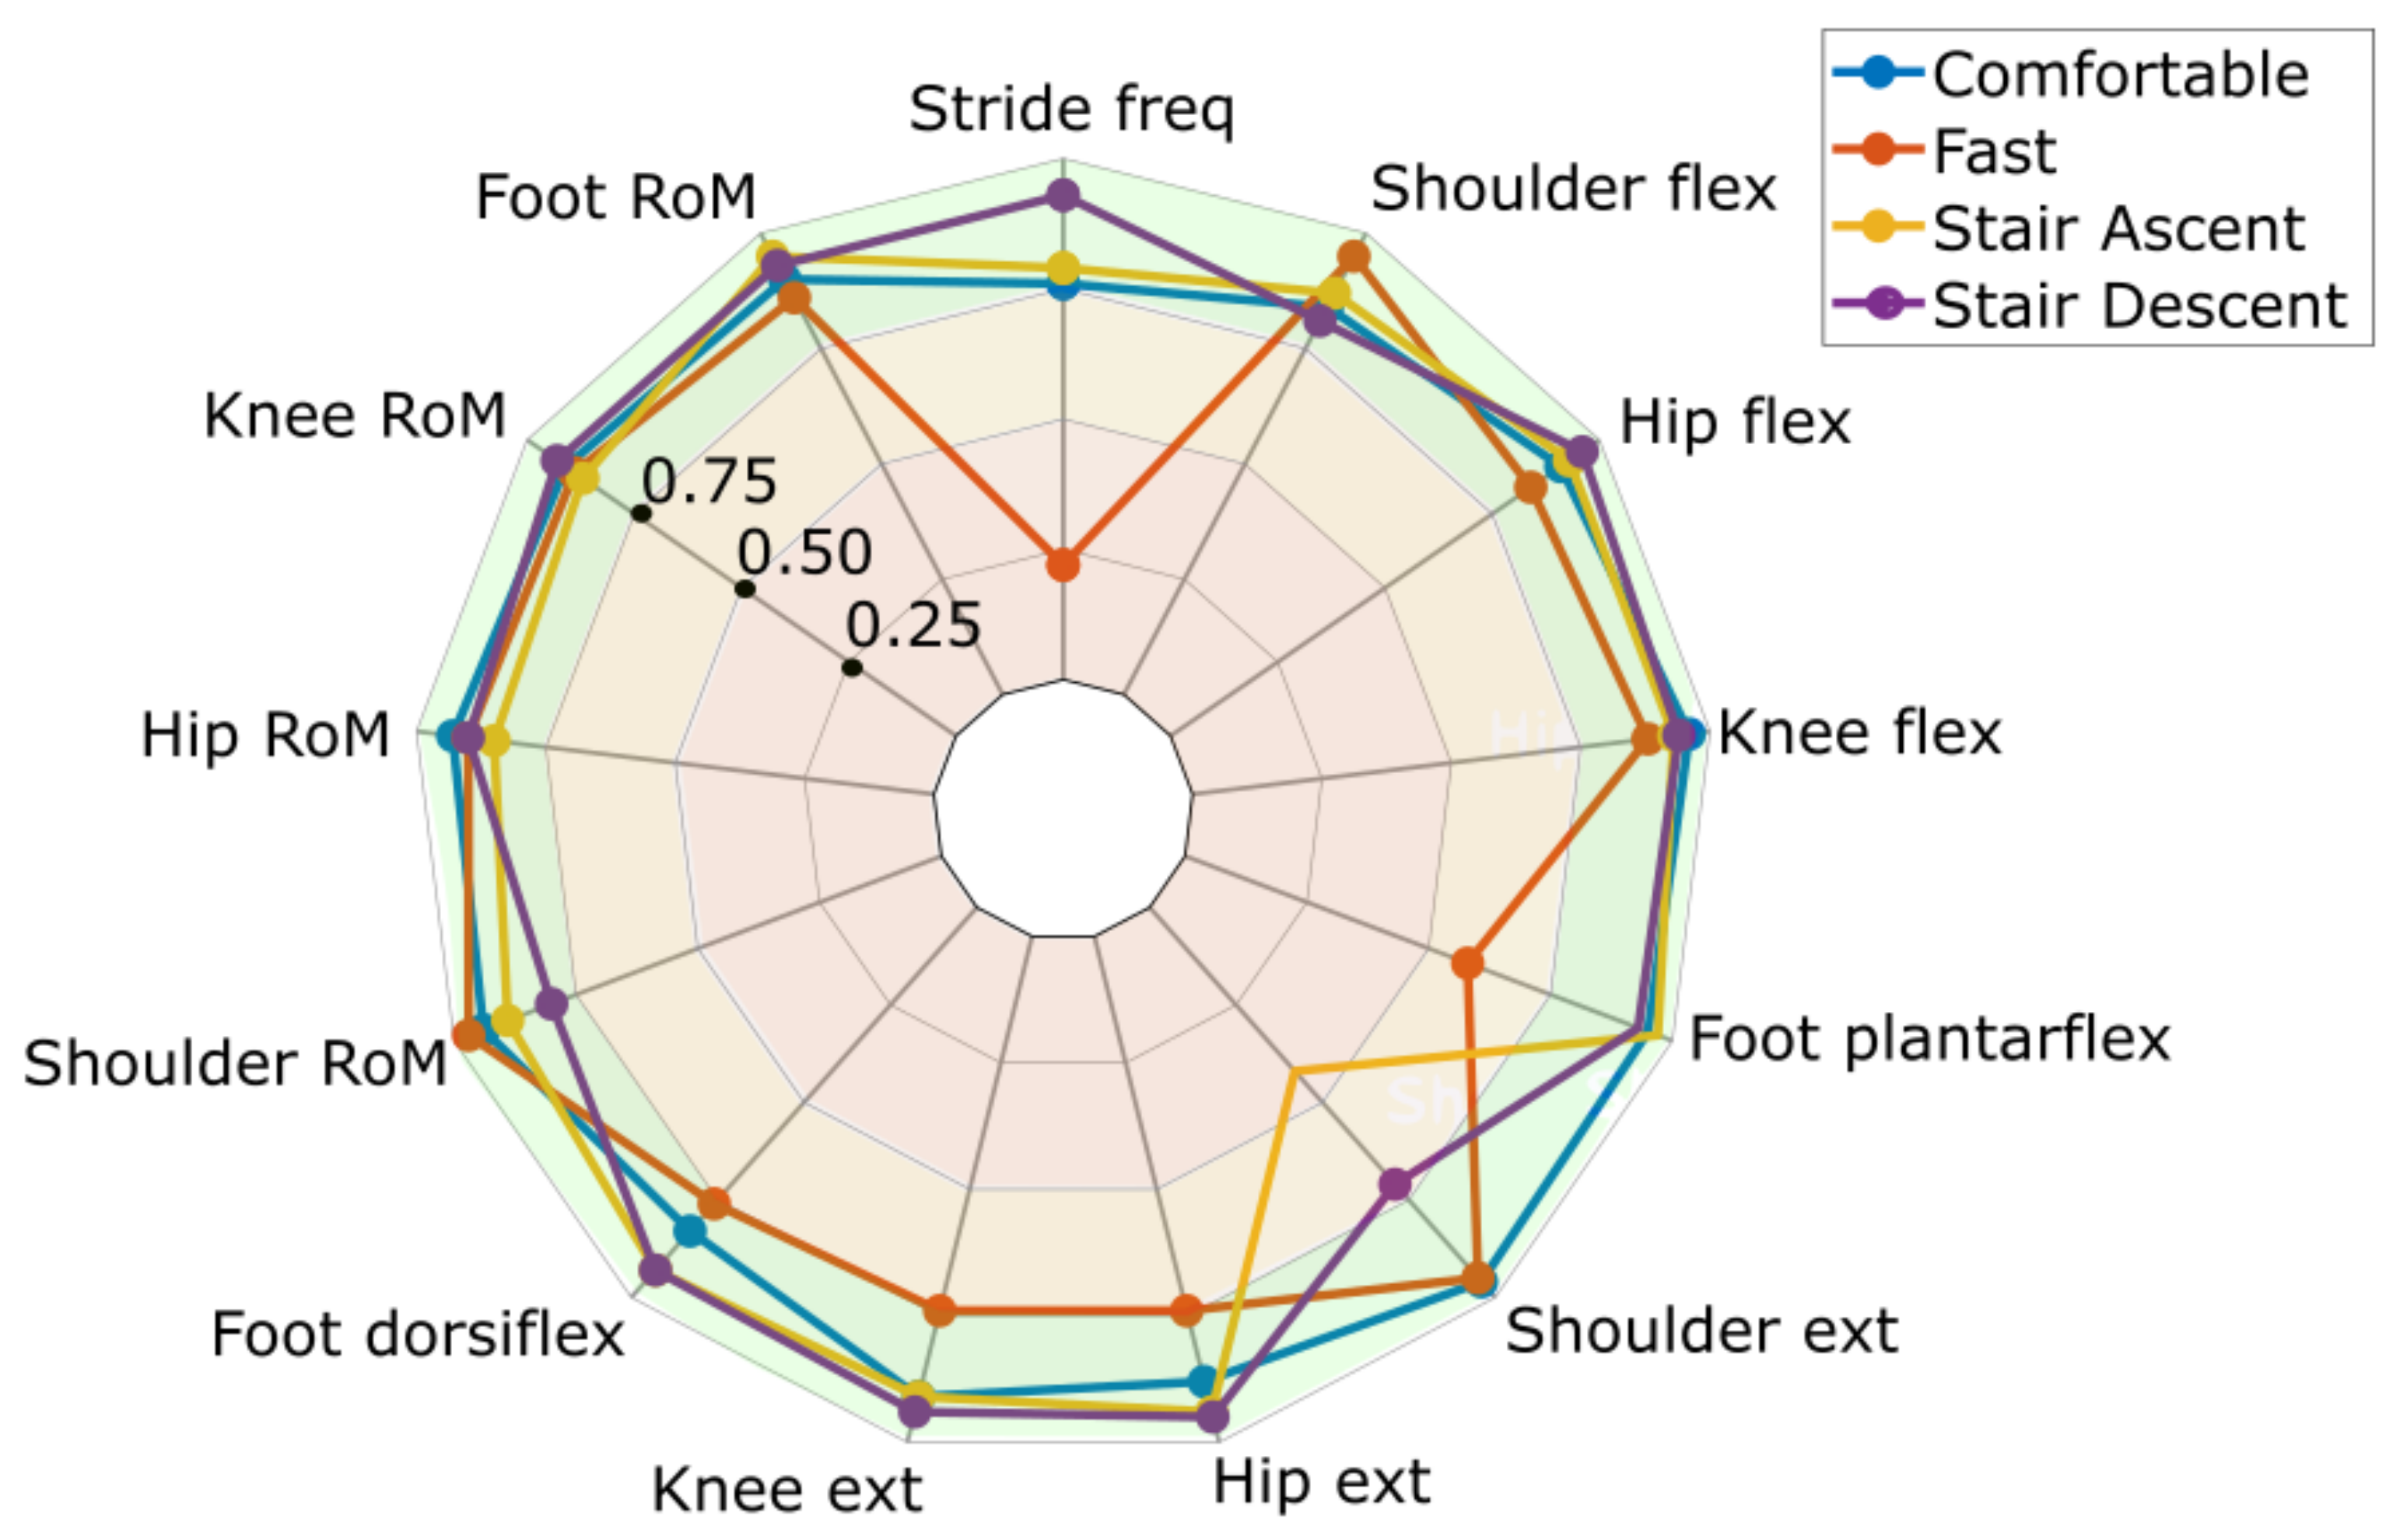
3. Results
4. Discussion
4.1. Test-Retest Reliability
4.2. Methodological Aspects
4.3. Clinical Implications
5. Conclusions
Author Contributions
Funding
Institutional Review Board Statement
Informed Consent Statement
Data Availability Statement
Conflicts of Interest
References
- The GBD 2016 Lifetime Risk of Stroke Collaborators; Feigin, V.L.; Nguyen, G.; Cercy, K.; Johnson, C.O.; Alam, T.; Parmar, P.G.; Abajobir, A.A.; Abate, K.H.; Abd-Allah, F.; et al. Global, Regional, and Country-Specific Lifetime Risks of Stroke, 1990 and 2016. N. Engl. J. Med. 2018, 379, 2429–2437. [Google Scholar] [CrossRef]
- Jorgensen, H.S.; Nakayama, H.; Raaschou, H.O.; Olsen, T.S. Recovery of walking function in stroke patients: The Copenhagen Stroke Study. Arch. Phys. Med. Rehabil. 1995, 76, 27–32. [Google Scholar] [CrossRef]
- Cheng, D.K.; Nelson, M.; Brooks, D.; Salbach, N.M. Validation of stroke-specific protocols for the 10-meter walk test and 6-minute walk test conducted using 15-meter and 30-meter walkways. Top. Stroke Rehabil. 2020, 27, 251–261. [Google Scholar] [CrossRef] [PubMed]
- Kalinowski, A.; Cutter, G.; Bozinov, N.; Hinman, J.A.; Hittle, M.; Motl, R.; Odden, M.; Nelson, L.M. The timed 25-foot walk in a large cohort of multiple sclerosis patients. Mult. Scler. 2021. [Google Scholar] [CrossRef] [PubMed]
- Ng, S.S.; Ng, H.H.; Chan, K.M.; Lai, J.C.; To, A.K.; Yeung, C.W. Reliability of the 12-step ascend and descend test and its correlation with motor function in people with chronic stroke. J. Rehabil. Med. 2013, 45, 123–129. [Google Scholar] [CrossRef] [Green Version]
- Scivoletto, G.; Tamburella, F.; Laurenza, L.; Foti, C.; Ditunno, J.F.; Molinari, M. Validity and reliability of the 10-m walk test and the 6-min walk test in spinal cord injury patients. Spinal Cord 2011, 49, 736–740. [Google Scholar] [CrossRef]
- Sharififar, S.; Vincent, H.K.; Jonathan, S.; Bishop, M. Quantifying Poststroke Gait Deviations: A Meta-analysis of Observational and Cross-sectional Experimental Trials. J. Stroke Med. 2019, 2, 23–31. [Google Scholar] [CrossRef]
- Guzik, A.; Druzbicki, M.; Perenc, L.; Wolan-Nieroda, A.; Turolla, A.; Kiper, P. Establishing the Minimal Clinically Important Differences for Sagittal Hip Range of Motion in Chronic Stroke Patients. Front. Neurol. 2021, 12, 700190. [Google Scholar] [CrossRef]
- Chang, M.C.; Lee, B.J.; Joo, N.Y.; Park, D. The parameters of gait analysis related to ambulatory and balance functions in hemiplegic stroke patients: A gait analysis study. BMC Neurol. 2021, 21, 38. [Google Scholar] [CrossRef]
- Patterson, K.K.; Parafianowicz, I.; Danells, C.J.; Closson, V.; Verrier, M.C.; Staines, W.R.; Black, S.E.; McIlroy, W.E. Gait asymmetry in community-ambulating stroke survivors. Arch. Phys. Med. Rehabil. 2008, 89, 304–310. [Google Scholar] [CrossRef]
- Stephenson, J.L.; De Serres, S.J.; Lamontagne, A. The effect of arm movements on the lower limb during gait after a stroke. Gait Posture 2010, 31, 109–115. [Google Scholar] [CrossRef]
- Wang, J.C.; Sung, W.H.; Chang, Y.L.; Wu, S.H.; Chuang, T.Y. Speed and temporal-distance adaptations during non-motorized treadmill walking in stroke and non-disabled individuals. Eur. J. Phys. Rehabil. Med. 2017, 53, 863–869. [Google Scholar] [CrossRef]
- Storm, F.A.; Cesareo, A.; Reni, G.; Biffi, E. Wearable Inertial Sensors to Assess Gait during the 6-Minute Walk Test: A Systematic Review. Sensors 2020, 20, 2660. [Google Scholar] [CrossRef] [PubMed]
- Benson, L.C.; Clermont, C.A.; Bošnjak, E.; Ferber, R. The use of wearable devices for walking and running gait analysis outside of the lab: A systematic review. Gait Posture 2018, 63, 124–138. [Google Scholar] [CrossRef] [PubMed]
- Kobsar, D.; Charlton, J.M.; Tse, C.T.F.; Esculier, J.F.; Graffos, A.; Krowchuk, N.M.; Thatcher, D.; Hunt, M.A. Validity and reliability of wearable inertial sensors in healthy adult walking: A systematic review and meta-analysis. J. Neuroeng. Rehabil. 2020, 17, 62. [Google Scholar] [CrossRef] [PubMed]
- Johansson, G.M.; Grip, H.; Levin, M.F.; Hager, C.K. The added value of kinematic evaluation of the timed finger-to-nose test in persons post-stroke. J. Neuroeng. Rehabil. 2017, 14, 11. [Google Scholar] [CrossRef] [Green Version]
- Petraglia, F.; Scarcella, L.; Pedrazzi, G.; Brancato, L.; Puers, R.; Costantino, C. Inertial sensors versus standard systems in gait analysis: A systematic review and meta-analysis. Eur. J. Phys. Rehabil. Med. 2019, 55, 265–280. [Google Scholar] [CrossRef]
- Höglund, G.; Grip, H.; Öhberg, F. The importance of inertial measurement unit placement in assessing upper limb motion. Med. Eng. Phys. 2021, 92, 1–9. [Google Scholar] [CrossRef]
- Pacini Panebianco, G.; Bisi, M.C.; Stagni, R.; Fantozzi, S. Analysis of the performance of 17 algorithms from a systematic review: Influence of sensor position, analysed variable and computational approach in gait timing estimation from IMU measurements. Gait Posture 2018, 66, 76–82. [Google Scholar] [CrossRef]
- Caruso, M.; Sabatini, A.M.; Laidig, D.; Seel, T.; Knaflitz, M.; Della Croce, U.; Cereatti, A. Analysis of the Accuracy of Ten Algorithms for Orientation Estimation Using Inertial and Magnetic Sensing under Optimal Conditions: One Size Does Not Fit All. Sensors 2021, 21, 2543. [Google Scholar] [CrossRef]
- Baker, R.; Esquenazi, A.; Benedetti, M.G.; Desloovere, K. Gait analysis: Clinical facts. Eur. J. Phys. Rehabil. Med. 2016, 52, 560–574. [Google Scholar]
- van Melick, N.; Meddeler, B.M.; Hoogeboom, T.J.; Nijhuis-van der Sanden, M.W.G.; van Cingel, R.E.H. How to determine leg dominance: The agreement between self-reported and observed performance in healthy adults. PLoS ONE 2017, 12, e0189876. [Google Scholar] [CrossRef] [PubMed] [Green Version]
- Öhberg, F.; Lundström, R.; Grip, H. Comparative analysis of different adaptive filters for tracking lower segments of a human body using inertial motion sensors. Meas. Sci. Technol. 2013, 24, 1–12. [Google Scholar] [CrossRef] [Green Version]
- Sole, G.; Tengman, E.; Grip, H.; Häger, C.K. Knee kinematics during stair descent 20 years following anterior cruciate ligament rupture with and without reconstruction. Clin. Biomech. 2016, 32, 180–186. [Google Scholar] [CrossRef] [PubMed]
- Madgwick, S.O.; Harrison, A.J.; Vaidyanathan, A. Estimation of IMU and MARG orientation using a gradient descent algorithm. IEEE Int. Conf. Rehabil. Robot. 2011, 2011, 5975346. [Google Scholar] [CrossRef] [PubMed]
- Benedetti, M.G.; Catani, F.; Leardini, A.; Pignotti, E.; Giannini, S. Data management in gait analysis for clinical applications. Clin. Biomech. 1998, 13, 204–215. [Google Scholar] [CrossRef]
- Koo, T.K.; Li, M.Y. A Guideline of Selecting and Reporting Intraclass Correlation Coefficients for Reliability Research. J. Chiropr. Med. 2016, 15, 155–163. [Google Scholar] [CrossRef] [Green Version]
- Orlowski, K.; Eckardt, F.; Herold, F.; Aye, N.; Edelmann-Nusser, J.; Witte, K. Examination of the reliability of an inertial sensor-based gait analysis system. Biomed. Tech. 2017, 62, 615–622. [Google Scholar] [CrossRef]
- Fukuchi, C.A.; Fukuchi, R.K.; Duarte, M. Effects of walking speed on gait biomechanics in healthy participants: A systematic review and meta-analysis. Syst. Rev. 2019, 8, 153. [Google Scholar] [CrossRef] [Green Version]
- Öhberg, F.; Bäcklund, T.; Sundström, N.; Grip, H. Portable Sensors Add Reliable Kinematic Measures to the Assessment of Upper Extremity Function. Sensors 2019, 19, 1241. [Google Scholar] [CrossRef] [Green Version]
- Kluge, F.; Gaßner, H.; Hannink, J.; Pasluosta, C.; Klucken, J.; Eskofier, B.M. Towards Mobile Gait Analysis: Concurrent Validity and Test-Retest Reliability of an Inertial Measurement System for the Assessment of Spatio-Temporal Gait Parameters. Sensors 2017, 17, 1522. [Google Scholar] [CrossRef] [PubMed]
- Zahradka, N.; Verma, K.; Behboodi, A.; Bodt, B.; Wright, H.; Lee, S.C.K. An Evaluation of Three Kinematic Methods for Gait Event Detection Compared to the Kinetic-Based ‘Gold Standard’. Sensors 2020, 20, 5272. [Google Scholar] [CrossRef] [PubMed]
- Niswander, W.; Wang, W.; Kontson, K. Optimization of IMU Sensor Placement for the Measurement of Lower Limb Joint Kinematics. Sensors 2020, 20, 5993. [Google Scholar] [CrossRef] [PubMed]
- Fasel, B.; Sporri, J.; Schutz, P.; Lorenzetti, S.; Aminian, K. Validation of functional calibration and strap-down joint drift correction for computing 3D joint angles of knee, hip, and trunk in alpine skiing. PLoS ONE 2017, 12, e0181446. [Google Scholar] [CrossRef] [PubMed]
- Wittmann, F.; Lambercy, O.; Gassert, R. Magnetometer-Based Drift Correction During Rest inIMU Arm Motion Tracking. Sensors 2019, 19, 1312. [Google Scholar] [CrossRef] [Green Version]
- Cimolin, V.; Galli, M. Summary measures for clinical gait analysis: A literature review. Gait Posture 2014, 39, 1005–1010. [Google Scholar] [CrossRef]


Publisher’s Note: MDPI stays neutral with regard to jurisdictional claims in published maps and institutional affiliations. |
© 2022 by the authors. Licensee MDPI, Basel, Switzerland. This article is an open access article distributed under the terms and conditions of the Creative Commons Attribution (CC BY) license (https://creativecommons.org/licenses/by/4.0/).
Share and Cite
Nilsson, S.; Ertzgaard, P.; Lundgren, M.; Grip, H. Test-Retest Reliability of Kinematic and Temporal Outcome Measures for Clinical Gait and Stair Walking Tests, Based on Wearable Inertial Sensors. Sensors 2022, 22, 1171. https://doi.org/10.3390/s22031171
Nilsson S, Ertzgaard P, Lundgren M, Grip H. Test-Retest Reliability of Kinematic and Temporal Outcome Measures for Clinical Gait and Stair Walking Tests, Based on Wearable Inertial Sensors. Sensors. 2022; 22(3):1171. https://doi.org/10.3390/s22031171
Chicago/Turabian StyleNilsson, Sofie, Per Ertzgaard, Mikael Lundgren, and Helena Grip. 2022. "Test-Retest Reliability of Kinematic and Temporal Outcome Measures for Clinical Gait and Stair Walking Tests, Based on Wearable Inertial Sensors" Sensors 22, no. 3: 1171. https://doi.org/10.3390/s22031171