
Automated Identification of Overheated Belt Conveyor Idlers in Thermal Images with Complex Backgrounds Using Binary Classification with CNN


Abstract
:1. Introduction
- 1.
- A novel method based on binary classification with CNN was developed for classification of overheated idlers in segmented frames.
- 2.
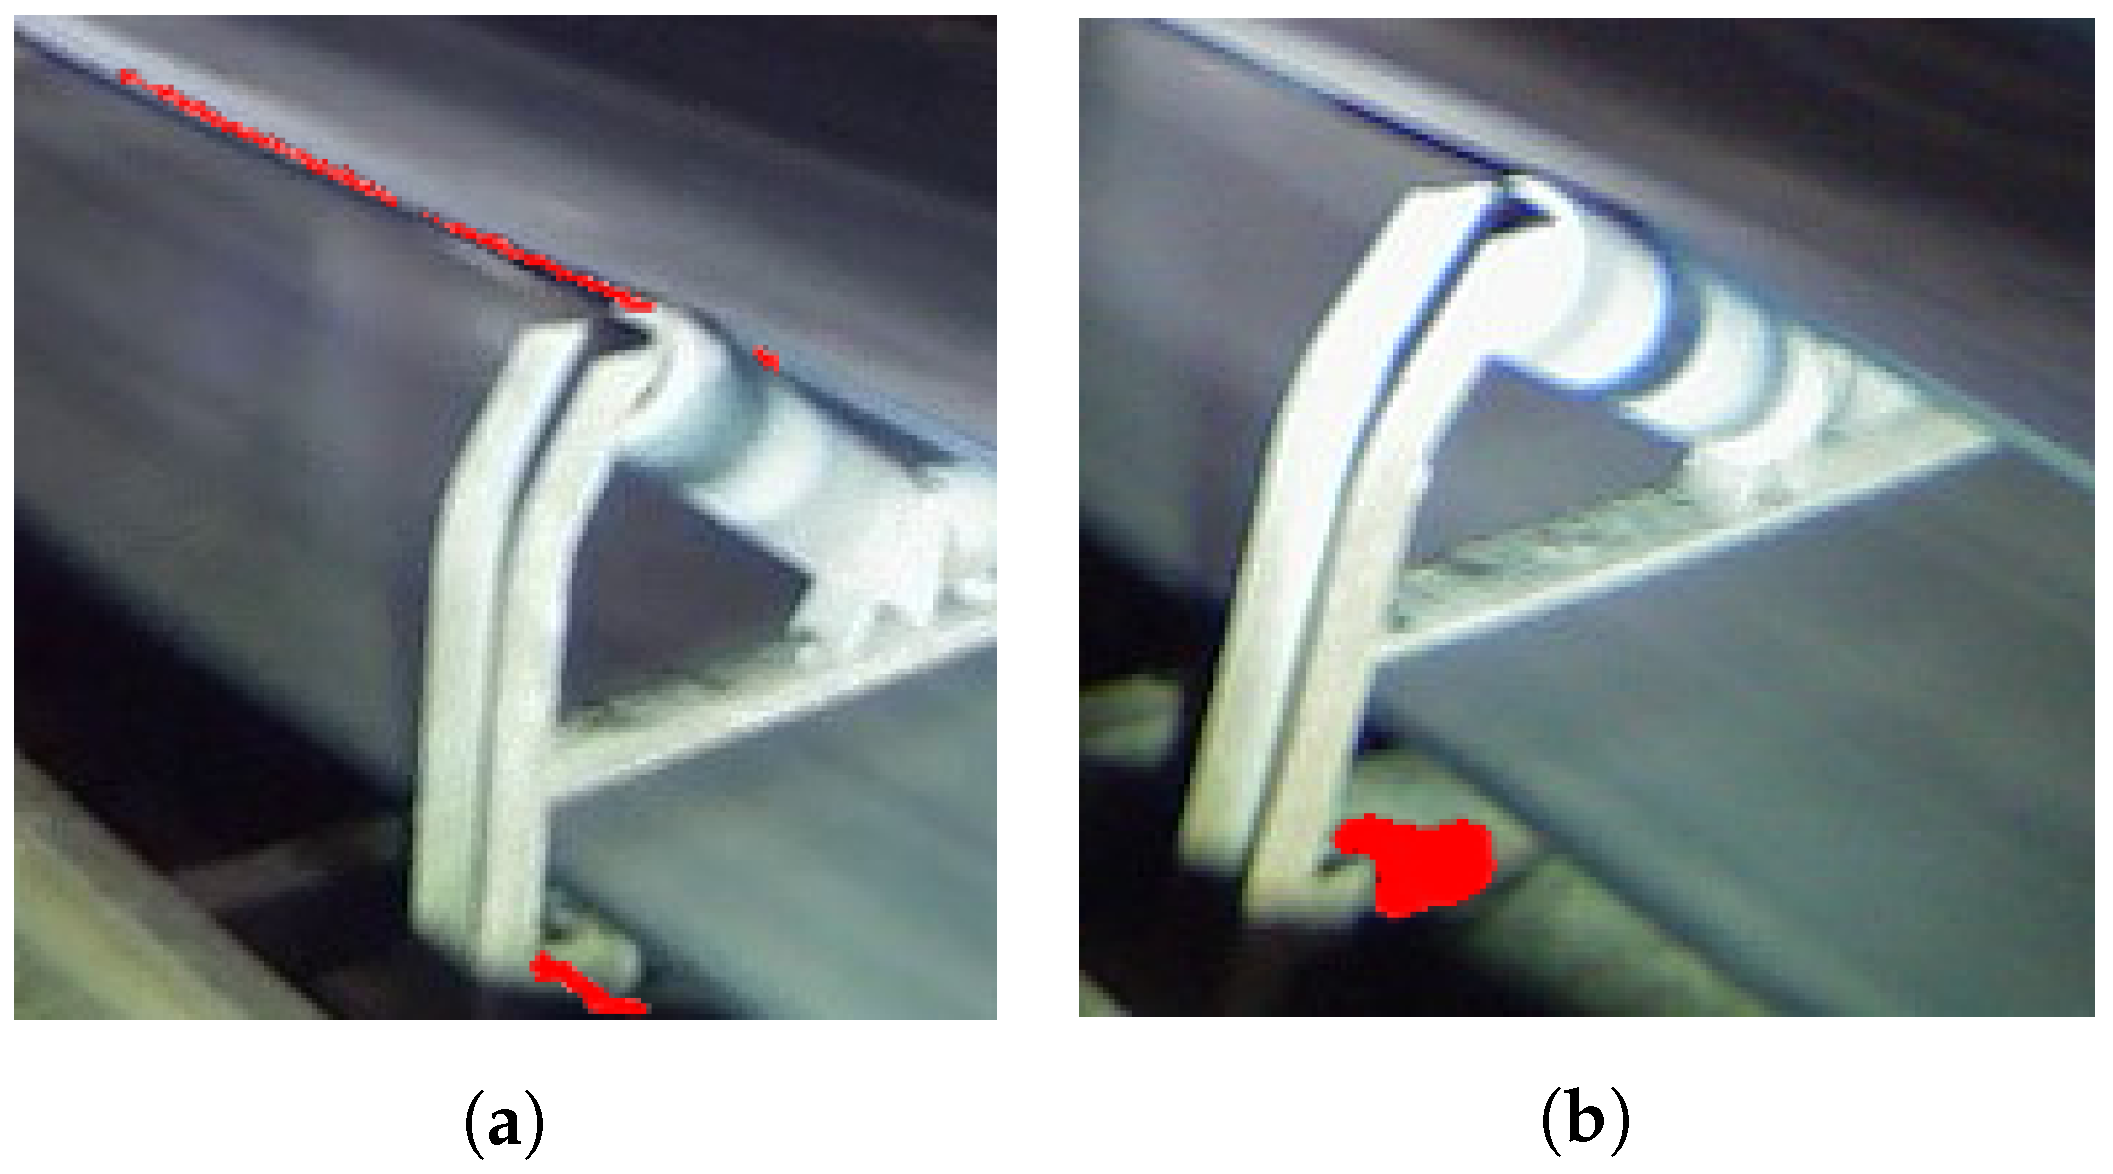
- We showed that our proposed CM method can accurately classify the overheated idlers, even in IR images with complex backgrounds.
- 3.
- Our novel CM method based on the deep learning approach was compared against an IRT method that was specifically developed for identification of the overheated idlers in IR images.
2. Literature Review
3. Materials and Methods
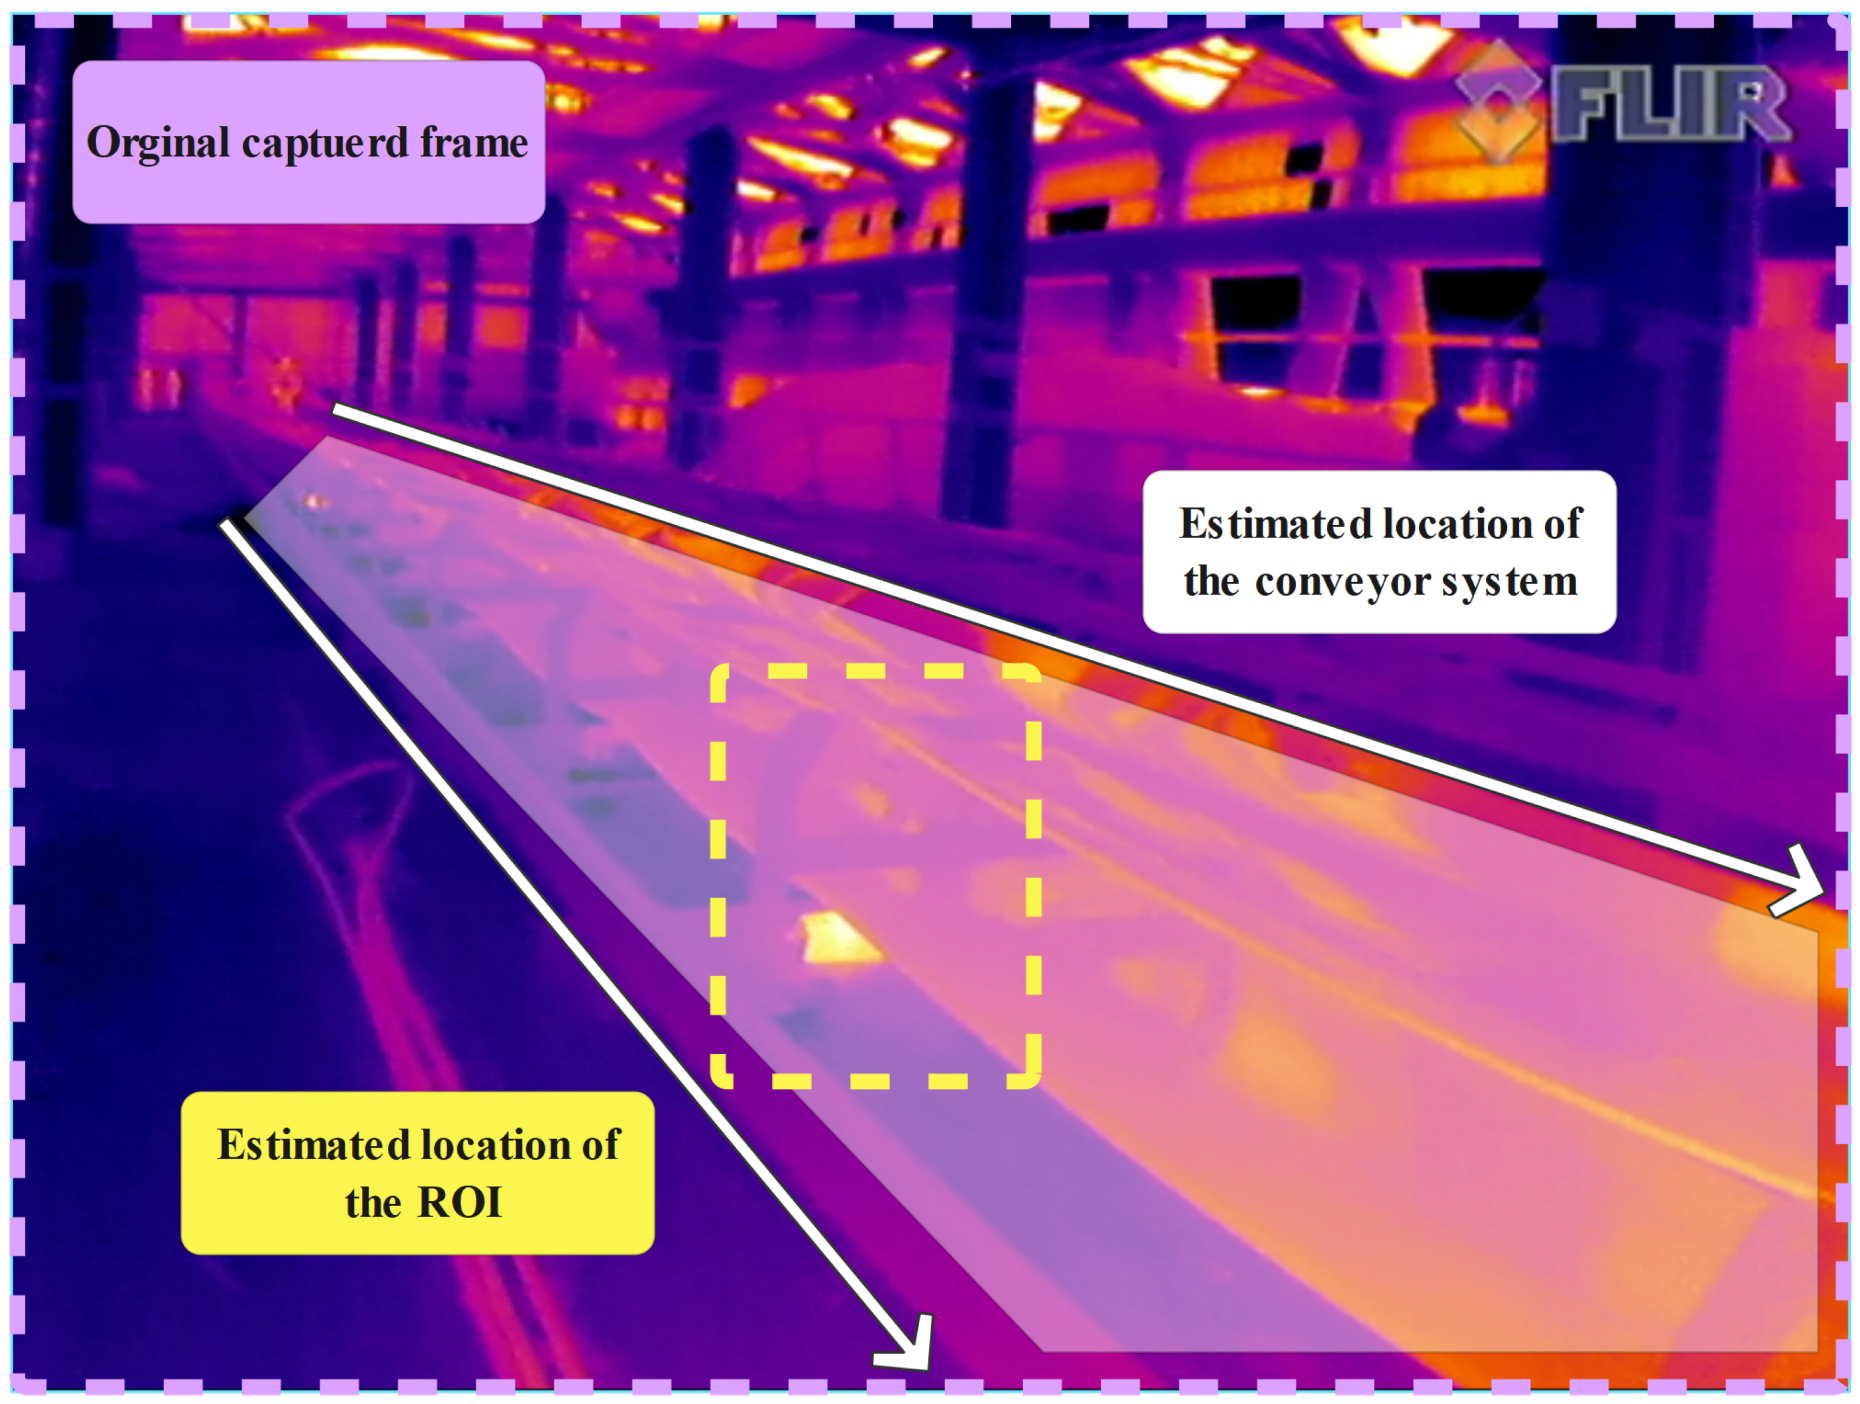
3.1. Region of Interest Estimation
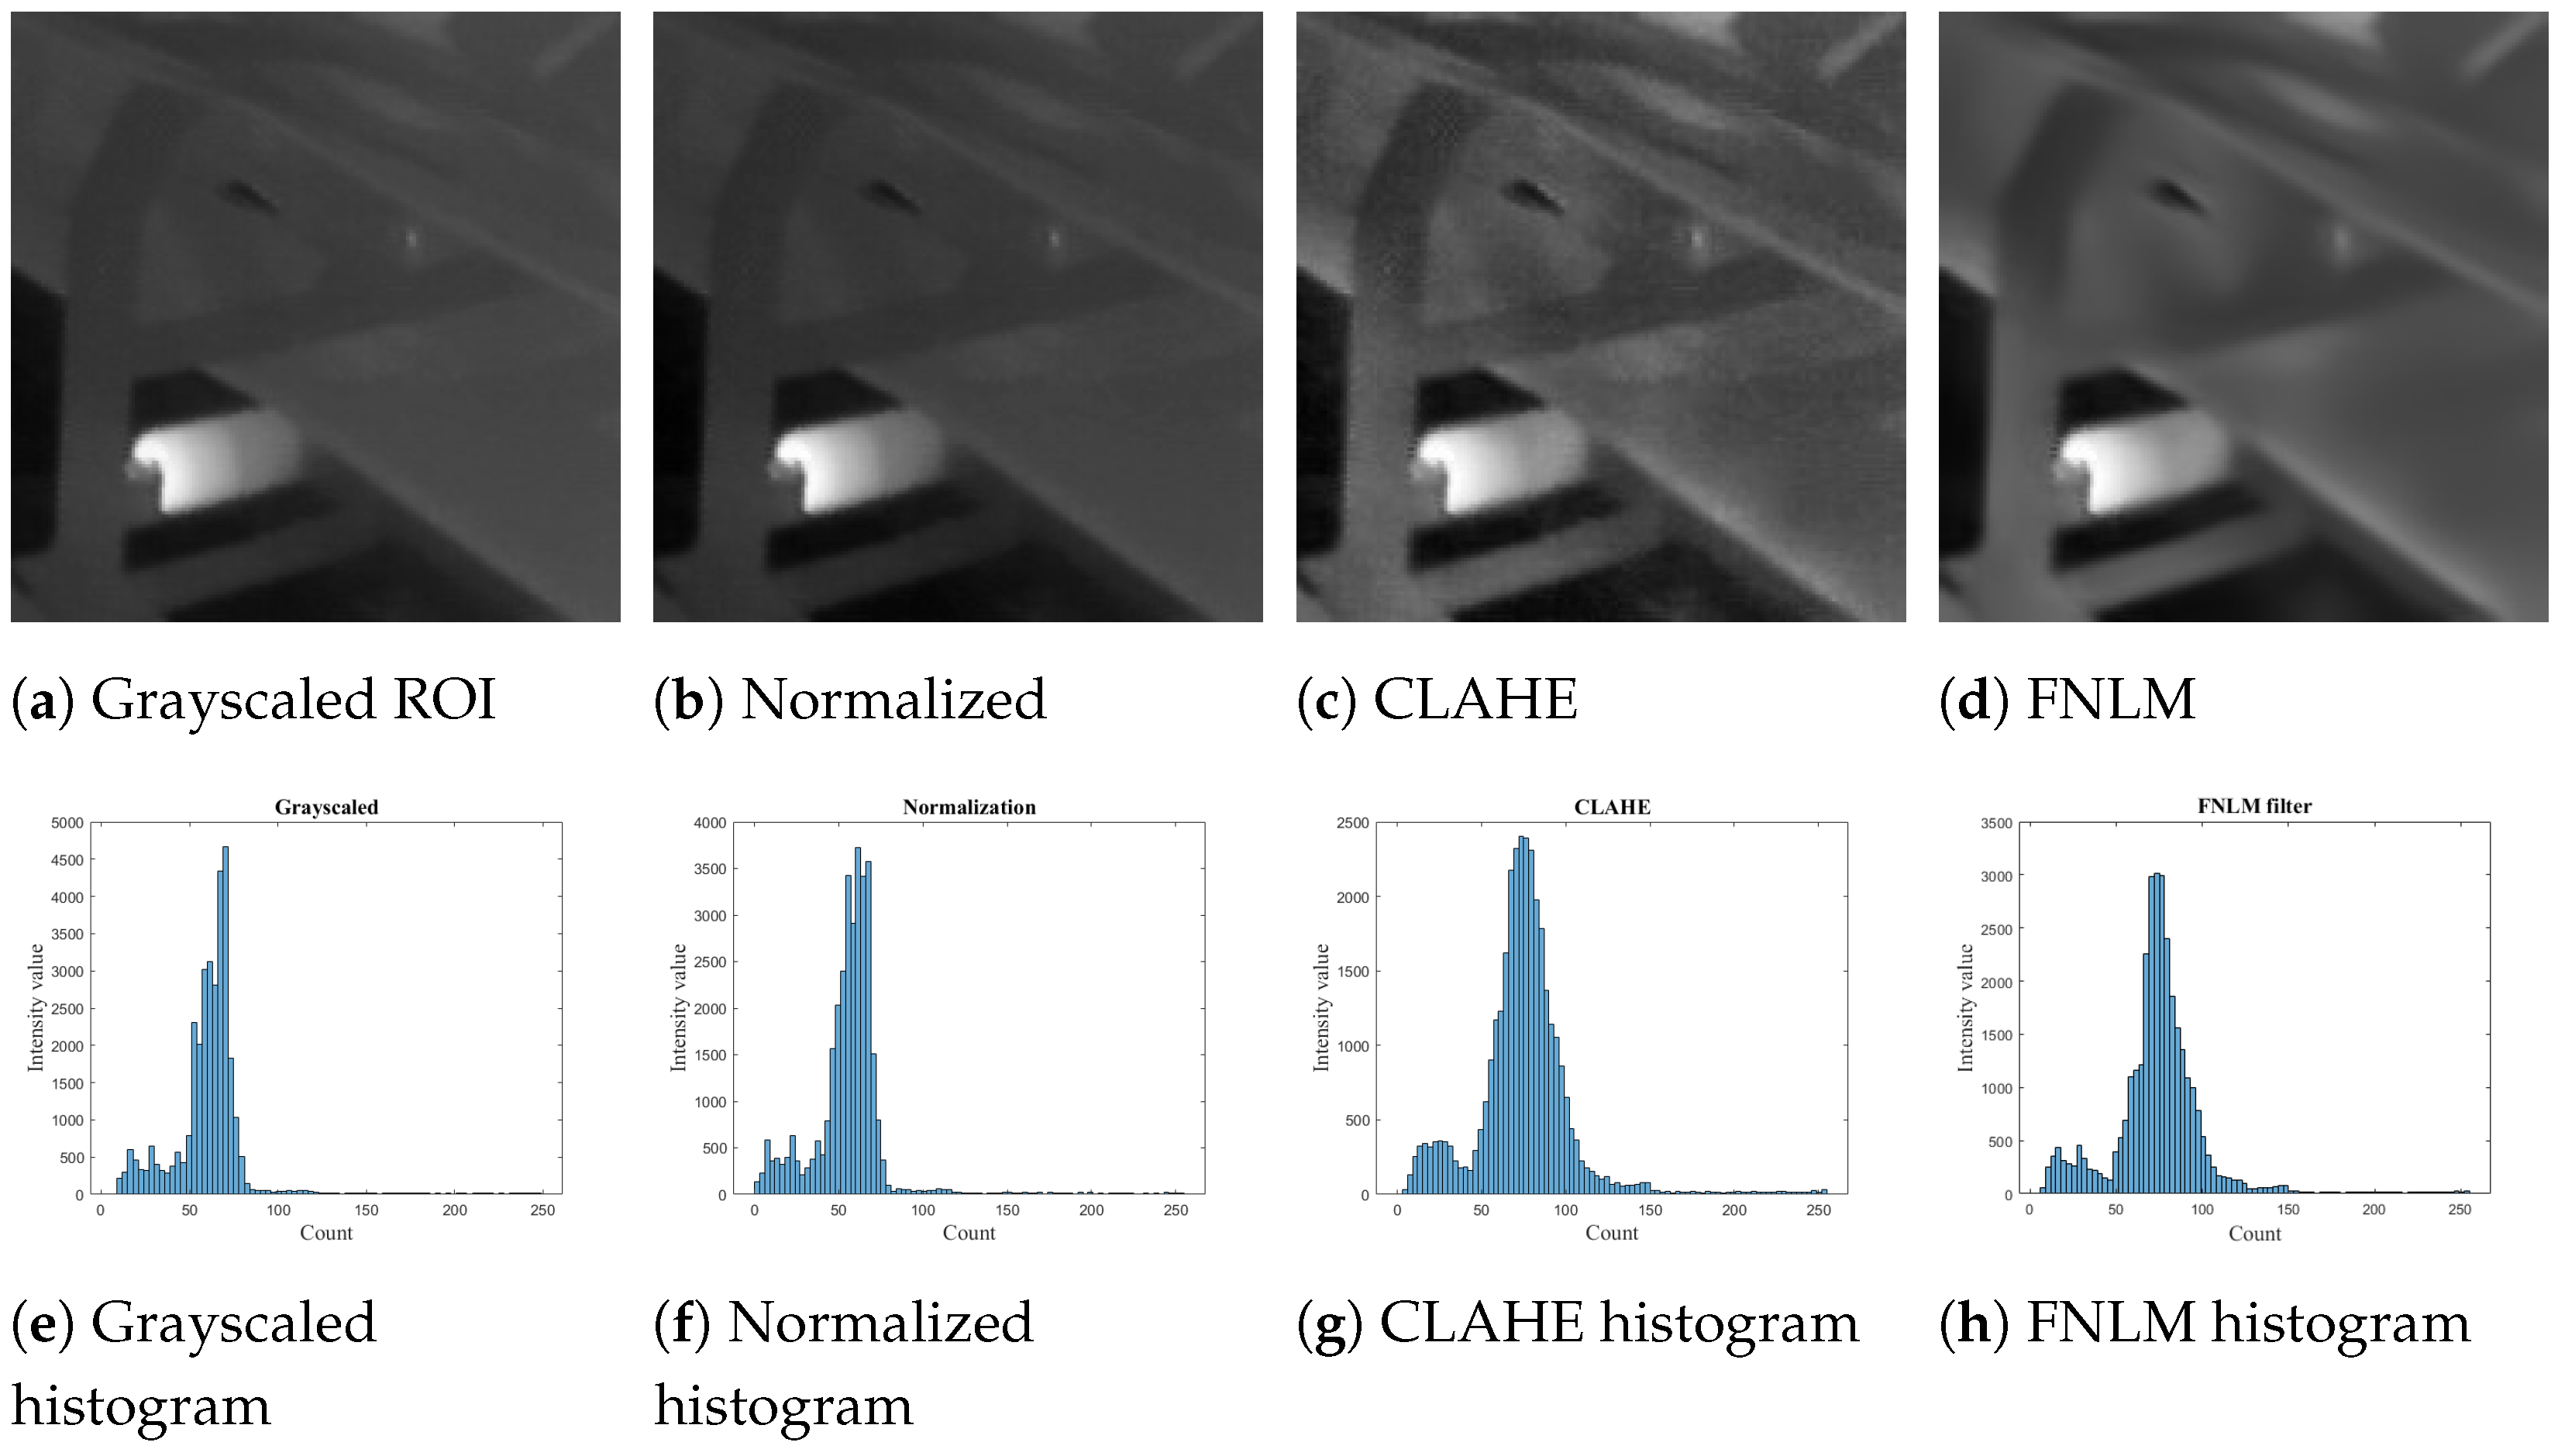
3.2. Pre-Processing of Region of Interests
3.2.1. Normalization
3.2.2. CLAHE Method
3.2.3. Fast Non-Local Means Algorithm
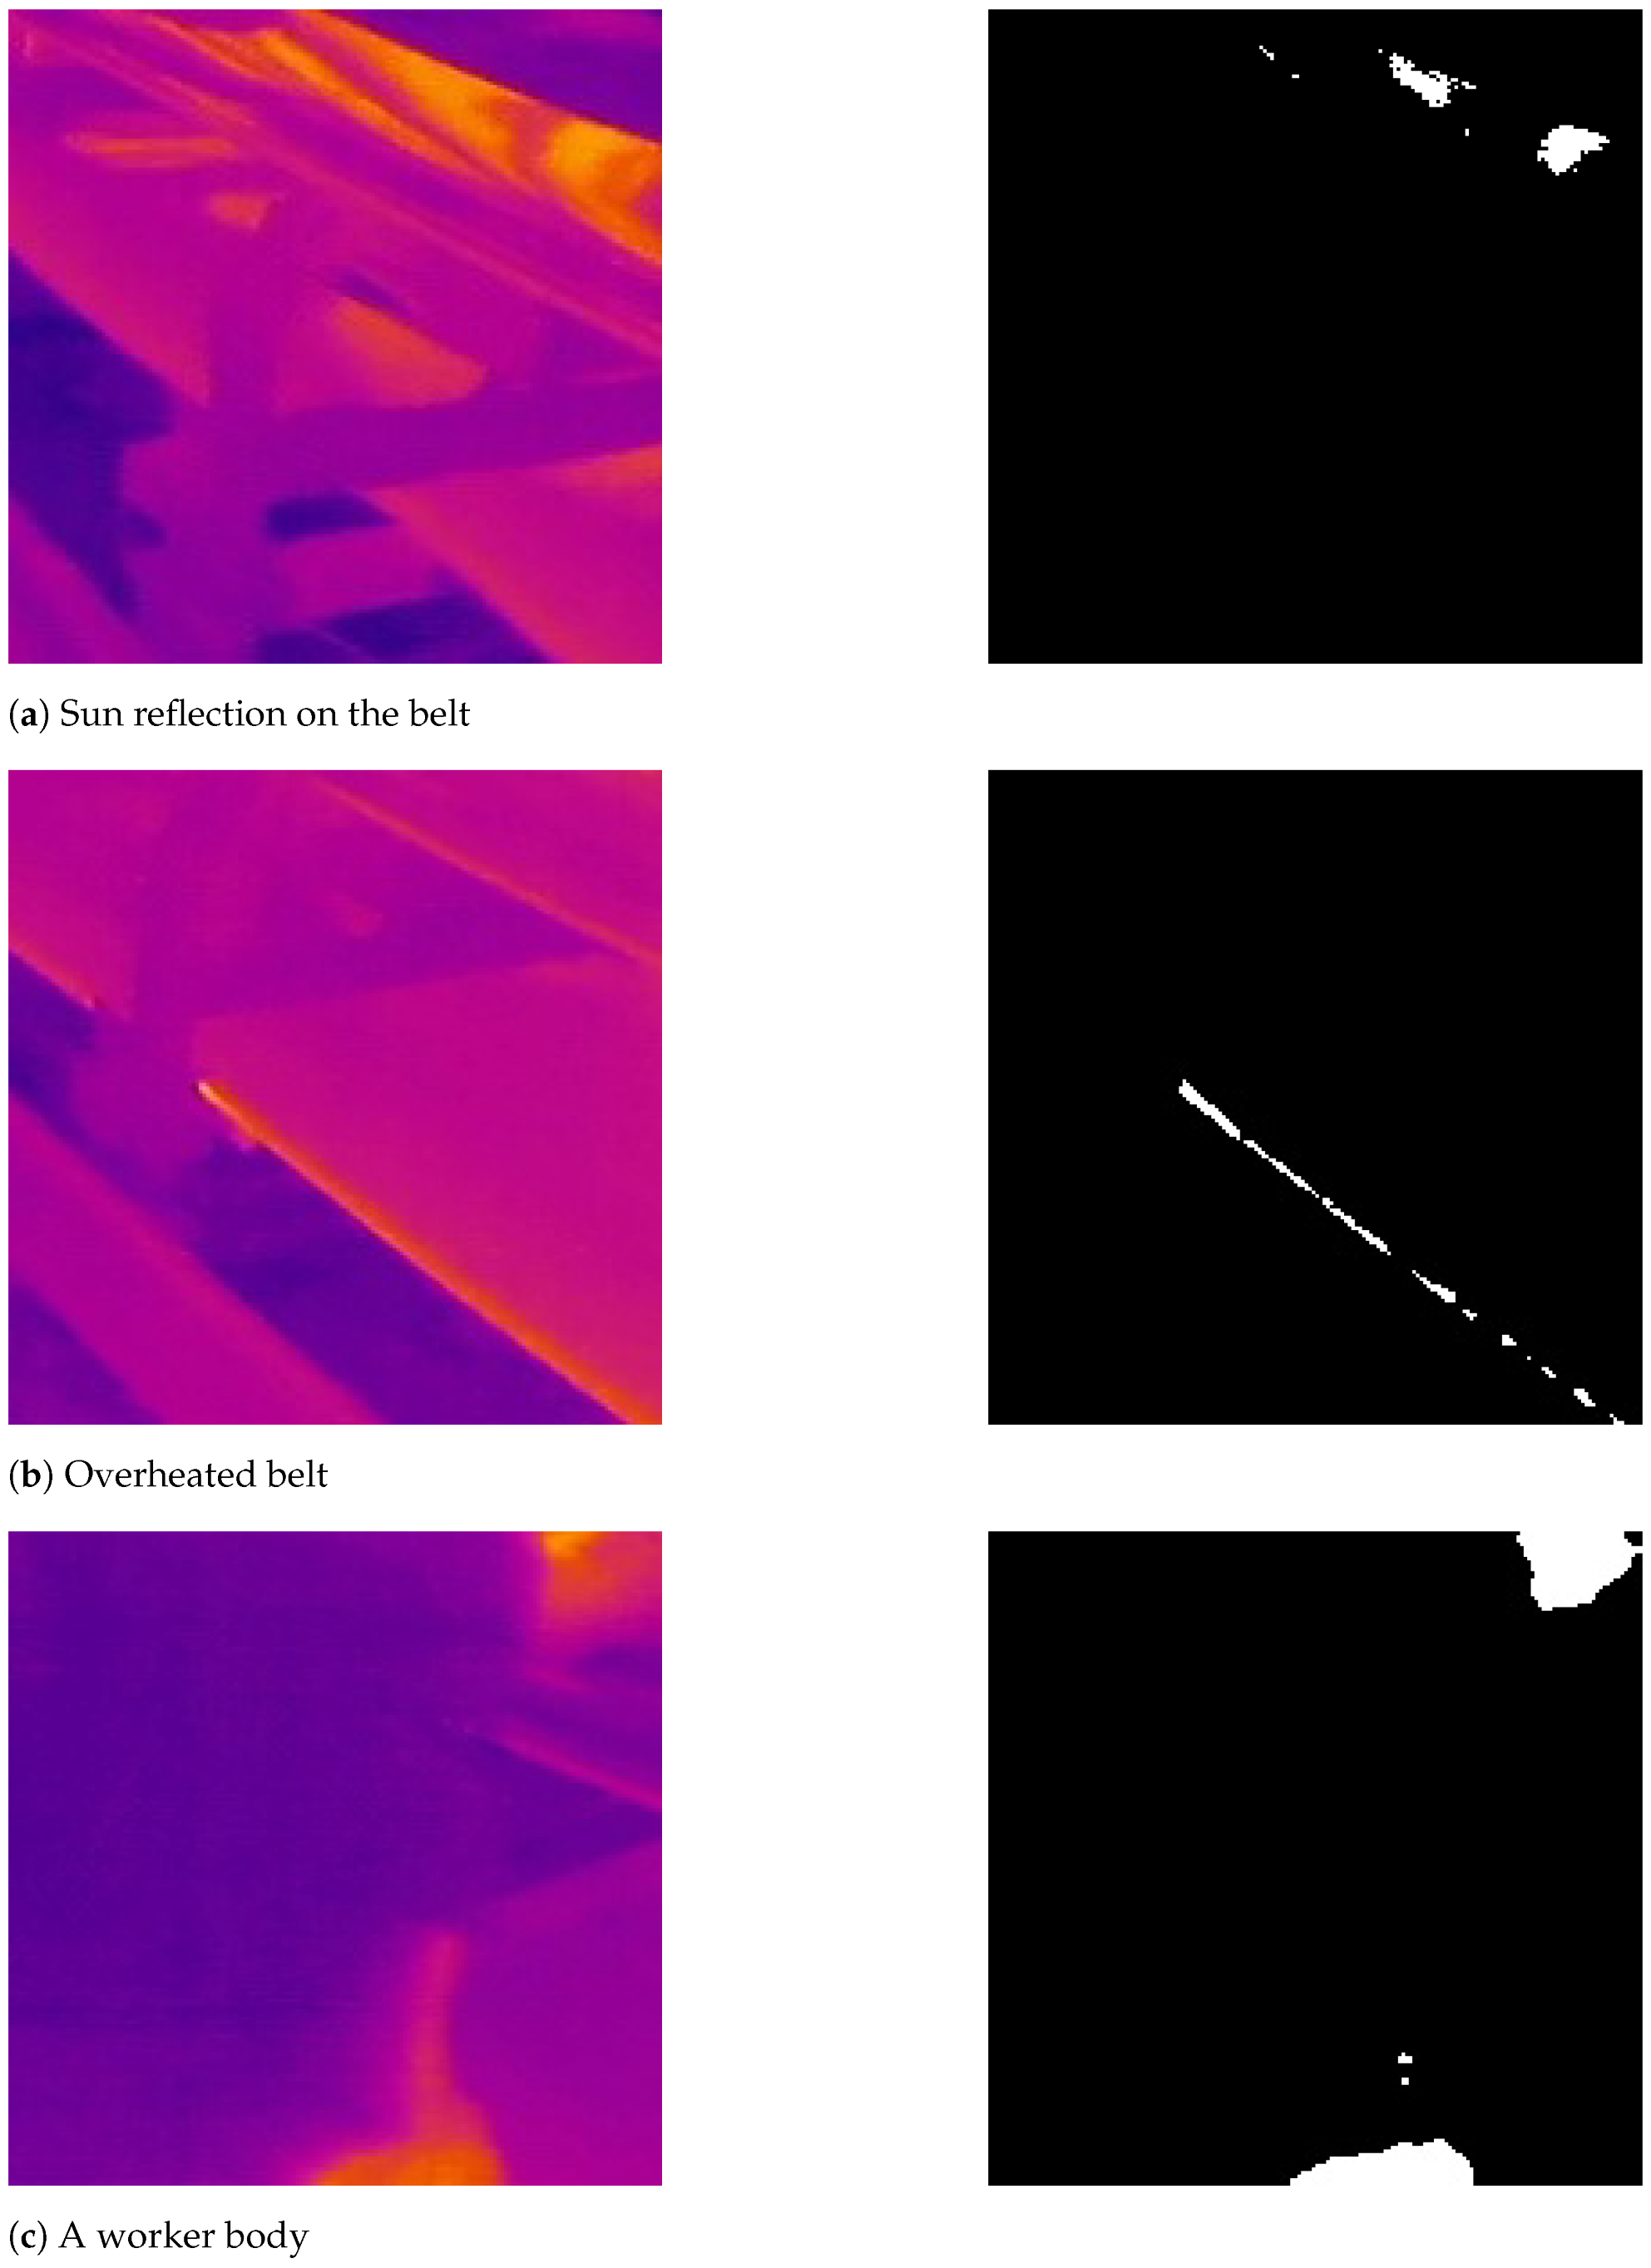
3.3. IR Image Segmentation
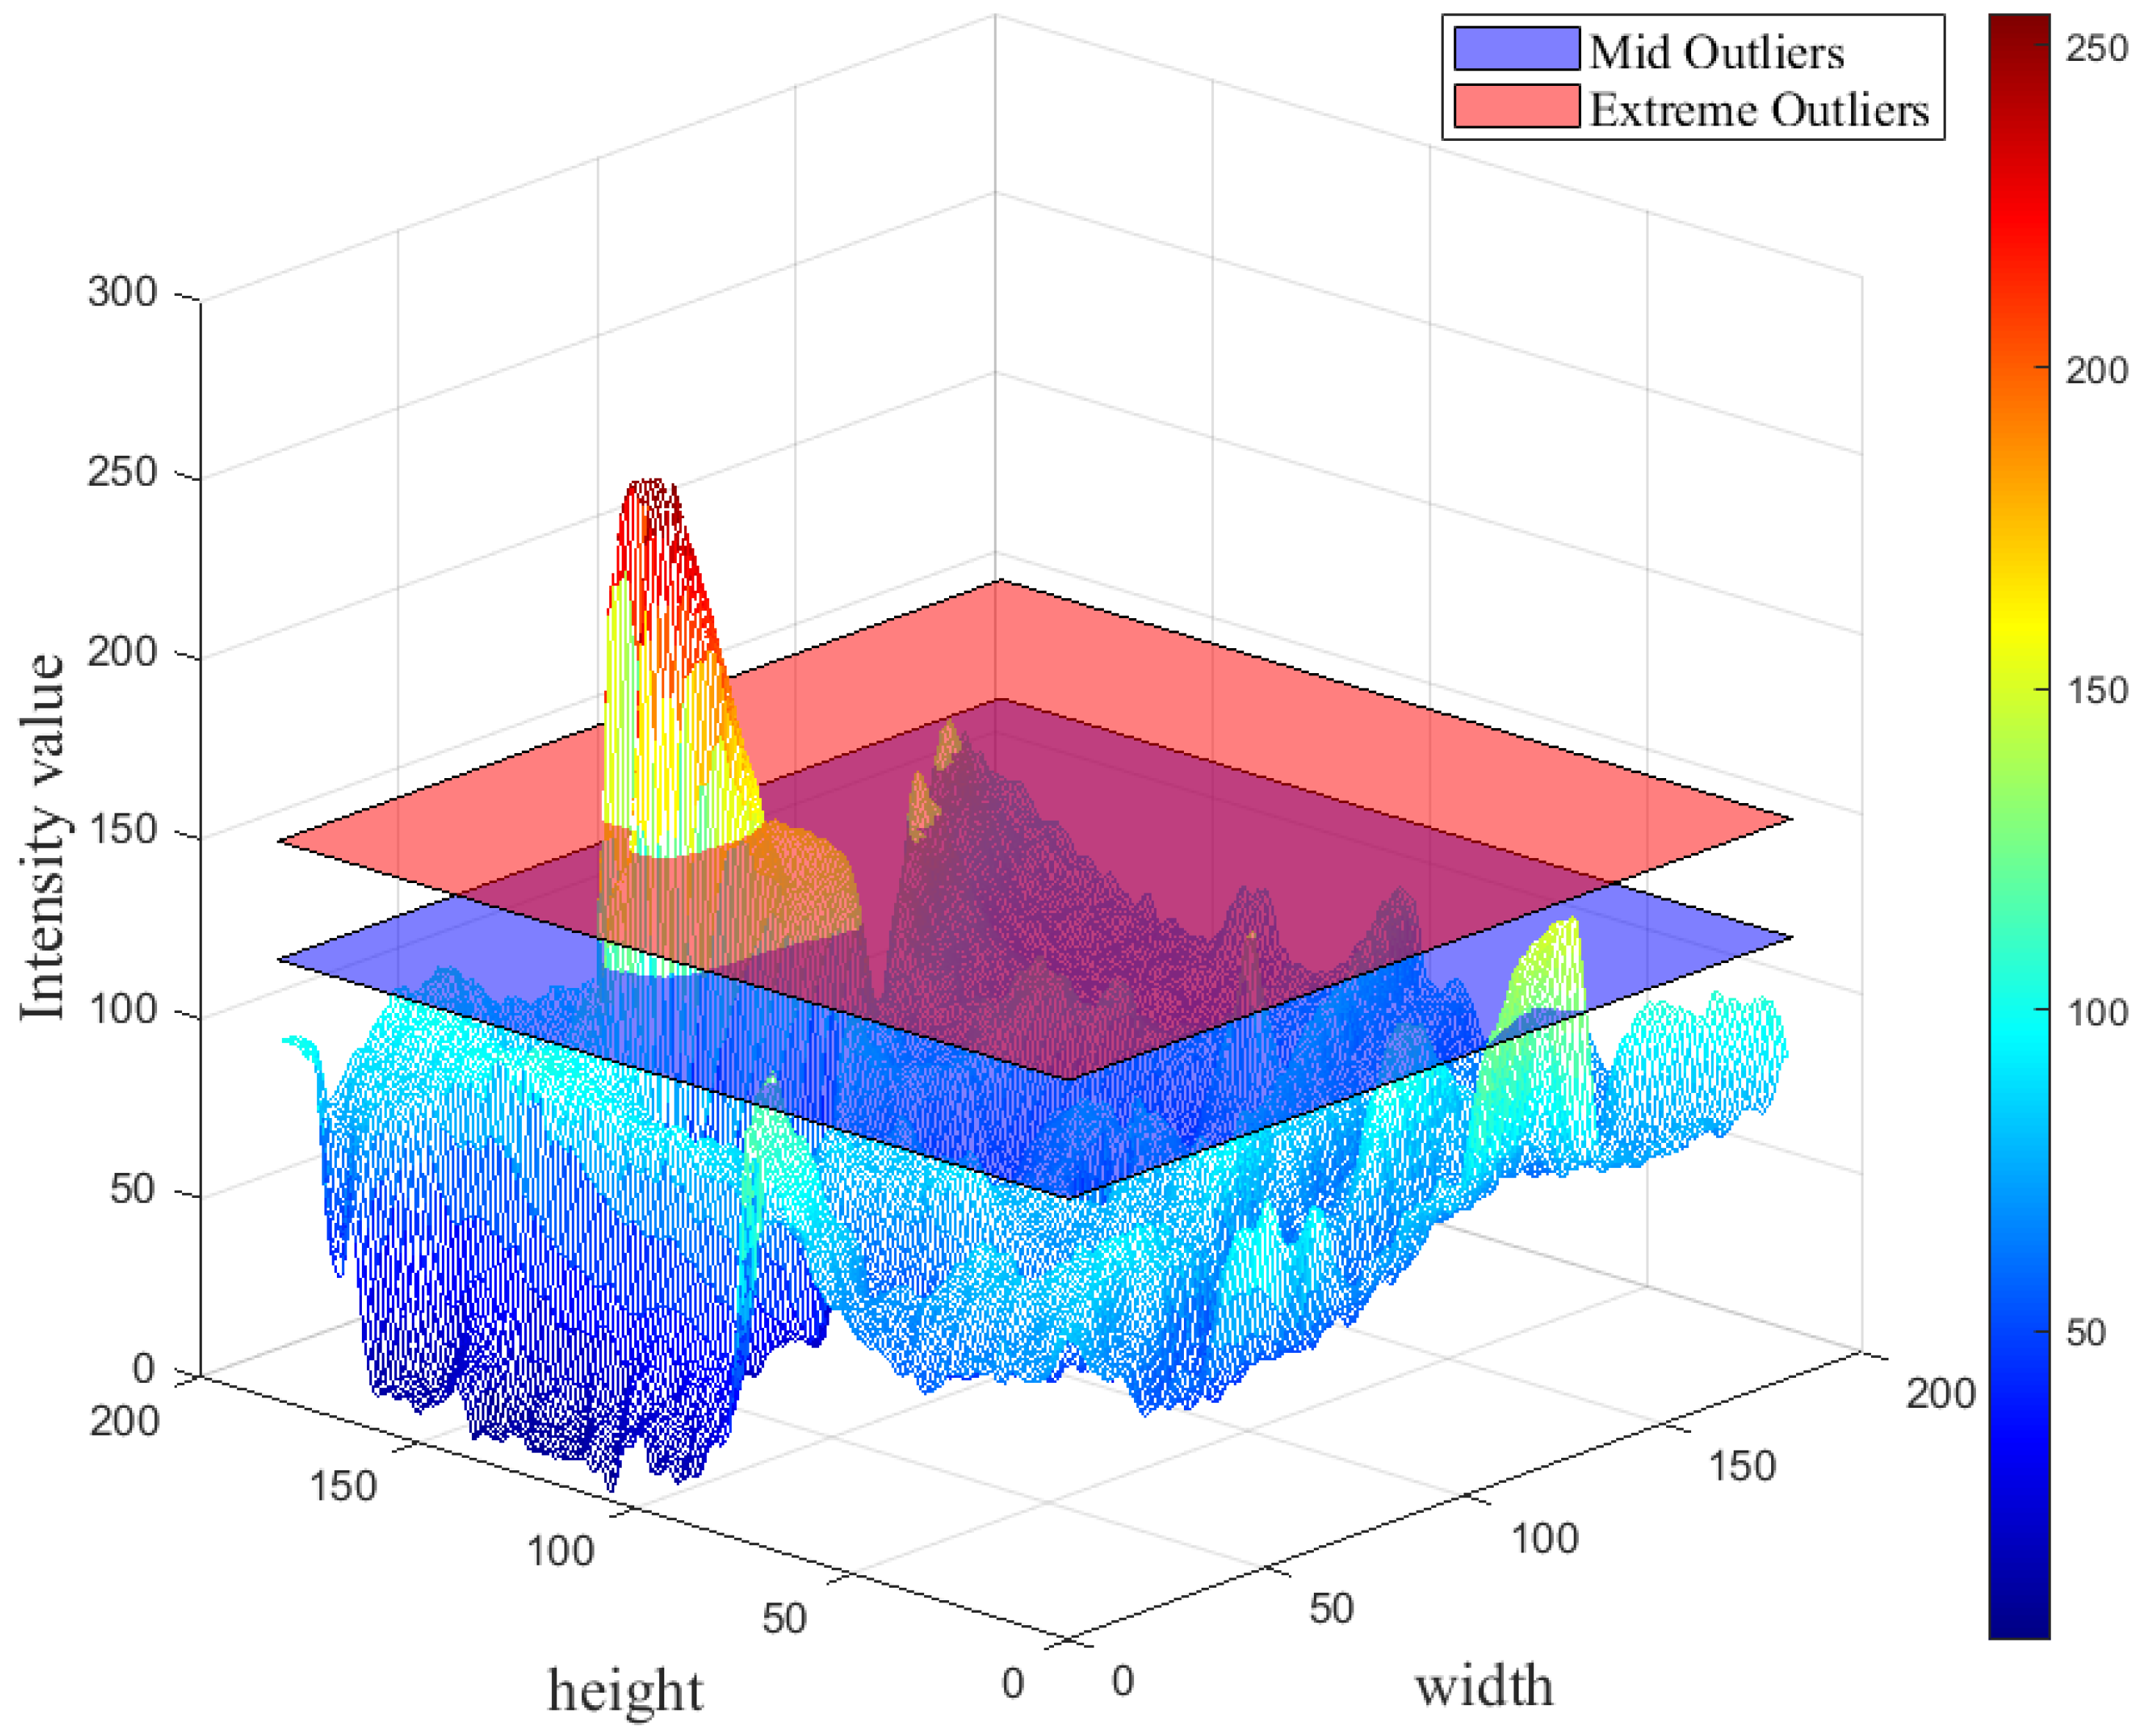
3.3.1. Histogram Analysis of IR Images
3.3.2. Anomaly Detection
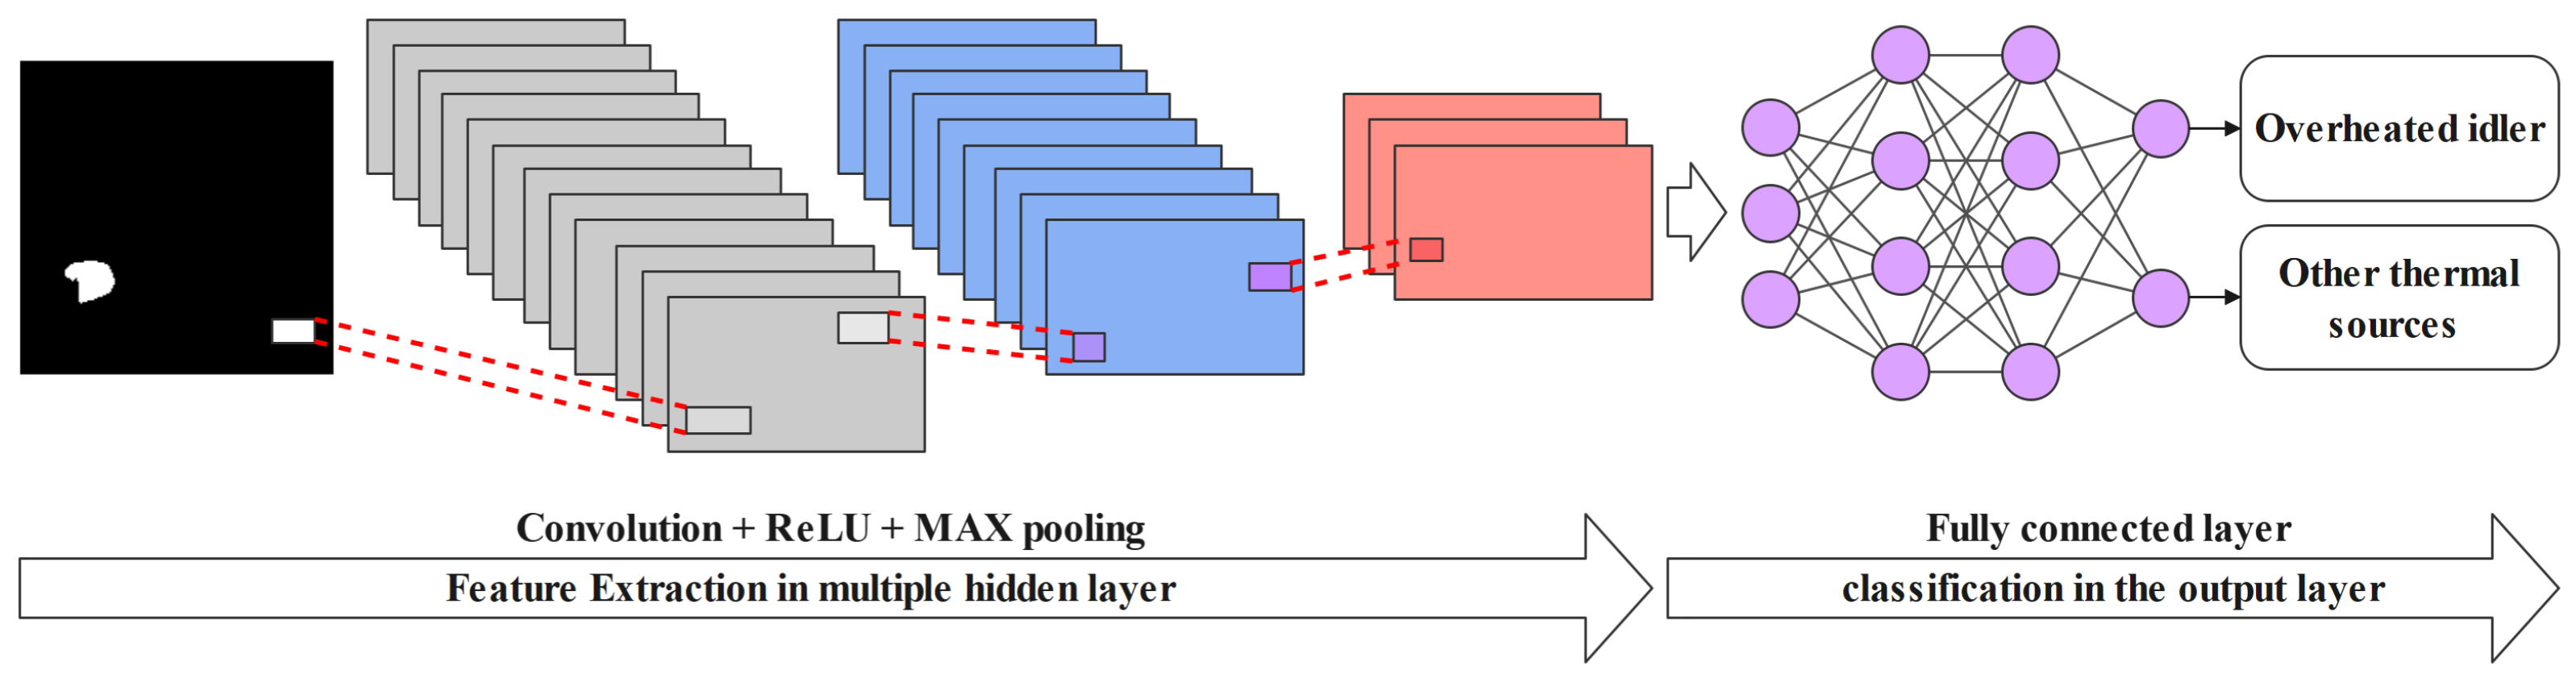
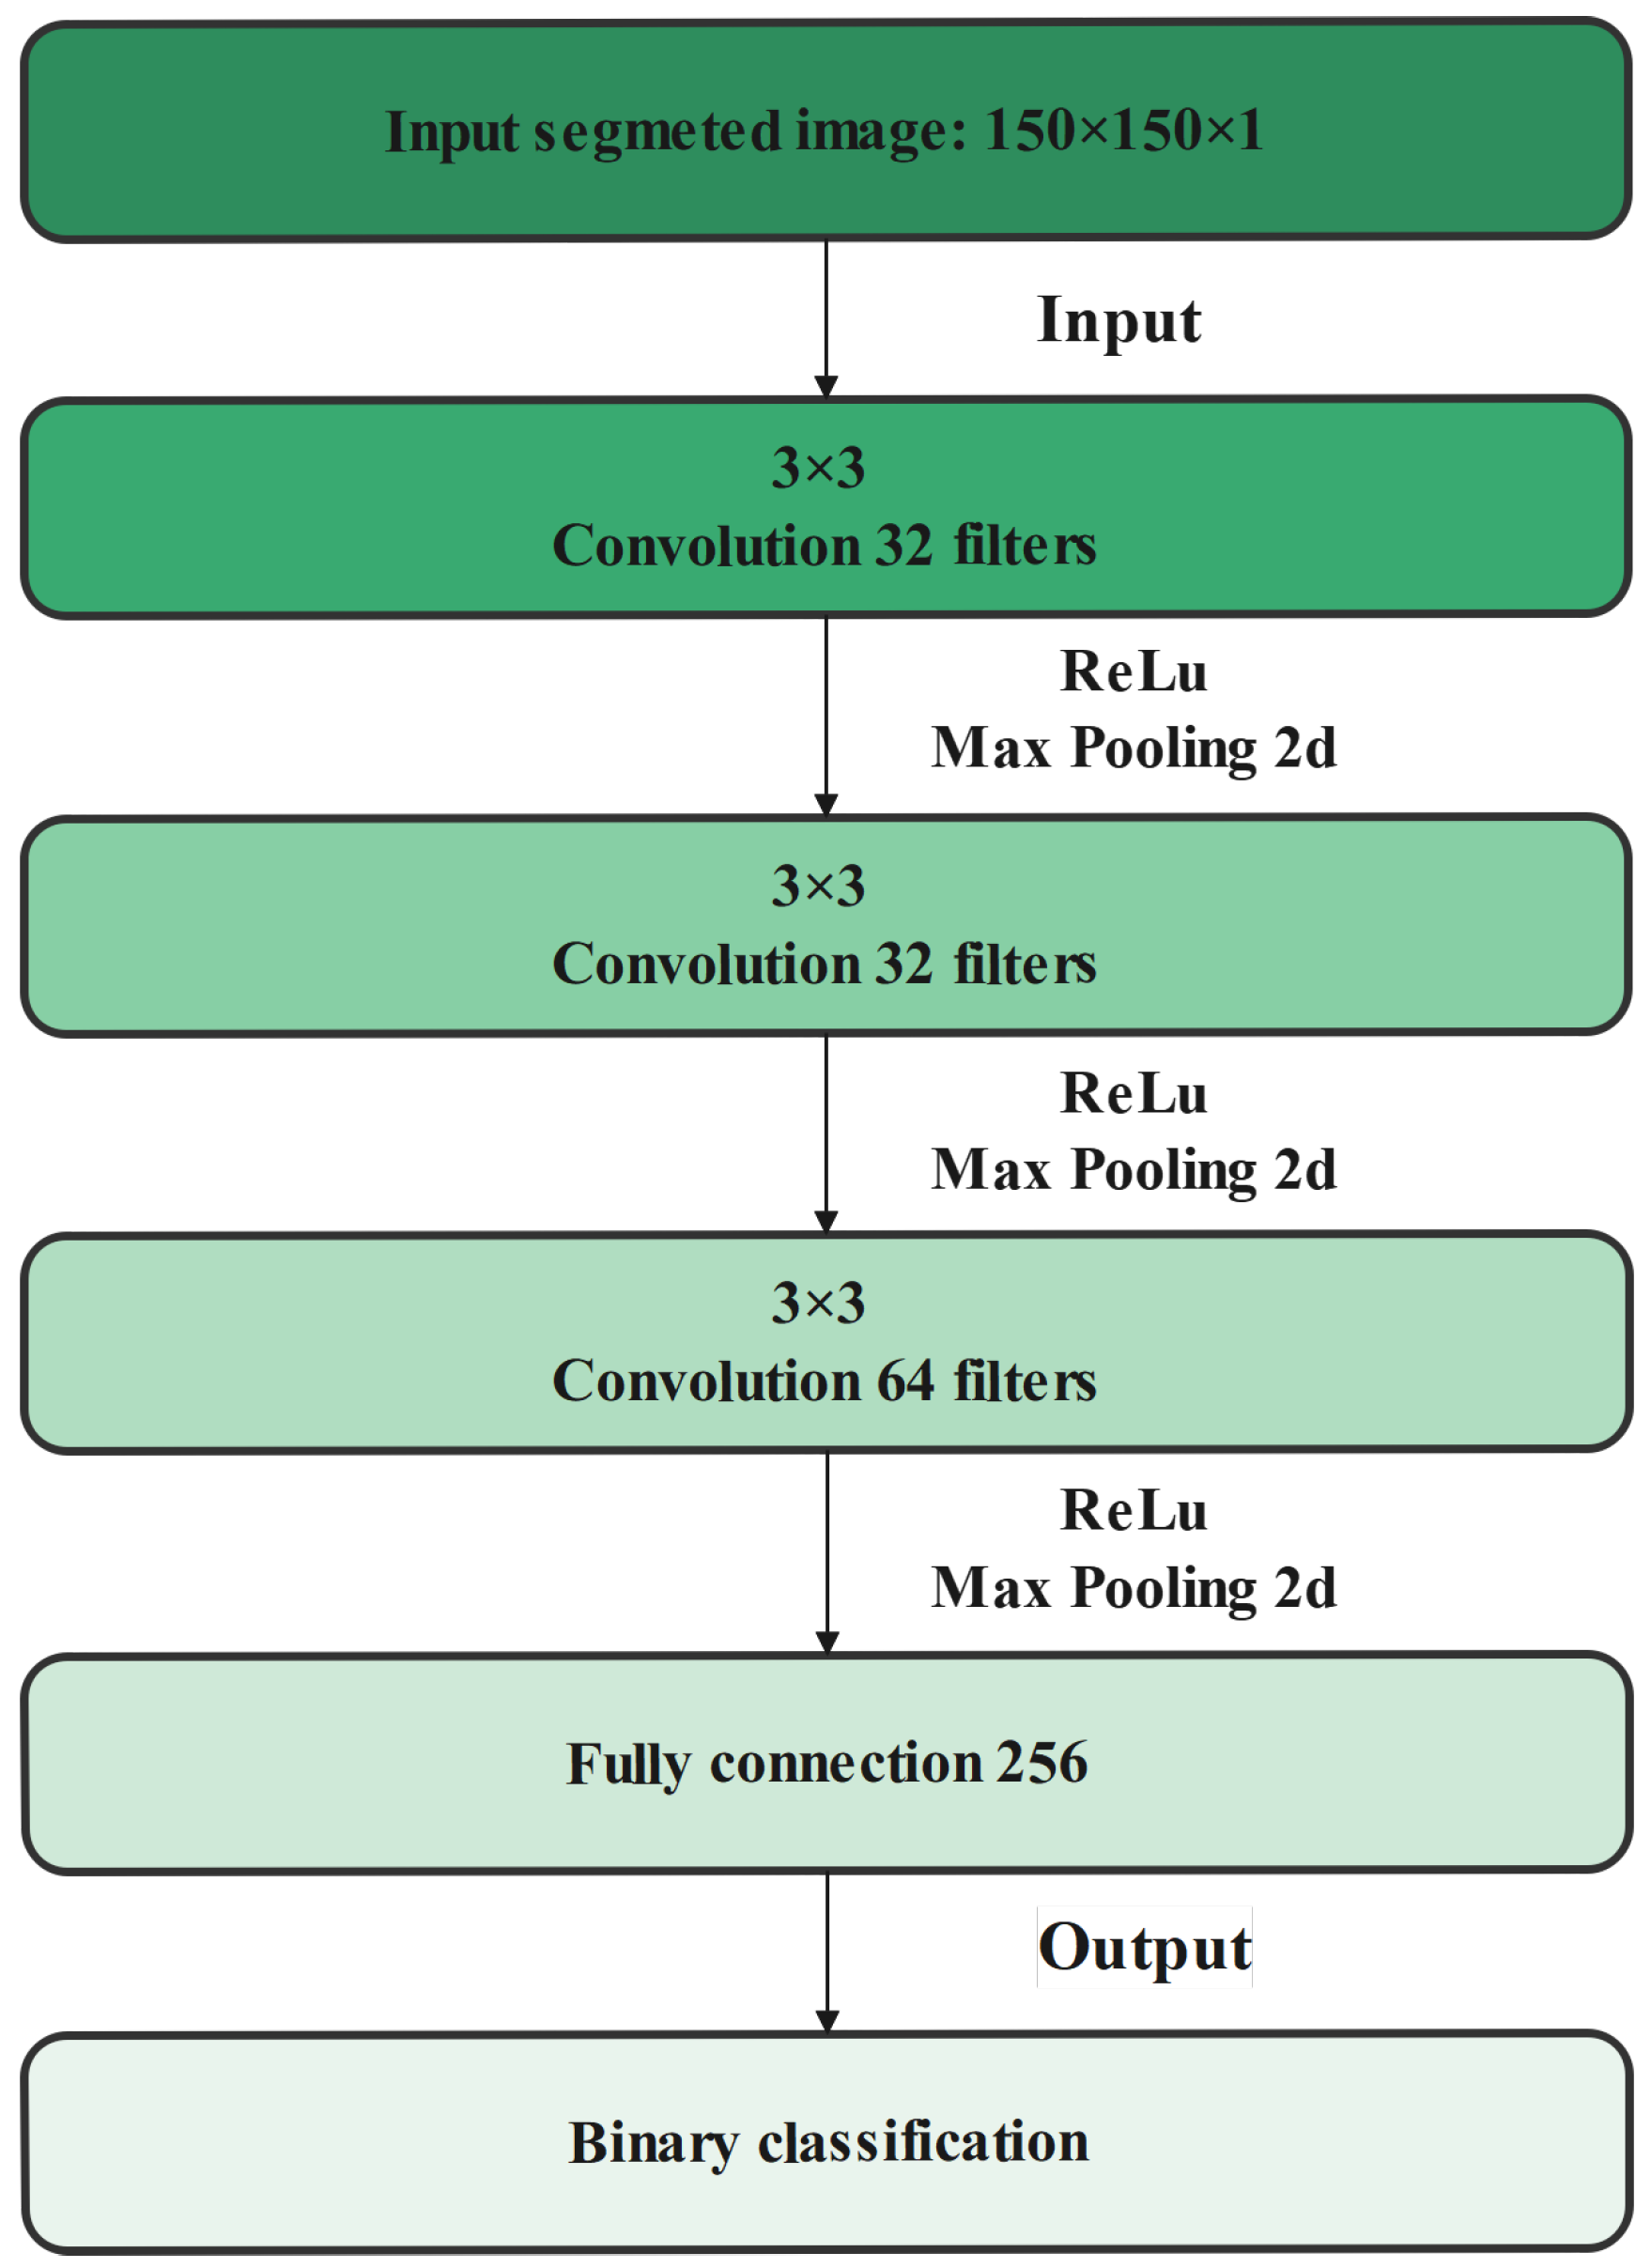
3.4. Convolutional Neural Networks
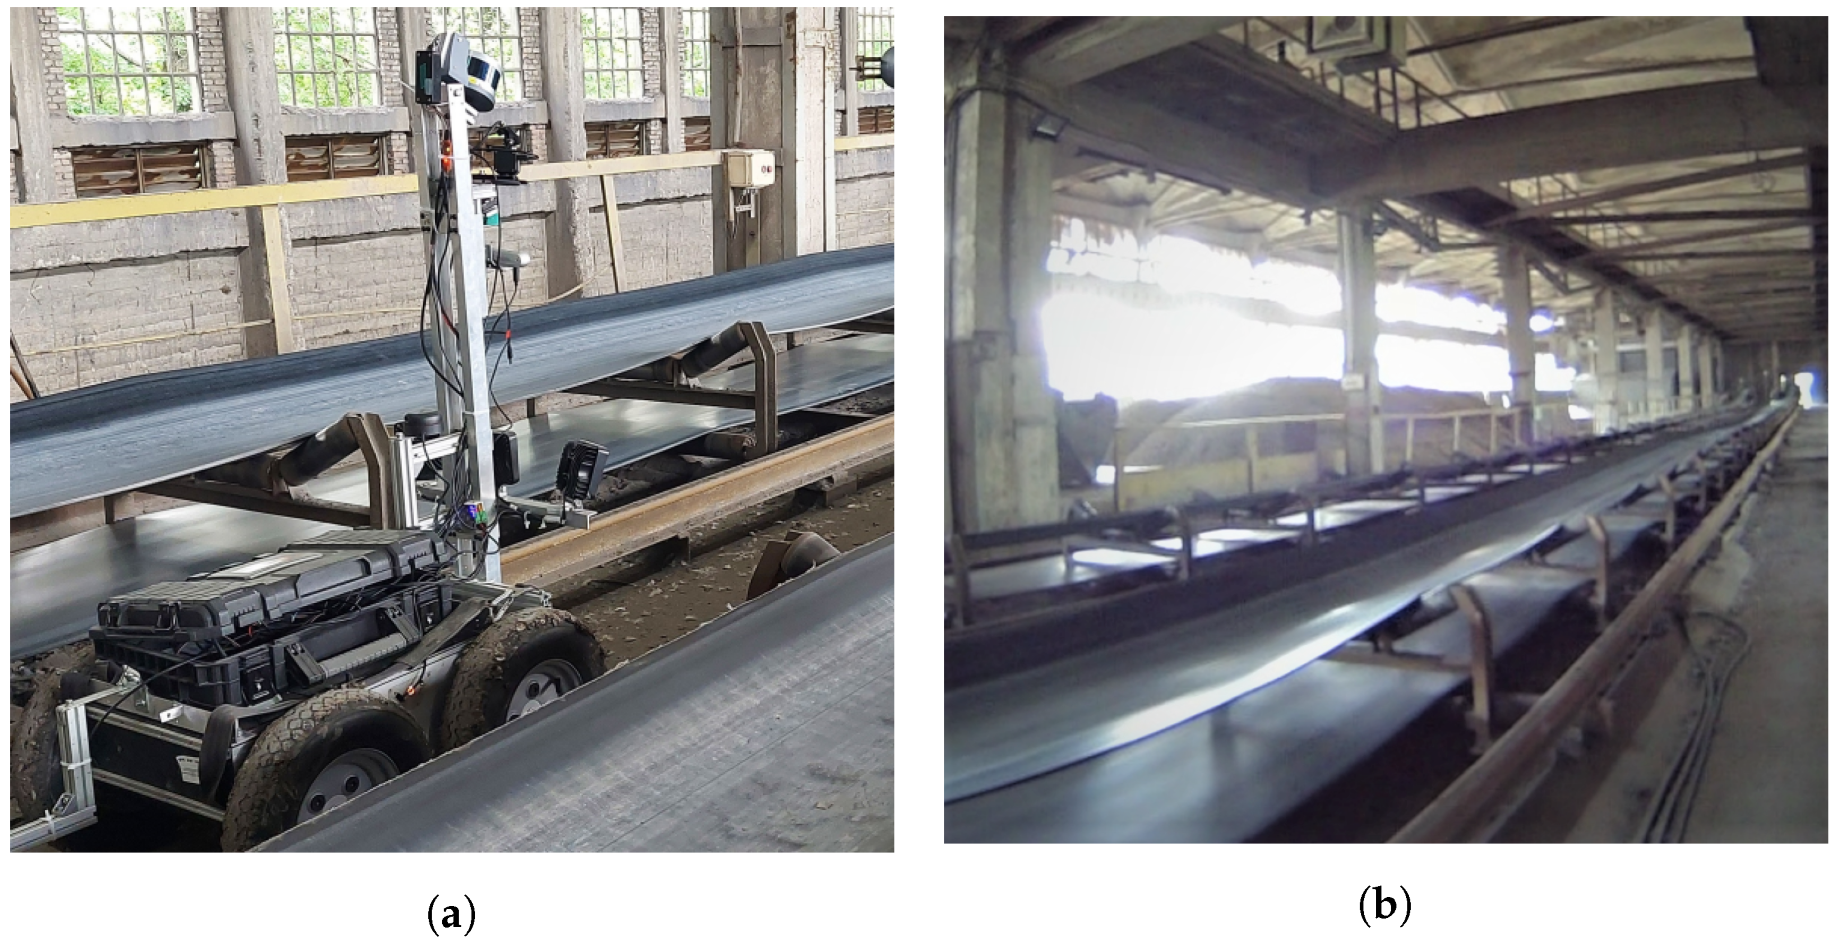
3.4.1. Data Collection and Description
3.4.2. Binary Classification
3.5. Training and Testing the CNN
4. Evaluation
5. Results
6. Conclusions
Author Contributions
Funding
Institutional Review Board Statement
Informed Consent Statement
Data Availability Statement
Acknowledgments
Conflicts of Interest
References
- Zimroz, R.; Hutter, M.; Mistry, M.; Stefaniak, P.; Walas, K.; Wodecki, J. Why Should Inspection Robots be used in Deep Underground Mines? In Proceedings of the 27th International Symposium on Mine Planning and Equipment Selection, Las Condes, Chile, 19–23 November 2018; Selection-MPES 2018. Widzyk-Capehart, E., Hekmat, A., Singhal, R., Eds.; Springer International Publishing: Cham, Switzerland, 2019; pp. 497–507. [Google Scholar] [CrossRef]
- Zimroz, R.; Hardygóra, M.; Blazej, R. Maintenance of Belt Conveyor Systems in Poland—An Overview. In Proceedings of the 12th International Symposium Continuous Surface, Aachen, Germany, 1 October 2014; Niemann-Delius, C., Ed.; Springer International Publishing: Cham, Switzerland, 2015; pp. 21–30. [Google Scholar] [CrossRef]
- Bołoz, Ł.; Biały, W. Automation and Robotization of Underground Mining in Poland. Appl. Sci. 2020, 10, 7221. [Google Scholar] [CrossRef]
- Trybała, P.; Blachowski, J.; Błażej, R.; Zimroz, R. Damage detection based on 3d point cloud data processing from laser scanning of conveyor belt surface. Remote Sens. 2021, 13, 55. [Google Scholar] [CrossRef]
- Błażej, R.; Kirjanów, A.; Kozłowski, T. A high resolution system for automatic diagnosing the condition of the core of conveyor belts with steel cords. Diagnostyka 2014, 15, 41–45. [Google Scholar]
- Zimroz, R.; Król, R. Failure analysis of belt conveyor systems for condition monitoring purposes. Min. Sci. 2009, 128, 255–270. [Google Scholar]
- Król, R.; Kisielewski, W. Research of loading carrying idlers used in belt conveyor-practical applications. Diagnostyka 2014, 15, 67–74. [Google Scholar]
- Peruń, G.; Opasiak, T. Assessment of technical state of the belt conveyor rollers with use vibroacoustics methods—Preliminary studies. Diagnostyka 2016, 17, 75–81. [Google Scholar]
- Dąbek, P.; Krot, P.; Wodecki, J.; Zimroz, P.; Szrek, J.; Zimroz, R. Measurement of idlers rotation speed in belt conveyors based on image data analysis for diagnostic purposes. Measurement 2022, 202, 111869. [Google Scholar] [CrossRef]
- Bortnowski, P.; Król, R.; Nowak-Szpak, A.; Ozdoba, M. A Preliminary Studies of the Impact of a Conveyor Belt on the Noise Emission. Sustainability 2022, 14, 2785. [Google Scholar] [CrossRef]
- Yardley, E.; Stace, L. 4-Design of belt conveyors 2-hardware (Idlers, structure, pulleys, drives, tensioning devices, transfer points and belt cleaning). In Belt Conveying of Minerals; Woodhead Publishing Series in Metals and Surface Engineering; Yardley, E., Stace, L., Eds.; Woodhead Publishing: Sawston, Cambridge, UK, 2008; pp. 44–70. [Google Scholar] [CrossRef]
- Król, R. Studies of the Durability of Belt Conveyor Idlers with Working Loads Taken into Account. IOP Conf. Ser. Earth Environ. Sci. 2017, 95, 42054. [Google Scholar] [CrossRef] [Green Version]
- Zakharov, A.; Gerike, B.; Shiryamov, D. The Ultimate Rotating Resistance of the Belt Conveyors Rollers. In Proceedings of the 9th China-Russia Symposium “Coal in the 21st Century: Mining, Intelligent Equipment and Environment Protection”, Qingdao, China, 18–21 October 2018; Atlantis Press: Qingdao, China, 2018; pp. 226–229. [Google Scholar] [CrossRef] [Green Version]
- Shiri, H.; Wodecki, J.; Ziȩtek, B.; Zimroz, R. Inspection robotic UGV platform and the procedure for an acoustic signal-based fault detection in belt conveyor idler. Energies 2021, 14, 7646. [Google Scholar] [CrossRef]
- Grzesiek, A.; Zimroz, R.; Śliwiński, P.; Gomolla, N.; Wyłomańska, A. Long term belt conveyor gearbox temperature data analysis—Statistical tests for anomaly detection. Meas. J. Int. Meas. Confed. 2020, 165, 108124. [Google Scholar] [CrossRef]
- Dabek, P.; Szrek, J.; Zimroz, R.; Wodecki, J. An Automatic Procedure for Overheated Idler Detection in Belt Conveyors Using Fusion of Infrared and RGB Images Acquired during UGV Robot Inspection. Energies 2022, 15, 601. [Google Scholar] [CrossRef]
- Szrek, J.; Jakubiak, J.; Zimroz, R. A Mobile Robot-Based System for Automatic Inspection of Belt Conveyors in Mining Industry. Energies 2022, 15, 327. [Google Scholar] [CrossRef]
- Carvalho, R.; Nascimento, R.; D’angelo, T.; Delabrida, S.; Bianchi, A.G.; Oliveira, R.A.; Azpúrua, H.; Garcia, L.G. A UAV-based framework for semi-automated thermographic inspection of belt conveyors in the mining industry. Sensors 2020, 20, 2243. [Google Scholar] [CrossRef] [Green Version]
- Yang, W.; Zhang, X.; Ma, H. An inspection robot using infrared thermography for belt conveyor. In Proceedings of the 2016 13th International Conference on Ubiquitous Robots and Ambient Intelligence, URAI 2016, Xi’an, China, 19–22 August 2016; pp. 400–404. [Google Scholar] [CrossRef]
- Szrek, J.; Wodecki, J.; Błazej, R.; Zimroz, R. An inspection robot for belt conveyor maintenance in underground mine-infrared thermography for overheated idlers detection. Appl. Sci. 2020, 10, 4984. [Google Scholar] [CrossRef]
- Błazej, R.; Sawicki, M.; Kirjanów, A.; Kozłowski, T.; Konieczna, M. Automatic analysis of thermograms as a means for estimating technical of a gear system. Diagnostyka 2016, 17, 43–48. [Google Scholar]
- Qu, Z.; Jiang, P.; Zhang, W. Development and application of infrared thermography non-destructive testing techniques. Sensors 2020, 20, 3851. [Google Scholar] [CrossRef]
- Abdel-Qader, I.; Yohali, S.; Abudayyeh, O.; Yehia, S. Segmentation of thermal images for non-destructive evaluation of bridge decks. NDT E Int. 2008, 41, 395–405. [Google Scholar] [CrossRef]
- Siami, M.; Barszcz, T.; Wodecki, J.; Zimroz, R. Design of an Infrared Image Processing Pipeline for Robotic Inspection of Conveyor Systems in Opencast Mining Sites. Energies 2022, 15, 6771. [Google Scholar] [CrossRef]
- Hurley, T.J. Infrared qualitative and quantitative inspections for electric utilities. In Thermosense XII: An International Conference on Thermal Sensing and Imaging Diagnostic Applications; Semanovich, S.A., Ed.; International Society for Optics and Photonics, SPIE: Orlando, FL, USA, 1990; Volume 1313, pp. 6–24. [Google Scholar] [CrossRef]
- Griffith, B.; Türler, D.; Goudey, H. IR Thermographic Systems: A Review of IR Imagers and Their Use; Lawrence Berkeley National Laboratory: Berkeley, CA, USA, 2001. [Google Scholar]
- Wurzbach, R.N.; Hammaker, R.G. Role of comparative and qualitative thermography in predictive maintenance. In Thermosense XIV: An International Conference on Thermal Sensing and Imaging Diagnostic Applications; SPIE: Orlando, FL, USA, 1992; Volume 1682, pp. 3–11. [Google Scholar]
- Jadin, M.S.; Taib, S.; Kabir, S.; Yusof, M.A.B. Image processing methods for evaluating infrared thermographic image of electrical equipments. In Proceedings of the Progress in Electromagnetics Research Symposium, Suzhou, China, 12–16 September 2011. [Google Scholar]
- Prasad, B.S.; Prabha, K.A.; Kumar, P.G. Condition monitoring of turning process using infrared thermography technique—An experimental approach. Infrared Phys. Technol. 2017, 81, 137–147. [Google Scholar] [CrossRef]
- Cong-ping, C.; Wu, Q.; Zi-fan, F.; Yi, Z. Infrared image transition region extraction and segmentation based on local definition cluster complexity. In Proceedings of the 2010 International Conference on Computer Application and System Modeling (ICCASM 2010), Taiyuan, China, 22–24 October 2010; Volume 3, pp. V3-50–V3-54. [Google Scholar] [CrossRef]
- Li, Y.; Mao, X. An efficient method for target extraction of infrared images. In International Conference on Artificial Intelligence and Computational Intelligence; Lecture Notes in Computer Science (including subseries Lecture Notes in Artificial Intelligence and Lecture Notes in, Bioinformatics); Wang, F.L., Deng, H., Gao, Y., Lei, J., Eds.; Springer: Berlin/Heidelberg, Germany, 2010; Volume 6319, pp. 185–192. [Google Scholar] [CrossRef]
- Fan, S.; Yang, S.; He, P.; Nie, H. Infrared Electric Image Thresholding Using Two-Dimensional Fuzzy Renyi Entropy. Energy Procedia 2011, 12, 411–419. [Google Scholar] [CrossRef] [Green Version]
- Harrap, M.J.; De Ibarra, N.H.; Whitney, H.M.; Rands, S.A. Reporting of thermography parameters in biology: A systematic review of thermal imaging literature. R. Soc. Open Sci. 2018, 5, 181281. [Google Scholar] [CrossRef] [PubMed] [Green Version]
- Nascimento, R.; Carvalho, R.; Delabrida, S.; Bianchi, A.G.; Oliveira, R.A.R.; Garcia, L.G. An integrated inspection system for belt conveyor rollers advancing in an enterprise architecture. In Proceedings of the 19th International Conference on Enterprise Information Systems, ICEIS 2017, Porto, Portugal, 26–29 April 2017; Volume 2, pp. 190–200. [Google Scholar] [CrossRef]
- Opasiak, T.; Peruń, G. Influence of construction the rollers C type on resistance of rotating driven system of the belt conveyor. Diagnostyka 2016, 17, 81–86. [Google Scholar]
- Liu, Y.; Miao, C.; Li, X.; Ji, J.; Meng, D. Research on the fault analysis method of belt conveyor idlers based on sound and thermal infrared image features. Meas. J. Int. Meas. Confed. 2021, 186, 110177. [Google Scholar] [CrossRef]
- Liu, T.; Liu, S. The impacts of coal dust on miners’ health: A review. Environ. Res. 2020, 190, 109849. [Google Scholar] [CrossRef] [PubMed]
- Bortnowski, P.; Nowak-Szpak, A.; Król, R.; Ozdoba, M. Analysis and Distribution of Conveyor Belt Noise Sources under Laboratory Conditions. Sustainability 2021, 13, 2233. [Google Scholar] [CrossRef]
- Morales, A.S.; Aqueveque, P.; Henriquez, J.A.; Saavedra, F.; Wiechmann, E.P. A technology review of idler condition based monitoring systems for critical overland conveyors in open-pit mining applications. In Proceedings of the 2017 IEEE Industry Applications Society Annual Meeting, Cincinnati, OH, USA, 1–5 October 2017; pp. 1–8. [Google Scholar] [CrossRef]
- Konieczna, M.; Gładysiewicz, L. Theoretical basis for determining rolling resistance of belt conveyors. Min. Sci. 2016, 23, 105–119. [Google Scholar] [CrossRef]
- Bortnowski, P.; Kawalec, W.; Król, R.; Ozdoba, M. Types and causes of damage to the conveyor belt—Review, classification and mutual relations. Eng. Fail. Anal. 2022, 140, 106520. [Google Scholar] [CrossRef]
- Zhu, L.; Spachos, P.; Pensini, E.; Plataniotis, K.N. Deep learning and machine vision for food processing: A survey. Curr. Res. Food Sci. 2021, 4, 233–249. [Google Scholar] [CrossRef]
- Meola, C. Infrared Thermography: Recent Advances and Future Trends; Bentham Science Publishers: Sharjah, United Arab Emirates, 2012. [Google Scholar] [CrossRef]
- Szrek, J.; Zimroz, R.; Wodecki, J.; Michalak, A.; Góralczyk, M.; Worsa-Kozak, M. Application of the infrared thermography and unmanned ground vehicle for rescue action support in underground mine—The amicos project. Remote Sens. 2021, 13, 69. [Google Scholar] [CrossRef]
- Zimroz, P.; Trybała, P.; Wróblewski, A.; Góralczyk, M.; Szrek, J.; Wójcik, A.; Zimroz, R. Application of UAV in search and rescue actions in underground mine—A specific sound detection in noisy acoustic signal. Energies 2021, 14, 3725. [Google Scholar] [CrossRef]
- Uth, F.; Polnik, B.; Kurpiel, W.; Kriegsch, P.; Baltes, R.; Clausen, E. An innovative person detection system based on thermal imaging cameras dedicate for underground belt conveyors. Min. Sci. 2019, 26, 263–276. [Google Scholar] [CrossRef]
- Stypułkowski, K.; Gołda, P.; Lewczuk, K.; Tomaszewska, J. Monitoring System for Railway Infrastructure Elements Based on Thermal Imaging Analysis. Sensors 2021, 21, 3819. [Google Scholar] [CrossRef]
- Shao, H.; Xia, M.; Han, G.; Zhang, Y.; Wan, J. Intelligent Fault Diagnosis of Rotor-Bearing System Under Varying Working Conditions With Modified Transfer Convolutional Neural Network and Thermal Images. IEEE Trans. Ind. Inform. 2021, 17, 3488–3496. [Google Scholar] [CrossRef]
- Szurgacz, D.; Zhironkin, S.; Vöth, S.; Pokorný, J.; Sam Spearing, A.J.; Cehlár, M.; Stempniak, M.; Sobik, L. Thermal imaging study to determine the operational condition of a conveyor belt drive system structure. Energies 2021, 14, 3258. [Google Scholar] [CrossRef]
- Pizer, S.M.; Amburn, E.P.; Austin, J.D.; Cromartie, R.; Geselowitz, A.; Greer, T.; ter Haar Romeny, B.; Zimmerman, J.B.; Zuiderveld, K. Adaptive Histogram Equalization and Its Variations. Comput. Vis. Graph. Image Process. 1987, 39, 355–368. [Google Scholar] [CrossRef]
- Hummel, R. Image Enhancement By Histogram Transformation. Comput. Graph. Image Process. 1977, 6, 184–185. [Google Scholar] [CrossRef]
- Choi, W.H.; Choi, H.R.; Seo, E.; Hwang, J.; Oh, H.; Kim, M.R.; Han, S.R.; Kim, M.S.; Kang, S.H.; Lee, Y. Feasibility of fast non-local means noise reduction algorithm in magnetic resonance imaging using 1.5 and 3.0 T with diffusion-weighted image technique. Optik 2019, 183, 241–246. [Google Scholar] [CrossRef]
- Buades, A.; Coll, B.; Morel, J.M. A non-local algorithm for image denoising. In Proceedings of the 2005 IEEE Computer Society Conference on Computer Vision and Pattern Recognition (CVPR’05), San Diego, CA, USA, 20–26 June 2005; Volume 2, pp. 60–65. [Google Scholar] [CrossRef]
- Naegel, B.; Cernicanu, A.; Hyacinthe, J.N.; Tognolini, M.; Vallée, J.P. SNR enhancement of highly-accelerated real-time cardiac MRI acquisitions based on non-local means algorithm. Med. Image Anal. 2009, 13, 598–608. [Google Scholar] [CrossRef]
- Lee, S.; Jin Park, S.; Jeon, J.M.; Lee, M.H.; Ryu, D.Y.; Lee, E.; Kang, S.H.; Lee, Y. Noise removal in medical mammography images using fast non-local means denoising algorithm for early breast cancer detection: A phantom study. Optik 2019, 180, 569–575. [Google Scholar] [CrossRef]
- Coupé, P.; Yger, P.; Barillot, C. Fast Non Local Means Denoising for 3D MR Images. In Medical Image Computing and Computer-Assisted Intervention—MICCAI 2006; Larsen, R., Nielsen, M., Sporring, J., Eds.; Springer: Berlin/Heidelberg, Germany, 2006; pp. 33–40. [Google Scholar]
- Dauwe, A.; Goossens, B.; Luong, H.Q.; Philips, W. A fast non-local image denoising algorithm. In Image Processing: Algorithms and Systems VI; SPIE: Orlando, FL, USA, 2008; Volume 6812, pp. 324–331. [Google Scholar] [CrossRef]
- Shim, J.; Yoon, M.; Lee, Y. Feasibility of newly designed fast non local means (FNLM)-based noise reduction filter for X-ray imaging: A simulation study. Optik 2018, 160, 124–130. [Google Scholar] [CrossRef]
- Huang, K.; Zhang, D.; Wang, K. Non-local means denoising algorithm accelerated by GPU. In MIPPR 2009: Medical Imaging, Parallel Processing of Images, and Optimization Techniques; SPIE: Orlando, FL, USA, 2009; Volume 7497, pp. 263–270. [Google Scholar] [CrossRef]
- Kim, B.G.; Kang, S.H.; Park, C.R.; Jeong, H.W.; Lee, Y. Noise Level and Similarity Analysis for Computed Tomographic Thoracic Image with Fast Non-Local Means Denoising Algorithm. Appl. Sci. 2020, 10, 7455. [Google Scholar] [CrossRef]
- Younus, A.M.; Widodo, A.; Yang, B.S. Image histogram features based thermal image retrieval to pattern recognition of machine condition. In Engineering Asset Lifecycle Management, Proceedings of the 4th World Congress on Engineering Asset Management, WCEAM 2009, Athens, Greece, 28–30 September 2009; Springer: Athens, Greece, 2009; pp. 943–949. [Google Scholar] [CrossRef]
- Le, T.M.; Vo, T.M.; Pham, T.N.; Dao, S.V.T. A Novel Wrapper-Based Feature Selection for Early Diabetes Prediction Enhanced with a Metaheuristic. IEEE Access 2021, 9, 7869–7884. [Google Scholar] [CrossRef]
- Bergamasco, M.; Della Rossa, F.; Piroddi, L. Active noise control of impulsive noise with selective outlier elimination. In Proceedings of the American Control Conference, Washington, DC, USA, 17–19 June 2013; pp. 4165–4170. [Google Scholar] [CrossRef]
- Sasmal, S.; Chowdhury, S.; Kundu, S.; Politis, D.Z.; Potirakis, S.M.; Balasis, G.; Hayakawa, M.; Chakrabarti, S.K. Pre-seismic irregularities during the 2020 samos (Greece) earthquake (m = 6.9) as investigated from multi-parameter approach by ground and space-based techniques. Atmosphere 2021, 12, 1059. [Google Scholar] [CrossRef]
- Pincus, R.; Barnett, V.; Lewis, T. Outliers in Statistical Data. 3rd edition. J. Wiley & Sons 1994, XVII. 582 pp., £49.95. Biom. J. 1995, 37, 256. [Google Scholar] [CrossRef]
- Li, Z.; Liu, F.; Yang, W.; Peng, S.; Zhou, J. A Survey of Convolutional Neural Networks: Analysis, Applications, and Prospects. IEEE Trans. Neural Netw. Learn. Syst. 2021, 33, 6999–7019. [Google Scholar] [CrossRef]
- Nishani, E.; Çiço, B. Computer vision approaches based on deep learning and neural networks: Deep neural networks for video analysis of human pose estimation. In Proceedings of the 2017 6th Mediterranean Conference on Embedded Computing (MECO), Bar, Montenegro, 11–15 June 2017; pp. 1–4. [Google Scholar] [CrossRef]
- Voulodimos, A.; Doulamis, N.; Bebis, G.; Stathaki, T. Recent developments in deep learning for engineering applications. Comput. Intell. Neurosci. 2018, 2018, 8141259. [Google Scholar] [CrossRef]


| Methods | Descriptions | Weaknesses |
|---|---|---|
| Dabek et al. [16] | Identifies hotspots in captured IR videos based on Canny edge and blob detection methods. | Lacks a method to classify segmented hotspots. It does not propose a solution for frames with complex backgrounds. |
| Siami et al. [24] | Proposed an image processing pipelines for identification of hotspots based on outlier detection method. | It does not present a solution for classification of segmented hotspots based on their IR sources. |
| Szurgacz et al. [49] | Proposed a CM method based on simple thresholding technique. | Tested on limited number of IR images. IR images were captured manually by inspectors. |
| Liu et al. [36] | Proposed a method for identification hotspots in IR images based on Hough line transform and template matching algorithm. | Tested on limited number of IR images on a controlled environment. The data were captured by stationary camera systems. |
| Locomotion type | Wheeled, skid steering |
| Navigation systems | Autonomous (internal computer) |
| Manual (pilot using remote computer connection) | |
| Internal operating software | Robot Operating System (ROS) |
| Power system | Internal battery, 24 V |
| Max gross weight | 140 kg |
| Maximum payload capacity | 75 kg |
| Parameter | Value |
|---|---|
| Resolution | 640 × 480 pixles |
| Frames per second | 25 fps |
| Observation angle | 45 |
| Mounting height | 100 cm above shelf |
| Measures | Siami et al. | Siami et al. + FNLM + Binary Classification | Improvement |
|---|---|---|---|
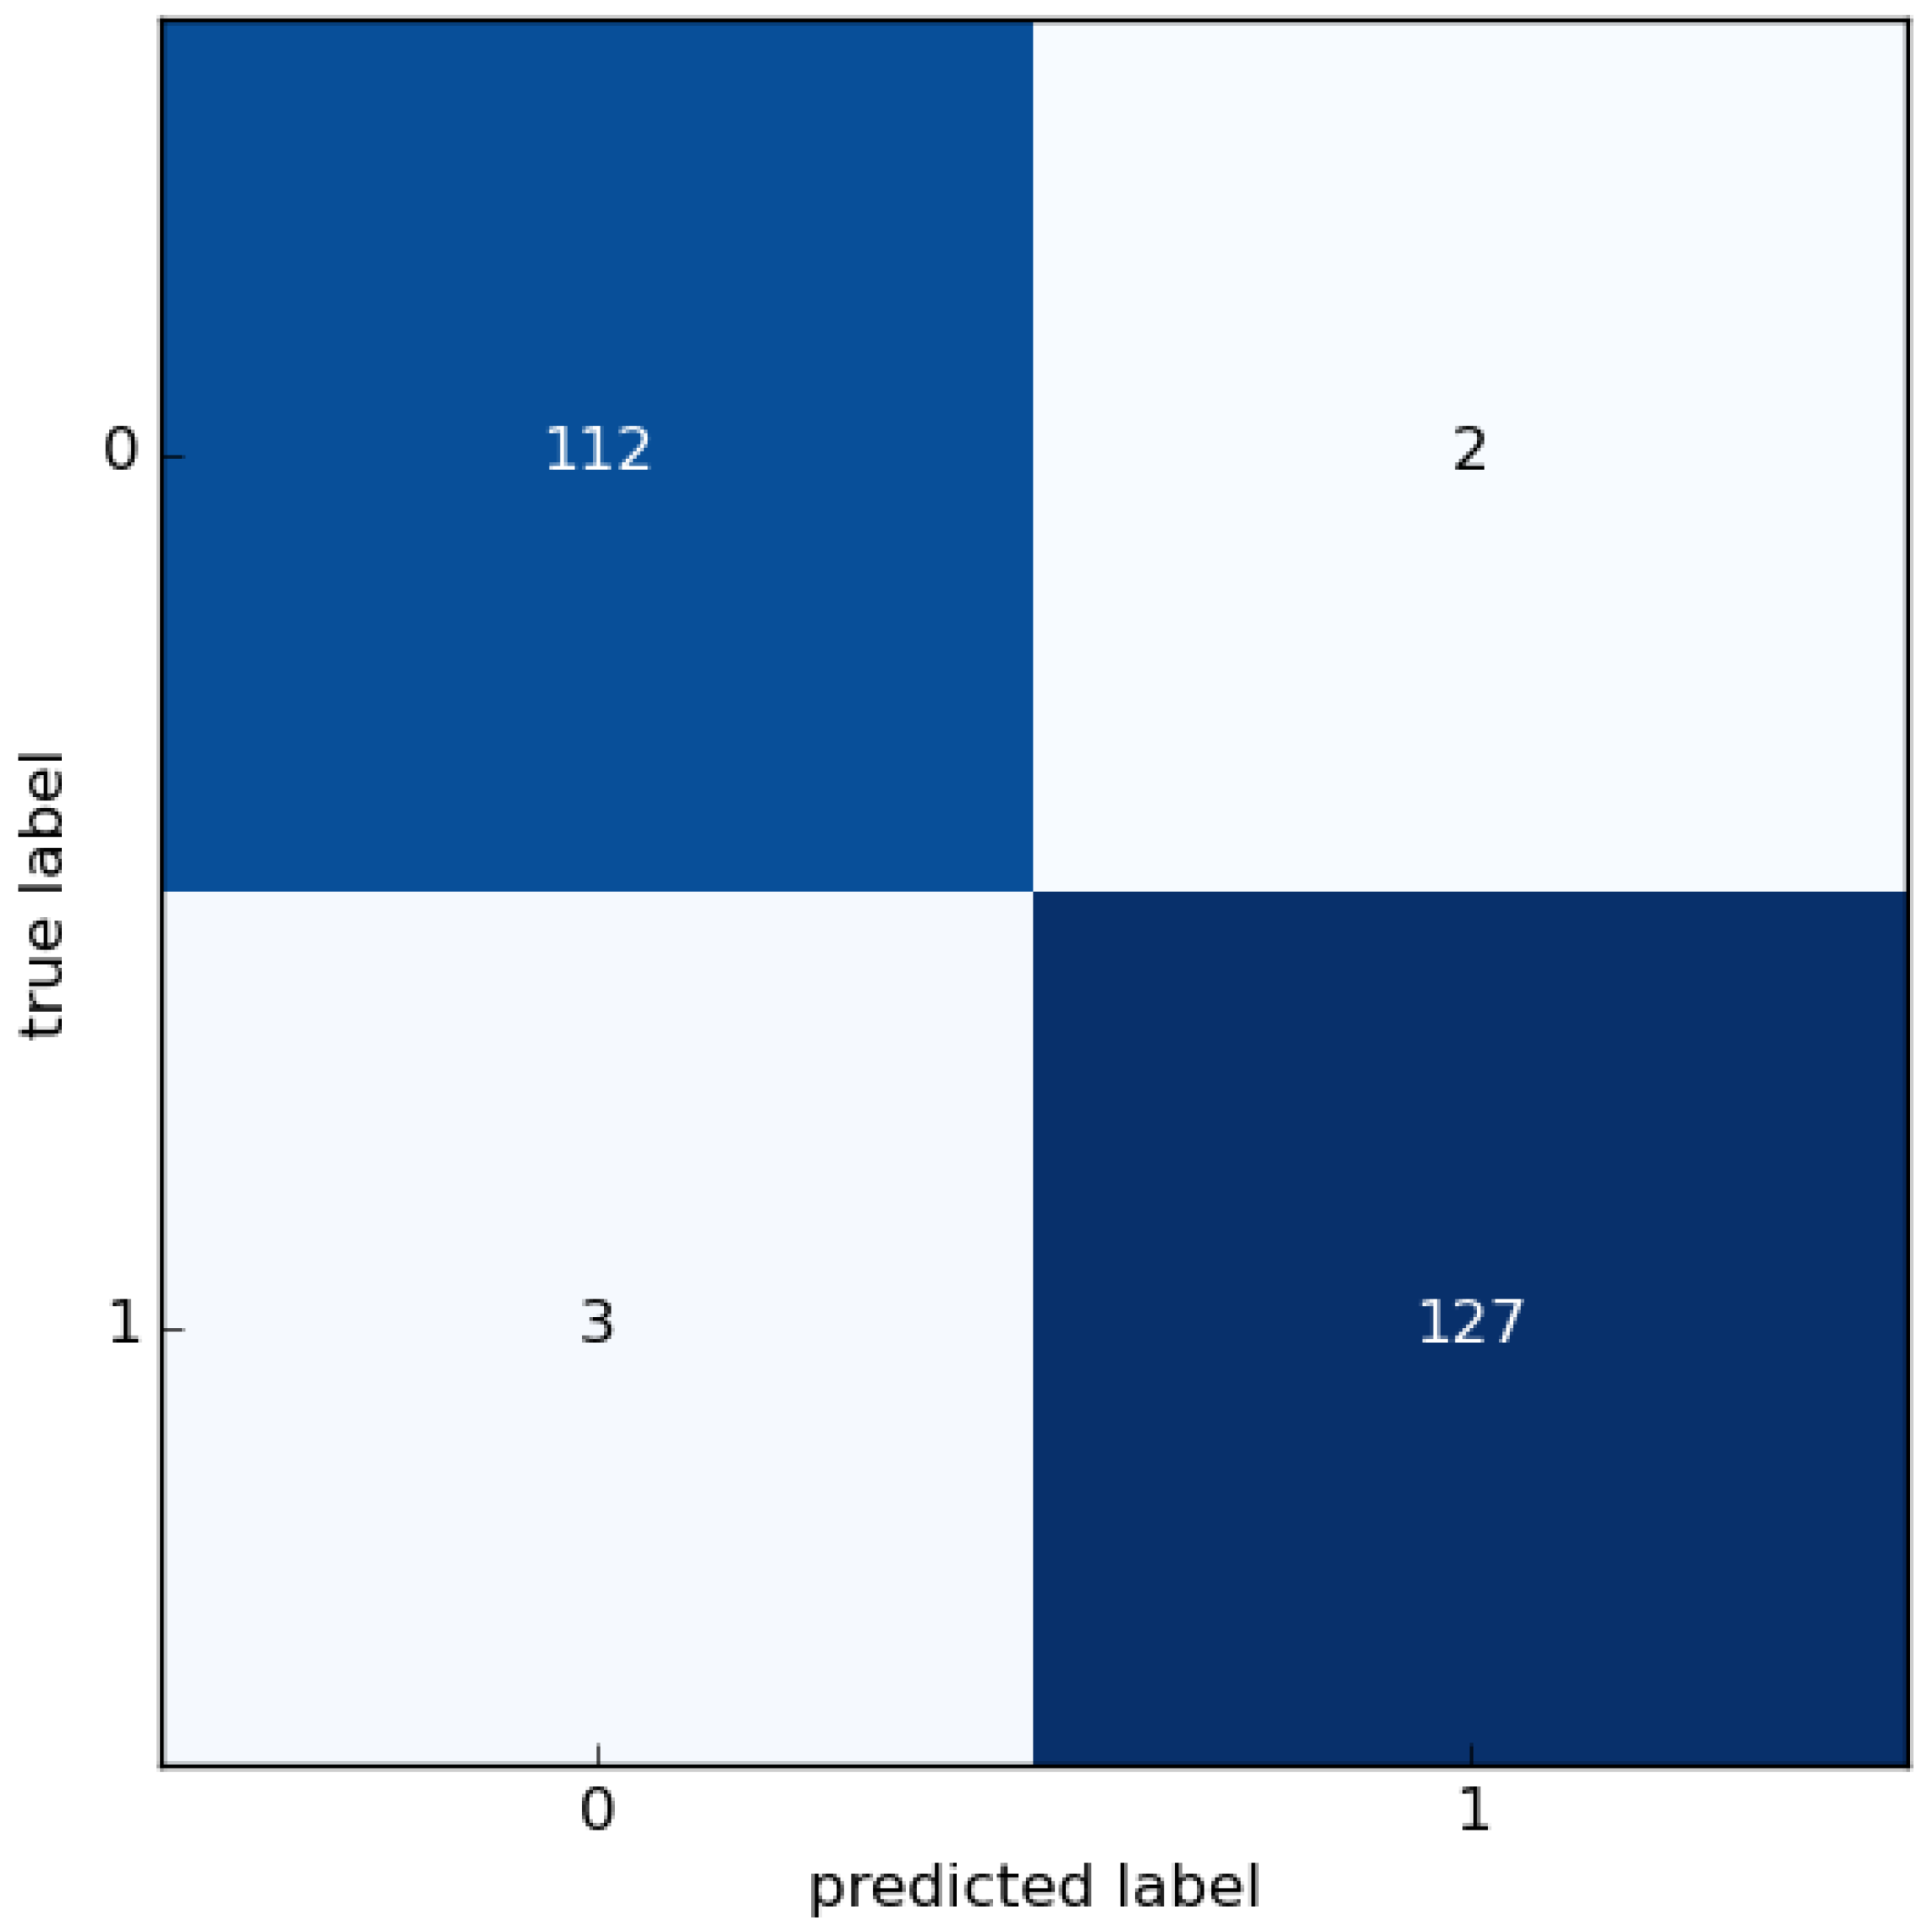
| True Positive | 112 | 112 | |
| False Positive | 132 | 3 | |
| False Negative | 0 | 2 | |
| Sensitivity | 1 | ||
| Precision | |||
| Accuracy | |||
| F1 Score |
Publisher’s Note: MDPI stays neutral with regard to jurisdictional claims in published maps and institutional affiliations. |
© 2022 by the authors. Licensee MDPI, Basel, Switzerland. This article is an open access article distributed under the terms and conditions of the Creative Commons Attribution (CC BY) license (https://creativecommons.org/licenses/by/4.0/).
Share and Cite
Siami, M.; Barszcz, T.; Wodecki, J.; Zimroz, R. Automated Identification of Overheated Belt Conveyor Idlers in Thermal Images with Complex Backgrounds Using Binary Classification with CNN. Sensors 2022, 22, 10004. https://doi.org/10.3390/s222410004
Siami M, Barszcz T, Wodecki J, Zimroz R. Automated Identification of Overheated Belt Conveyor Idlers in Thermal Images with Complex Backgrounds Using Binary Classification with CNN. Sensors. 2022; 22(24):10004. https://doi.org/10.3390/s222410004
Chicago/Turabian StyleSiami, Mohammad, Tomasz Barszcz, Jacek Wodecki, and Radoslaw Zimroz. 2022. "Automated Identification of Overheated Belt Conveyor Idlers in Thermal Images with Complex Backgrounds Using Binary Classification with CNN" Sensors 22, no. 24: 10004. https://doi.org/10.3390/s222410004