

COVIDX-LwNet: A Lightweight Network Ensemble Model for the Detection of COVID-19 Based on Chest X-ray Images

Abstract
:1. Introduction
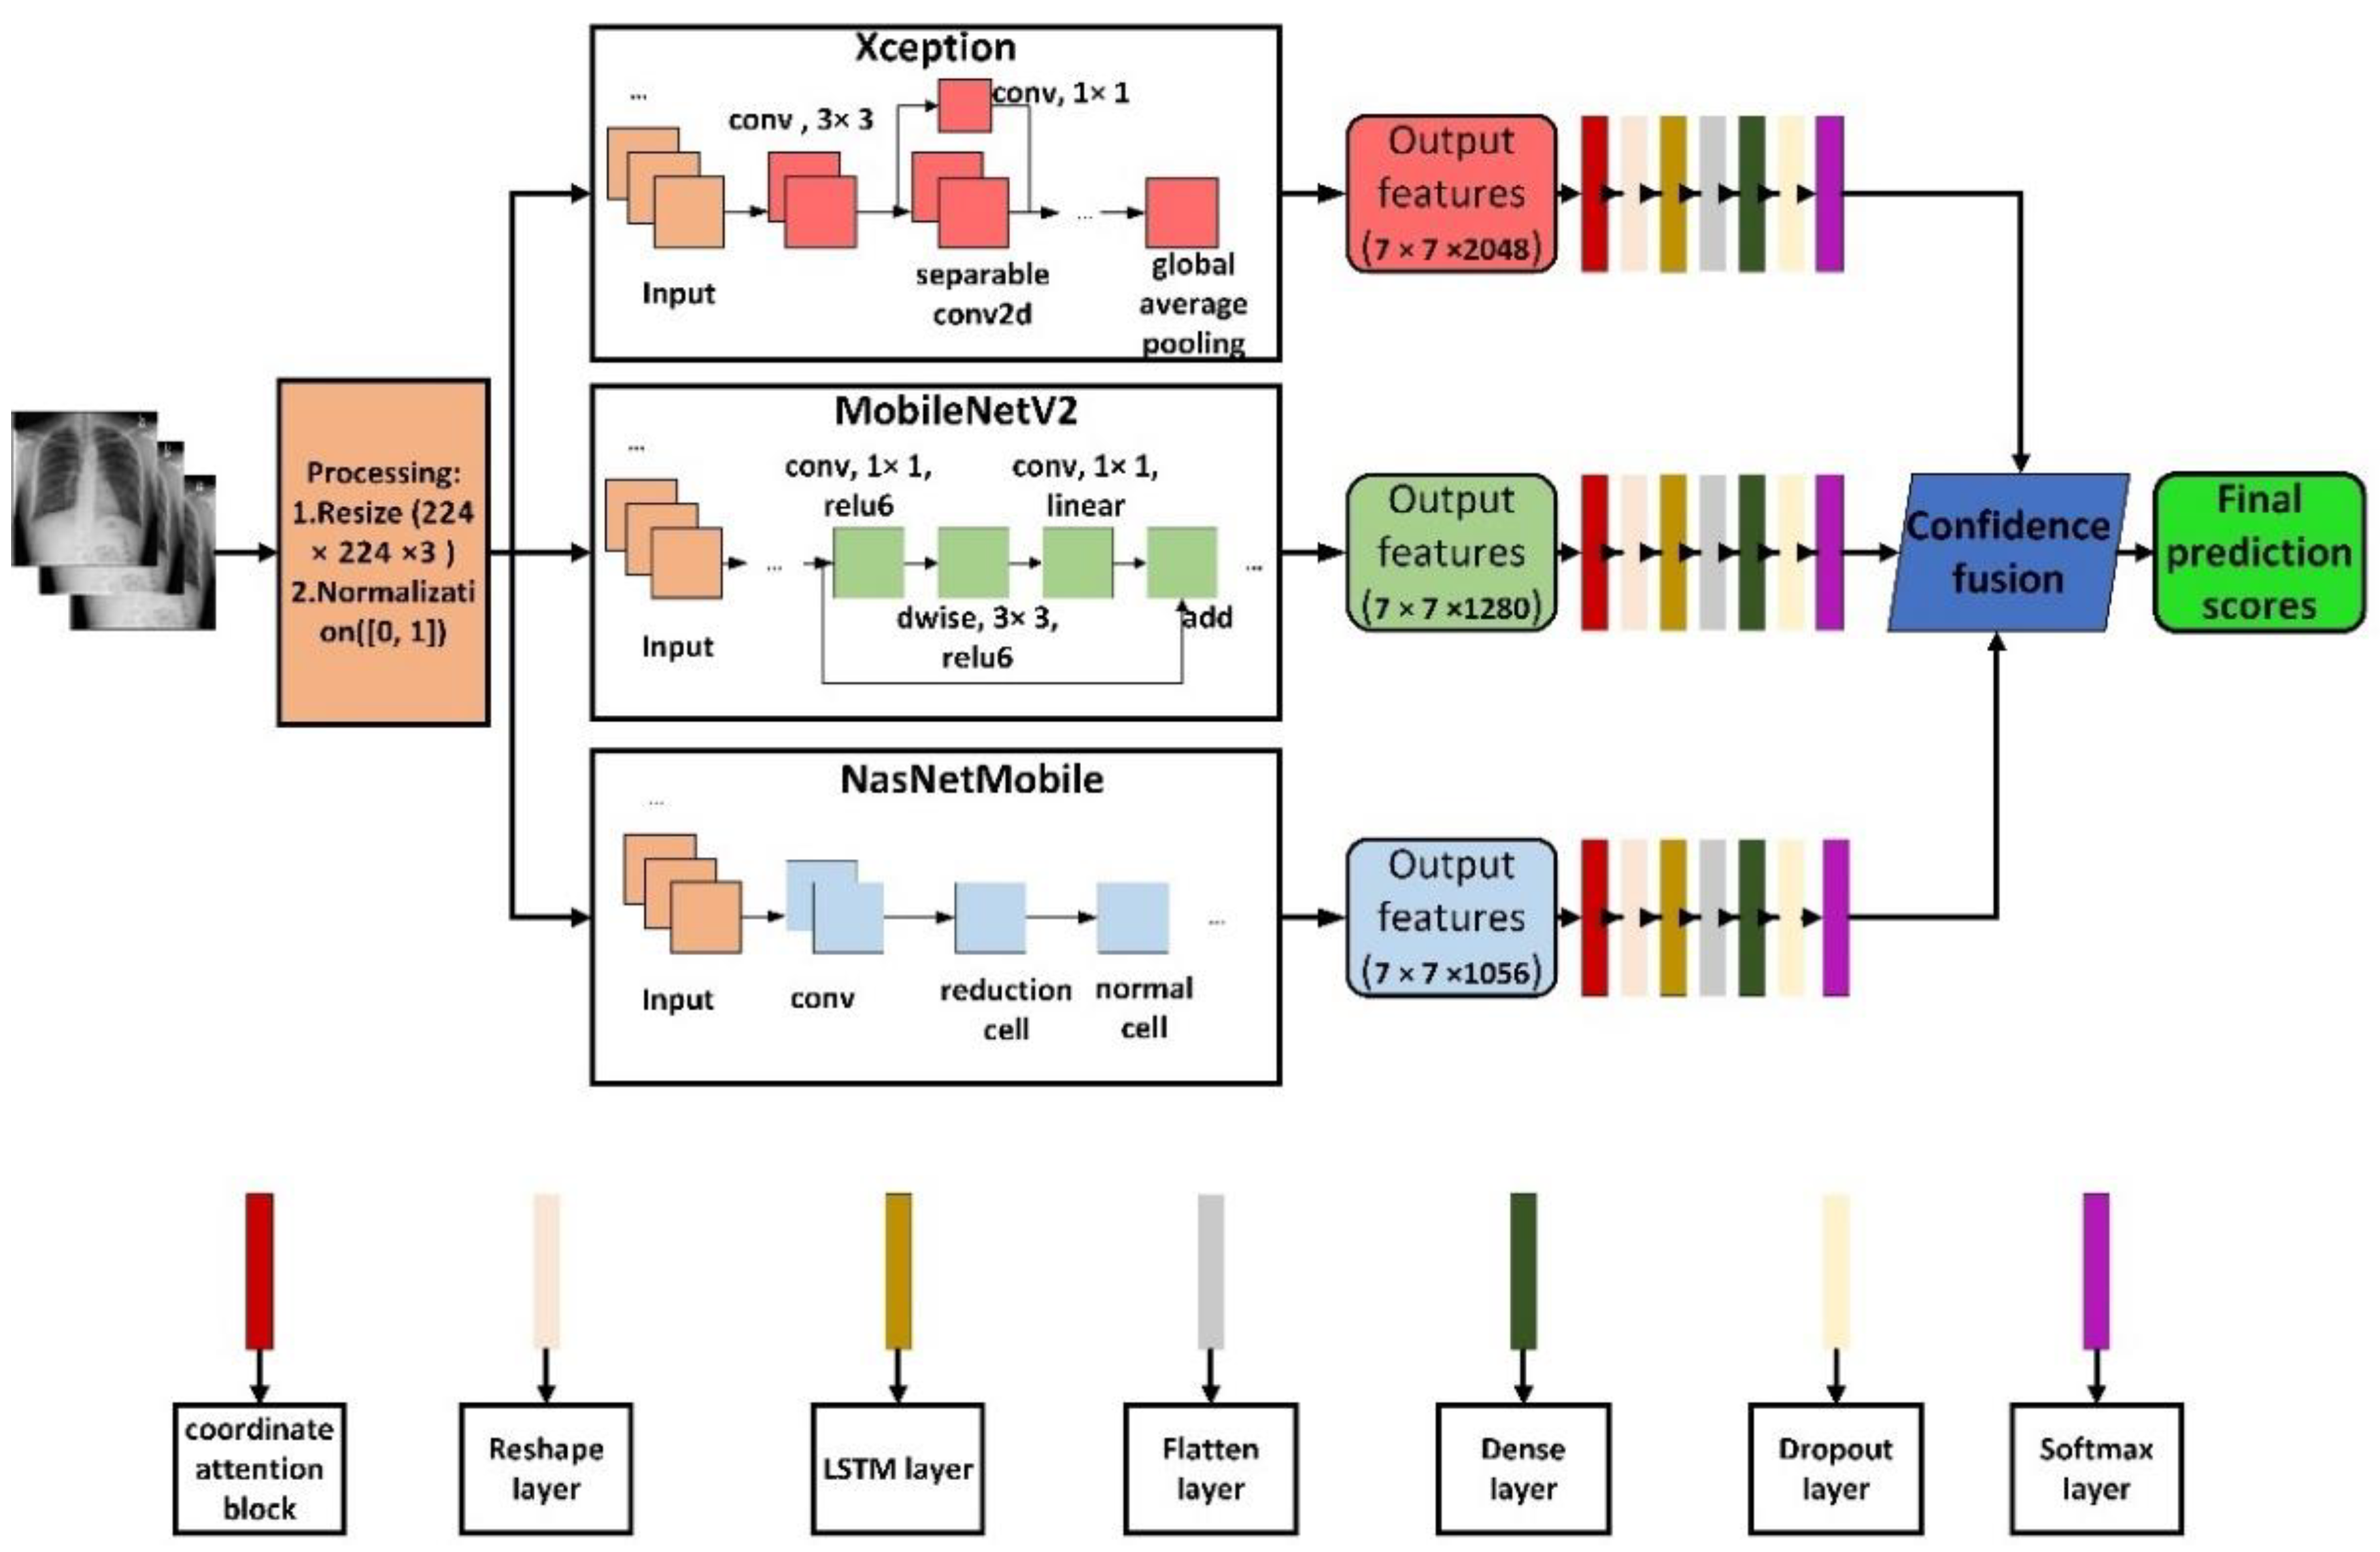
- A novel ensemble model is proposed to combine the results of three deep learning-based classifiers by applying an ensemble method based on confidence fusion, a finely trained model based on Xception, MobileNetV2 and NasNetMobile.
- For the specific implementation of confidence fusion, a detailed description is given, the use of this ensemble approach helps reduce the chance of misclassification that can occur when relying on a single classifier.
- In addition to using a pretrained model as a feature extractor, each classifier also has a coordinated attention module and an LSTM layer.
- Feature map visualization was conducted on a single classifier to observe its feature learning process.
2. Basic and Background
- (1)
- Transfer learning or fine-tuning of pretrained convolutional neural network models: For example, Soarov Chakraborty et al. [14] classified COVID-19, pneumonia, and healthy cases from chest X-ray images by applying a transfer learning method on a pretrained VGG-19 architecture. Ejaz Khan et al. [15] proposed EfficientNetB1 with a regularized classification head to detect chest X-ray classification of COVID-19. In this study, not only a deep learning model but also the hyperparameters were fine-tuned, thus significantly improving the performance of the fine-tuned deep learning model, in addition, the classification heads were regularized to improve performance.
- (2)
- After the convolutional neural network model extracts features, machine learning, such as support vector machine or clustering, can be used as a classifier: such as Sourabh Singh Verma et al. [16]. In this paper, the support vector was combined in the last layer of the VGG16 convolutional network. For synchronization between VGG16 and SVM we added a layer of convolution, pooling and condensing between VGG16 and SVM, in addition, radial basis functions were used to transform and find the best results. Anupam Das [17] developed an ensemble learning based on CNN deep features (ELCNN-DF), in which the deep features are extracted from the pooling layer of the CNN, the fully connected layer of CNN is called “Support Vector Machine” for three classification device replacement. SVM, Autoencoders, Naive Bayes (NB), the final detection of COVID-19 is performed by these classifiers, where a high-ranking strategy is used.
- (3)
- Integrated multiple convolutional neural network models: For example, Anubhav Sharma et al. [18] proposed a method that identified patients infected with SARS-CoV-2 from chest X-ray images of healthy and/or pneumonia patients: COVDC-Net, which uses two modified pretrained models (on ImageNet), MobileNetV2 and VGG16, respectively, and removes the classifier layer and fuses the two models using a confidence fusion method. Jingyao Liu et al. [19] proposed an effective method based on deep learning, deep feature fusion classification network (DFFCNet), to improve the overall diagnostic accuracy of diseases. The method is divided into two modules, deep feature fusion module (DFFM) and multiple disease classification module (MDCM). DFFM combines the advantages of different networks (EfficientNetV2 and ResNet101) for feature fusion, and MDCM uses support vector machine (SVM) as a classifier to improve the classification performance.
- (4)
- Development of a new convolutional neural network model: Saddam Hussain Khan et al. [20] developed a new CNN architecture STM-RENet to explain the radiographic patterns of X-ray images, and the authors proposed a new convolutional Block STM, which can implement region- and edge-based operations separately or jointly. The use of a system that combines region and edge realization with convolution operations facilitates exploration of region homogeneity, intensity inhomogeneity, and boundary-defining features. Additionally, exploiting the idea of channel boosting by using transfer learning to generate auxiliary channels from two additional CNNs, which are then connected to the original channels of the proposed STM-RENet, developed CB-STM-RENet, which utilizes channel boosting and learning texture changes to effectively screen X-ray images for COVID -19 infection further enhances the learning ability of STM-RENet. Md. Kawsher Mahbub et al. [21] developed a lightweight deep neural network (DNN) for unhealthy CXR screening with reduced epoch and parameters.
3. Materials and Methods
3.1. Dataset
3.2. Proposed Methodolgy
3.2.1. Pretrained CNN Model
- Xception: Xception [24] is another improvement of Inception-v3 proposed by Google after Inception. On the basis of Inception v3, the Inception module is replaced with a depth-wise separable convolution, and then combined with the skip connection of ResNet, Proposed Xception.
- MobileNetV2: MobileNetV2 [25] extends feature extraction and introduces an inverted residual structure. The model architecture consists of a convolutional layer and a series of residual bottleneck layers. The kernel size for all spatial convolution operations adopts ReLU6 as nonlinearity, as well as batch normalization and dropout in the training phase. Each bottleneck block consists of 3 layers, starting with a (1 × 1) convolutional layer, followed by the aforementioned (3 × 3) depth-wise convolutional layer, and finally another (1 × 1) volume without ReLU6 activations laminate. MobileNetV2 is currently widely used due to its excellent feature extraction capability and small size.
- NasNetMobile: NasNet [26] is a scalable CNN architecture (built through neural architecture search) consisting of basic building blocks (units) optimized using reinforcement learning. A unit consists of only a few operations (several separable convolutions and pooling) and is repeated as many times as the network requires. The mobile version (NasNetMobile) consists of 12 cells.
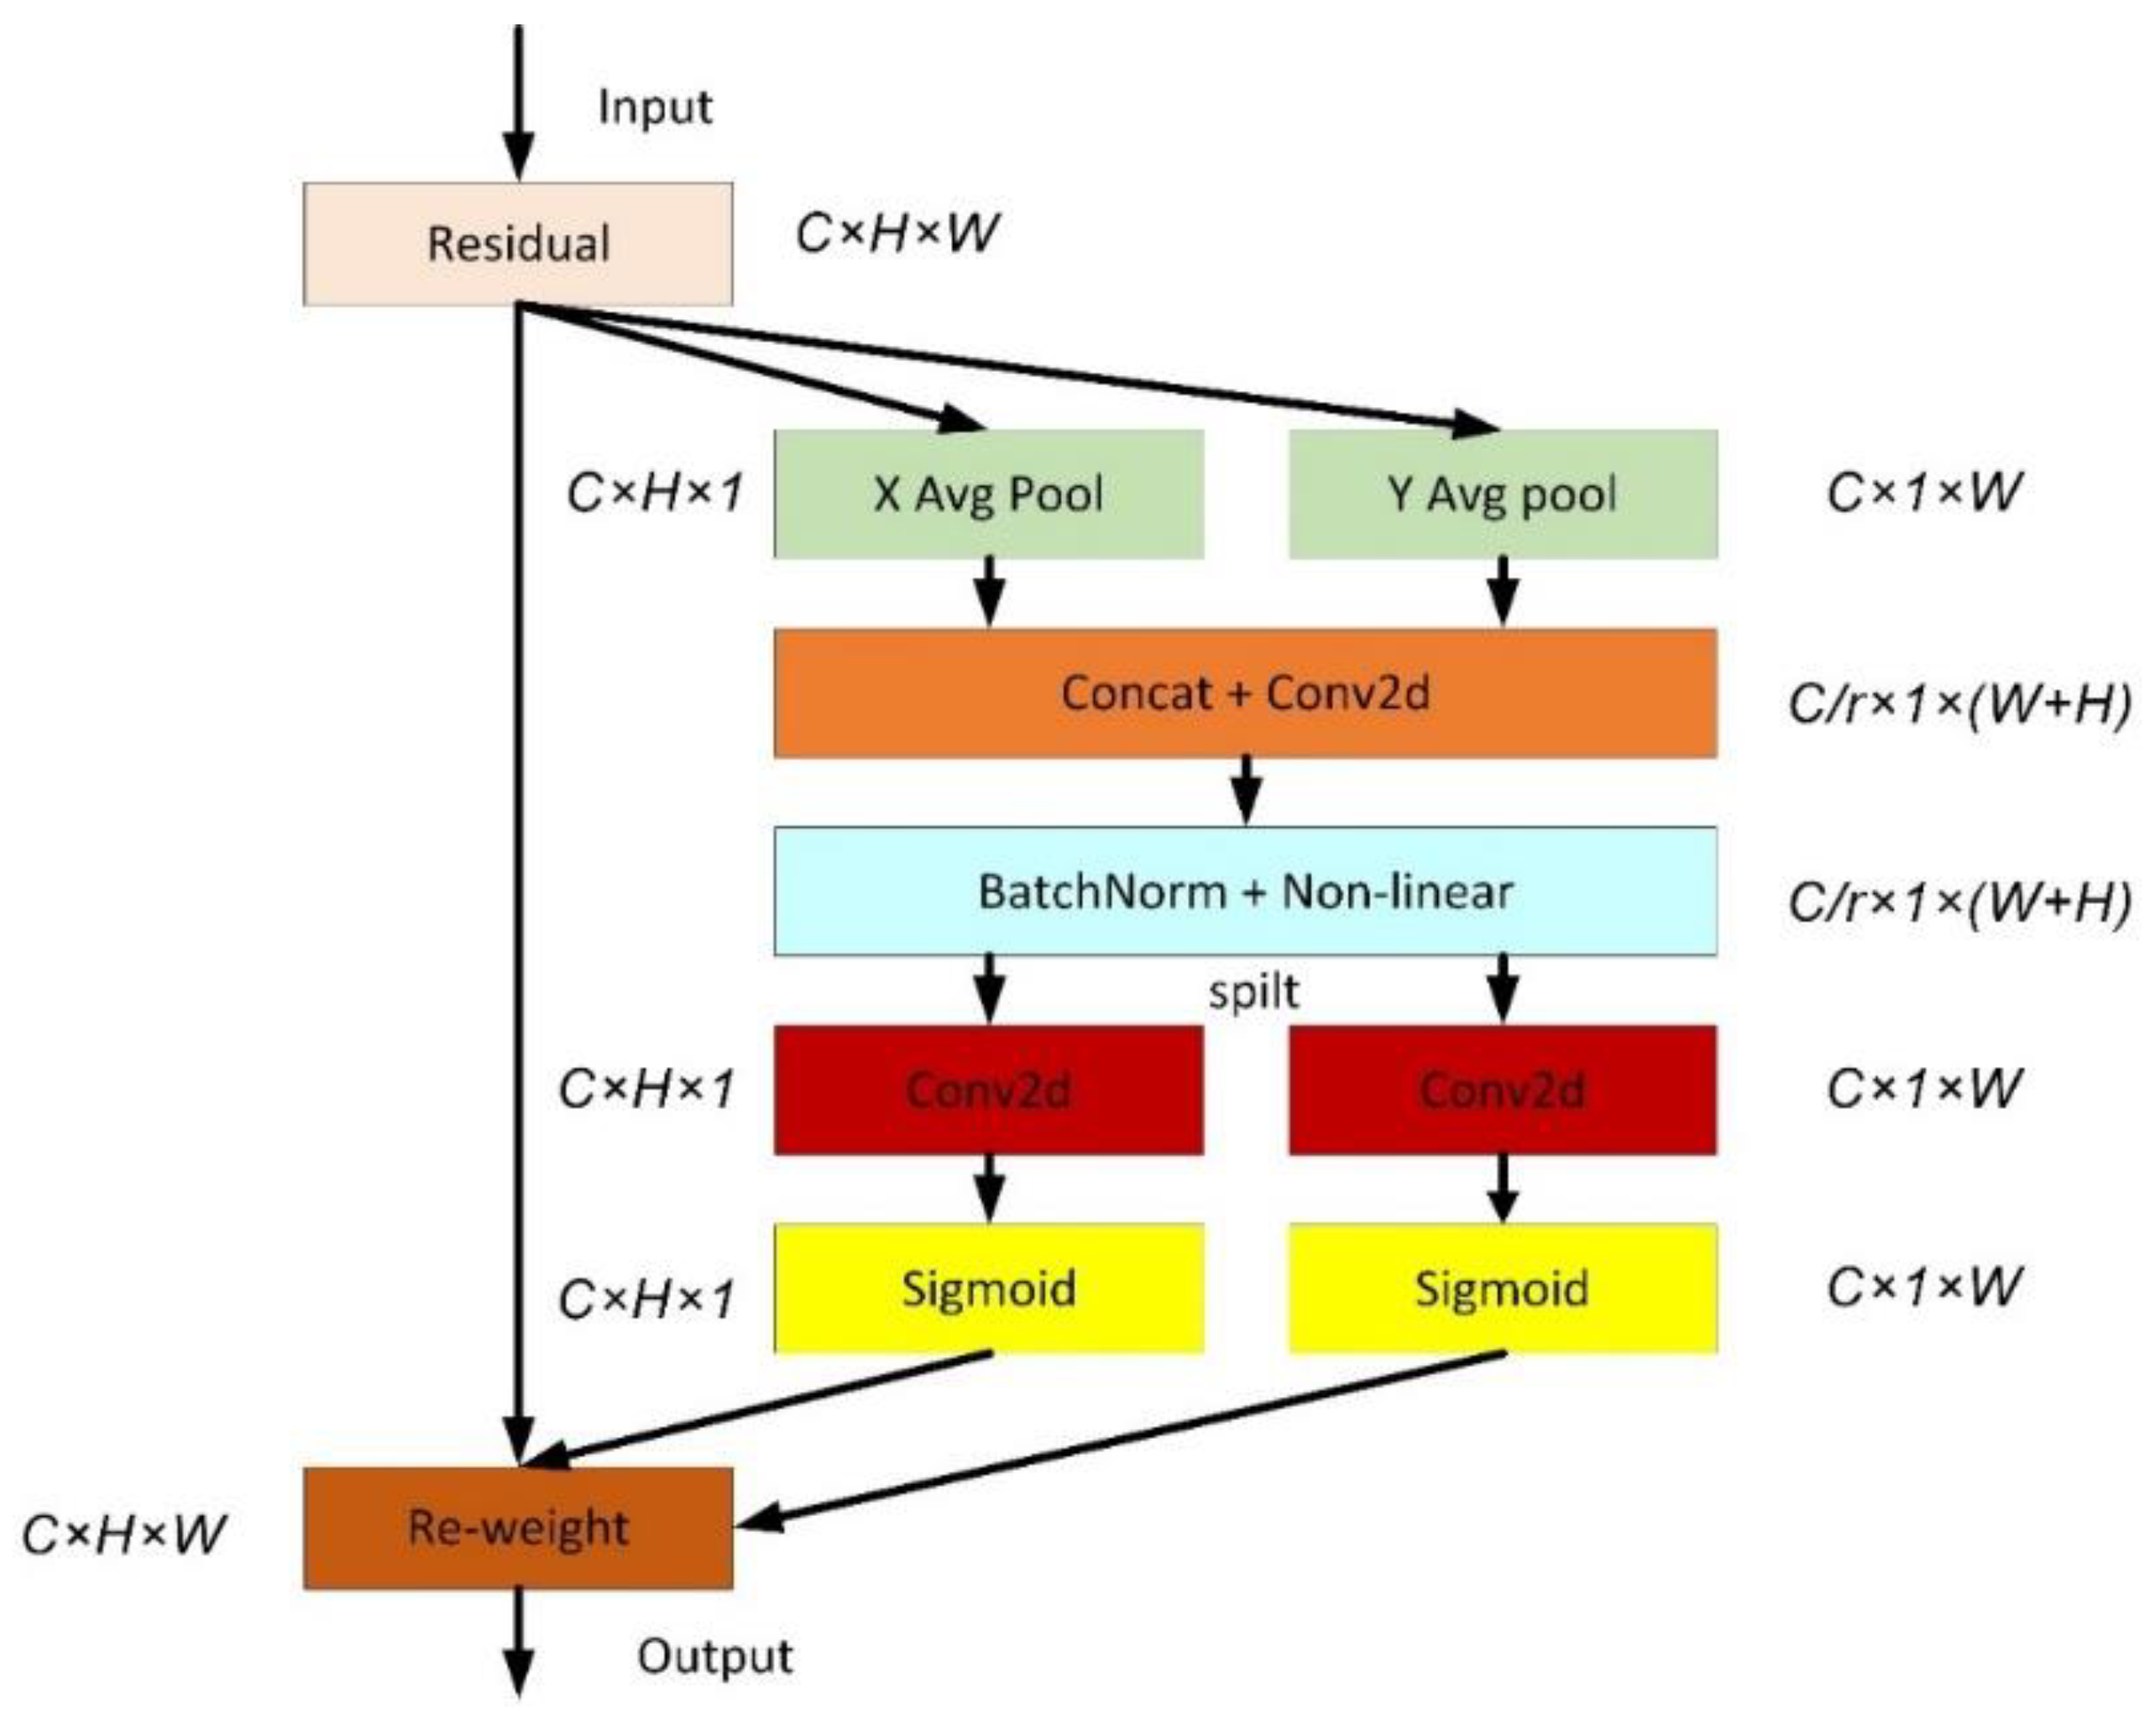
3.2.2. Coordinated Attention
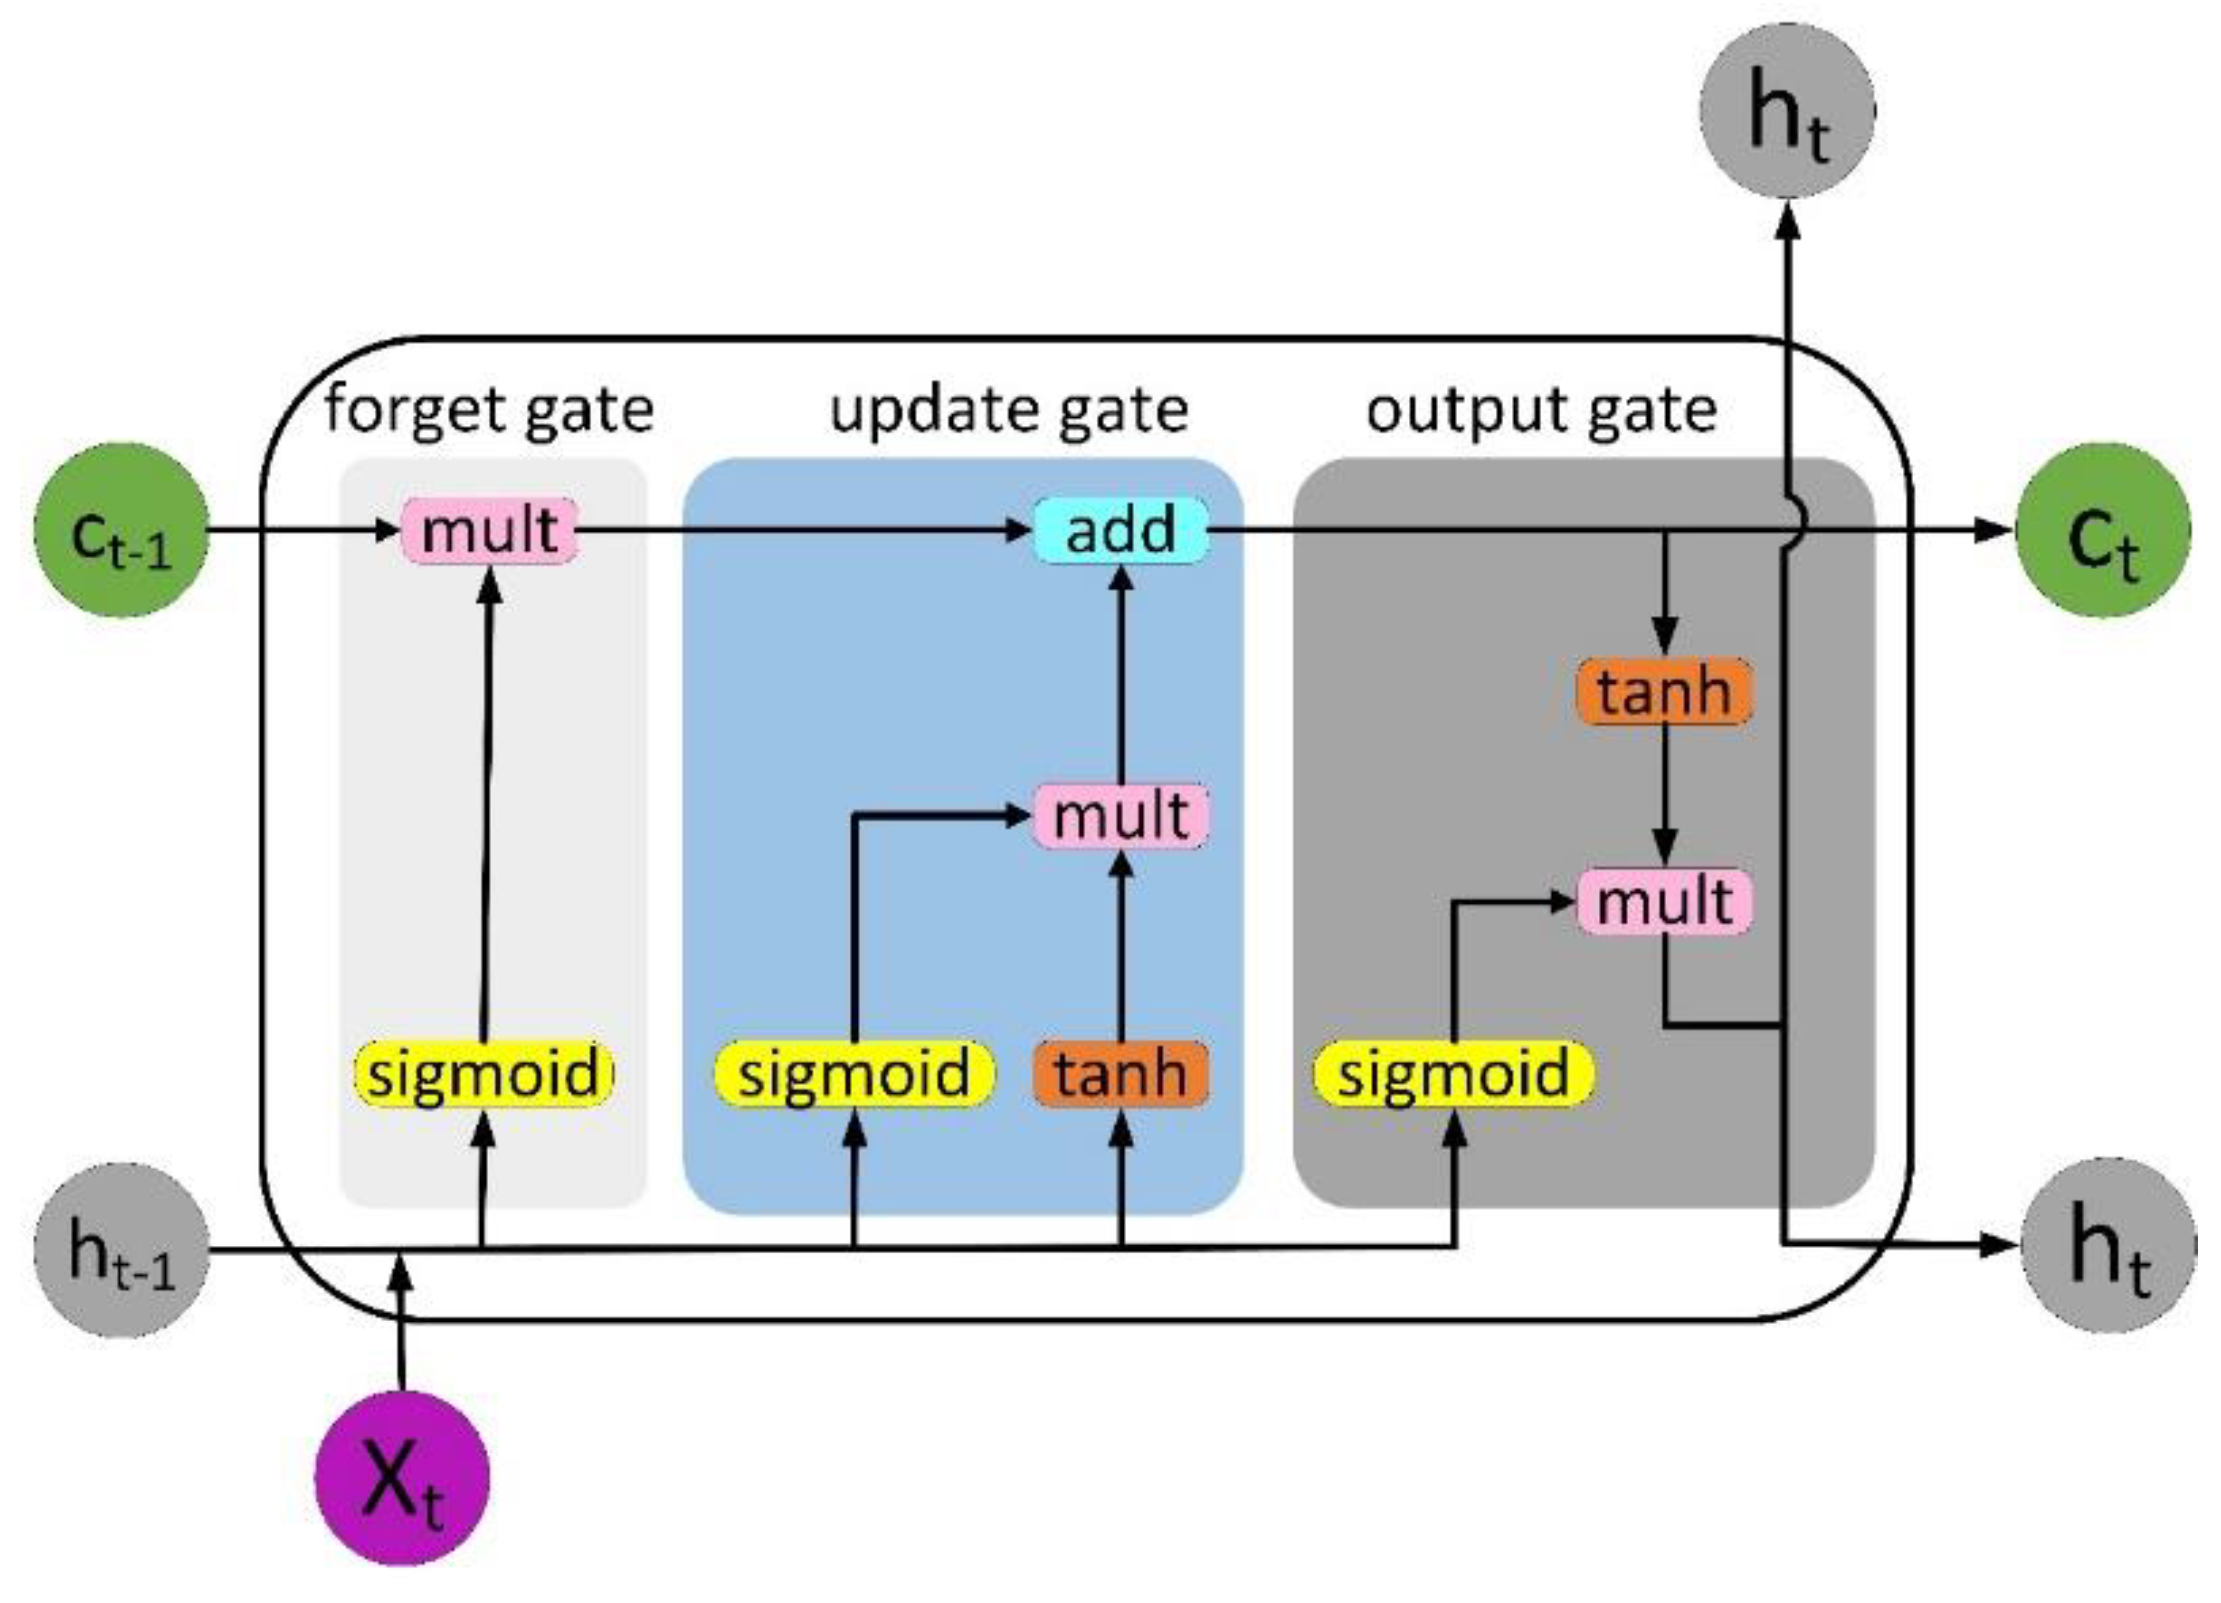
3.2.3. Long Short-Term Memory (LSTM)
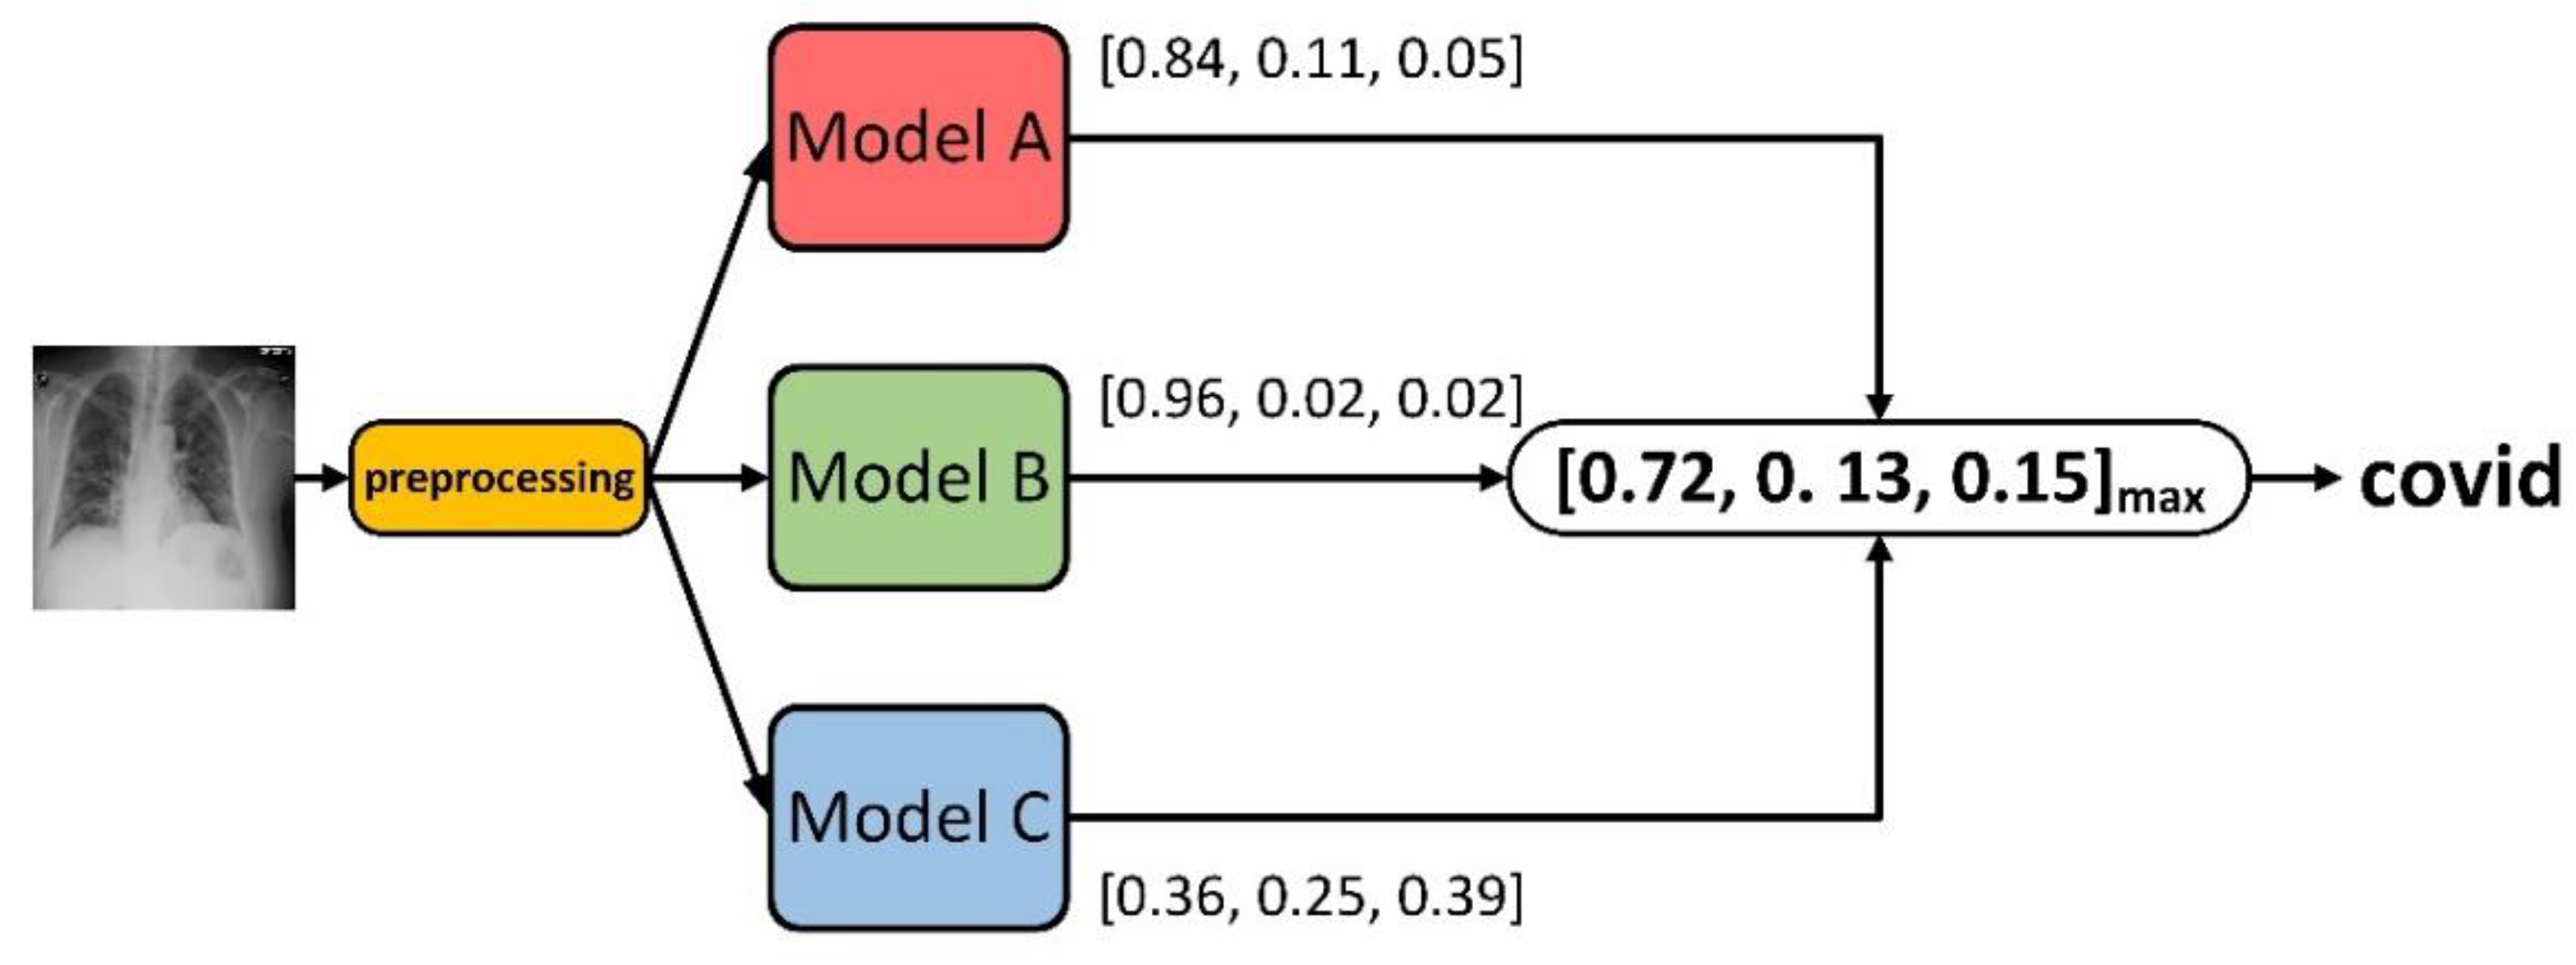
3.2.4. Confidence Fusion
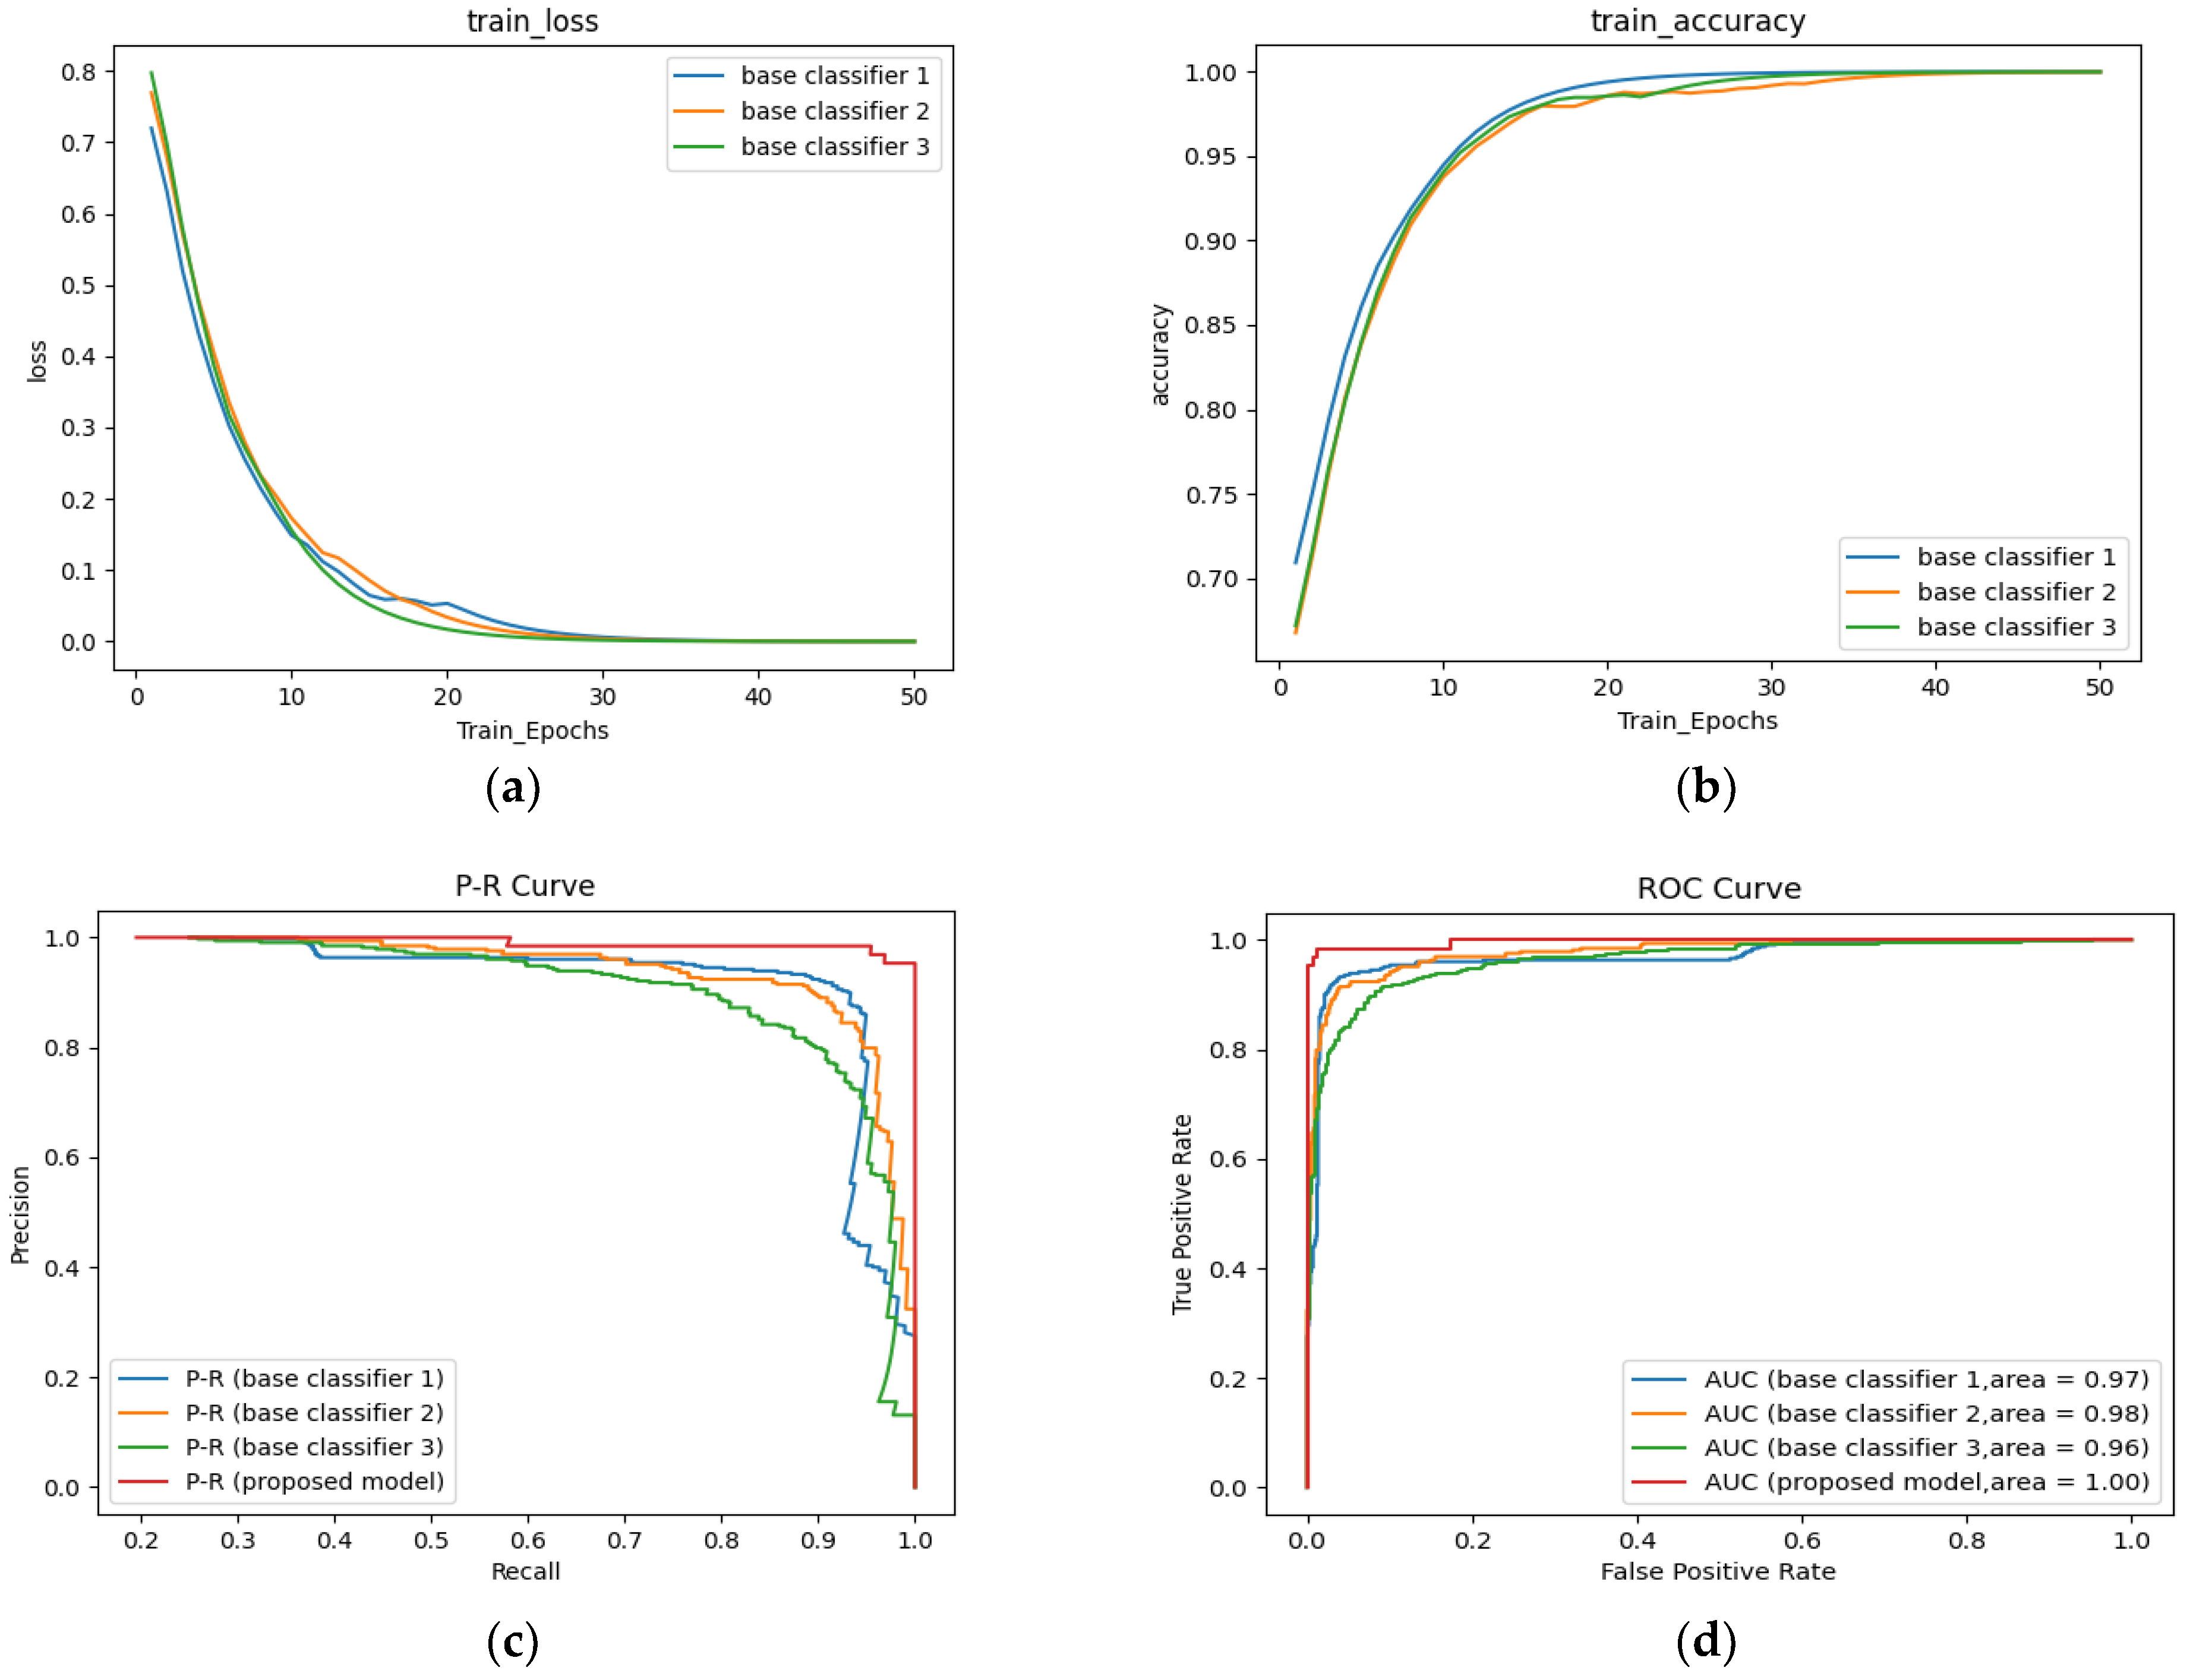
4. Experiments
4.1. Performance Parameters
4.2. Three Classifications (Dataset D1)
4.3. Four Classifications (Dataset D2)
4.4. Comparison (Dataset D3)
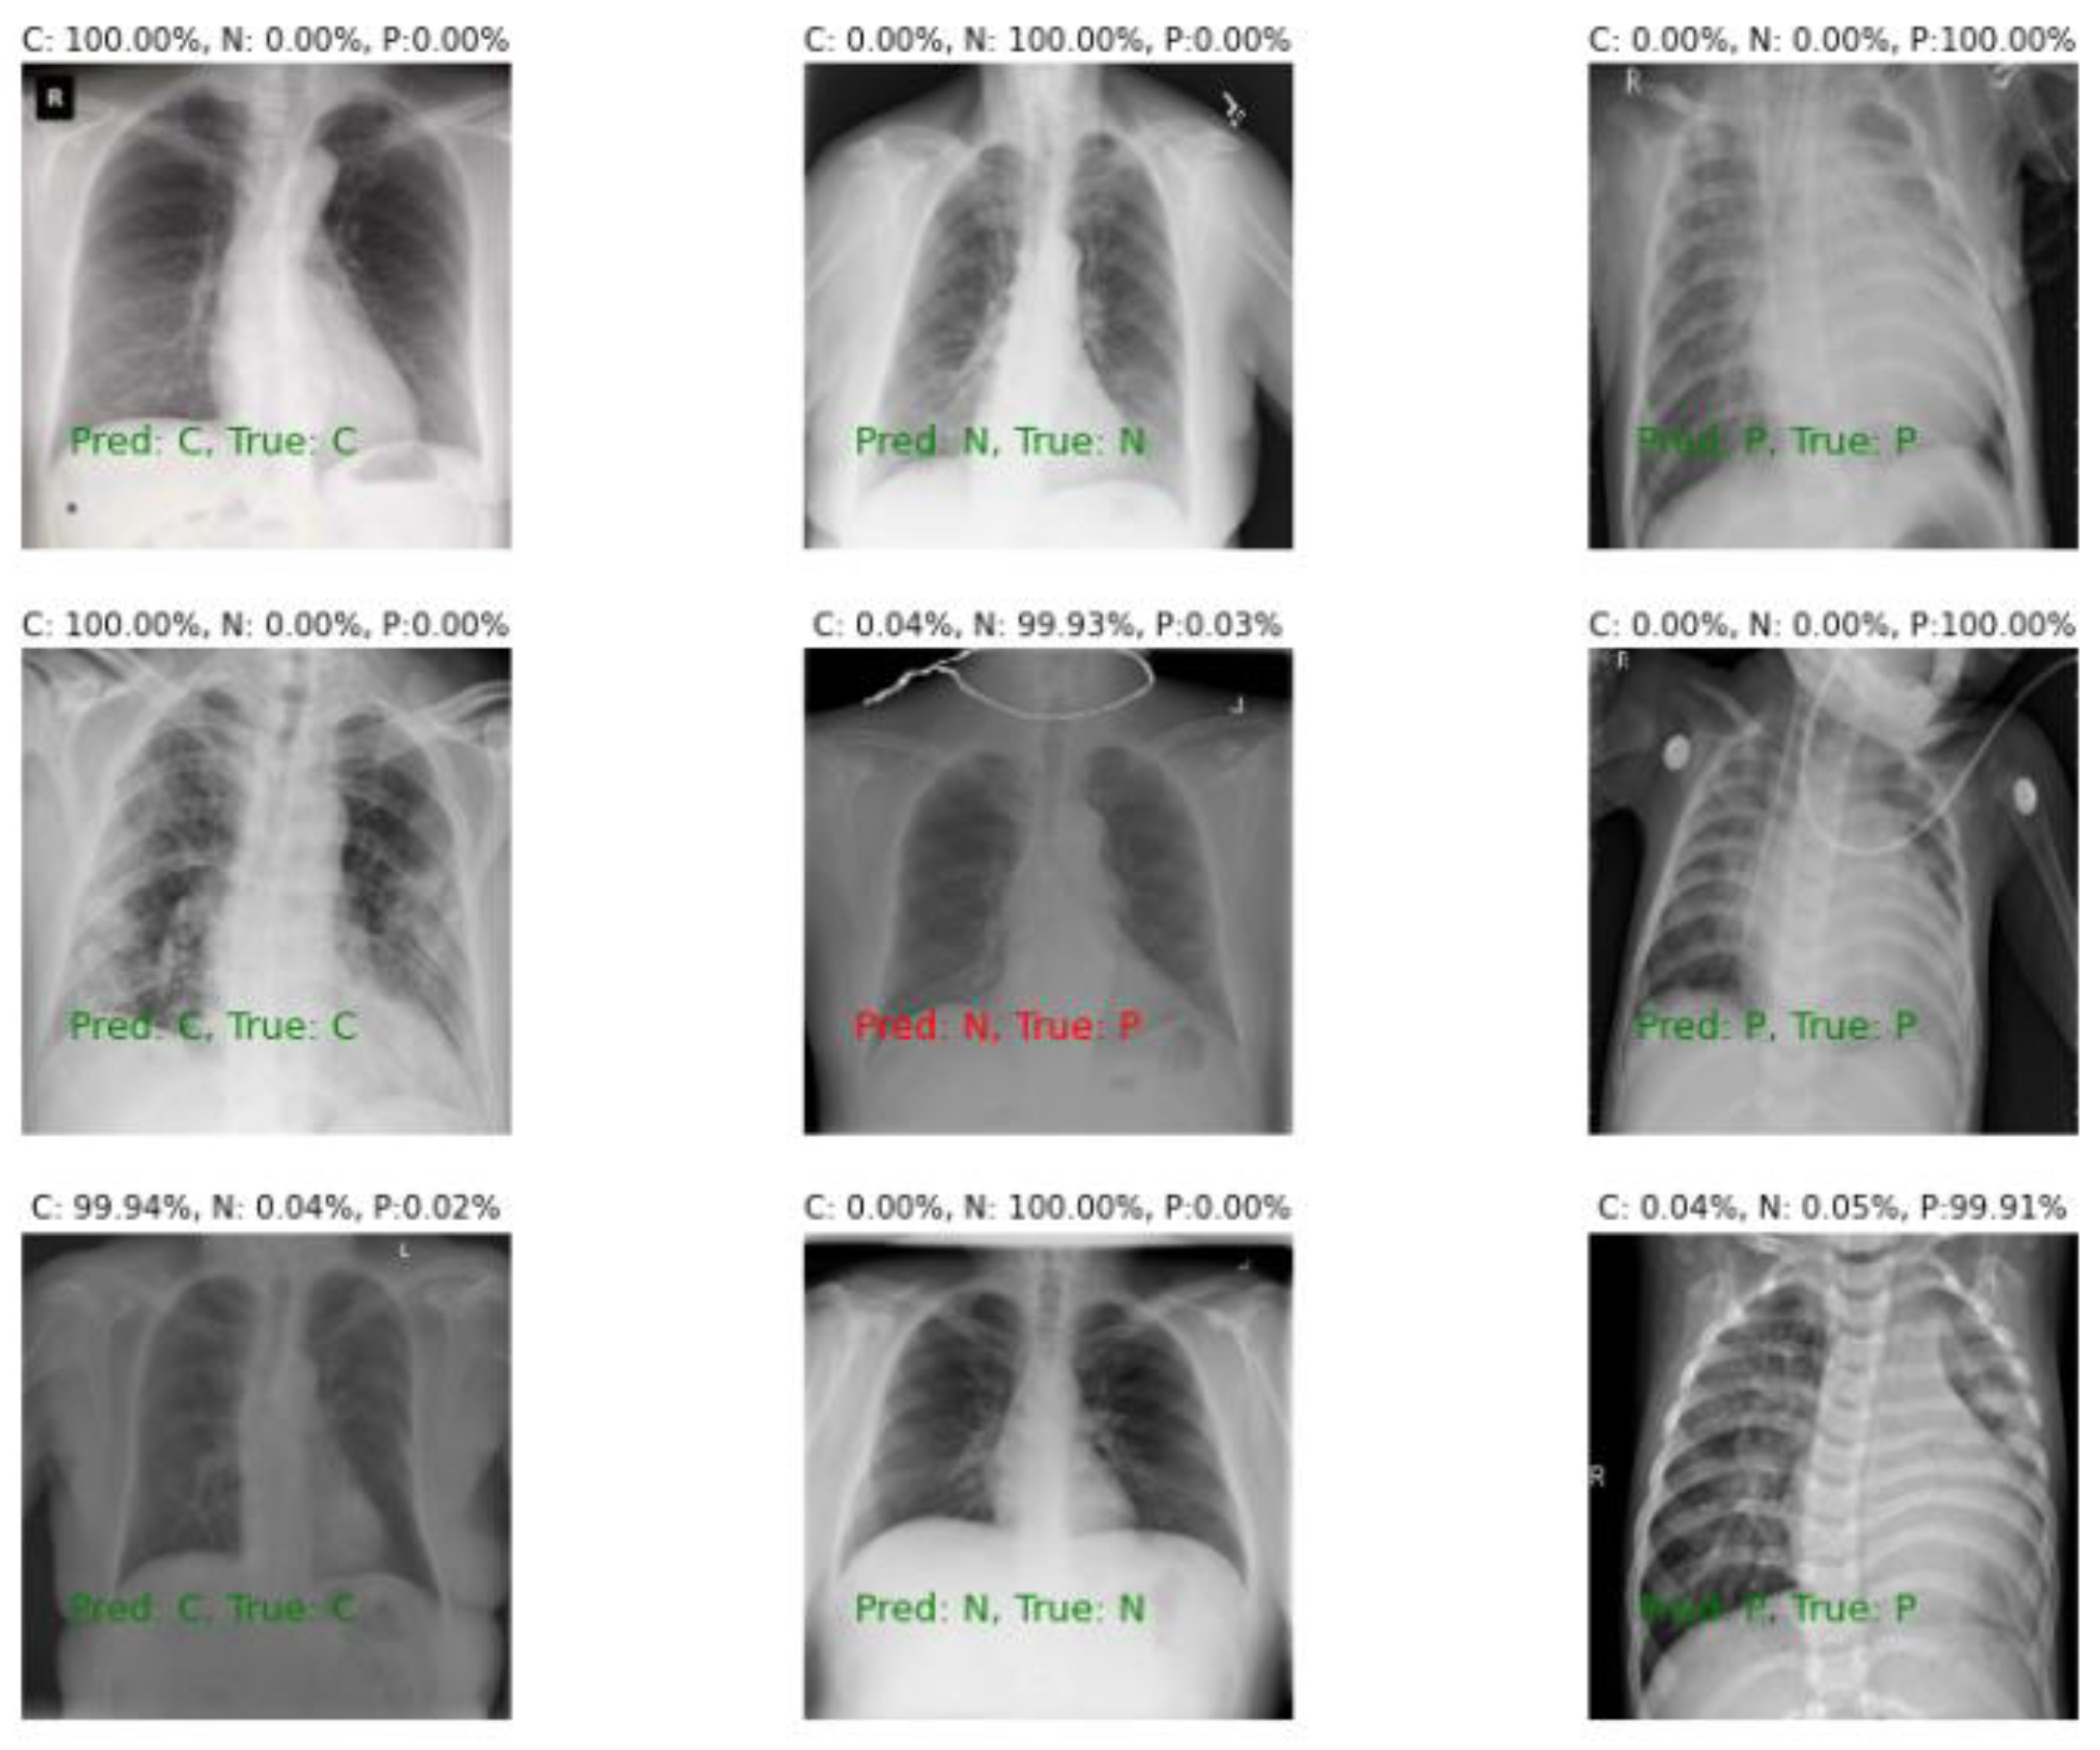
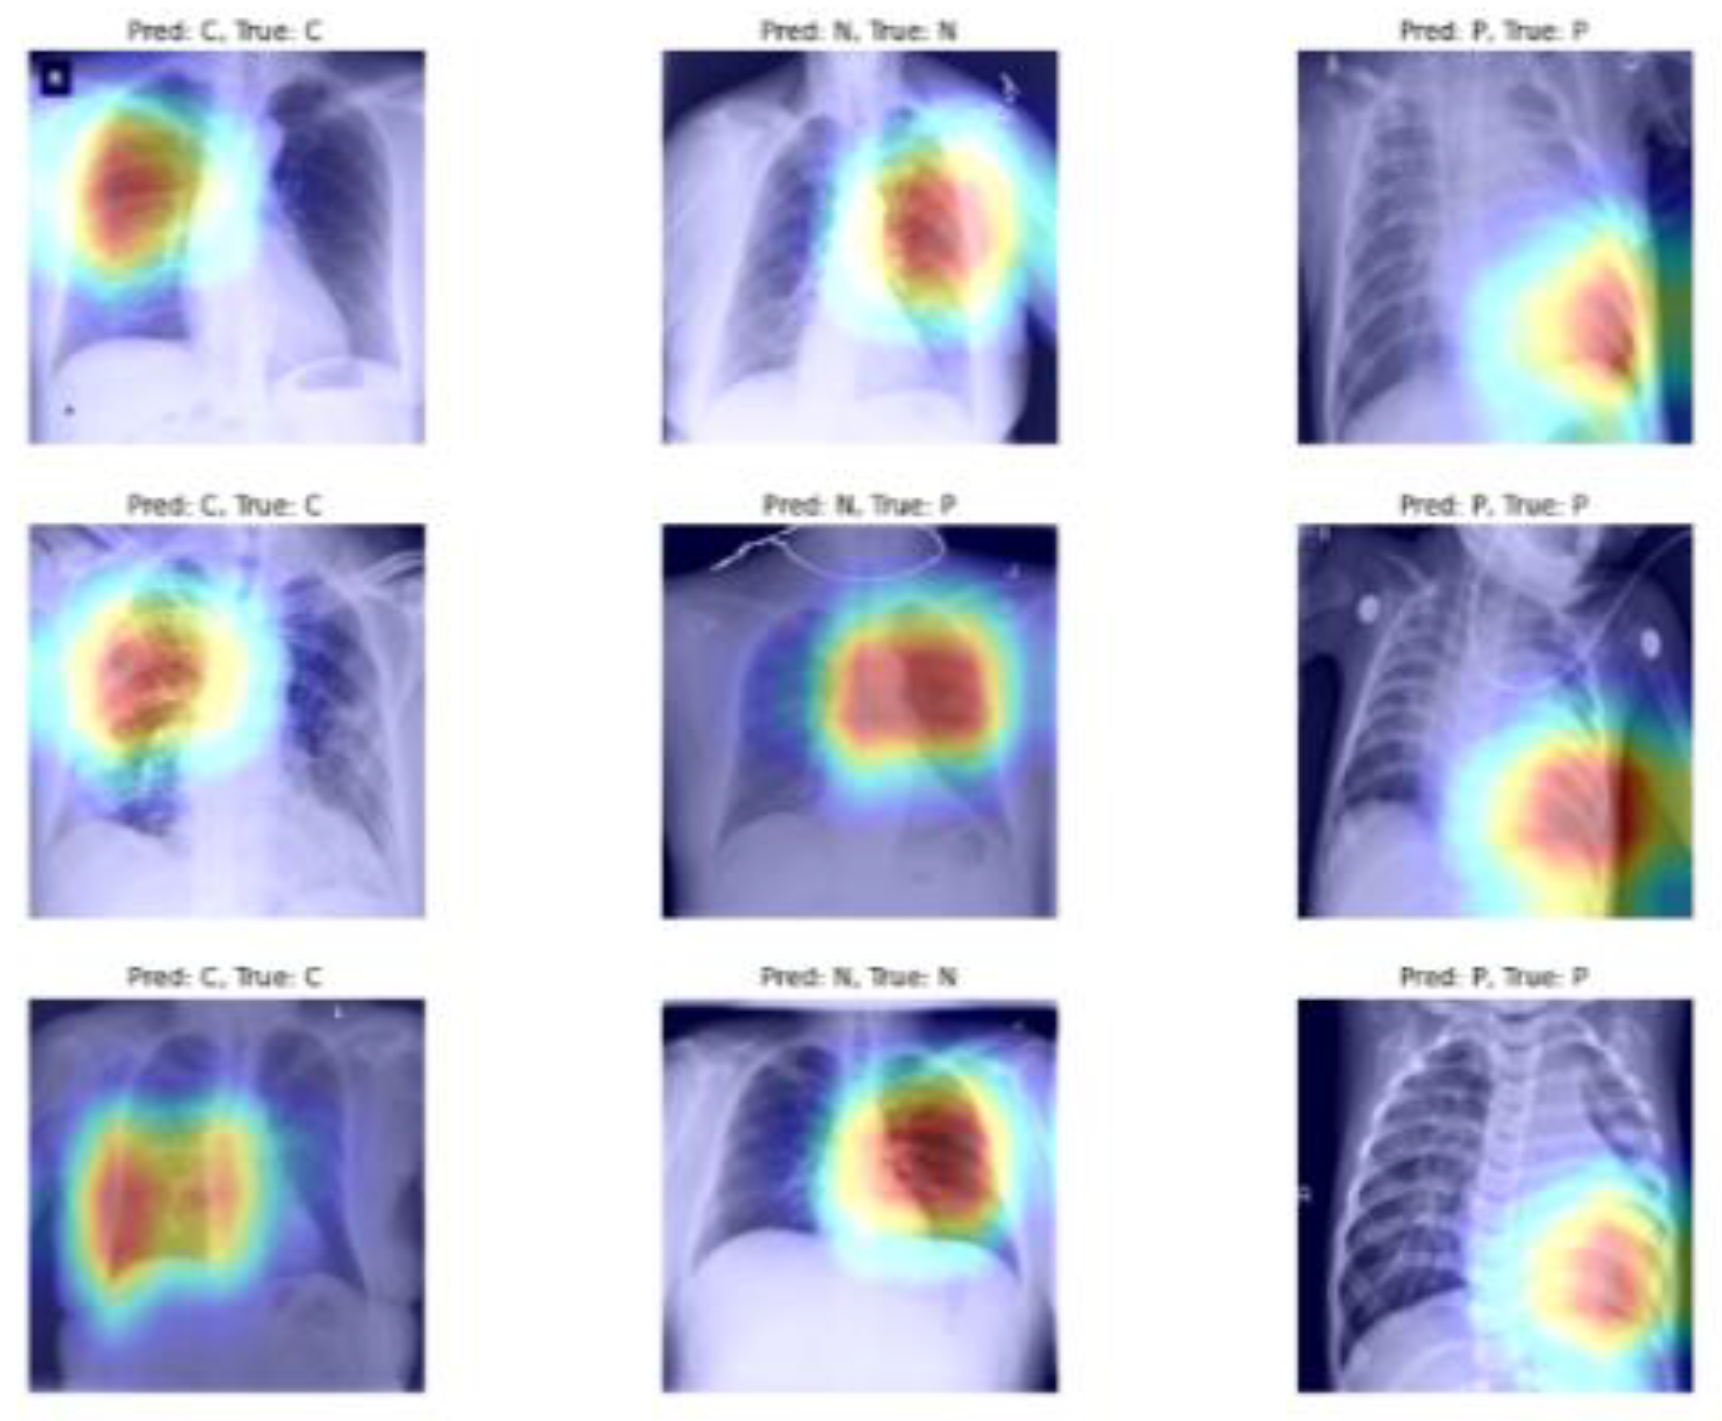
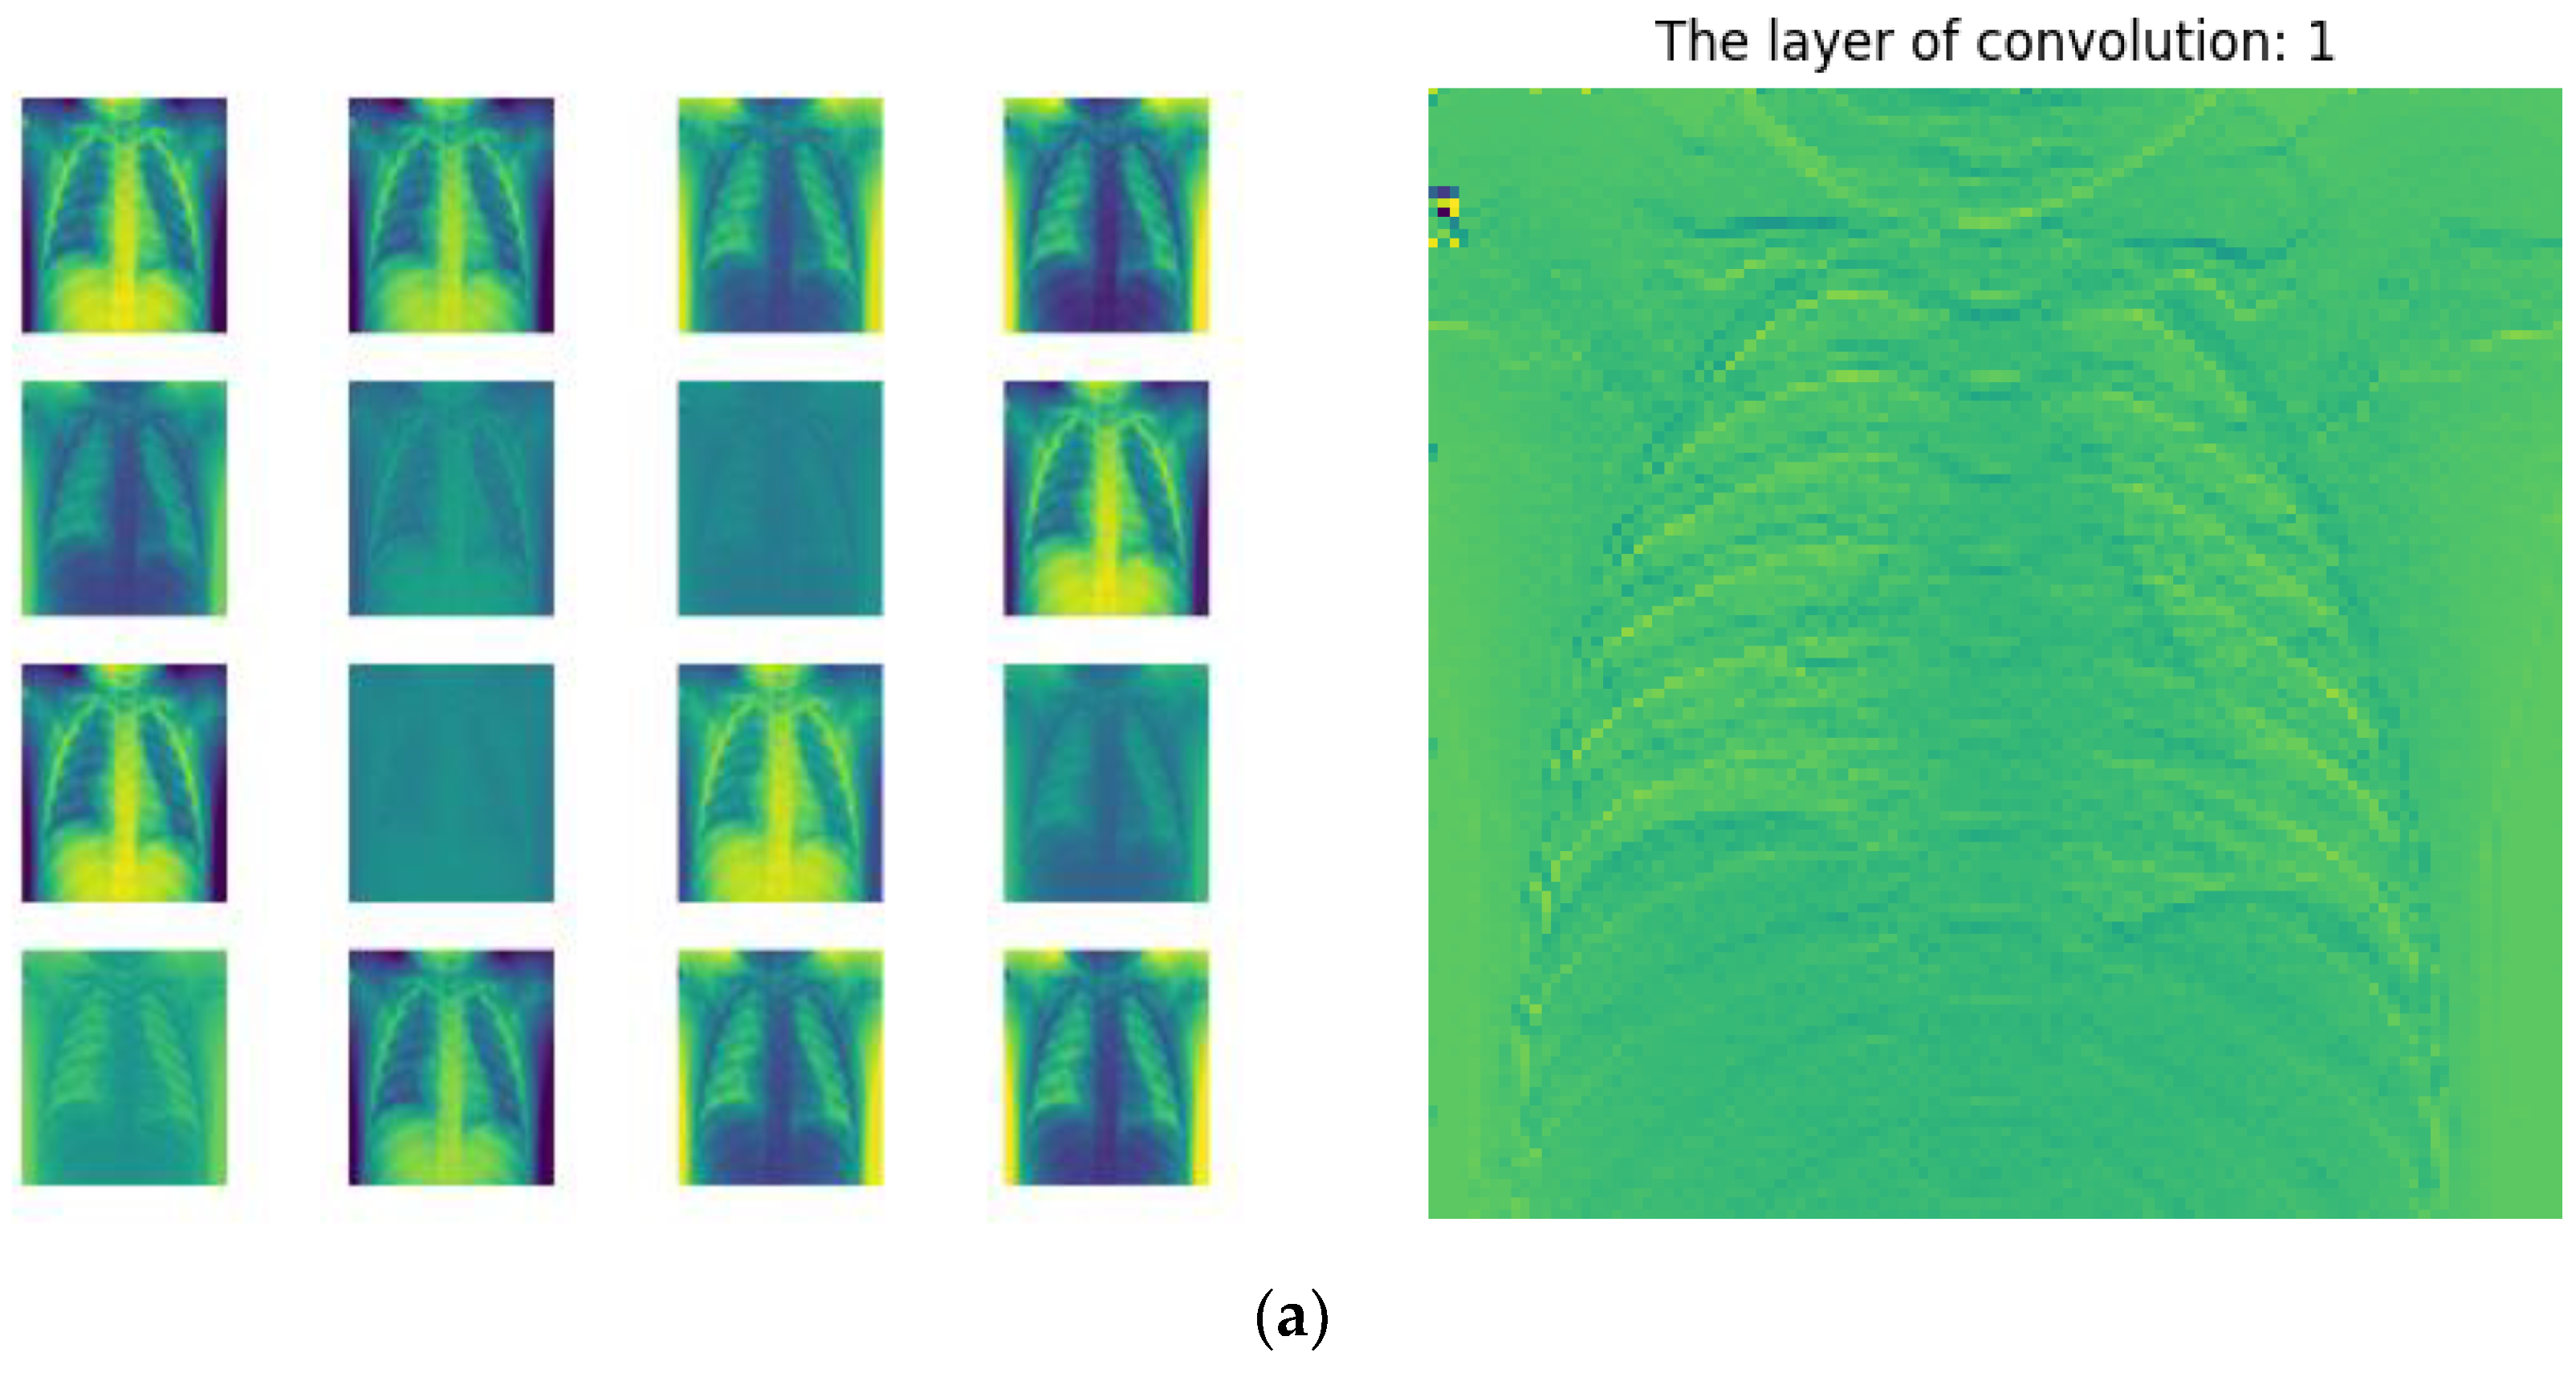
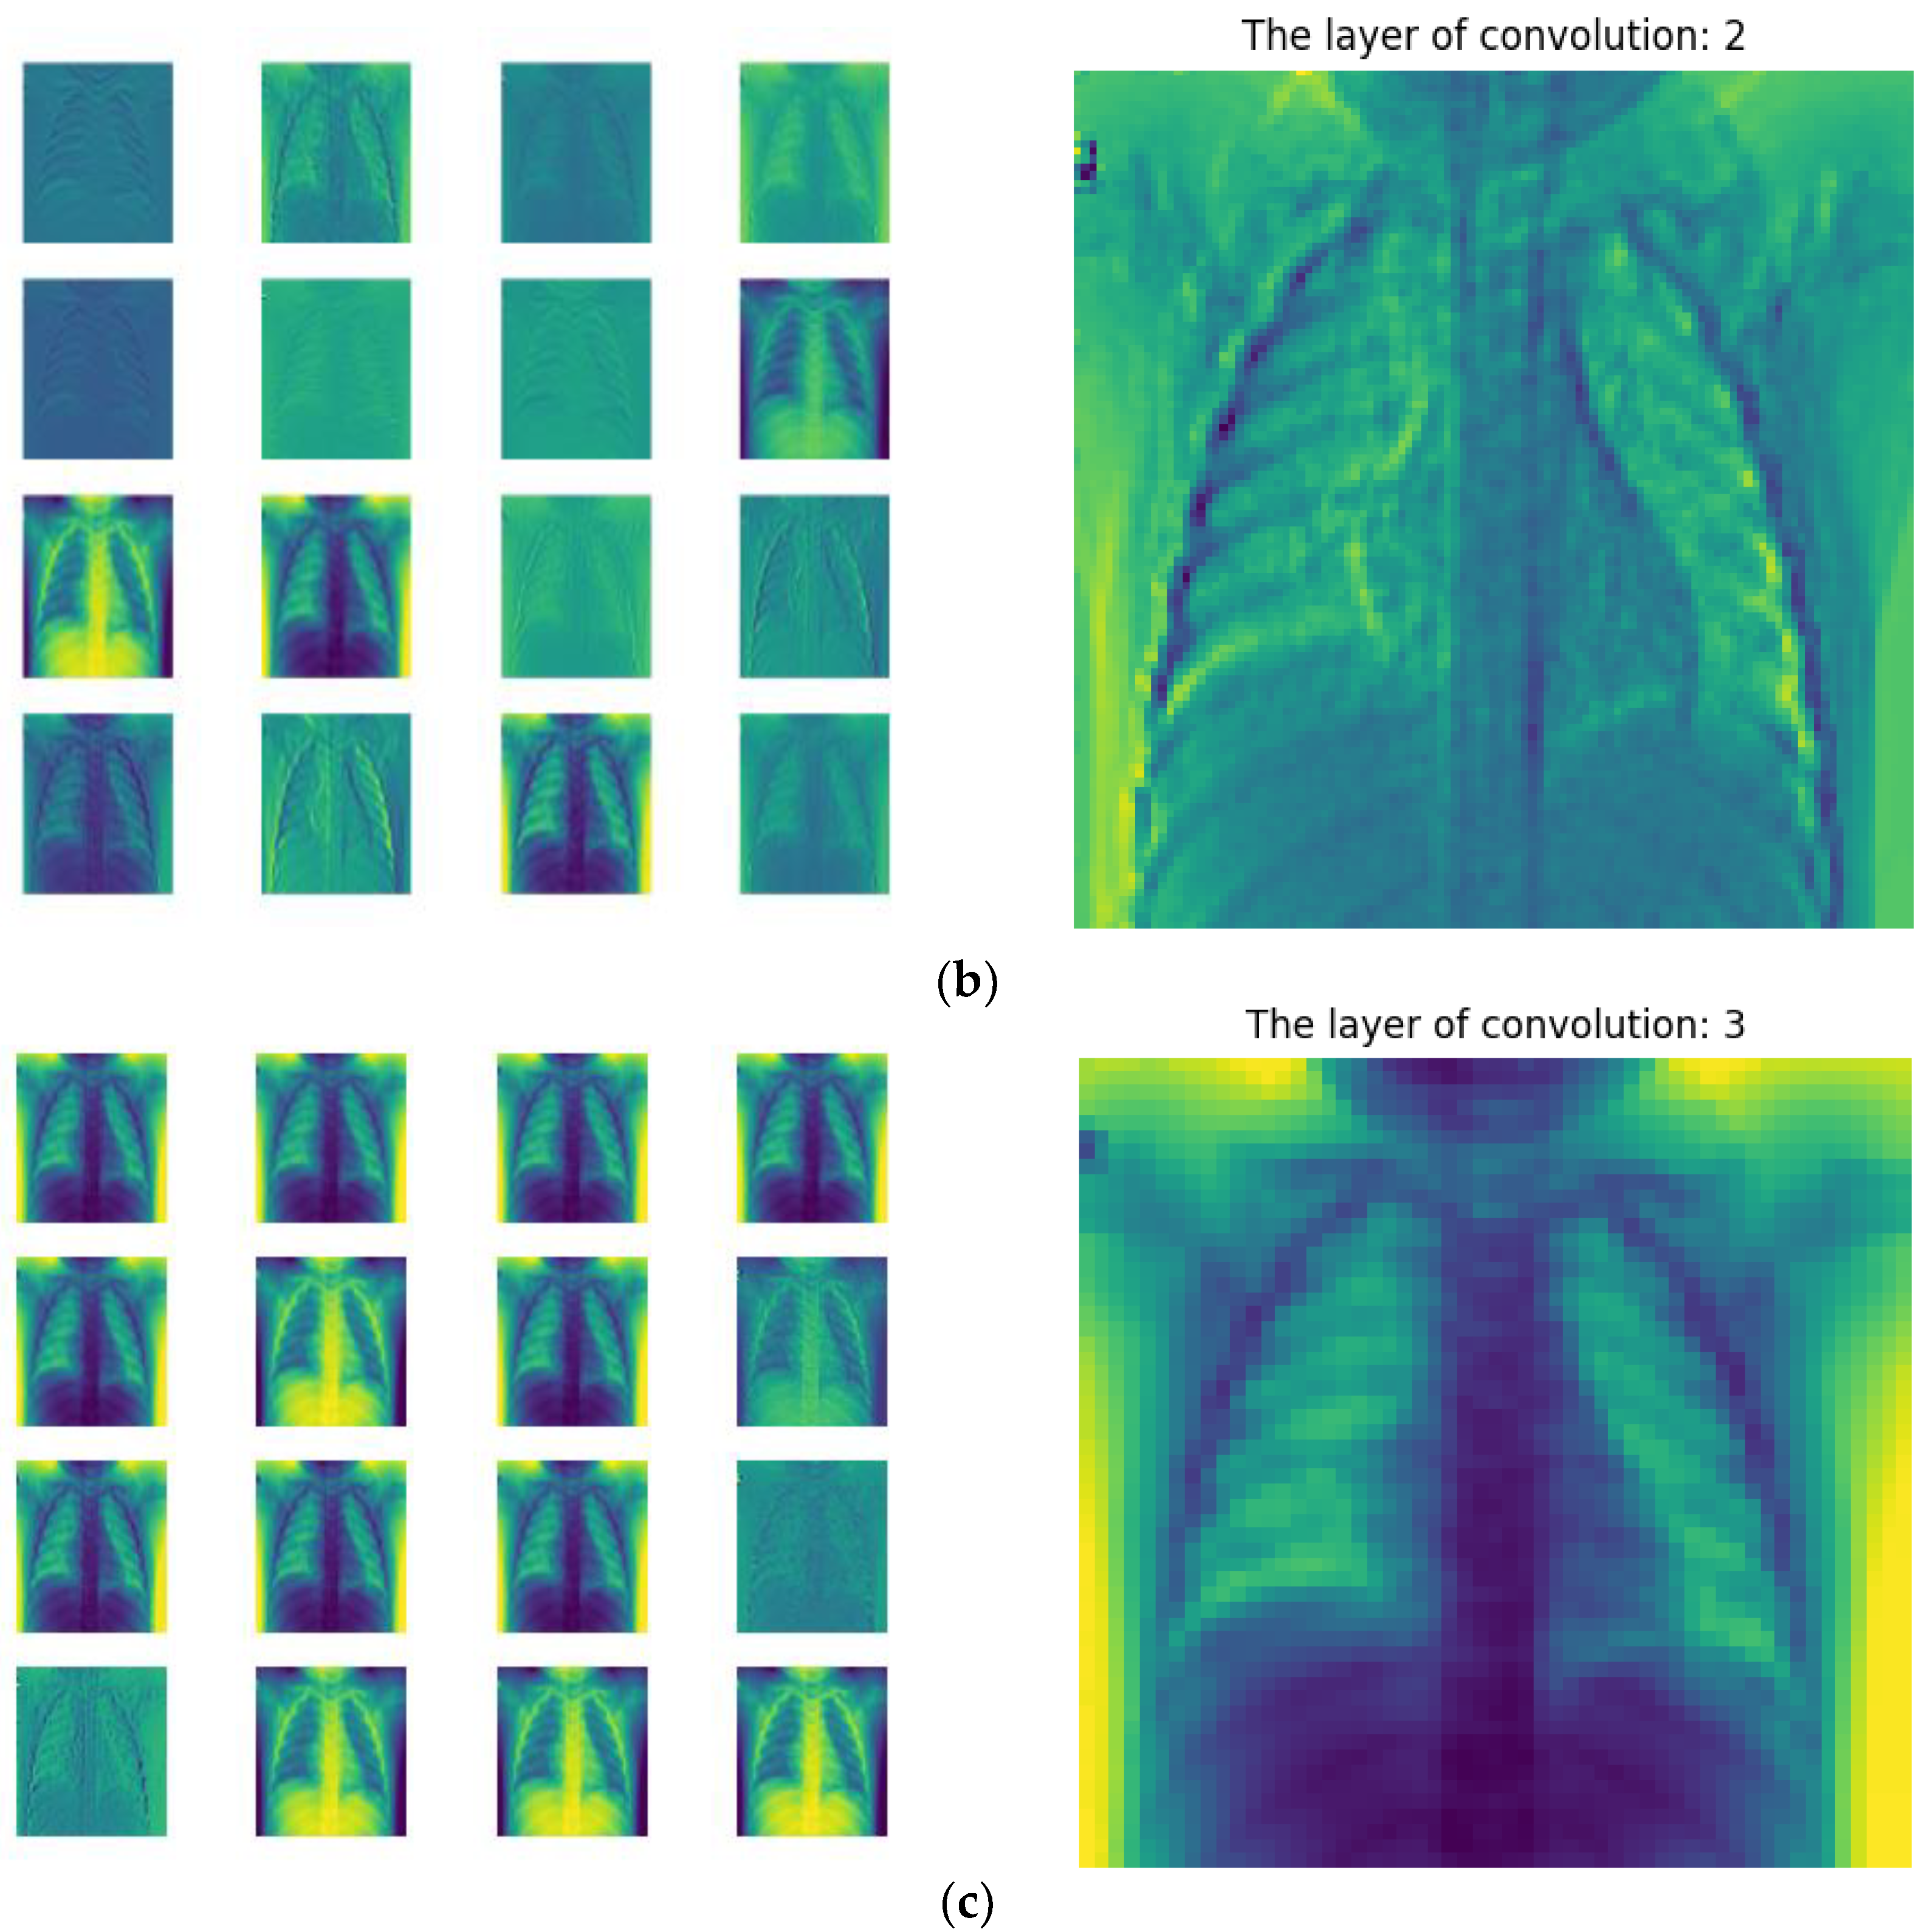
5. Visualization
6. Conclusions
Author Contributions
Funding
Institutional Review Board Statement
Informed Consent Statement
Data Availability Statement
Conflicts of Interest
References
- Available online: https://www.who.int/emergencies/diseases/novel-coronavirus-2019/interactive-timeline#! (accessed on 19 October 2022).
- Available online: https://www.who.int/publications/m/item/weekly-epidemiological-update-on-covid-19---19-october-2022 (accessed on 19 October 2022).
- Caly, L.; Druce, J.; Roberts, J.; Bond, K.; Tran, T.; Kostecki, R.; Yoga, Y.; Naughton, W.; Taiaroa, G.; Seemann, T.; et al. Isolation and rapid sharing of the 2019 novel coronavirus (SARS-CoV-2) from the first patient diagnosed with COVID-19 in Australia. Med. J. Aust. 2020, 212, 459–462. [Google Scholar] [CrossRef] [PubMed] [Green Version]
- Jin, Y.; Cai, L.; Cheng, Z.; Cheng, H.; Deng, T.; Fan, Y.; Fang, C.; Huang, D.; Huang, L.; Huang, Q.; et al. A rapid advice guideline for the diagnosis and treatment of 2019 novel coronavirus (2019-ncov) infected pneumonia (standard version). Military Med. Res. 2020, 7, 4. [Google Scholar] [CrossRef] [PubMed] [Green Version]
- Mackenzie, G. The definition and classification of pneumonia. Pneumonia 2016, 8, 14. [Google Scholar] [CrossRef] [PubMed] [Green Version]
- Barshooi, A.H.; Amirkhani, A. A novel data augmentation based on Gabor filter and convolutional deep learning for improving the classification of COVID-19 chest X-ray images. Biomed. Signal Process. Control 2022, 72, 103326. [Google Scholar] [CrossRef]
- Bernheim, A.; Mei, X.; Huang, M.; Yang, Y.; Fayad, Z.A.; Zhang, N.; Diao, K.; Lin, B.; Zhu, X.; Li, K.; et al. Chest CT findings in coronavirus disease-19 (COVID-19): Relationship to duration of infection. Radiology 2020, 295, 200463. [Google Scholar] [CrossRef] [Green Version]
- Ravi, V.; Narasimhan, H.; Chakraborty, C.; Pham, T.D. Deep learning-based meta-classifier approach for COVID-19 classification using CT scan and chest X-ray images. Multimed. Syst. 2022, 28, 1401–1415. [Google Scholar] [CrossRef]
- Aggarwal, P.; Mishra, N.K.; Fatimah, B.; Singh, P.; Gupta, A.; Joshi, S.D. COVID-19 image classification using deep learning: Advances, challenges and opportunities. Comput. Biol. Med. 2022, 144, 105350. [Google Scholar] [CrossRef]
- Wang, G.; Liu, X.; Shen, J.; Wang, C.; Li, Z.; Ye, L.; Wu, X.; Chen, T.; Wang, K.; Zhang, X.; et al. A deep-learning pipeline for the diagnosis and discrimination of viral, non-viral and COVID-19 pneumonia from chest X-ray images. Nat. Biomed. Eng. 2021, 5, 509–521. [Google Scholar] [CrossRef]
- Afifi, A.; Hafsa, N.E.; Ali, M.A.S.; Alhumam, A.; Alsalman, S. An ensemble of global and local-attention based convolutional neural networks for COVID-19 diagnosis on chest X-ray images. Symmetry 2021, 13, 113. [Google Scholar] [CrossRef]
- Masud, M. A light-weight convolutional Neural Network Architecture for classification of COVID-19 chest X-ray images. Multimed. Syst. 2022, 28, 1–10. [Google Scholar] [CrossRef]
- Dhere, A.; Sivaswamy, J. COVID detection from Chest X-ray Images using multi-scale attention. IEEE J. Biomed. Health Inform. 2022, 26, 1496–1505. [Google Scholar] [CrossRef] [PubMed]
- Chakraborty, S.; Paul, S.; Hasan, K.M. A transfer learning-based approach with deep cnn for covid-19-and pneumonia-affected chest x-ray image classification. SN Comput. Sci. 2022, 3, 1–10. [Google Scholar] [CrossRef] [PubMed]
- Khan, E.; Rehman, M.Z.U.; Ahmed, F.; Alfouzan, F.A.; Alzahrani, N.M.; Ahmad, J. Chest X-ray Classification for the Detection of COVID-19 Using Deep Learning Techniques. Sensors 2022, 22, 1211. [Google Scholar] [CrossRef] [PubMed]
- Verma, S.S.; Prasad, A.; Kumar, A. CovXmlc: High performance COVID-19 detection on X-ray images using Multi-Model classification. Biomed. Signal Process. Control 2022, 71, 103272. [Google Scholar] [CrossRef]
- Das, A. Adaptive UNet-based Lung Segmentation and Ensemble Learning with CNN-based Deep Features for Automated COVID-19 Diagnosis. Multimed. Tools Appl. 2022, 81, 5407–5441. [Google Scholar] [CrossRef]
- Sharma, A.; Singh, K.; Koundal, D. A Novel Fusion based Convolutional Neural Network Approach for Classification of COVID-19 from Chest X-ray Images. Biomed. Signal Process. Control 2022, 77, 103778. [Google Scholar] [CrossRef]
- Liu, J.; Sun, W.; Zhao, X.; Zhao, J.; Jiang, Z. Deep feature fusion classification network (DFFCNet): Towards accurate diagnosis of COVID-19 using chest X-rays images. Biomed. Signal Process. Control 2022, 76, 103677. [Google Scholar] [CrossRef]
- Khan, S.H.; Sohail, A.; Khan, A.; Lee, Y.-S. COVID-19 detection in chest X-ray images using a new channel boosted CNN. Diagnostics 2022, 12, 267. [Google Scholar] [CrossRef]
- Mahbub, M.K.; Biswas, M.; Gaur, L.; Alenezi, F.; Santosh, K.C. Deep features to detect pulmonary abnormalities in chest X-rays due to infectious diseaseX: Covid-19, pneumonia, and tuberculosis. Inf. Sci. 2022, 592, 389–401. [Google Scholar] [CrossRef]
- Khan, A.I.; Shah, J.L.; Bhat, M.M. CoroNet: A deep neural network for detection and diagnosis of COVID-19 from chest X-ray images. Comput. Methods Programs Biomed. 2020, 196, 105581. [Google Scholar] [CrossRef]
- Tartaglione, E.; Barbano, C.A.; Berzovini, C.; Calandri, M.; Grangetto, M. Unveiling COVID-19 from chest X-ray with deep learning: A hurdles race with small data. Int. J. Environ. Res. Public Health 2020, 17, 6933. [Google Scholar] [CrossRef] [PubMed]
- Chollet, F. Xception: Deep learning with depthwise separable convolutions. In Proceedings of the IEEE Conference on Computer Vision and Pattern Recognition, Honolulu, HI, USA, 21–26 July 2017; pp. 1251–1258. [Google Scholar]
- Sandler, M.; Howard, A.; Zhu, M.; Zhmoginov, A.; Chen, L. Mobilenetv2: Inverted residuals and linear bottlenecks. In Proceedings of the IEEE Conference on Computer Vision and Pattern Recognition, Salt Lake City, UT, USA, 18–23 June 2018; pp. 4510–4520. [Google Scholar]
- Zoph, B.; Vasudevan, V.; Shlens, J.; Le, Q.V. Learning transferable architectures for scalable image recognition. In Proceedings of the IEEE Conference on Computer Vision and Pattern Recognition, Salt Lake City, UT, USA, 18–23 June 2018; pp. 8697–8710. [Google Scholar]
- Hou, Q.; Zhou, D.; Feng, J. Coordinate Attention for Efficient Mobile Network Design. arXiv 2021, arXiv:2103.02907. [Google Scholar]
- Greff, K.; Srivastava, R.K.; Koutník, J.; Steunebrink, B.R.; Schmidhuber, J. LSTM: A search space odyssey. IEEE Trans. Neural Netw. Learn. Syst. 2016, 28, 2222–2232. [Google Scholar] [CrossRef] [Green Version]
- Zheng, S.; Qi, P.; Chen, S.X.; Yang, X. Fusion methods for CNN-Based automatic modulation classification. IEEE Access Spec. Sect. Artif. Intell. Phys.-Layer Wirel. Commun. 2019, 7, 66496–66504. [Google Scholar] [CrossRef]
- Chakraborty, S.; Murali, B.; Mitra, A.K. An efficient deep learning model to detect COVID-19 using chest X-ray images. Int. J. Environ. Res. Public Health 2022, 19, 2013. [Google Scholar] [CrossRef] [PubMed]
- Wang, L.; Lin, Z.Q.; Wong, A. Covid-net: A tailored deep convolutional neural network design for detection of COVID-19 cases from chest X-ray images. Sci. Rep. 2020, 10, 19549. [Google Scholar] [CrossRef] [PubMed]
- Shibly, K.H.; Dey, S.K.; Islam, M.T.; Rahman, M.M. COVID faster R-CNN: A novel framework to diagnose novel coronavirus disease (COVID-19) in X-ray images. Inform. Med. Unlocked. 2020, 20, 100405. [Google Scholar] [CrossRef]
- Ozturk, T.; Talo, M.; Yildirim, E.A.; Baloglu, U.B.; Yildirim, O.; Acharya, U.R. Automated detection of COVID-19 cases using deep neural networks with X-ray images. Comput. Biol. Med. 2020, 121, 103792. [Google Scholar] [CrossRef]
- Law, B.K.; Lin, L.P. Development of A Deep Learning Model to Classify X-ray of Covid-19, Normal and Pneumonia-Affected Patients. In Proceedings of the IEEE International Conference on Signal and Image Processing Applications (ICSIPA), Virtual, 13–15 September 2021; pp. 1–6. [Google Scholar] [CrossRef]
- Montalbo, F.J.P. Diagnosing Covid-19 chest X-rays with a lightweight truncated DenseNet with partial layer freezing and feature fusion. Biomed. Signal Process. Control 2021, 68, 102583. [Google Scholar] [CrossRef]
- Bhattacharyya, A.; Bhaik, D.; Kumar, S.; Thakur, P.; Sharma, R.; Pachori, R.B. A deep learning based approach for automatic detection of COVID-19 cases using chest X-ray images. Biomed. Signal Process. Control 2022, 71, 103182. [Google Scholar] [CrossRef]
- Selvaraju, R.R.; Cogswell, M.; Das, A.; Vedantam, R.; Parikh, D.; Batra, D. Grad-cam: Visual explanations from deep networks via gradient-based localization. In Proceedings of the IEEE International Conference on Computer Vision, Venice, Italy, 22–29 October 2017; pp. 618–626. [Google Scholar]
- Nguyen, A.; Yosinski, J.; Clune, J. Deep neural networks are easily fooled: High confidence predictions for unrecognizable images. In Proceedings of the IEEE Conference on Computer Vision and Pattern Recognition, Boston, MA, USA, 7–12 June 2015; pp. 427–436. [Google Scholar]
- Oh, Y.; Park, S.; Ye, J.C. Deep learning COVID-19 features on CXR using limited training data sets. IEEE Trans. Med. Imaging 2020, 39, 2688–2700. [Google Scholar] [CrossRef] [PubMed]
- Yamac, M.; Ahishali, M.; Degerli, A.; Kiranyaz, S.; Chowdhury, M.E.H.; Gabbouj, M. Convolutional sparse support estimator-based COVID-19 recognition from X-ray images. IEEE Trans. Neural Netw. Learn. Syst. 2021, 32, 1810–1820. [Google Scholar] [CrossRef] [PubMed]
- Mondal, A.K. COVID-19 prognosis using limited chest X-ray images. Appl. Soft Comput. 2022, 122, 108867. [Google Scholar] [CrossRef] [PubMed]
- Gal, Y.; Ghahramani, Z. Dropout as a bayesian approximation: Representing model uncertainty in deep learning. In Proceedings of the International Conference on Machine Learning (PMLR), New York, NY, USA, 20–22 June 2016; pp. 1050–1059. [Google Scholar]


| Dadaset | Source Address | Class (Number of Samples) | Total |
|---|---|---|---|
| D1 | www.kaggle.com/amanullahasraf/COVID19-pneumonia-normal-chest-xray-pa-dataset (accessed on 17 June 2022) | COVID (2313) | 6939 images |
| normal (2313) | |||
| pneumonia (2313) | |||
| D2 | https://github.com/drkhan107/CoroNet (accessed on 18 August 2022) | COVID (320) | 1638 images |
| normal (445) | |||
| pneumonia_bacteria (449) | |||
| pneumonia_viral (424) | |||
| D3 | https://data.mendeley.com/datasets/9xkhgts2s6/1 (accessed on 18 August 2022) | COVID (1281) | 9208 images |
| normal (3270) | |||
| pneumonia_bacteria (3001) | |||
| pneumonia_viral (1656) |
| Based on the Gold Standard | |||
|---|---|---|---|
| Disease Present | Disease Absent | Total | |
| Predicted Model Positive | True positive (TP) | False positive (FP) | TP + FP |
| Predicted Model Negative | False negative (FN) | True negative (TN) | FN + TN |
| Total | TP + FN | FP + TN | TP + FP + FN + TN |
| Xception | MobileNetV2 | NASNetMobile | |
|---|---|---|---|
| CNN | 93.32 | 91.87 | 92.88 |
| CNN + CoordAtt * | 94.12 | 93.96 | 93.10 |
| CNN + CoordAtt + LSTM | 94.27 | 94.03 | 93.15 |
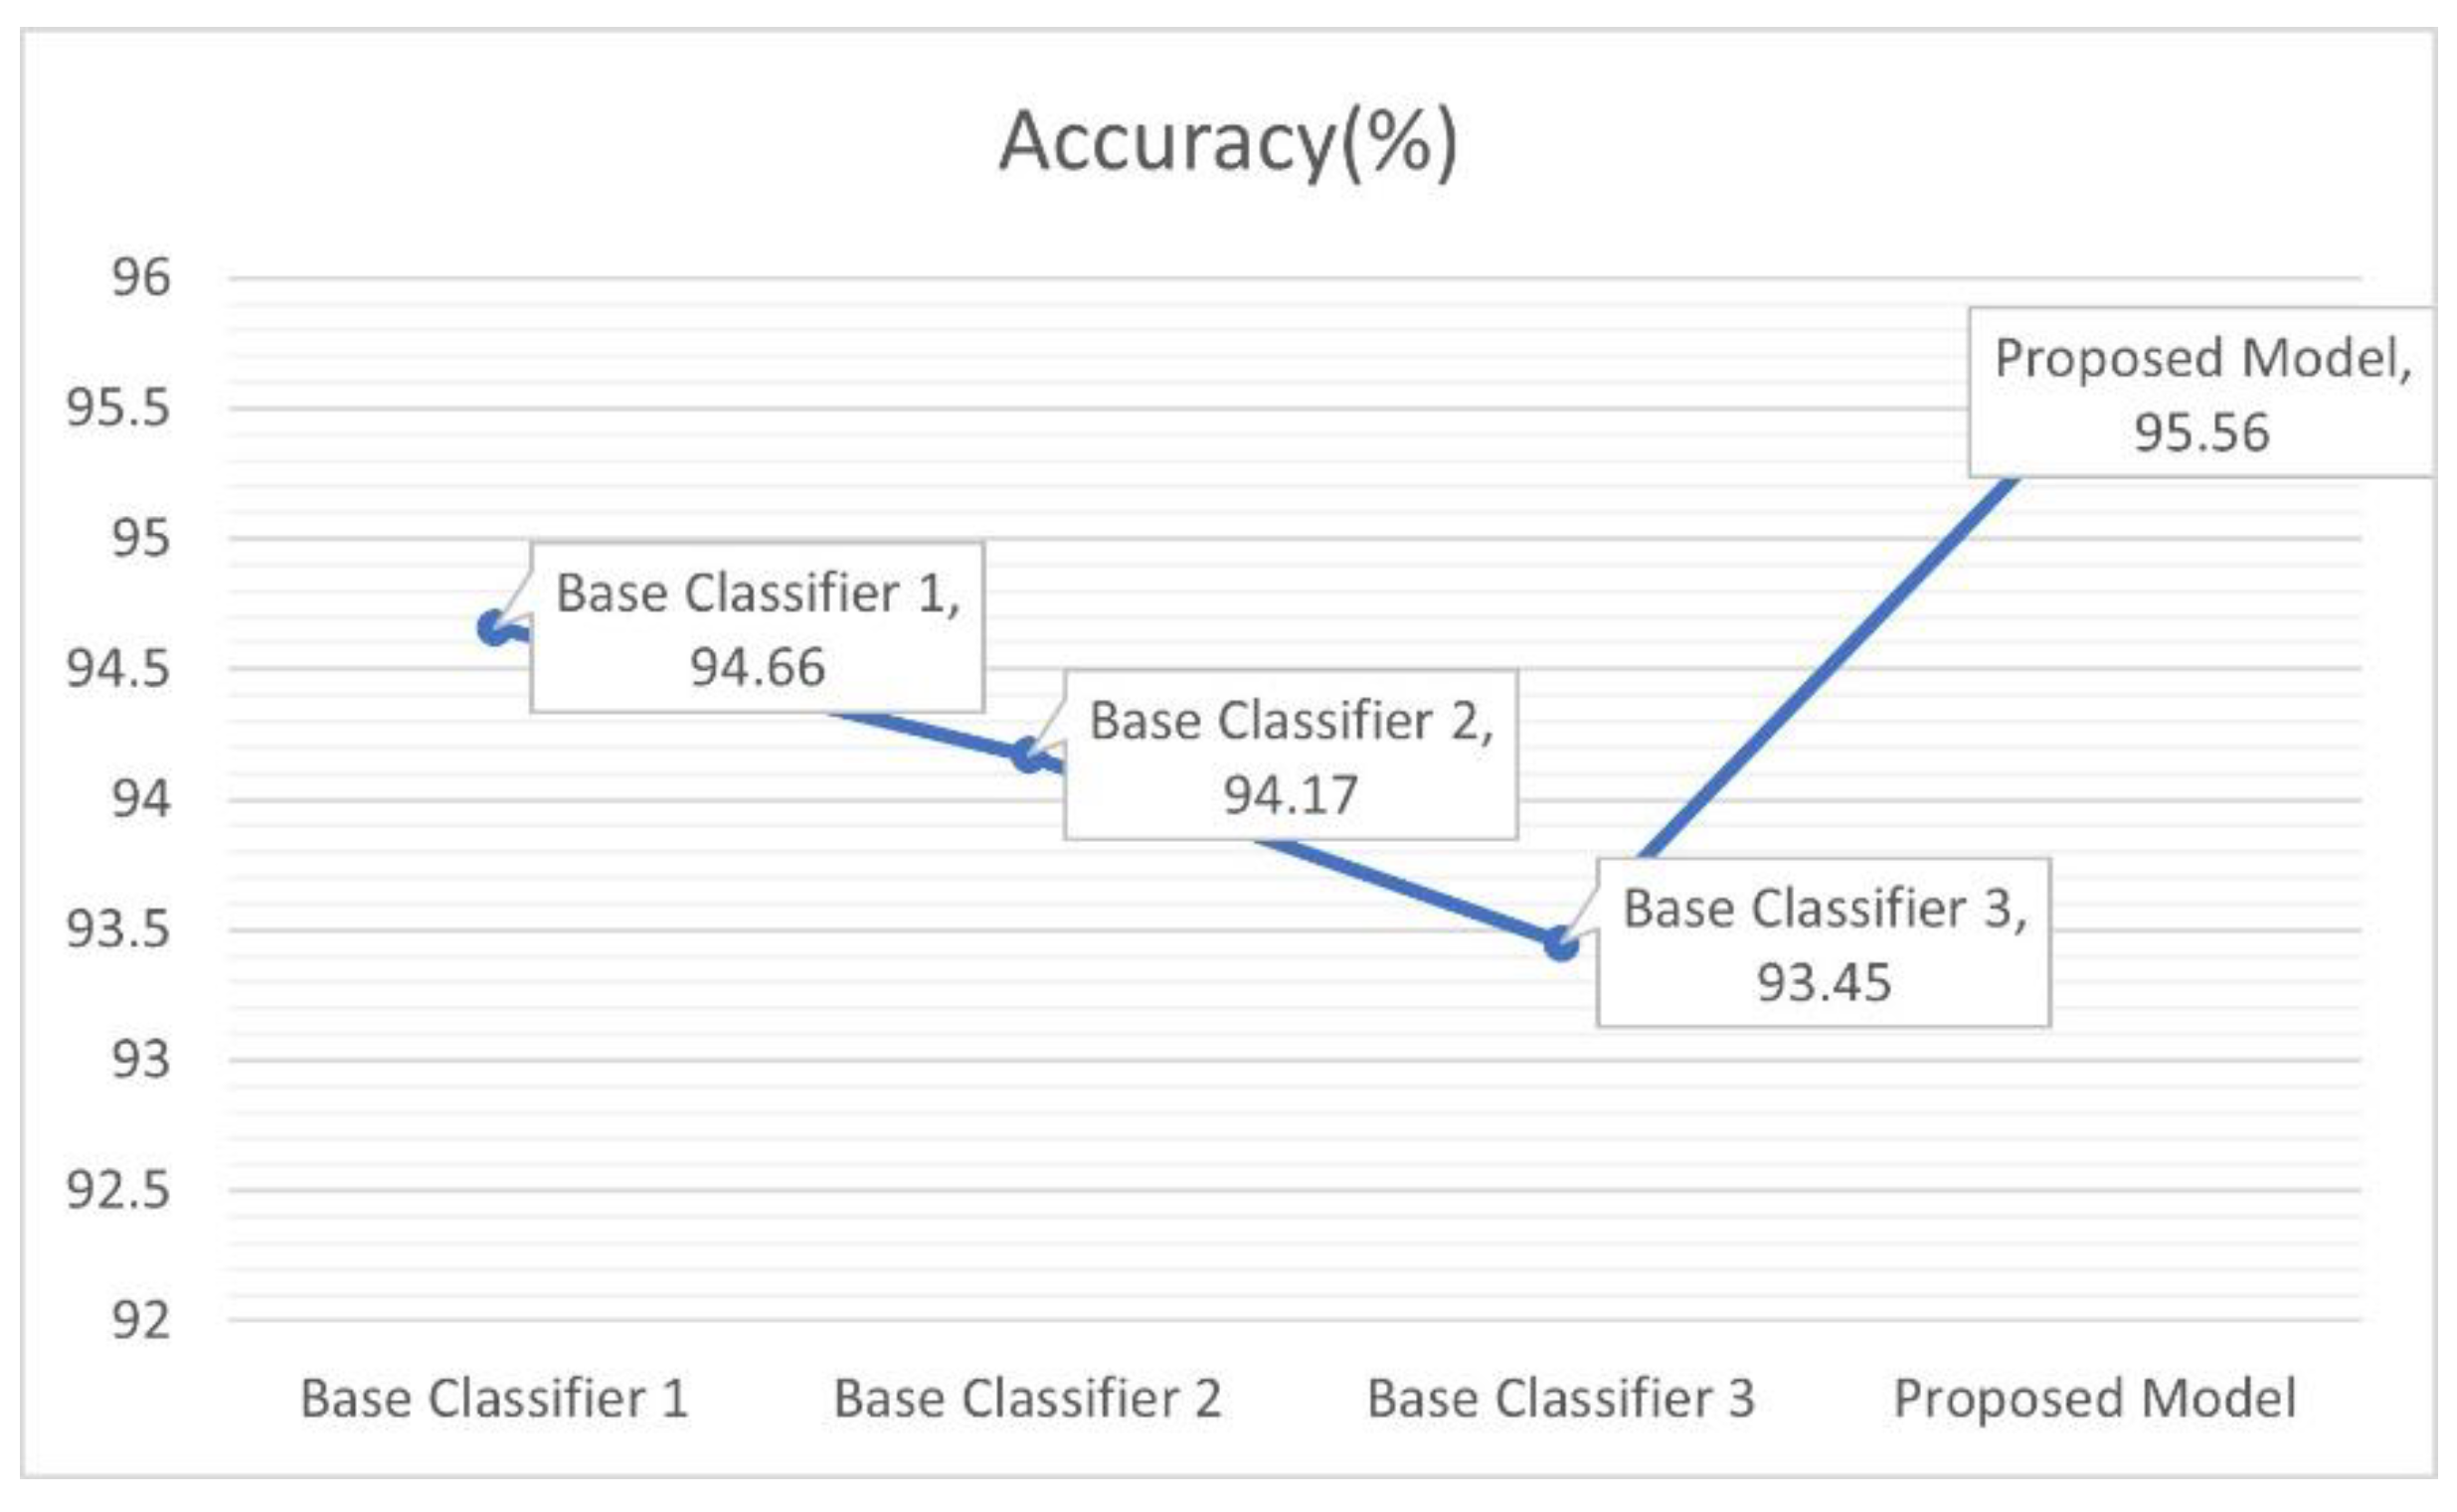
| CNN + CoordAtt + LSTM + New classification header | 94.66 | 94.17 | 93.45 |
| Xception | MobileNetV2 | NASNetMobile | ||
|---|---|---|---|---|
| CoordAtt | w/o * | 94.18 | 91.97 | 92.88 |
| LSTM | w/o | 94.45 | 93.88 | 93.38 |
| New classification header | w/o | 94.27 | 94.03 | 93.15 |
| CoordAtt + LSTM + New classification header | w/ * + w/ + w/ | 94.66 | 94.17 | 93.45 |
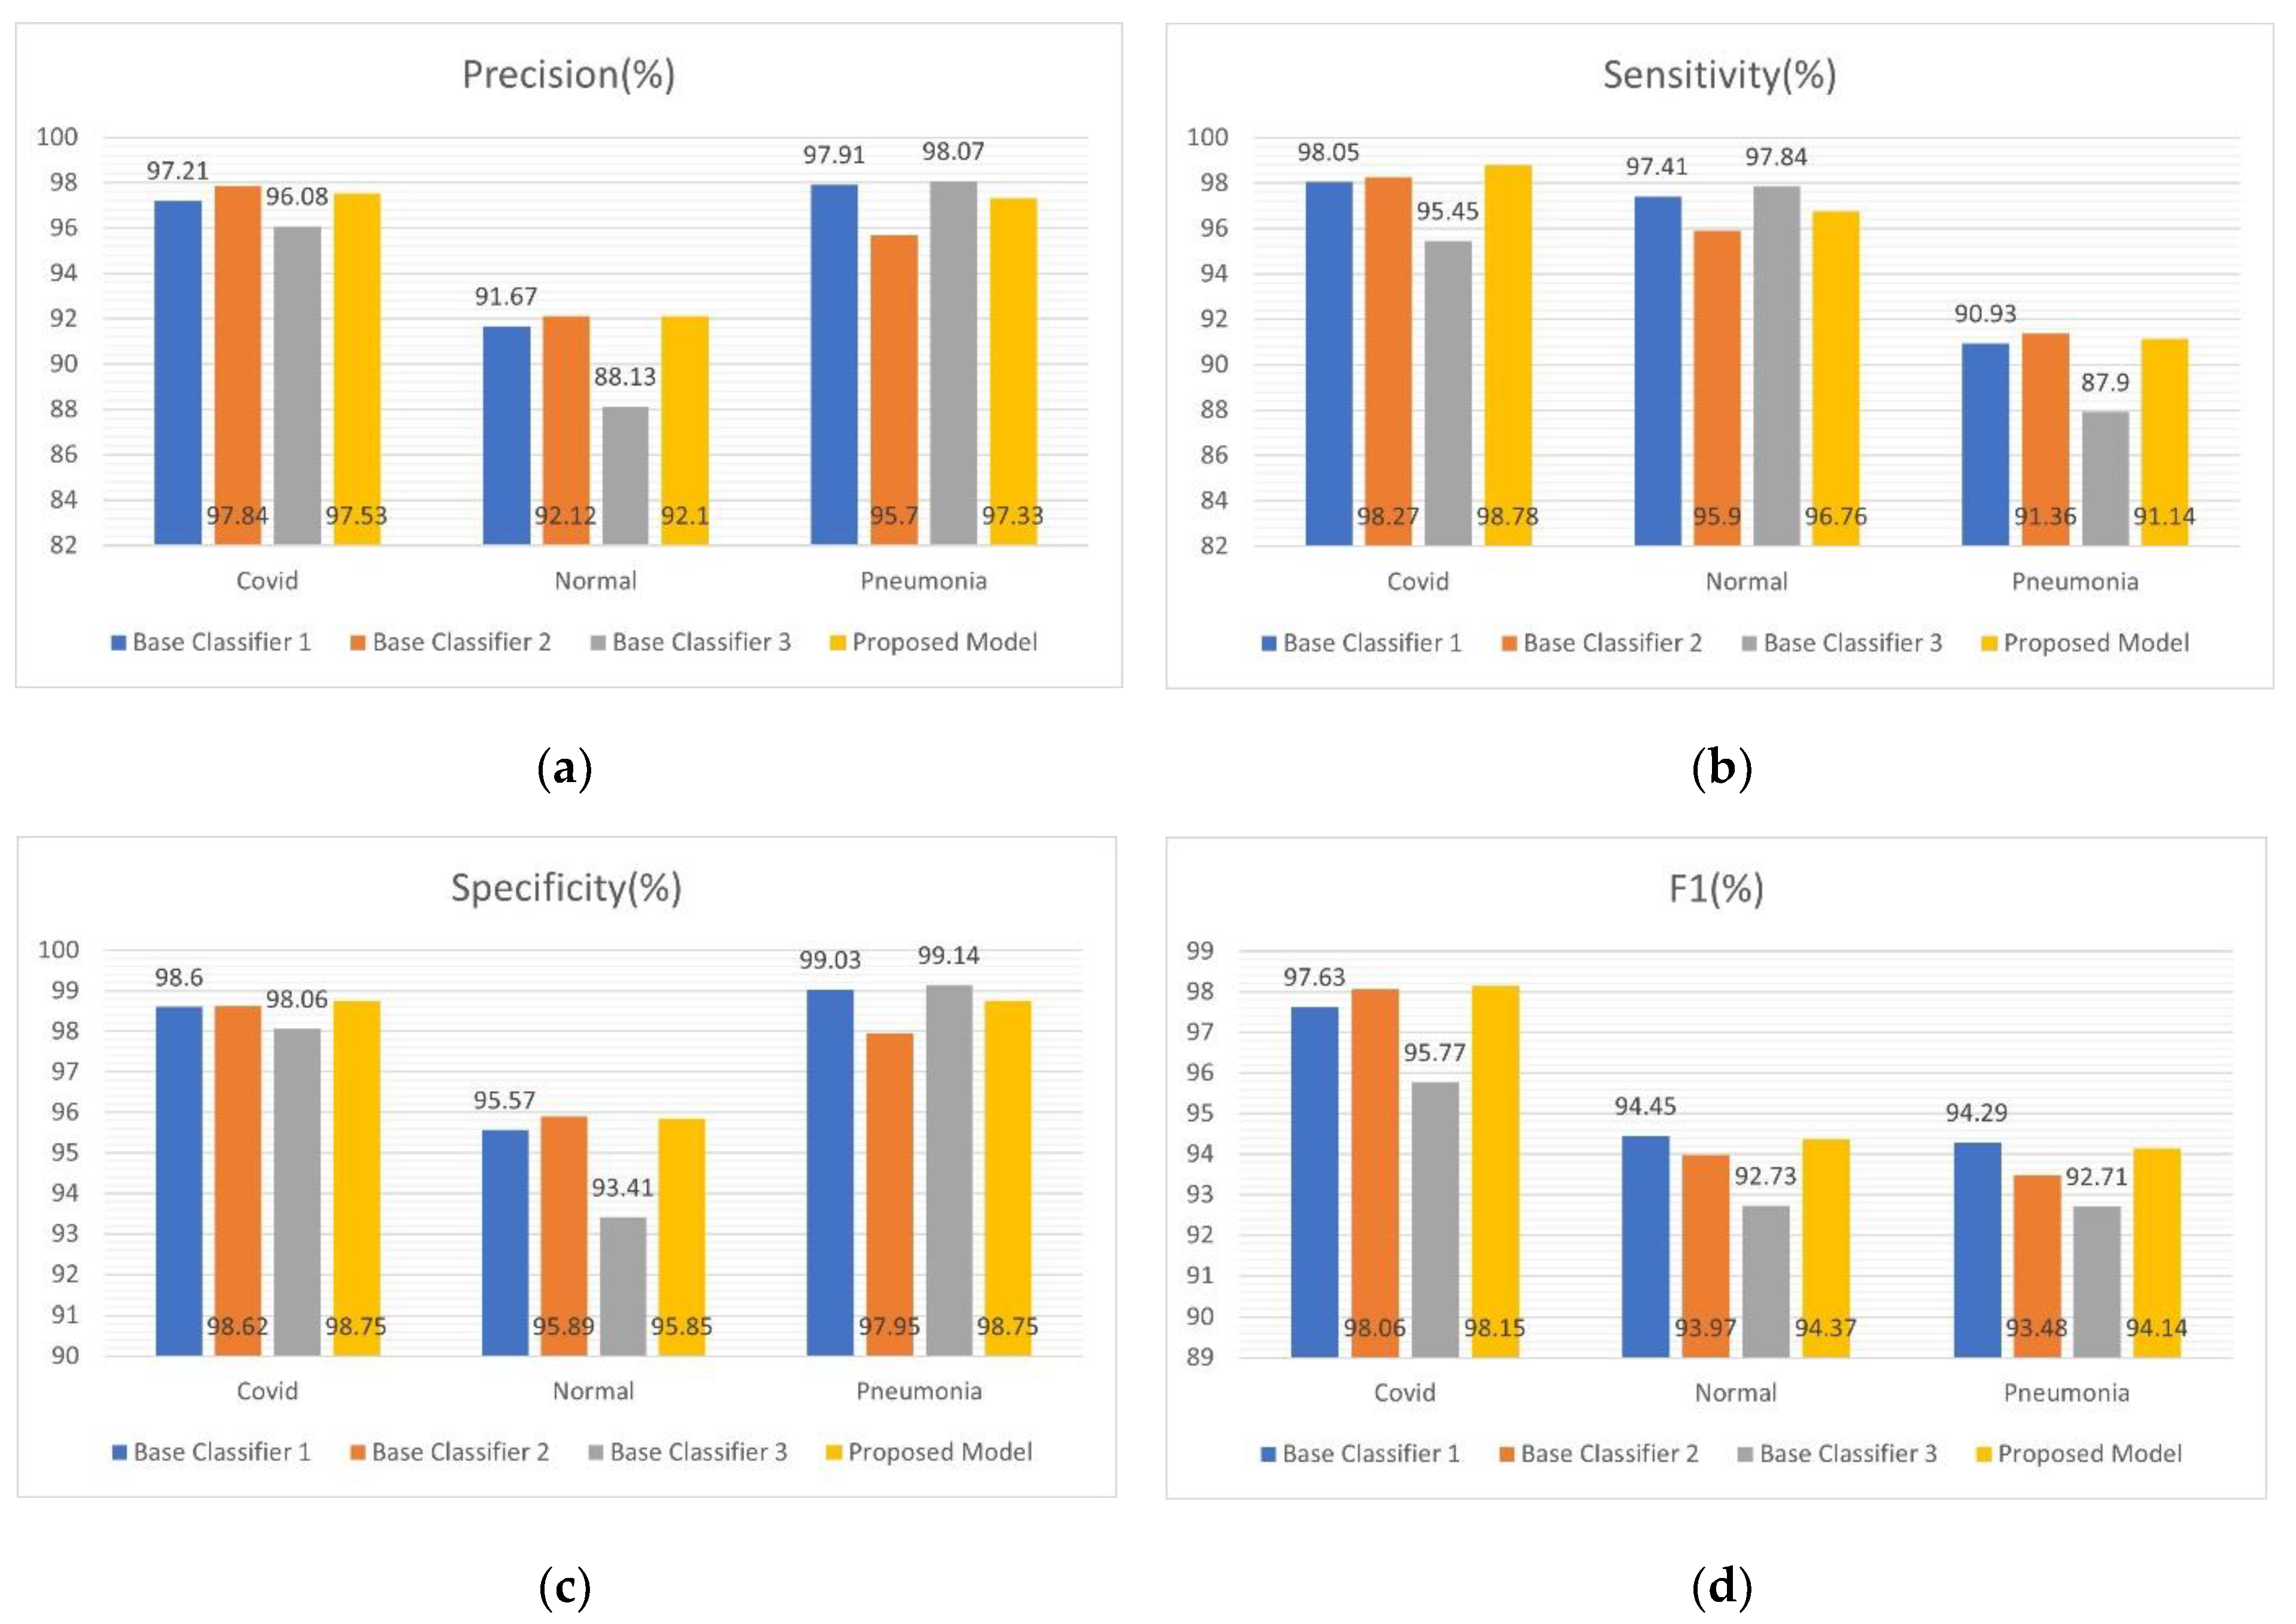
| Class | Metric | Fold | |||||
|---|---|---|---|---|---|---|---|
| 1st Fold | 2nd Fold | 3rd Fold | 4th Fold | 5th Fold | Average | ||
| COVID | Precision | 98.49 | 97.24 | 95.57 | 97.65 | 98.70 | 97.53 |
| Sensitivity | 98.92 | 99.13 | 98.05 | 99.13 | 98.70 | 98.78 | |
| Specificity | 99.24 | 98.60 | 97.73 | 98.81 | 99.35 | 98.75 | |
| F1 | 98.70 | 98.18 | 96.79 | 98.39 | 98.70 | 98.15 | |
| Normal | Precision | 92.68 | 91.84 | 91.58 | 92.42 | 91.99 | 92.10 |
| Sensitivity | 98.49 | 94.82 | 96.33 | 97.41 | 96.76 | 96.76 | |
| Specificity | 96.11 | 95.78 | 95.57 | 96.00 | 95.78 | 95.85 | |
| F1 | 95.50 | 93.30 | 93.89 | 94.85 | 94.32 | 94.37 | |
| Pneumonia | Precision | 98.61 | 95.90 | 97.89 | 98.14 | 96.13 | 97.33 |
| Sensitivity | 92.01 | 90.93 | 90.28 | 91.36 | 91.14 | 91.14 | |
| Specificity | 99.35 | 98.05 | 99.03 | 99.14 | 98.16 | 98.75 | |
| F1 | 95.20 | 93.35 | 93.93 | 94.63 | 93.57 | 94.14 | |
| Accuracy | 96.47 | 94.96 | 94.88 | 95.97 | 95.53 | 95.56 | |
| Class | Metric | Fold | |||||
|---|---|---|---|---|---|---|---|
| 1st Fold | 2nd Fold | 3rd Fold | 4th Fold | 5th Fold | Average | ||
| COVID | Precision | 100 | 98.39 | 100 | 96.83 | 100 | 99.04 |
| Sensitivity | 95.31 | 95.31 | 96.88 | 95.31 | 96.88 | 95.94 | |
| Specificity | 100 | 99.62 | 100 | 99.24 | 100 | 99.77 | |
| F1 | 97.60 | 96.83 | 98.41 | 96.06 | 98.41 | 97.46 | |
| Normal | Precision | 90.53 | 92.31 | 93.62 | 92.55 | 92.55 | 92.31 |
| Sensitivity | 96.63 | 94.38 | 98.88 | 97.75 | 97.75 | 97.08 | |
| Specificity | 96.23 | 97.07 | 97.49 | 97.07 | 97.36 | 97.08 | |
| F1 | 93.48 | 93.33 | 96.17 | 95.08 | 95.08 | 94.63 | |
| Pneumonia_Bacteria | Precision | 88.76 | 86.17 | 92.31 | 85.54 | 93.98 | 89.32 |
| Sensitivity | 87.78 | 90.00 | 80.00 | 78.89 | 86.67 | 84.67 | |
| Specificity | 95.80 | 94.54 | 97.48 | 94.96 | 97.90 | 96.14 | |
| F1 | 88.27 | 88.04 | 85.71 | 82.08 | 90.17 | 86.85 | |
| Pneumonia_Viral | Precision | 87.95 | 88.89 | 81.91 | 79.55 | 86.52 | 84.96 |
| Sensitivity | 85.88 | 84.71 | 90.59 | 82.35 | 90.59 | 86.82 | |
| Specificity | 95.88 | 96.30 | 93.00 | 92.59 | 95.06 | 94.57 | |
| F1 | 86.90 | 86.75 | 86.03 | 80.92 | 88.51 | 85.82 | |
| Accuracy | 91.16 | 90.85 | 91.20 | 90.11 | 92.68 | 91.20 | |
| Class | COVID-Net | CoroNet | COVIDX-LwNet (Ours) | ||||||
|---|---|---|---|---|---|---|---|---|---|
| Prec. (%) * | Sen. (%) | F1 (%) | Prec. (%) | Sen. (%) | F1 (%) | Prec. (%) | Sen. (%) | F1 (%) | |
| COVID | 80 | 100 | 88.8 | 93.17 | 98.25 | 95.61 | 99.04 | 95.94 | 97.46 |
| Normal | 95.1 | 73.9 | 83.17 | 95.25 | 93.5 | 94.3 | 92.31 | 97.08 | 94.63 |
| Pneumonia_Bacteria | 87.1 | 93.1 | 90 | 86.85 | 85.9 | 86.3 | 89.32 | 84.67 | 86.85 |
| Pneumonia_Viral | 67.0 | 81.9 | 73.7 | 84.1 | 82.1 | 83.1 | 84.96 | 86.82 | 85.82 |
| # of Parameters | 116 million | 33 million | 71 million | ||||||
| Accuracy | 83.5% | 89.6% | 91.2% | ||||||
| Vgg16 | Resnet50 | Densenet121 | Base Classifiers 1 | Base Classifiers 2 | Base Classifiers 3 | COVIDx-LWNet | |
|---|---|---|---|---|---|---|---|
| # *of Parameters | 15 million | 24 million | 7 million | 38 million | 16 million | 16 million | 71 million |
| FLOPs | 29 million | 47 million | 14 million | 90 million | 45 million | 47 million | 90 million |
| Vgg16 | Resnet50 | Densenet121 | Base Classifiers 1 | Base Classifiers 2 | Base Classifiers 3 | COVIDx-LWNet | |
|---|---|---|---|---|---|---|---|
| COVID_Sensitivity | 97.72 | 99.25 | 98.23 | 98.97 | 99.16 | 97.25 | 99.03 |
| COVID_specificity | 98.61 | 99.36 | 99.46 | 99.16 | 98.64 | 99.32 | 99.89 |
| Accuracy | 97.24 | 98.56 | 98.01 | 99.01 | 98.78 | 98.28 | 99.15 |
| Vgg16 | Resnet50 | Densenet121 | Base Classifiers 1 | Base Classifiers 2 | Base Classifiers 3 | COVIDx-LWNet | |
|---|---|---|---|---|---|---|---|
| COVID_Sensitivity | 83.15 | 90.54 | 88.69 | 93.29 | 88.59 | 89.42 | 92.65 |
| COVID_specificity | 98.26 | 96.23 | 97.08 | 96.88 | 93.21 | 94.18 | 95.49 |
| Accuracy | 88.78 | 90.89 | 89.25 | 92.71 | 92.49 | 91.08 | 93.21 |
| Vgg16 | Resnet50 | Densenet121 | Base Classifiers 1 | Base Classifiers 2 | Base Classifiers 3 | COVIDx-LWNet | |
|---|---|---|---|---|---|---|---|
| COVID_Sensitivity | 90.26 | 95.46 | 91.56 | 93.69 | 91.84 | 92.56 | 94.14 |
| COVID_specificity | 94.61 | 98.16 | 98.72 | 98.89 | 99.25 | 98.47 | 99.26 |
| Accuracy | 90.79 | 92.03 | 93.14 | 93.21 | 92.4 | 91.73 | 94.86 |
| Vgg16 | Resnet50 | Densenet121 | Base Classifiers 1 | Base Classifiers 2 | Base Classifiers 3 | COVIDx-LWNet | |
|---|---|---|---|---|---|---|---|
| COVID_Sensitivity | 84.64 | 91.26 | 89.54 | 93.46 | 89.69 | 88.65 | 92.56 |
| COVID_specificity | 90.17 | 97.78 | 96.45 | 98.43 | 95.42 | 94.46 | 98.75 |
| Accuracy | 80.47 | 84.89 | 83.53 | 87.26 | 86.94 | 85.6 | 88.65 |
| Year | Author | Classes | Type | Model | Accuracy |
|---|---|---|---|---|---|
| 2020 | Shibly et al. [32] | 2 Class: (COVID: 183, normal: 13,617) | Chest X-ray | R–CNN | 97.36% |
| 2020 | Tulin Ozturk et al. [33] | 3 Class (COVID: 127, normal: 500, pneumonia: 500) | Chest X-ray | DarkCOVIDNet | 87.02% |
| 2021 | Law and Lin. [34] | 3 Class (COVID: 1200, normal: 1341, pneumonia: 1345) | Chest X- ray | VGG-16 | 94% |
| 2021 | Francis Jesmar P. Montalbo [35] | 3 Class (COVID: 1281, normal: 3270, pneumonia: 4657) | Chest X- ray | Fused-DenseNet-Tiny | 97.99% |
| 2022 | Abhijit Bhattacharyya et al. [36] | 3 Class (COVID:342, normal: 341, pneumonia: 347) | Chest X- ray | VGG-19, BRISK and RF | 96.60% |
| 2022 | Anubhav Sharma et al. [18] | 4 Class (COVID: 305, normal: 375, pneumonia_bacterial: 355 pneumonia_viral: 379) | Chest X-ray | COVDC-Net | 90.22% |
| 2022 (ours) | Proposed model | 3 Class (D1) | Chest X-ray | COVIDX-LwNet | 3 class, D1: 95.56% |
| 4 Class (D2) | 4 class, D2: 91.2% | ||||
| 3 Class, 4 Class (D3) | 3 class, D3: 99.15% 4 class, D3: 94.86% |
Publisher’s Note: MDPI stays neutral with regard to jurisdictional claims in published maps and institutional affiliations. |
© 2022 by the authors. Licensee MDPI, Basel, Switzerland. This article is an open access article distributed under the terms and conditions of the Creative Commons Attribution (CC BY) license (https://creativecommons.org/licenses/by/4.0/).
Share and Cite
Wang, W.; Liu, S.; Xu, H.; Deng, L. COVIDX-LwNet: A Lightweight Network Ensemble Model for the Detection of COVID-19 Based on Chest X-ray Images. Sensors 2022, 22, 8578. https://doi.org/10.3390/s22218578
Wang W, Liu S, Xu H, Deng L. COVIDX-LwNet: A Lightweight Network Ensemble Model for the Detection of COVID-19 Based on Chest X-ray Images. Sensors. 2022; 22(21):8578. https://doi.org/10.3390/s22218578
Chicago/Turabian StyleWang, Wei, Shuxian Liu, Huan Xu, and Le Deng. 2022. "COVIDX-LwNet: A Lightweight Network Ensemble Model for the Detection of COVID-19 Based on Chest X-ray Images" Sensors 22, no. 21: 8578. https://doi.org/10.3390/s22218578