
A Generic Pixel Pitch Calibration Method for Fundus Camera via Automated ROI Extraction

 , , ,
, , ,
Abstract
:1. Introduction
2. Materials and Methods
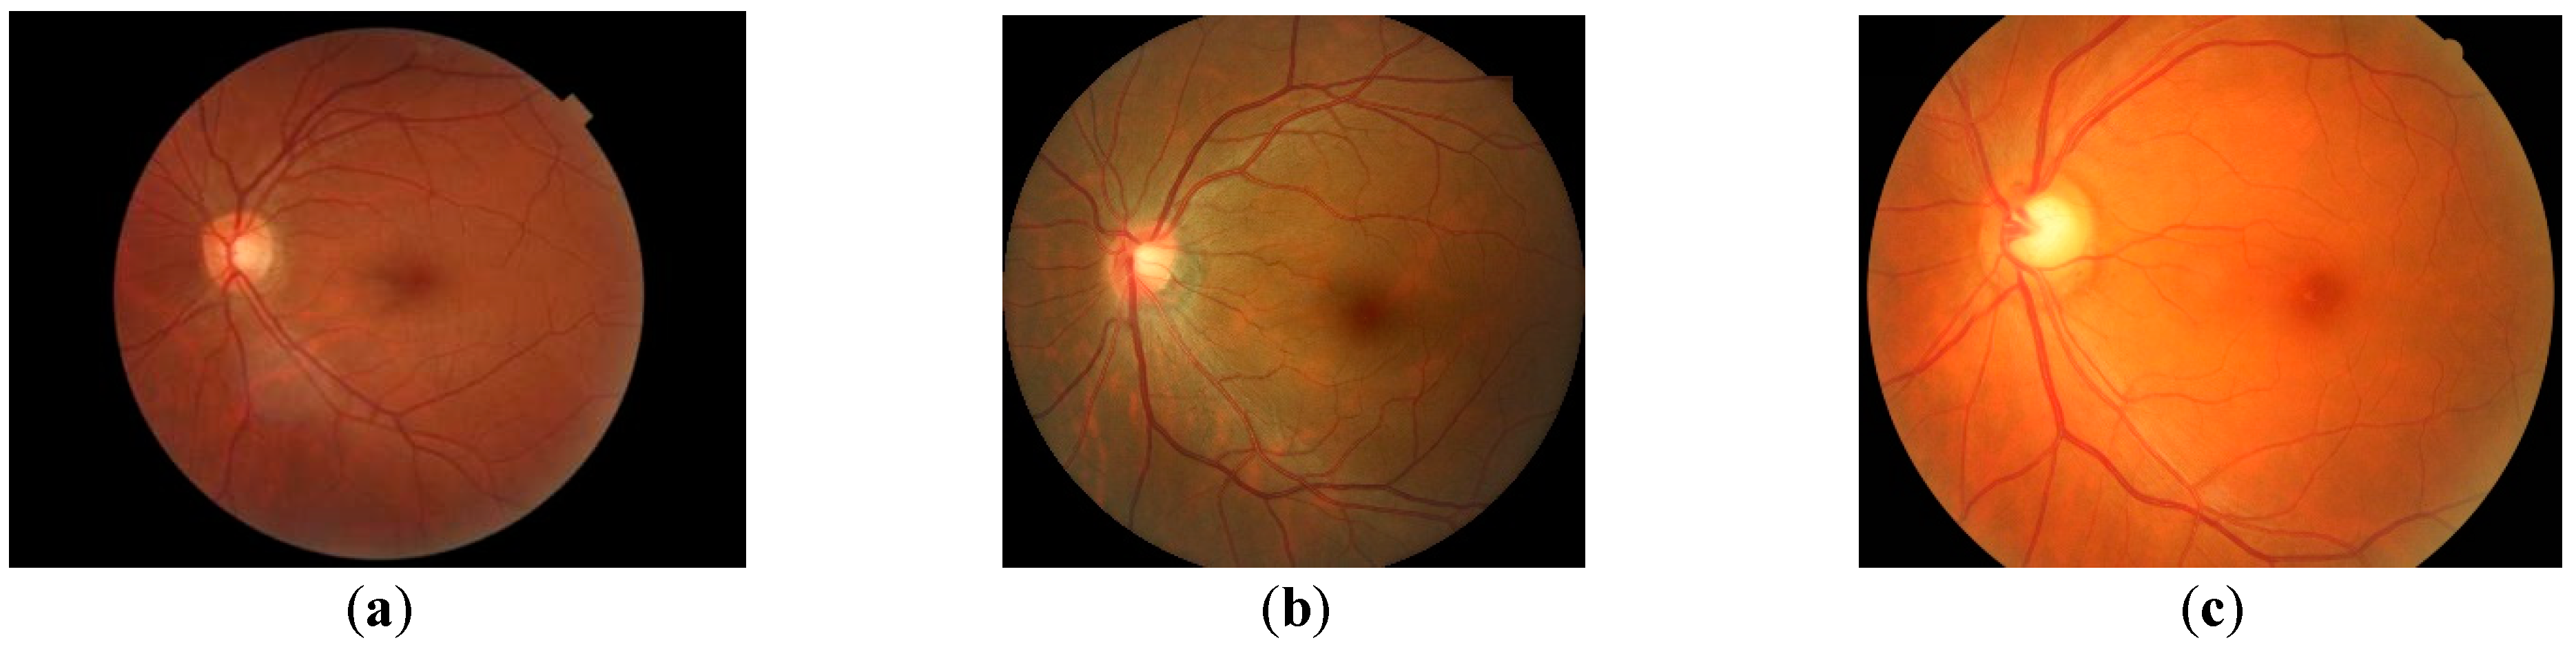
2.1. Dataset Description
2.2. Methodology
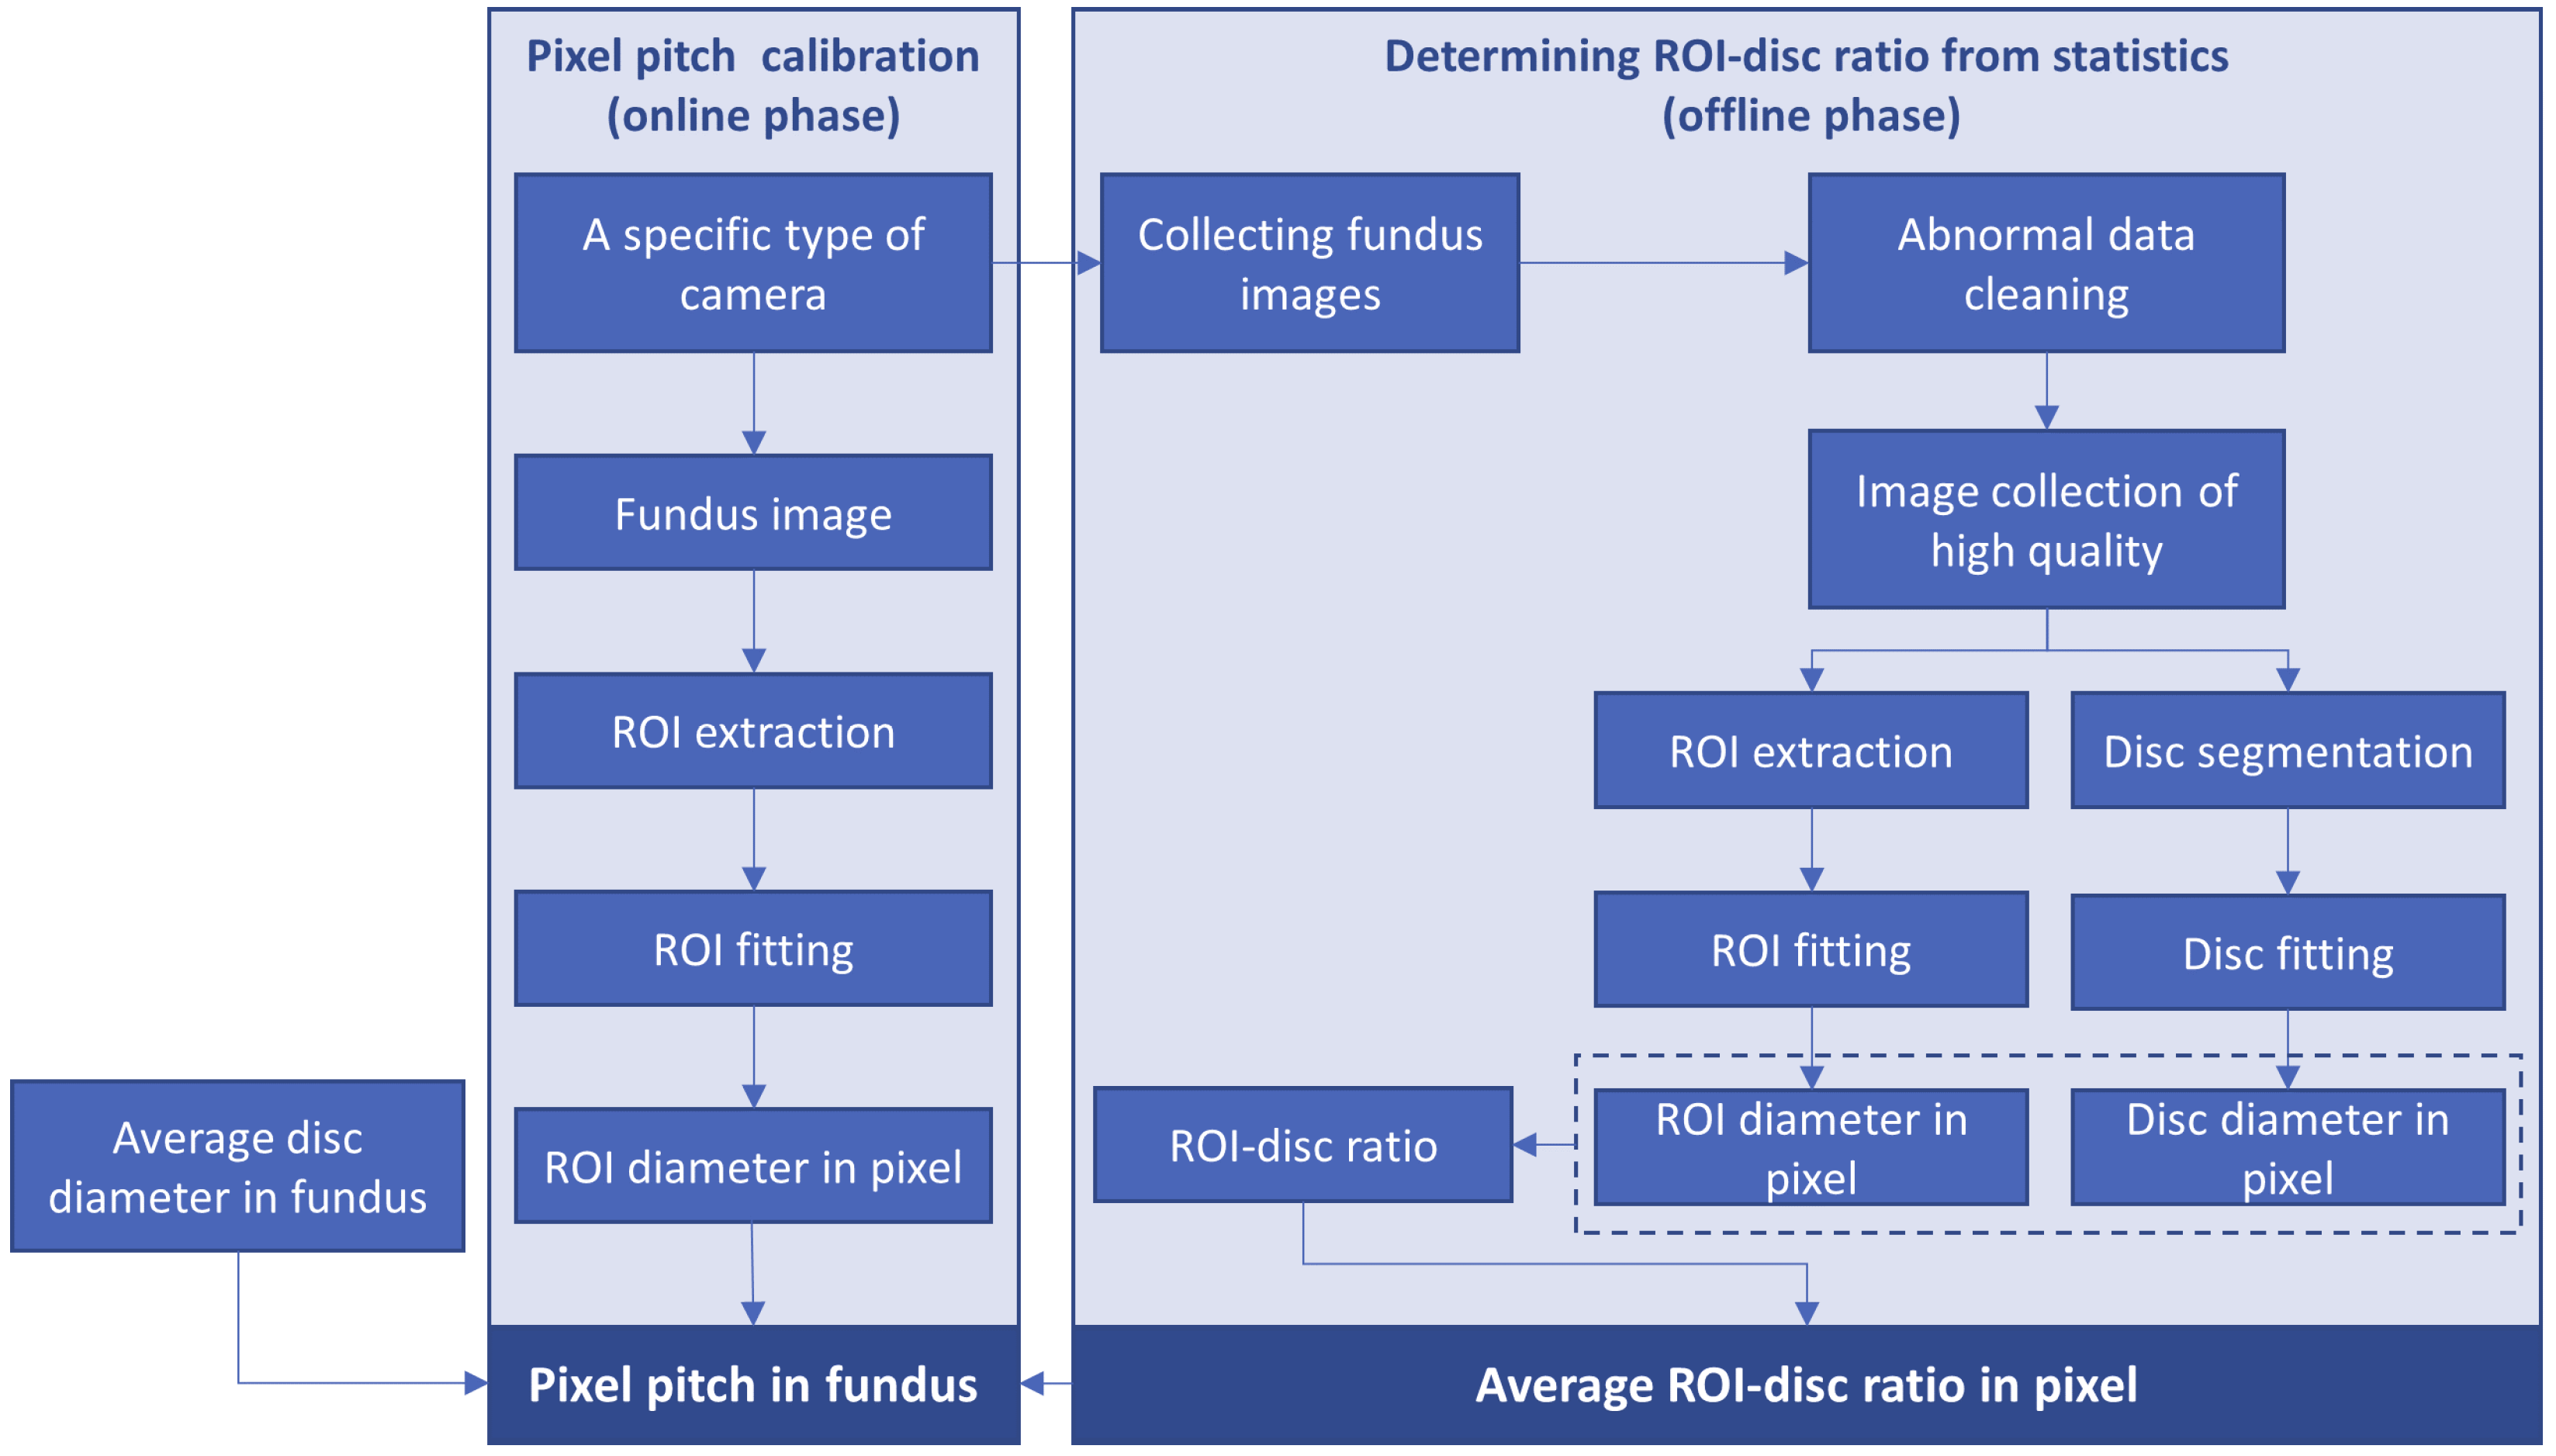
2.2.1. Overall Technical Route
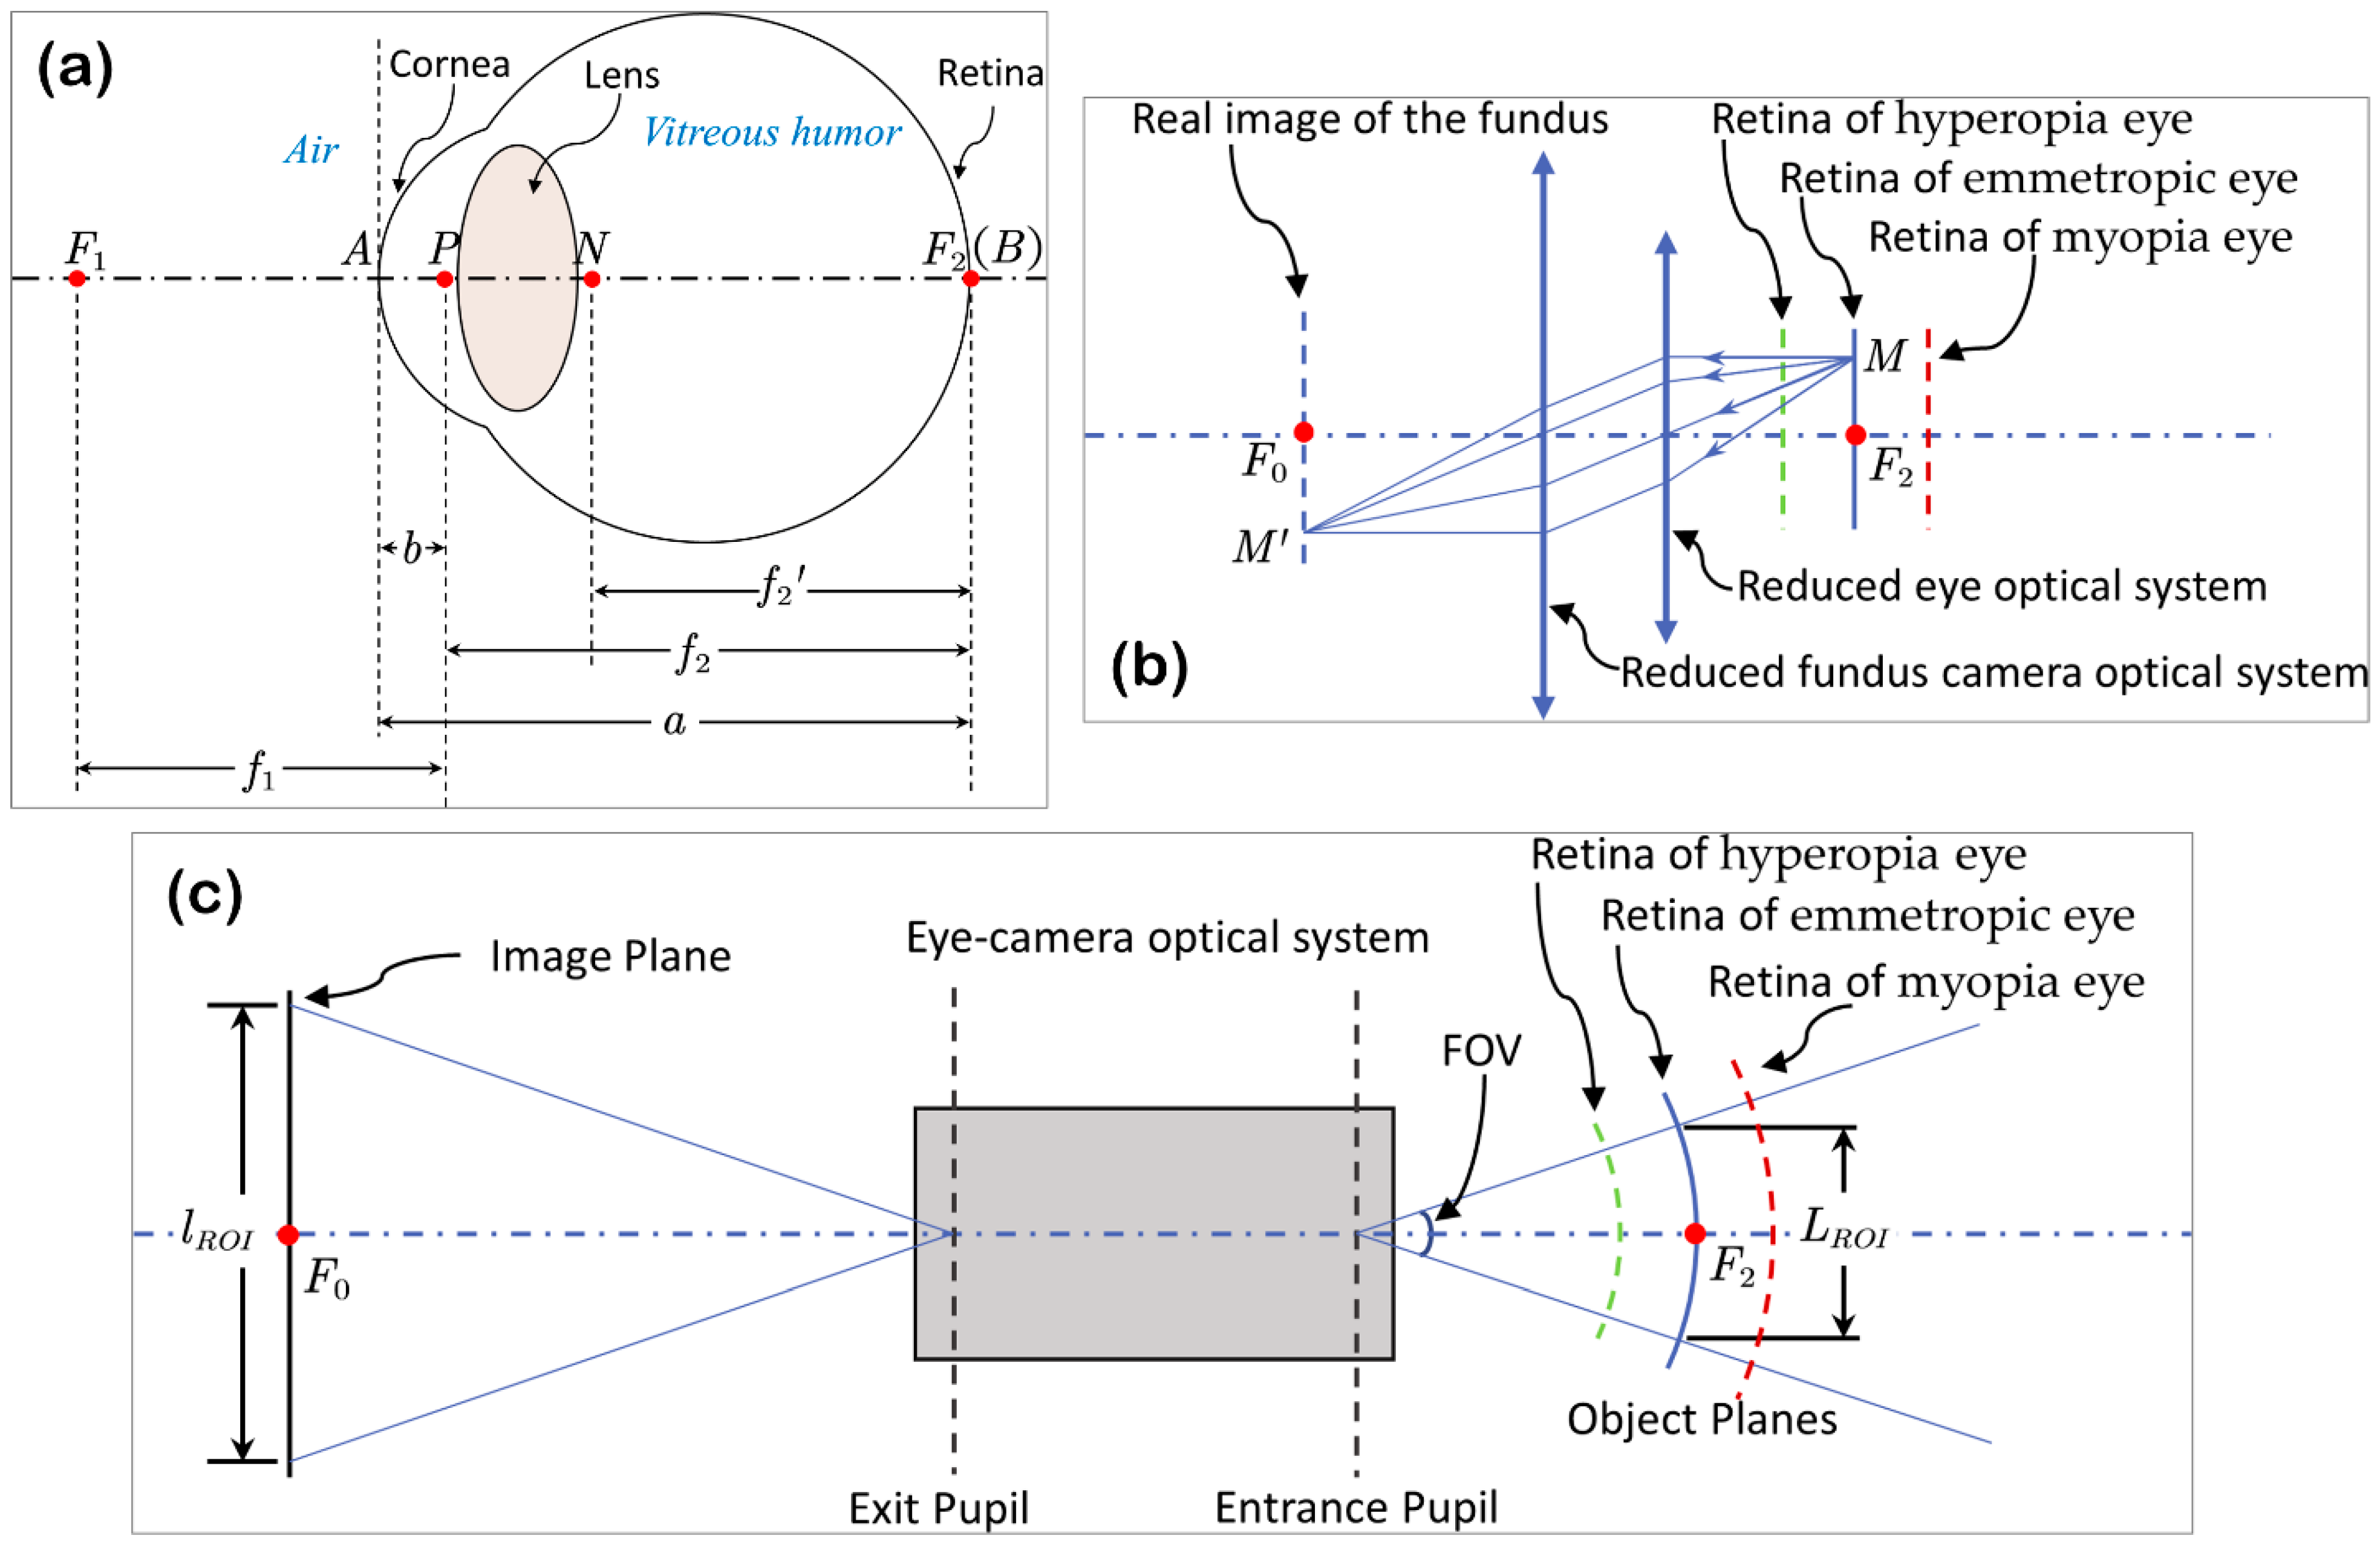
- (1)
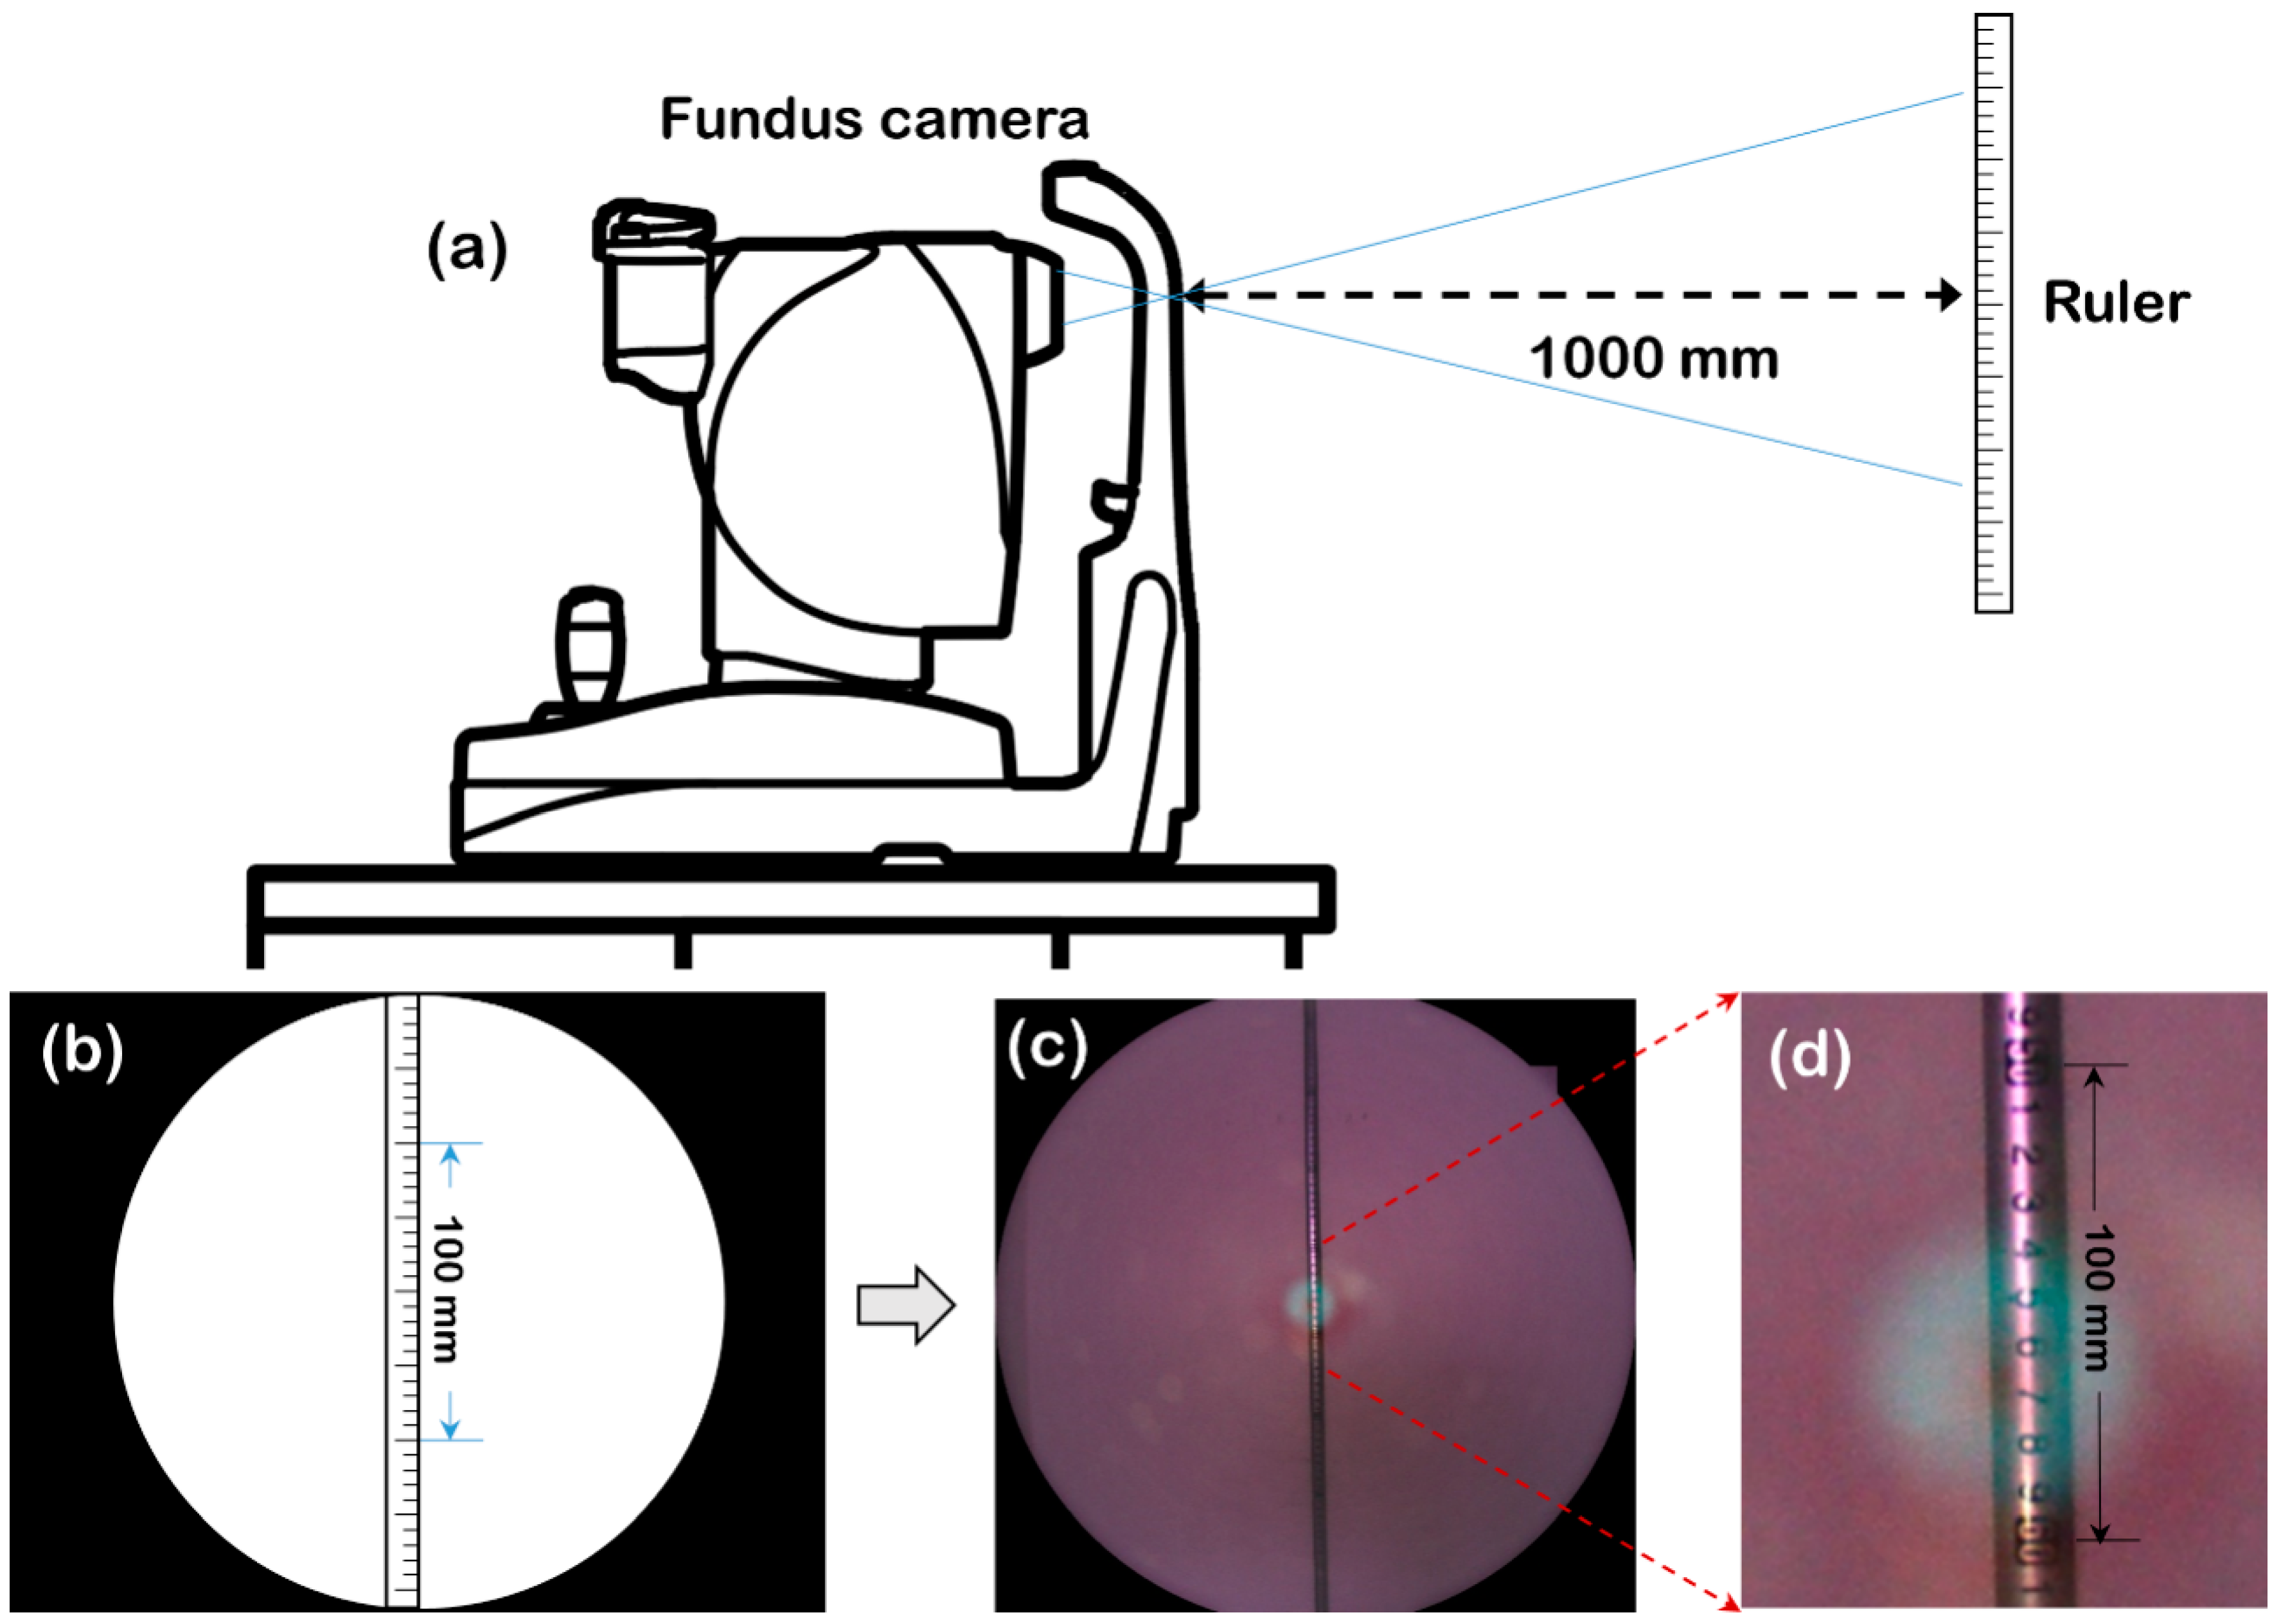
- Theoretical basis
- (2)
- The workflow to estimate the average pixel pitch
- (a)
- The average diameter of the optic disc is stable;
- (b)
- the average axial ametropia of the eye is stable or can be ignored;
- (c)
- the fundus images are captured with the optic disc approximately located at the same region;
- (d)
- the FOV of the camera is constant;
- (e)
- the distortion model of the camera lens is constant.
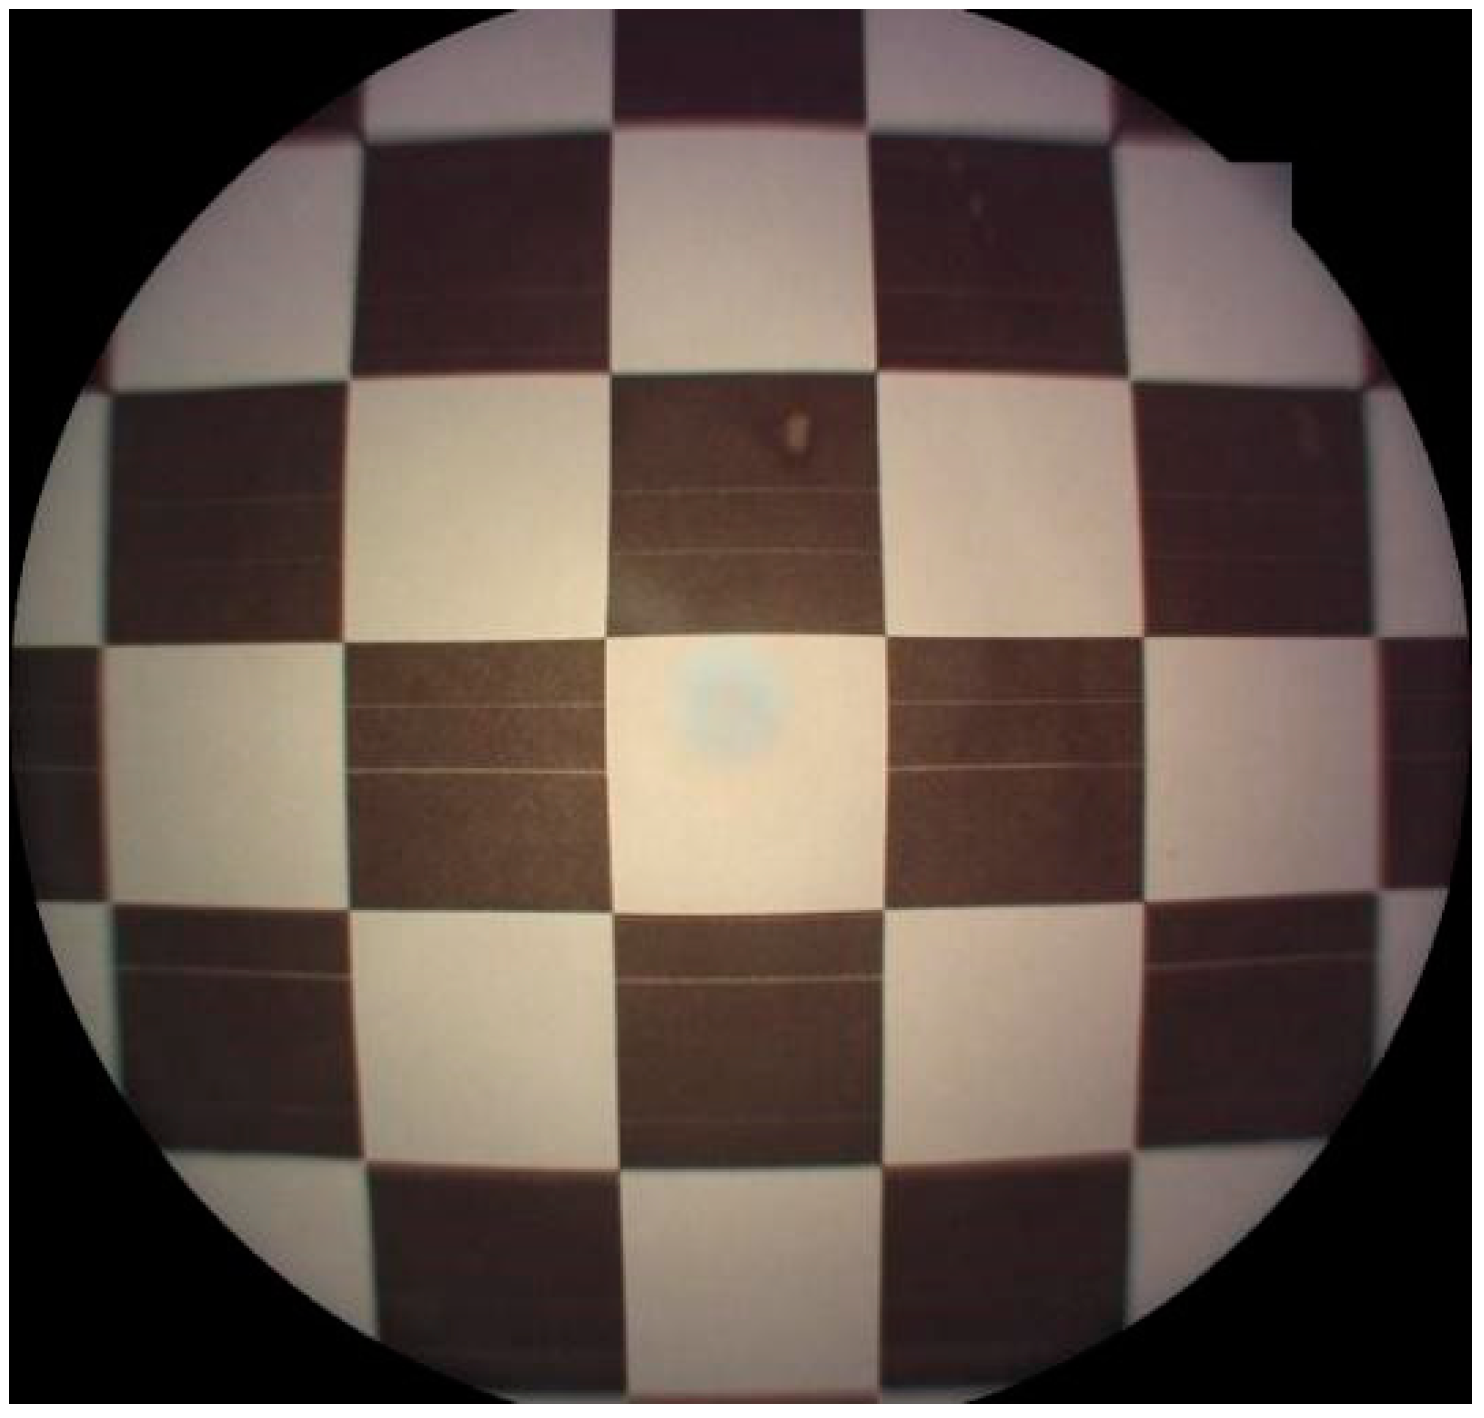
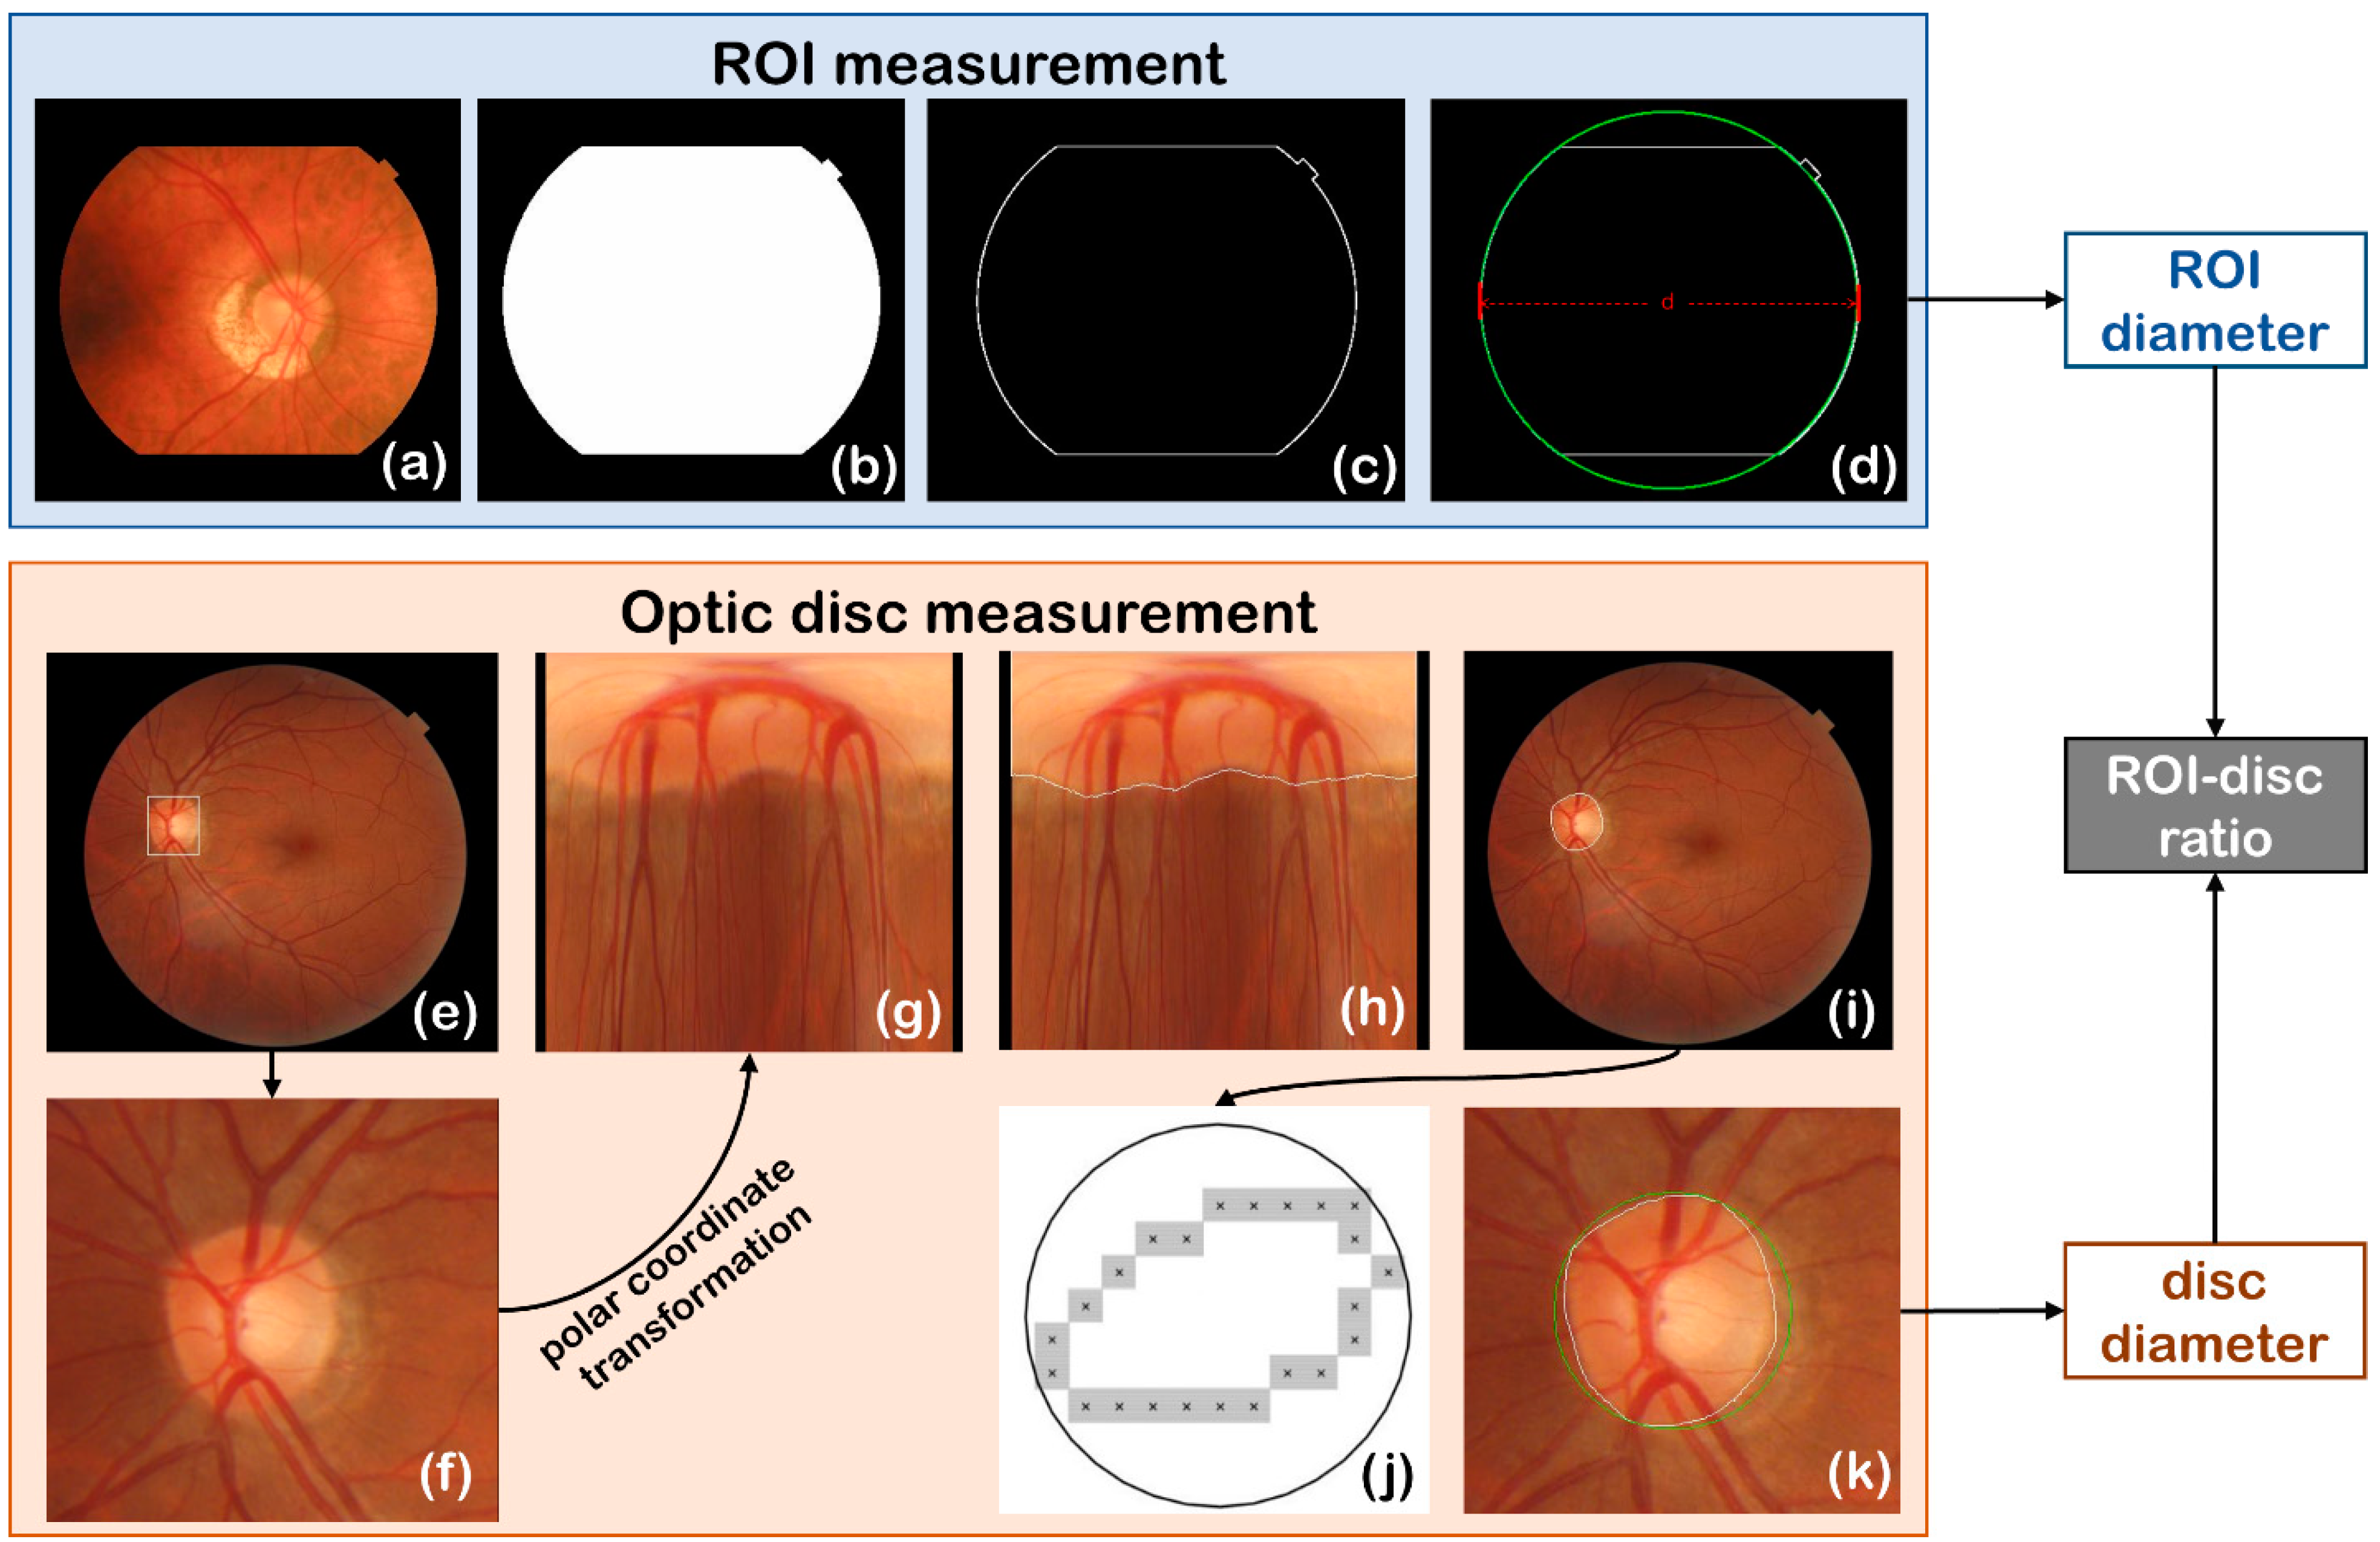
2.2.2. Automated ROI Detection
- (1)
- First, we perform channel separation on the fundus image, select the red channel with the highest brightness as the extraction channel, and use 1/3 of the mean gray value of the red channel as the threshold to binarize the image.
- (2)
- Then, areas of the bright connected-regions in the binary image are measured, and the connected-region with the largest area is the candidate of ROI (Figure 4b).
- (3)
- The Canny operator is used to detect the edge of ROI (Figure 4c).
- (4)
- Finally, the circular Hough transform is performed based on the edge of ROI, and the diameter of the circle with the most votes is the ROI diameter (Figure 4d).
2.2.3. Automated Optic Disc Measurement
- (1)
- Optic disc locating
- (2)
- Edge detection of optic disc
- (3)
- Minimum circumscribed circle fitting of optic disc
2.2.4. Pixel Pitch Calibration
- (1)
- Camera-specified calibration
- (2)
- FOV-specified calibration
2.2.5. Uncertainty Analysis
2.3. Validation
2.3.1. Validation of ROI and Optic Disc Detection
- (1)
- Validation of ROI detection
- (2)
- Validation of optic disc detection
2.3.2. Validation of Diameter Ratio of ROI and Optic Disc
2.3.3. Validation of Distribution of Diopter
2.3.4. Reference Data Based on ISO 10940:2009
3. Results
3.1. Results of ROI and Optic Disc Detection
- (1)
- Accuracy of optic disc and ROI detection
- (2)
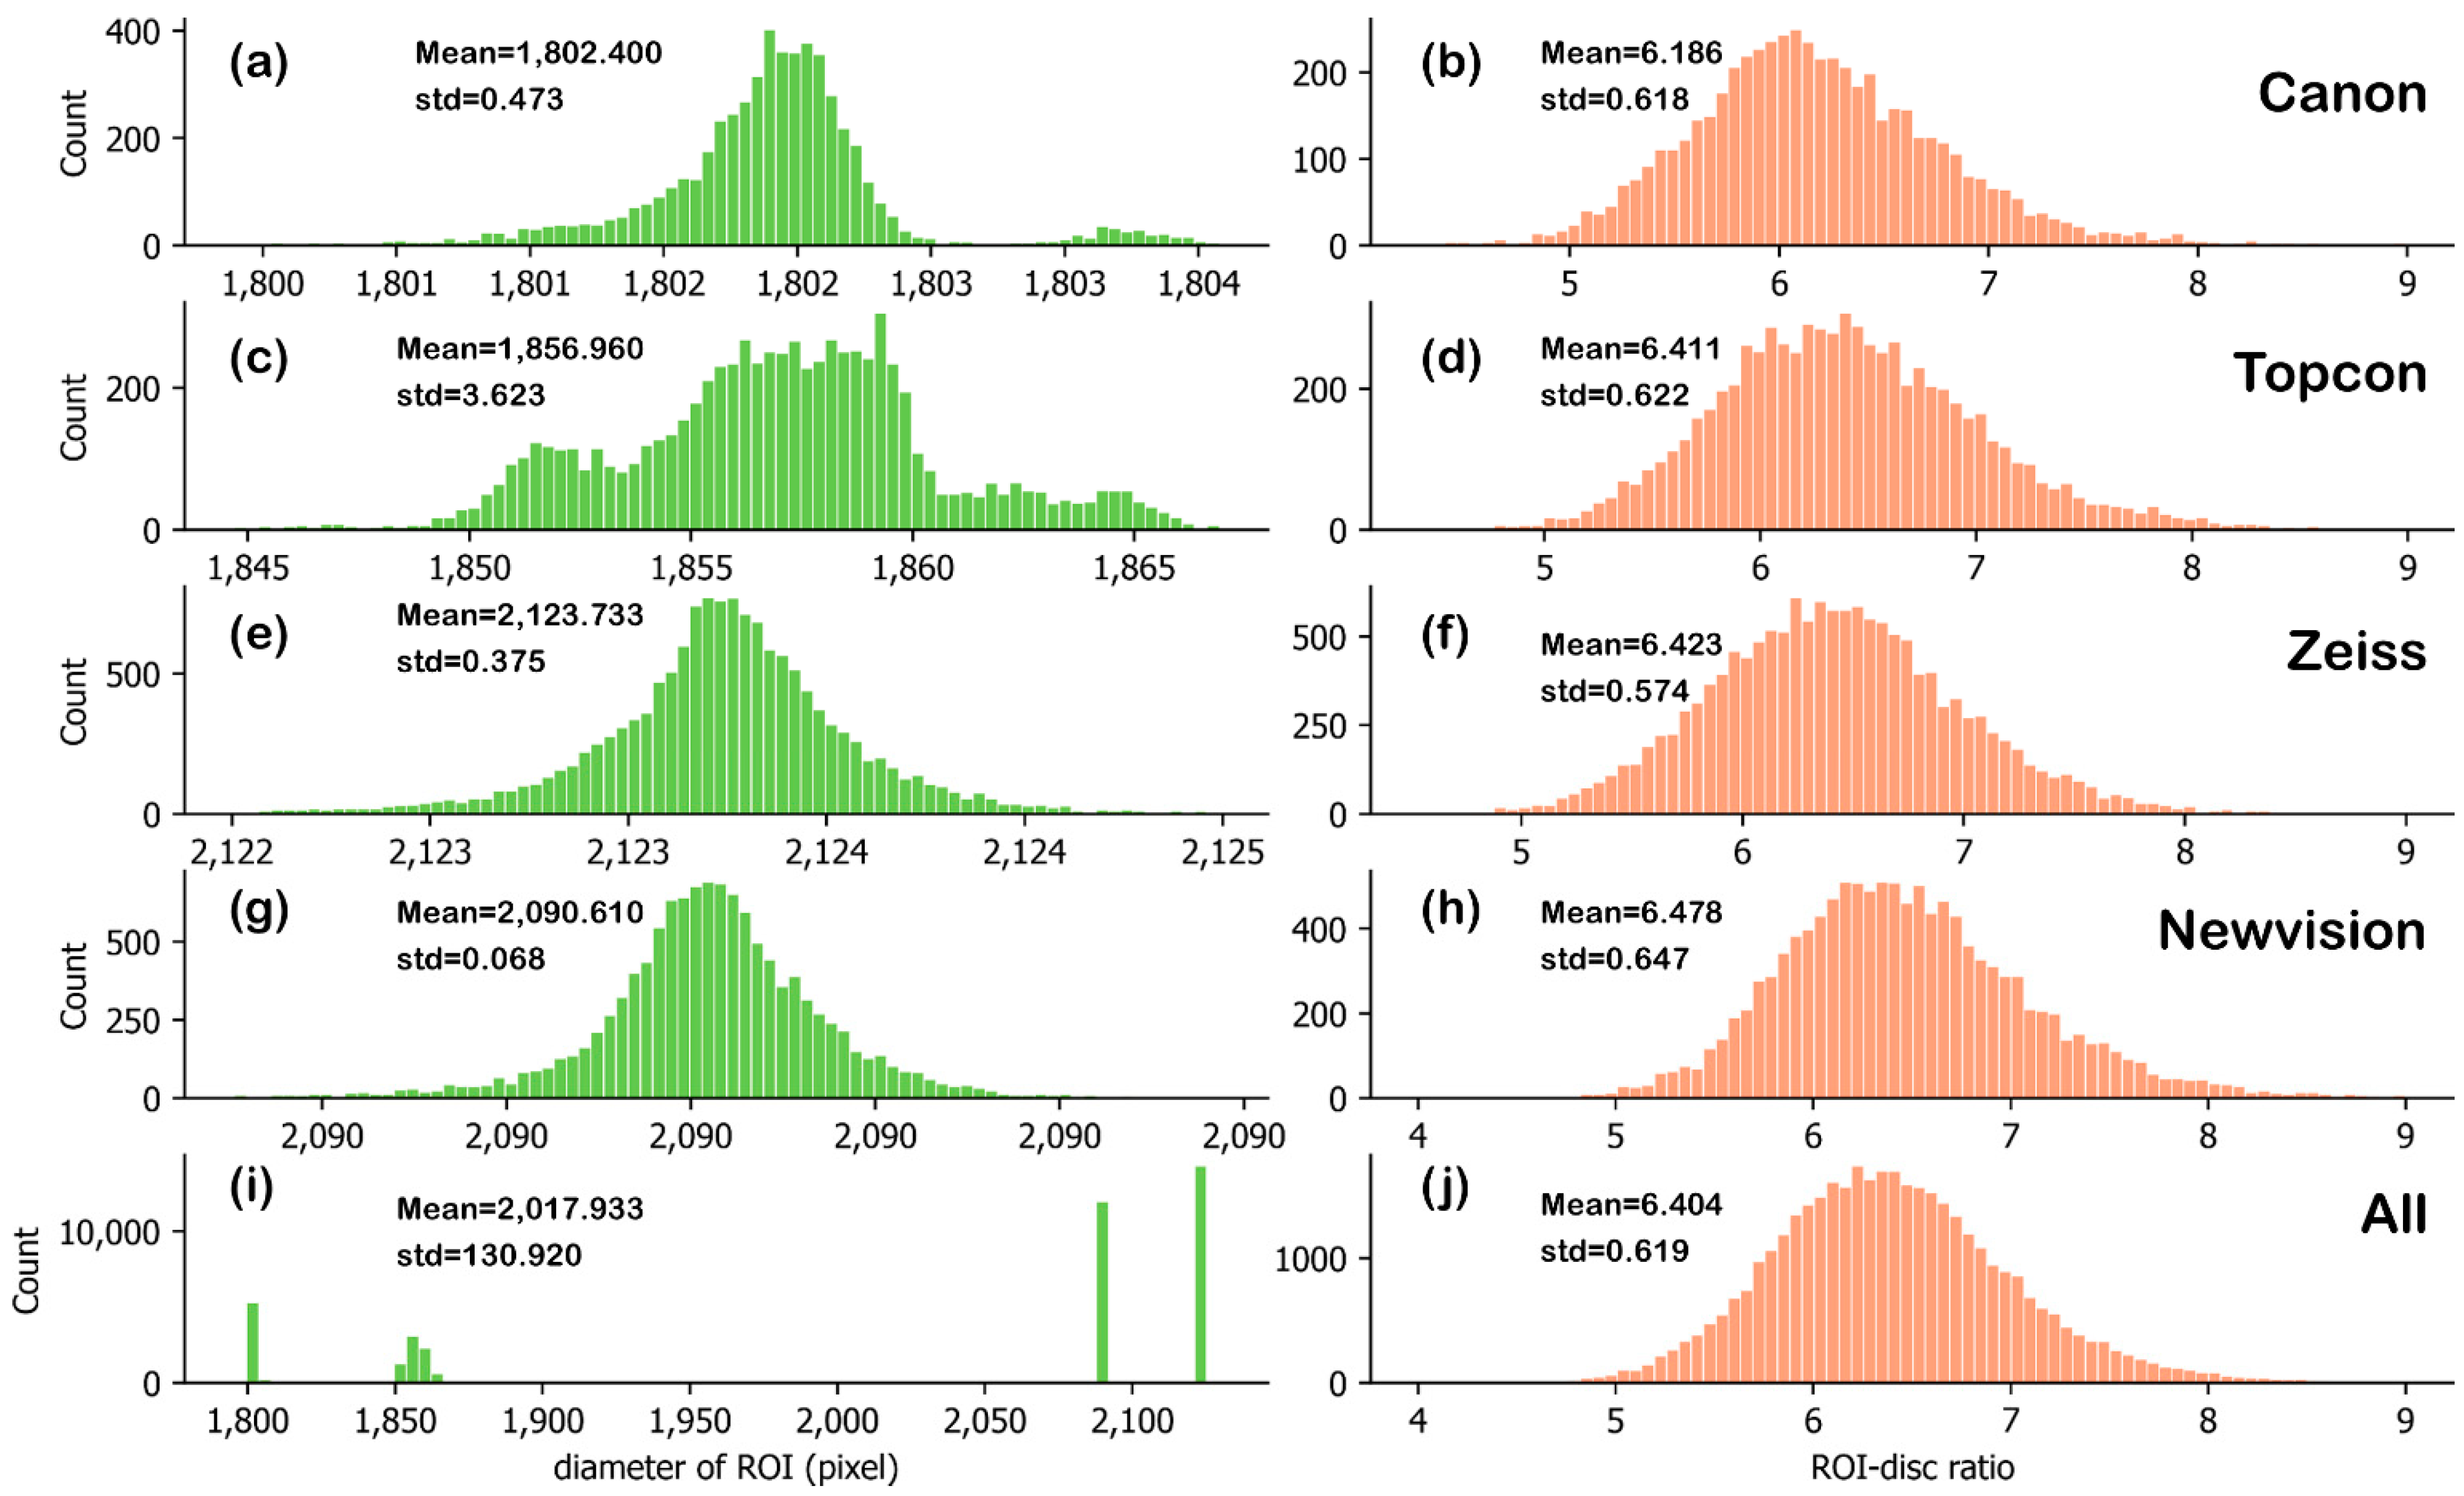
- Stability of ROI diameter measurement
3.2. Statistical Results of Diameter Ratio of ROI and Optic Disc
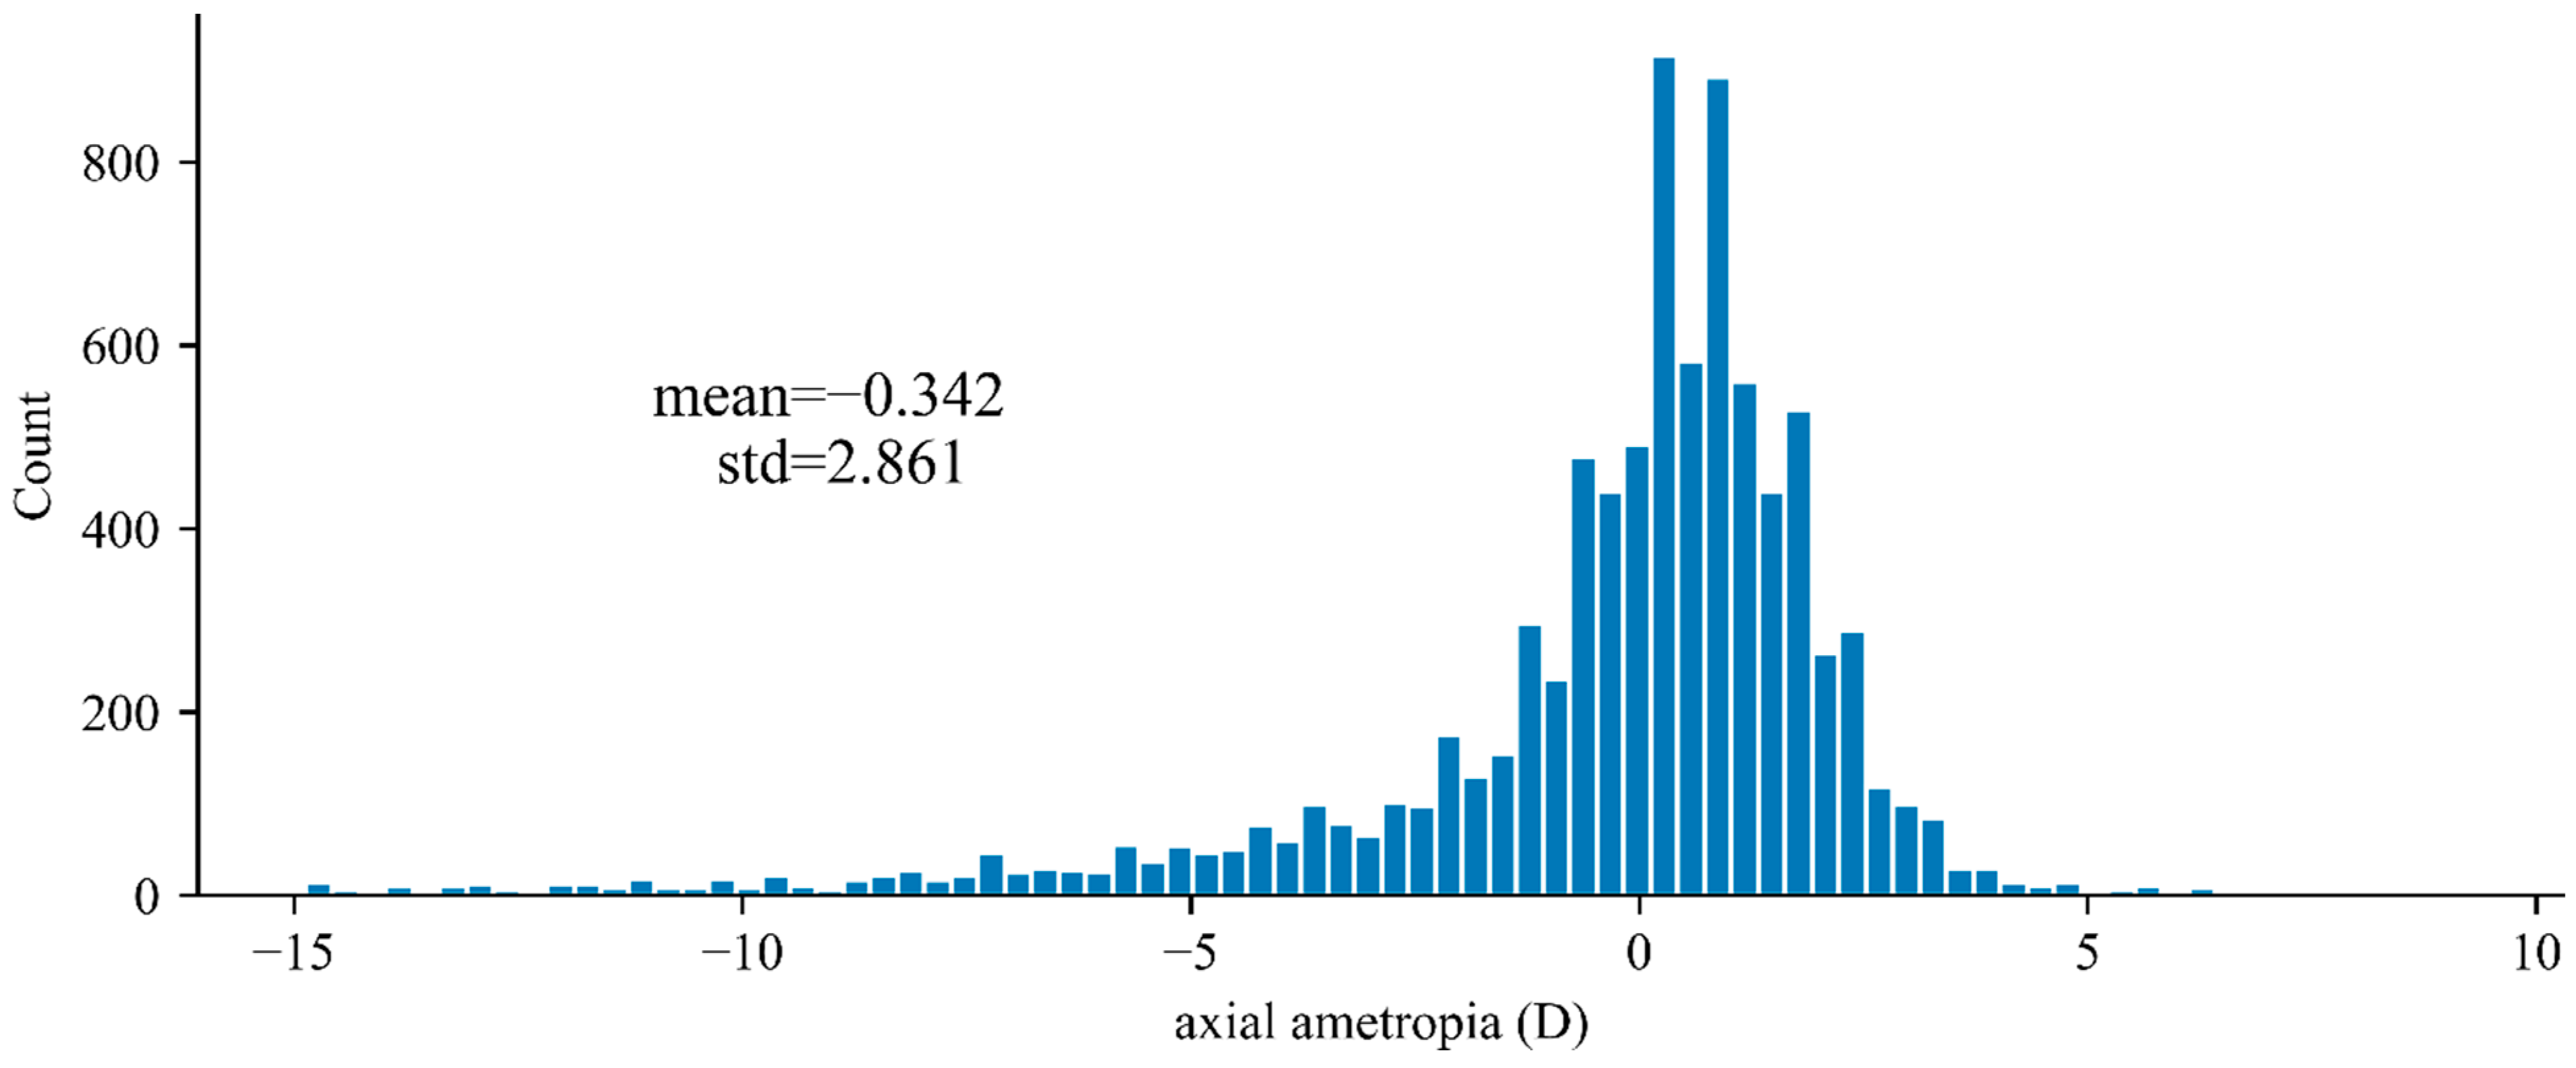
3.3. Statistical Results of Crowd Diopter
3.4. Results of Pixel Pitch Calibration
3.5. An Application of the Proposed Method
4. Discussion
- (1)
- The value of the method for quantitative analysis of fundus images and medicine
- (2)
- The uncertainty of the results
- (3)
- Applicable scenarios for the method
5. Conclusions
Author Contributions
Funding
Informed Consent Statement
Conflicts of Interest
References
- Wagner, S.K.; Fu, D.J.; Faes, L.; Liu, X.; Huemer, J.; Khalid, H.; Ferraz, D.; Korot, E.; Kelly, C.; Balaskas, K.; et al. Insights into Systemic Disease through Retinal Imaging-Based Oculomics. Trans. Vis. Sci. Tech. 2020, 9, 6. [Google Scholar] [CrossRef] [PubMed] [Green Version]
- Ueno, Y.; Iwase, T.; Goto, K.; Tomita, R.; Ra, E.; Yamamoto, K.; Terasaki, H. Association of Changes of Retinal Vessels Diameter with Ocular Blood Flow in Eyes with Diabetic Retinopathy. Sci. Rep. 2021, 11, 4653. [Google Scholar] [CrossRef] [PubMed]
- Yoo, E.; Yoo, C.; Lee, B.; Lee, T.-E.; Kim, Y.Y. Diagnostic Ability of Retinal Vessel Diameter Measurements in Open-Angle Glaucoma. Investig. Ophthalmol. Vis. Sci. 2015, 56, 7915. [Google Scholar] [CrossRef] [PubMed] [Green Version]
- Cheung, C.Y.; Thomas, G.N.; Tay, W.; Ikram, M.K.; Hsu, W.; Lee, M.L.; Lau, Q.P.; Wong, T.Y. Retinal Vascular Fractal Dimension and Its Relationship with Cardiovascular and Ocular Risk Factors. Am. J. Ophthalmol. 2012, 154, 663–674.e1. [Google Scholar] [CrossRef]
- Liu, R.; Jian, W.; Zhao, Y.; Lu, X.; Wu, Y.; Duan, J. Retinal Oxygen Saturation and Vessel Diameter in Patients with Chronic Kidney Disease. Acta Ophthalmol. 2021, 99, e352–e359. [Google Scholar] [CrossRef]
- Poostchi, A.; Wong, T.; Chan, K.C.Y.; Kedzlie, L.; Sachdev, N.; Nicholas, S.; Garway-Heath, D.F.; Wells, A.P. Optic Disc Diameter Increases during Acute Elevations of Intraocular Pressure. Investig. Ophthalmol. Vis. Sci. 2010, 51, 2313. [Google Scholar] [CrossRef] [Green Version]
- do VF Ramos, C.; Bellusci, C.; Savini, G.; Carbonelli, M.; Berezovsky, A.; Tamaki, C.; Cinoto, R.; Sacai, P.Y.; Moraes-Filho, M.N.; Miura, H.M.P.P.; et al. Association of Optic Disc Size with Development and Prognosis of Leber’s Hereditary Optic Neuropathy. Investig. Ophthalmol. Vis. Sci. 2009, 50, 1666. [Google Scholar] [CrossRef]
- Sahin Ediz, S.; Atalay, B.; Aydin Canturk, I.; Kabaalioglu, A. Assessment of the Optic Nerve, Optic Disc, and Perineural Area Using Shear-wave Elastography in Patients with Multiple Sclerosis. Int. J. Clin. Pract. 2021, 75, e14736. [Google Scholar] [CrossRef]
- Cetin, E.N.; Bir, L.S.; Sarac, G.; Yaldızkaya, F.; Yaylalı, V. Optic Disc and Retinal Nerve Fibre Layer Changes in Parkinson’s Disease. Neuro-Ophthalmol. 2013, 37, 20–23. [Google Scholar] [CrossRef] [Green Version]
- Shibata, N.; Tanito, M.; Mitsuhashi, K.; Fujino, Y.; Matsuura, M.; Murata, H.; Asaoka, R. Development of a Deep Residual Learning Algorithm to Screen for Glaucoma from Fundus Photography. Sci. Rep. 2018, 8, 14665. [Google Scholar] [CrossRef]
- Li, B.; Chen, H.; Zhang, B.; Yuan, M.; Jin, X.; Lei, B.; Xu, J.; Gu, W.; Wong, D.C.S.; He, X.; et al. Development and Evaluation of a Deep Learning Model for the Detection of Multiple Fundus Diseases Based on Colour Fundus Photography. Br. J. Ophthalmol. 2021, 106, 1079–1086. [Google Scholar] [CrossRef] [PubMed]
- Nittala, M.G.; Hariri, A.; Wong, W.T.; Chew, E.Y.; Ferris, F.L.; Sadda, S.R. Image Scaling Difference Between a Confocal Scanning Laser Ophthalmoscope and a Flash Fundus Camera. Ophthalmic Surg. Lasers Imaging Retin. 2015, 46, 872–879. [Google Scholar] [CrossRef] [PubMed]
- Chen, A.; Dang, S.; Chung, M.M.; Ramchandran, R.S.; Bessette, A.P.; DiLoreto, D.A.; Kleinman, D.M.; Sridhar, J.; Wykoff, C.C.; Kuriyan, A.E. Quantitative Comparison of Fundus Images by 2 Ultra-Widefield Fundus Cameras. Ophthalmol. Retin. 2021, 5, 450–457. [Google Scholar] [CrossRef] [PubMed]
- Zhao, J.; Hu, X.; Zou, J.; Hu, X. Geometric Parameters Estimation and Calibration in Cone-Beam Micro-CT. Sensors 2015, 15, 22811–22825. [Google Scholar] [CrossRef] [Green Version]
- Wang, K.; Liu, C.; Shen, S. Geometric Calibration for Cameras with Inconsistent Imaging Capabilities. Sensors 2022, 22, 2739. [Google Scholar] [CrossRef]
- Welfer, D.; Scharcanski, J.; Kitamura, C.M.; Dal Pizzol, M.M.; Ludwig, L.W.B.; Marinho, D.R. Segmentation of the Optic Disk in Color Eye Fundus Images Using an Adaptive Morphological Approach. Comput. Biol. Med. 2010, 40, 124–137. [Google Scholar] [CrossRef]
- Romero-Oraá, R.; García, M.; Oraá-Pérez, J.; López, M.I.; Hornero, R. A Robust Method for the Automatic Location of the Optic Disc and the Fovea in Fundus Images. Comput. Methods Programs Biomed. 2020, 196, 105599. [Google Scholar] [CrossRef]
- Liu, G.; Wang, Y.; Duan, X. Knowledge Based Hierarchical Mumford-Shah Model for Vector-Valued Image Segmentation. Acta Autom. Sin. 2009, 35, 356–363. [Google Scholar] [CrossRef]
- Cheng, J.; Liu, J.; Xu, Y.; Yin, F.; Wong, D.W.K.; Tan, N.-M.; Tao, D.; Cheng, C.-Y.; Aung, T.; Wong, T.Y. Superpixel Classification Based Optic Disc and Optic Cup Segmentation for Glaucoma Screening. IEEE Trans. Med. Imaging 2013, 32, 1019–1032. [Google Scholar] [CrossRef]
- Zou, B.; Zhang, S.; Song, C. Automatic Localization and Segmentation of Optic Disk in Color Fundus Image. Opt. Precis. Eng. 2015, 23, 1187–1195. [Google Scholar]
- Ke, X.; Jiang, W.; Zhu, J. Fast Location and Segmentation of Optic Disk in the Fundus Image Based on Visual Attention. Sci. Technol. Eng. 2015, 15, 47–53. [Google Scholar]
- Bian, X.; Luo, X.; Wang, C.; Liu, W.; Lin, X. Optic Disc and Optic Cup Segmentation Based on Anatomy Guided Cascade Network. Comput. Methods Programs Biomed. 2020, 197, 105717. [Google Scholar] [CrossRef] [PubMed]
- Niu, D. Research on Localization and Segmentation of Optic Disc in Fundus Images Based on Deep Convolutional Neural Networks. Master’s Thesis, Nanjing University of Aeronautics and Astronautics, Nanjing, China, 2018. [Google Scholar]
- Qin, P.; Wang, L.; Lv, H. Optic Disc and Cup Segmentation Based on Deep Learning. In Proceedings of the 2019 IEEE 3rd Information Technology, Networking, Electronic and Automation Control Conference (ITNEC), Chengdu, China, 15–17 March 2019; pp. 1835–1840. [Google Scholar]
- Qin, Y.; Wang, X. A Joint Segmentation Method for Optic Disc and Optic Cup Based on Modified Attention U-Net. Comput. Appl. Softw. 2021, 38, 181–189. [Google Scholar]
- Wan, C.; Zhou, X.; Zhou, P.; Shen, J.; Yu, Q. Location and Segmentation Method of Optic Disc in Fundus Images Based on Deep Learning. China J. Ocul. Fundus Dis. 2020, 36, 628–632. [Google Scholar]
- Yuan, X.; Zheng, X.; Ji, B.; Li, M.; Li, B. Joint Optic Disc and Cup Segmentation Based on Residual Multi-Scale Fully Convolutional Neural Network. J. Biomed. Eng. 2020, 37, 875–884. [Google Scholar]
- Zhang, L.; Xu, L.; Li, J.; Yang, H. A Population-Based Study of the Optic Disc Size. Ophthalmol. CHN 2005, 2, 78–83. [Google Scholar]
- Tian, R.; Tang, L.; Wang, L.; Chen, B.; Yang, H.; Huang, J. Assessment of the Relationship of Retinal Nerve Fiber Layer Thickness and Optic Nerve Head Size with Optical Coherence Tomography. Chin. Ophthal. Res. 2007, 540–543. [Google Scholar]
- Yu, J.; Wang, W.; Mai, E. Investigation of Optic Disc Size of Uygur Adolescents of Dushanzi. Xinjiang Med. J. 2016, 46, 998–1000. [Google Scholar]
- Zhang, W.; Wang, J.; Zhu, W. Determination of Diameters(Vertical, Horizontal), Areas of Optic Cup, Optic Disk and Neuroretinal Area of Normal Persons. Eye Sci. 1988, 4, 11–13+44. [Google Scholar]
- Zhao, G.; Pang, Y.; Wang, X.; Zhou, Z.; Zhu, M.; Liang, D. Study of Retinal Nerve Fiber Layer Thickness and Optic Disc Using Three-Dimensional Optical Coherence Tomography in Youth. Rec. Adv. Ophthalmol. 2014, 34, 349–351. [Google Scholar]
- Wang, Y.; Xu, L.; Zhang, L.; Yang, H.; Ma, Y.; Jonas, J.B. Optic Disc Size in a Population Based Study in Northern China: The Beijing Eye Study. Br. J. Ophthalmol. 2006, 90, 353–356. [Google Scholar] [CrossRef] [PubMed] [Green Version]
- Yang, L.; Li, M. The Histomorphology Study of Human Optic Nerves: Measurement of Optic Nerve Fiber Number and Diameter and Optic Disc Area. China J. Ocul. Fundus Dis. 1999, 1, 19–22. [Google Scholar]
- Jonas, J.B.; Thomas, R.; George, R.; Berenshtein, E.; Muliyil, J. Optic Disc Morphology in South India: The Vellore Eye Study. Br. J. Ophthalmol. 2003, 87, 189–196. [Google Scholar] [CrossRef] [PubMed] [Green Version]
- Ramrattan, R.S.; Wolfs, R.C.W.; Jonas, J.B.; Hofman, A.; de Jong, P.T.V.M. Determinants of Optic Disc Characteristics in a General Population☆The Rotterdam Study1. Ophthalmology 1999, 106, 1588–1596. [Google Scholar] [CrossRef]
- Ali, N.; Subrayan, V.; Reddy, S. Optic Disc Area in Malaysian Population. Int. J. Ophthalmol. 2008, 2008, 1514–1517. [Google Scholar]
- Mataki, N.; Tomidokoro, A.; Araie, M.; Iwase, A. Morphology of the Optic Disc in the Tajimi Study Population. Jpn. J. Ophthalmol. 2017, 61, 441–447. [Google Scholar] [CrossRef]
- Jonas, J.B.; Gusek, G.C.; Guggenmoos-Holzmann, I.; Naumann, G.O. Variability of the Real Dimensions of Normal Human Optic Discs. Graefes Arch. Clin. Exp. Ophthalmol. 1988, 226, 332–336. [Google Scholar] [CrossRef]
- Vojniković, B.; Tamajo, E. Gullstrand’s Optical Schematic System of the Eye--Modified by Vojniković & Tamajo. Coll. Antropol. 2013, 37 (Suppl. 1), 41–45. [Google Scholar]
- Milton, K.; Philip, B.K. The Human Eye as an Optical System. In Duane’s Clinical Ophthalmology; Tasman, W., Jaeger, E.A., Eds.; Lippincott Williams & Wilkins (LWW): Philadelphia, PA, USA, 2013; Volume 1, ISBN 978-1-4511-9101-1. [Google Scholar]
- Wang, Y. Research on Key Technology of Fundus Image Processing and Analysis. Ph.D. Thesis, University of Aeronautics and Astronautics, Nanjing, China, 2012. [Google Scholar]
- Cheung, C.Y.; Xu, D.; Cheng, C.-Y.; Sabanayagam, C.; Tham, Y.-C.; Yu, M.; Rim, T.H.; Chai, C.Y.; Gopinath, B.; Mitchell, P.; et al. A Deep-Learning System for the Assessment of Cardiovascular Disease Risk via the Measurement of Retinal-Vessel Calibre. Nat. Biomed. Eng. 2021, 5, 498–508. [Google Scholar] [CrossRef]
- Maderuelo-Fernandez, J.A.; Garcia-Garcia, A.; Chamoso, P.; Recio-Rodríguez, J.I.; Rodríguez-González, S.; Patino-Alonso, M.C.; Rodriguez-Sanchez, E.; Corchado-Rodríguez, J.M.; Gómez-Marcos, M.A.; Garcia-Ortiz, L. Automatic Image Analyser to Assess Retinal Vessel Calibre (ALTAIR). A New Tool to Evaluate the Thickness, Area and Length of the Vessels of the Retina. Int. J. Med. Inform. 2020, 136, 104090. [Google Scholar] [CrossRef]
- Welikala, R.A.; Fraz, M.M.; Habib, M.M.; Daniel-Tong, S.; Yates, M.; Foster, P.J.; Whincup, P.H.; Rudnicka, A.R.; Owen, C.G.; Strachan, D.P.; et al. Automated Quantification of Retinal Vessel Morphometry in the UK Biobank Cohort. In Proceedings of the 2017 Seventh International Conference on Image Processing Theory, Tools and Applications (IPTA), Montreal, QC, Canada, 28 November–1 December 2017; pp. 1–6. [Google Scholar]
- Bucca, B.C.; Maahs, D.M.; Snell-Bergeon, J.K.; Hokanson, J.; Rinella, S.; Bishop, F.; Boufard, A.; Homann, J.; Cheung, C.Y.; Wong, T.Y. Dynamic Changes in Retinal Vessel Diameter during Acute Hyperglycemia in Type 1 Diabetes. J. Diabetes Its Complicat. 2018, 32, 234–239. [Google Scholar] [CrossRef] [PubMed]
- Rim, T.H.; Teo, A.W.J.; Yang, H.H.S.; Cheung, C.Y.; Wong, T.Y. Retinal Vascular Signs and Cerebrovascular Diseases. J. Neuro-Ophthalmol. 2020, 40, 44–59. [Google Scholar] [CrossRef] [PubMed]


| ID | Ver. Dia./mm | Ver. Dia. Std./mm | Hor. Dia./mm | Hor. Dia. Std./mm | Notes |
|---|---|---|---|---|---|
| 1 | 1.97 | 0.19 | 1.78 | 0.18 | Color fundus images of 3918 normal subjects over 40 years old [28] |
| 2 | 1.88 | 0.25 | 1.79 | 0.19 | Color fundus images of 118 normal subjects [29] |
| 3 | 1.88 | 0.19 | 1.71 | 0.20 | Color fundus images of 475 subjects [30] |
| 4 | 1.98 | 0.28 | 1.82 | 0.28 | Color fundus images of 62 normal subjects [31] |
| 5 | 1.82 | 0.16 | 1.59 | 0.17 | OCT images of 110 young people [32] |
| 6 * | 1.84 | —— | 1.84 | —— | Color fundus images of 4027 normal subjects, and only optic disc area is measured [33] |
| 7 * | 1.78 | —— | 1.78 | —— | Clinical anatomy based on 14 people [34] |
| 8 * | 1.81 | —— | 1.81 | —— | Color fundus images of 70 subjects [35] |
| 9 * | 1.76 | —— | 1.76 | —— | Color fundus images of 5514 subjects over 55 years old [36] |
| 10 | 1.96 | 0.20 | 1.84 | 0.20 | Color fundus images of 122 subjects [37] |
| 11 * | 1.70 | —— | 1.70 | —— | Color fundus images of 2634 subjects [38] |
| 12 | 1.97 | 0.29 | 1.79 | 0.27 | Color slides of 88 unselected optic discs [39] |
| Study Name | Statistics for Each Study | Sample Size | Relative Weight | Std Residual | ||||
|---|---|---|---|---|---|---|---|---|
| Mean | Standard Error | Lower Limit | Upper Limit | p-Value | ||||
| [28] | 1.97 | 0.003 | 1.964 | 1.976 | 0 | 3918 | 15.744 | 0.819 |
| [29] | 1.88 | 0.023 | 1.835 | 1.925 | 0 | 118 | 14.043 | −0.633 |
| [30] | 1.88 | 0.009 | 1.863 | 1.897 | 0 | 475 | 15.503 | −0.670 |
| [31] | 1.98 | 0.036 | 1.910 | 2.050 | 0 | 62 | 12.185 | 0.849 |
| [32] | 1.82 | 0.015 | 1.790 | 1.850 | 0 | 110 | 14.966 | −1.624 |
| [37] | 1.96 | 0.018 | 1.925 | 1.995 | 0 | 122 | 14.657 | 0.626 |
| [35] | 1.97 | 0.031 | 1.909 | 2.031 | 0 | 88 | 12.902 | 0.729 |
| Results using meta analysis * | 1.921 | 0.026 | 1.870 | 1.972 | 0 | |||
| Predicted Class (Optic Disc) | Predicted Class (ROI) | ||||
|---|---|---|---|---|---|
| Positive | Negative | Positive | Negative | ||
| Actual Class (optic disc) | Positive | 77,114 | 2467 | —— | —— |
| Negative | 2543 | 2,539,982 | —— | —— | |
| Actual Class (ROI) | Positive | —— | —— | 1,945,933 | 15,693 |
| Negative | —— | —— | 3963 | 656,517 | |
| Camera Type | Image Size | Mean | Standard Derivation | Coefficient of Variation |
|---|---|---|---|---|
| Canon | 2976 × 1984 | 1802.390 | 0.513 | 2.85 × 10⁻⁴ |
| Topcon | 1956 × 1934 | 1856.985 | 3.639 | 1.96 × 10⁻³ |
| Zeiss | 2124 × 2056 | 2123.710 | 0.481 | 2.27 × 10⁻⁴ |
| Newvision | 2091 × 1992 | 2090.593 | 0.238 | 1.14 × 10⁻⁴ |
| Camera-Specified Scenario | FOV-Specified Scenario | |||||||
|---|---|---|---|---|---|---|---|---|
| Canon | Topcon | Zeiss | Newvision | Canon | Topcon | Zeiss | Newvision | |
| lROI | 1802.4 | 1856.96 | 2123.717 | 2090.61 | 1802.4 | 1856.96 | 2123.717 | 2090.61 |
| 0.473 | 3.623 | 0.469 | 0.068 | 0.473 | 3.623 | 0.469 | 0.068 | |
| r | 6.186 | 6.411 | 6.423 | 6.478 | 6.404 | 6.404 | 6.404 | 6.404 |
| Ur | 0.618 | 0.622 | 0.574 | 0.647 | 0.619 | 0.619 | 0.619 | 0.619 |
| Ldisc/mm | 1.921 | 1.921 | 1.921 | 1.921 | 1.921 | 1.921 | 1.921 | 1.921 |
| /mm | 0.026 | 0.026 | 0.026 | 0.026 | 0.026 | 0.026 | 0.026 | 0.026 |
| Pdisc/μm | 6.593 | 6.632 | 5.810 | 5.952 | 6.825 | 6.625 | 5.793 | 5.884 |
| /μm | 0.665 | 0.650 | 0.525 | 0.600 | 0.666 | 0.647 | 0.565 | 0.574 |
| PISO/μm | 6.897 | 6.807 | 5.693 | 6.050 | 6.897 | 6.807 | 5.693 | 6.050 |
| ∆Pdisc/μm | −0.304 | −0.175 | 0.117 | −0.097 | −0.071 | −0.182 | 0.100 | −0.165 |
| ∆P′disc/% | −4.402 | −2.567 | 2.061 | −1.609 | −1.033 | −2.673 | 1.759 | −2.733 |
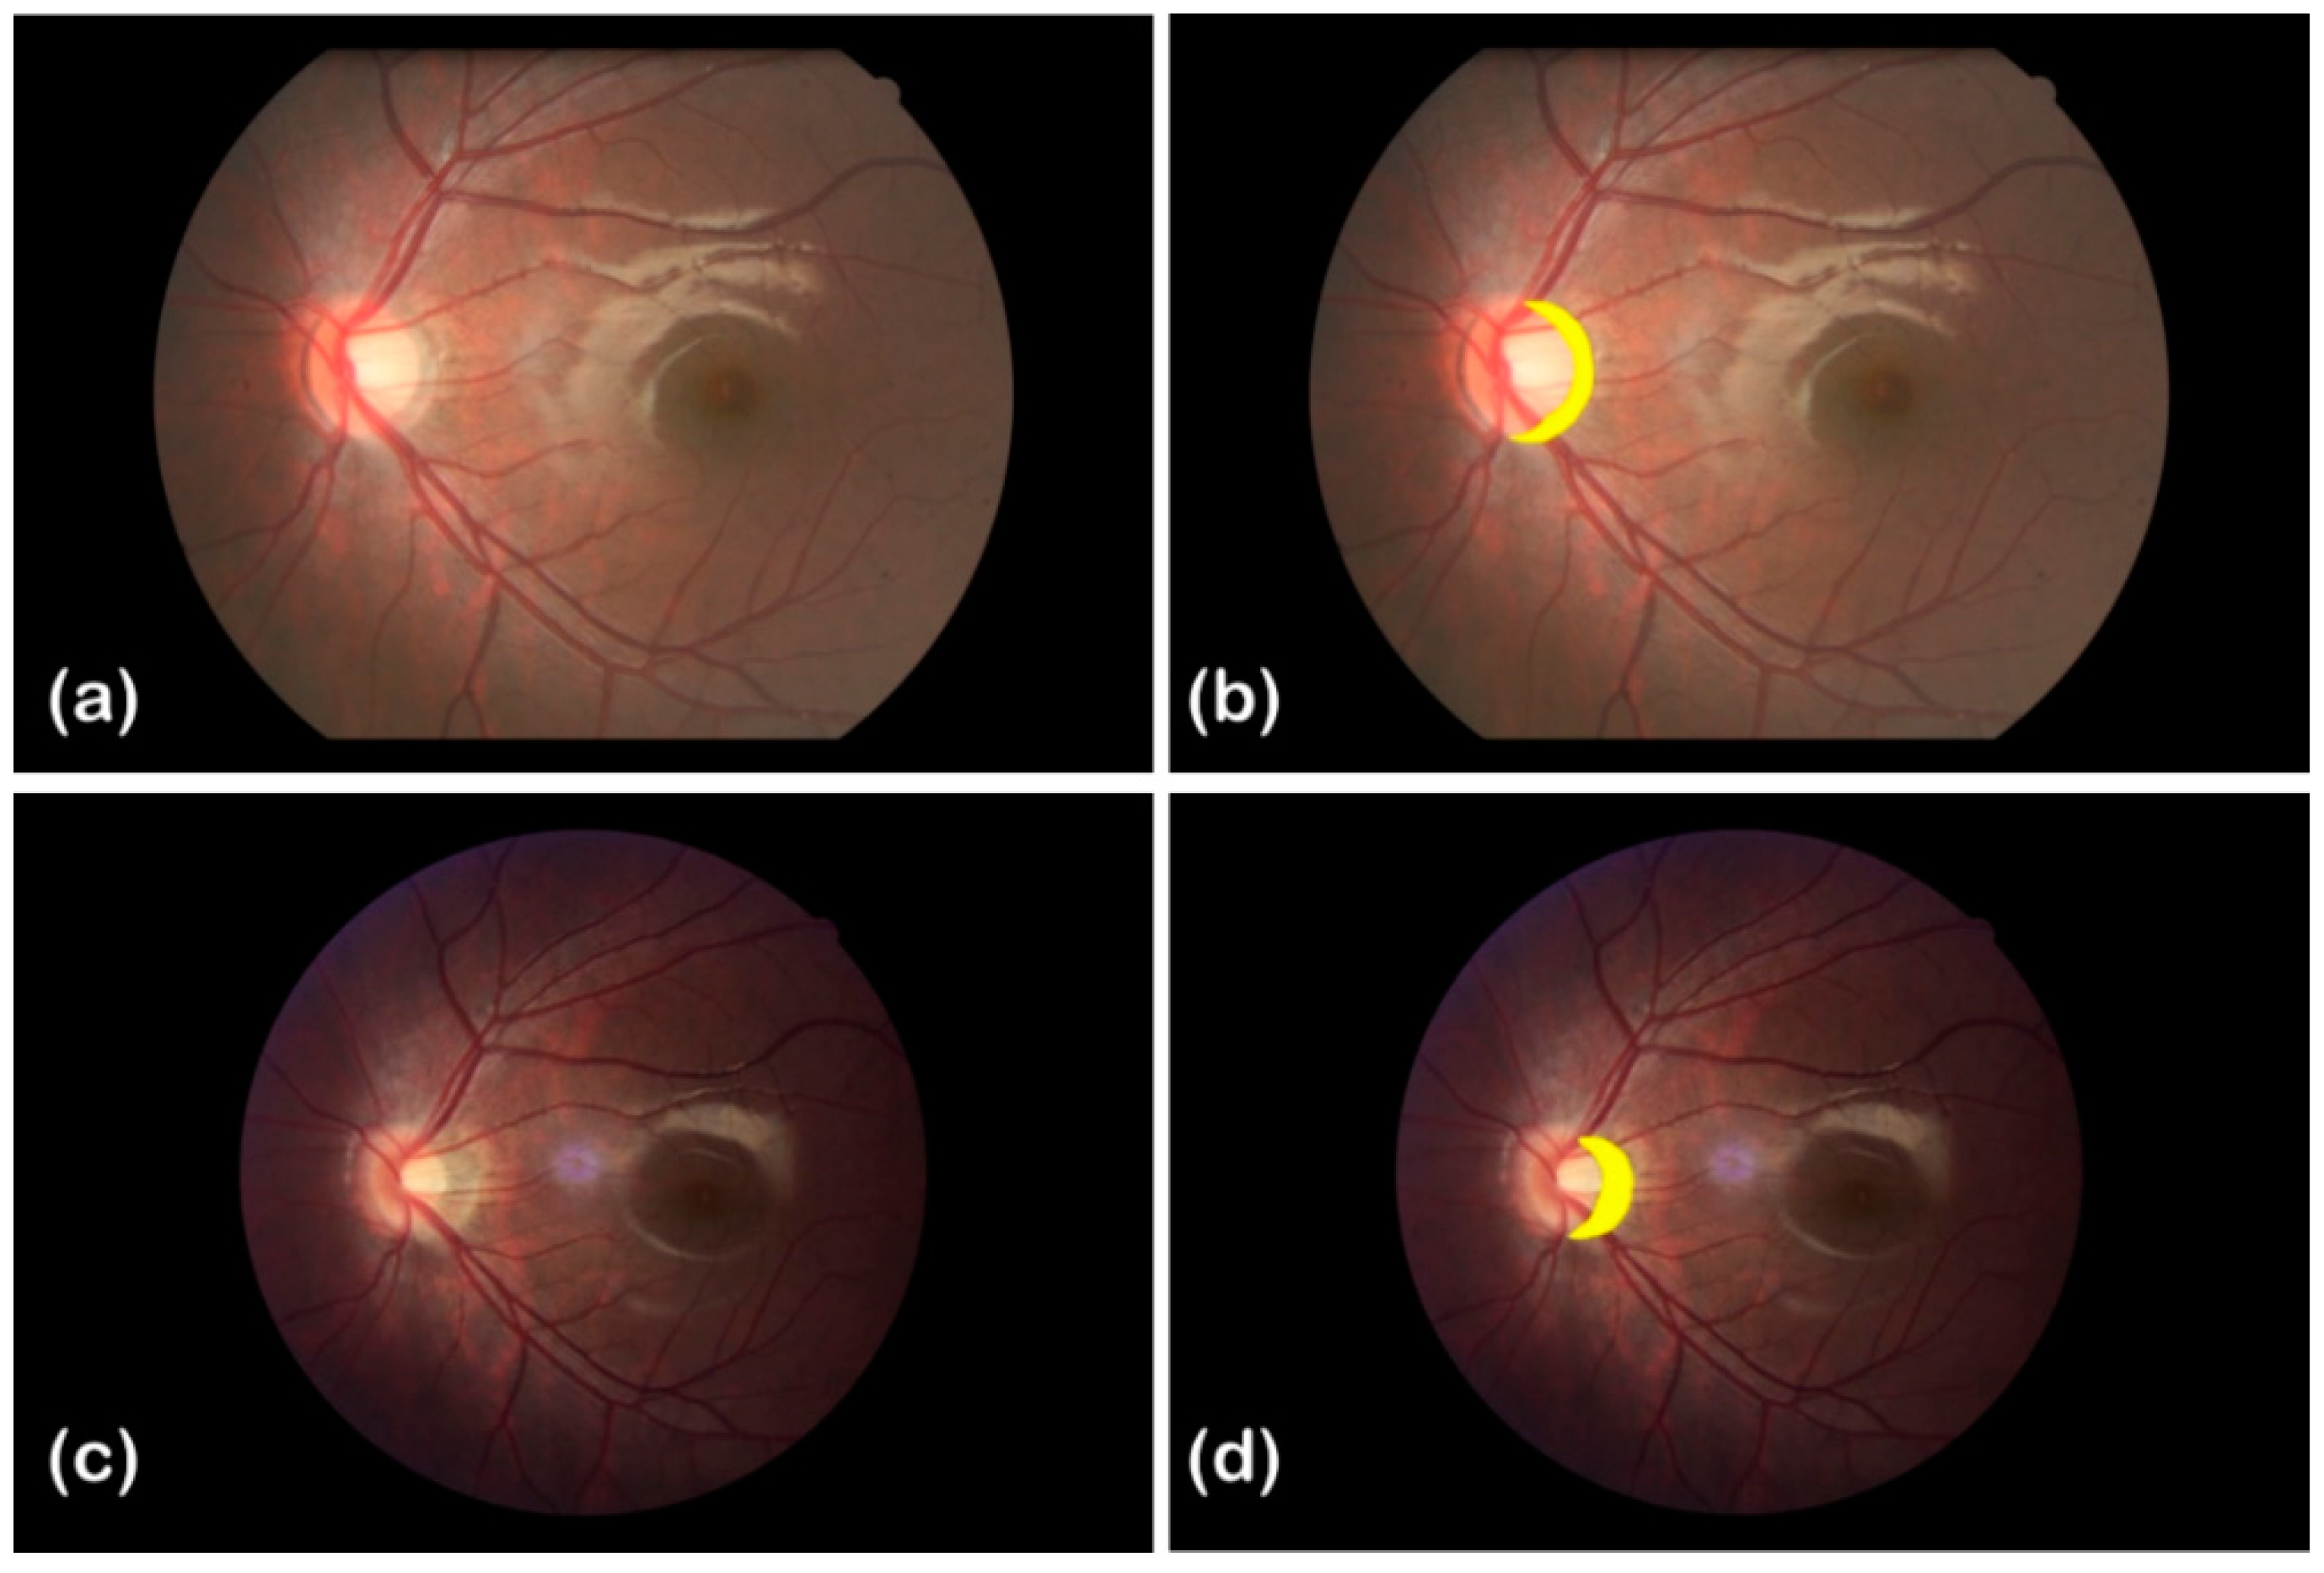
| Year | Area of Atrophic Arc Region/px | Area of Atrophic Arc Region/mm2 | Clinical Diagnosis | ||
|---|---|---|---|---|---|
| Spherical Equivalent Refraction (SE)/DS | Axial Length (AL)/mm | The Degree of Atrophy around the Disc | |||
| 2012 | 17,586 | 0.631 | −2.50 | 25.04 mm | mild |
| 2016 | 16,521 ↓ | 0.895 ↑ | −5.50 ↑ | 26.47 mm ↑ | moderate |
Publisher’s Note: MDPI stays neutral with regard to jurisdictional claims in published maps and institutional affiliations. |
© 2022 by the authors. Licensee MDPI, Basel, Switzerland. This article is an open access article distributed under the terms and conditions of the Creative Commons Attribution (CC BY) license (https://creativecommons.org/licenses/by/4.0/).
Share and Cite
Long, T.; Xu, Y.; Zou, H.; Lu, L.; Yuan, T.; Dong, Z.; Dong, J.; Ke, X.; Ling, S.; Ma, Y. A Generic Pixel Pitch Calibration Method for Fundus Camera via Automated ROI Extraction. Sensors 2022, 22, 8565. https://doi.org/10.3390/s22218565
Long T, Xu Y, Zou H, Lu L, Yuan T, Dong Z, Dong J, Ke X, Ling S, Ma Y. A Generic Pixel Pitch Calibration Method for Fundus Camera via Automated ROI Extraction. Sensors. 2022; 22(21):8565. https://doi.org/10.3390/s22218565
Chicago/Turabian StyleLong, Tengfei, Yi Xu, Haidong Zou, Lina Lu, Tianyi Yuan, Zhou Dong, Jiqun Dong, Xin Ke, Saiguang Ling, and Yingyan Ma. 2022. "A Generic Pixel Pitch Calibration Method for Fundus Camera via Automated ROI Extraction" Sensors 22, no. 21: 8565. https://doi.org/10.3390/s22218565