
A Novel Load Balancing Scheme for Satellite IoT Networks Based on Spatial–Temporal Distribution of Users and Advanced Genetic Algorithms

 , , and
Abstract
:1. Introduction
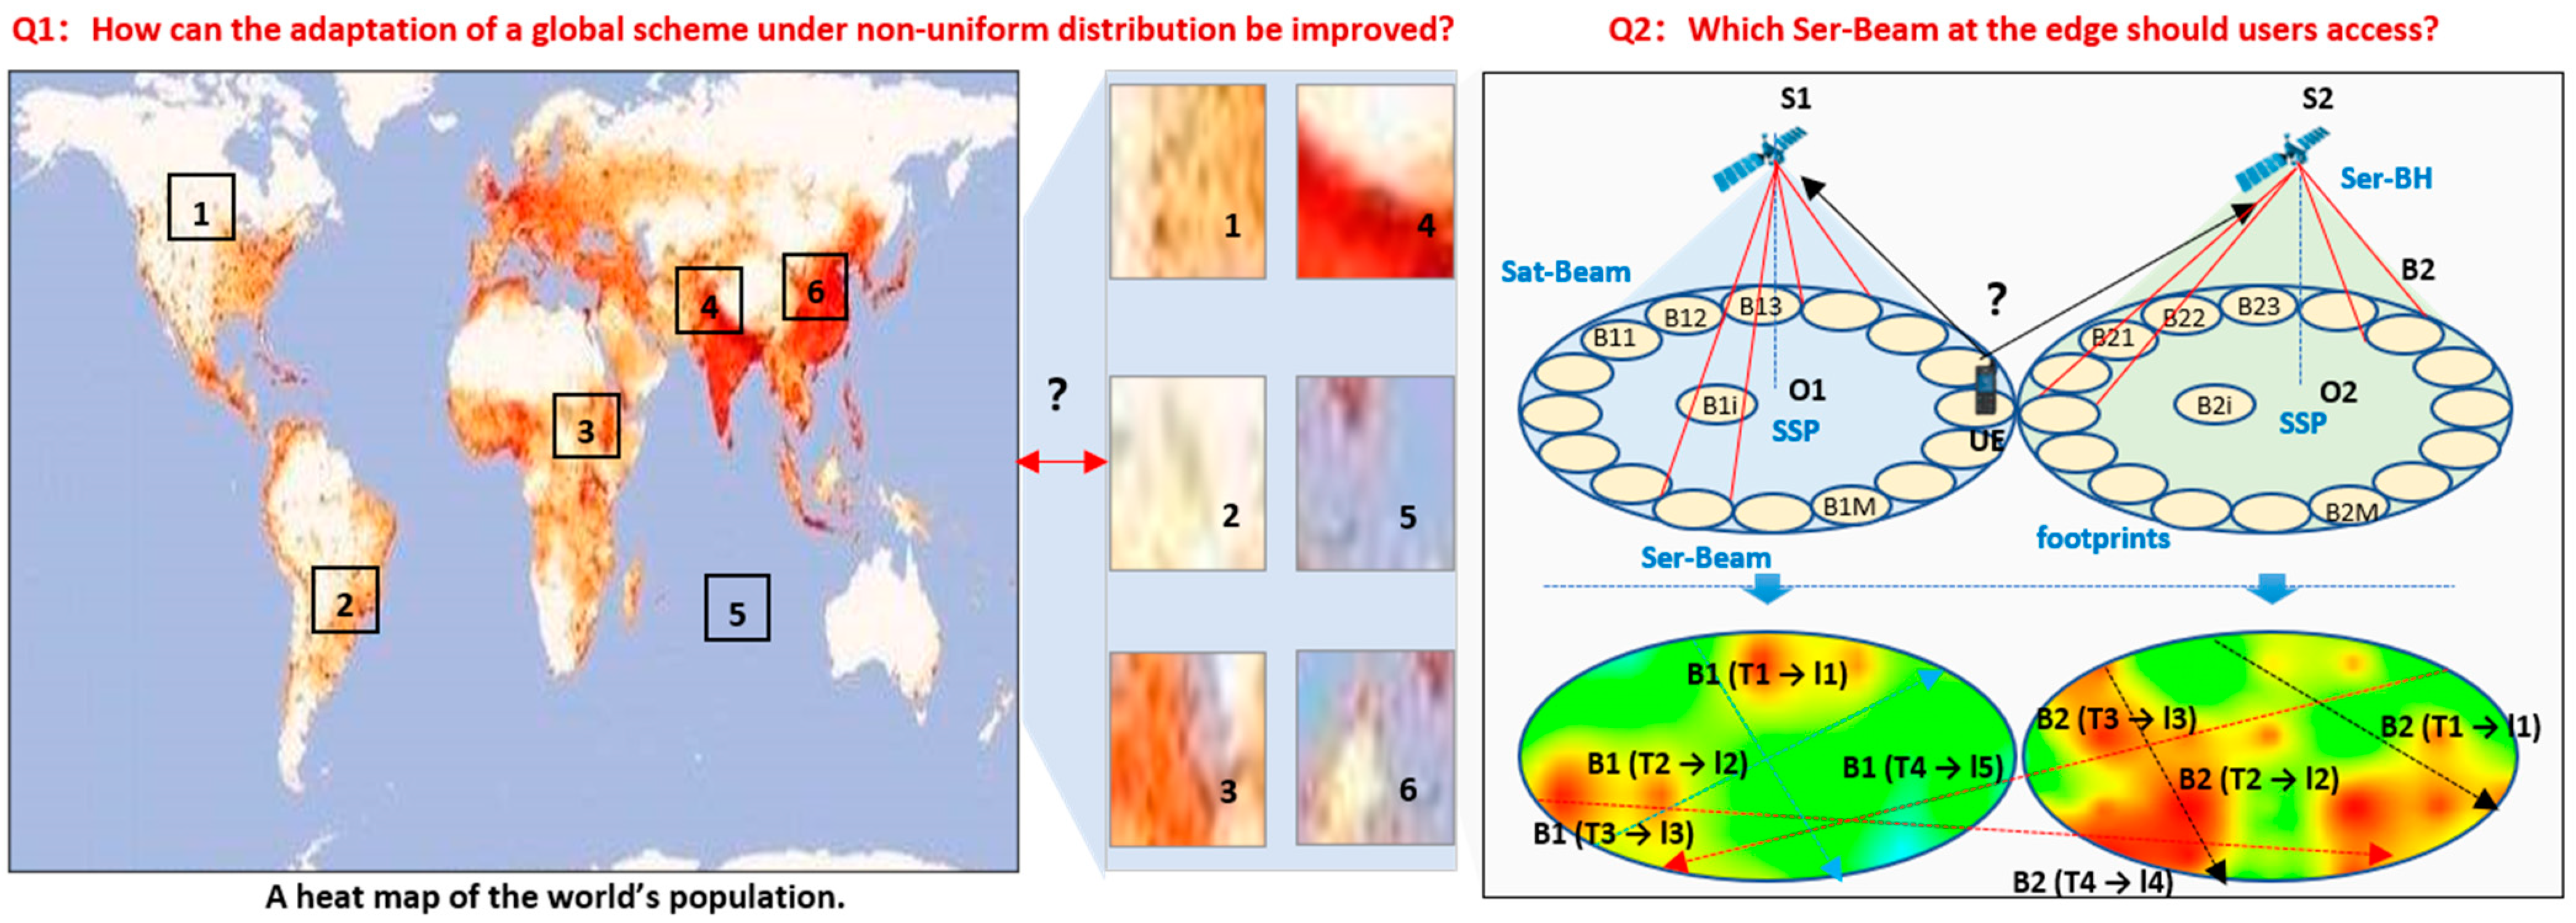
- In contrast to existing research on load balancing under DoU of uniform, we are the first to improve these schemes by modeling the density variances of users under different moving directions. This can solve load balancing problems under spatio–temporal non-uniform DoU;
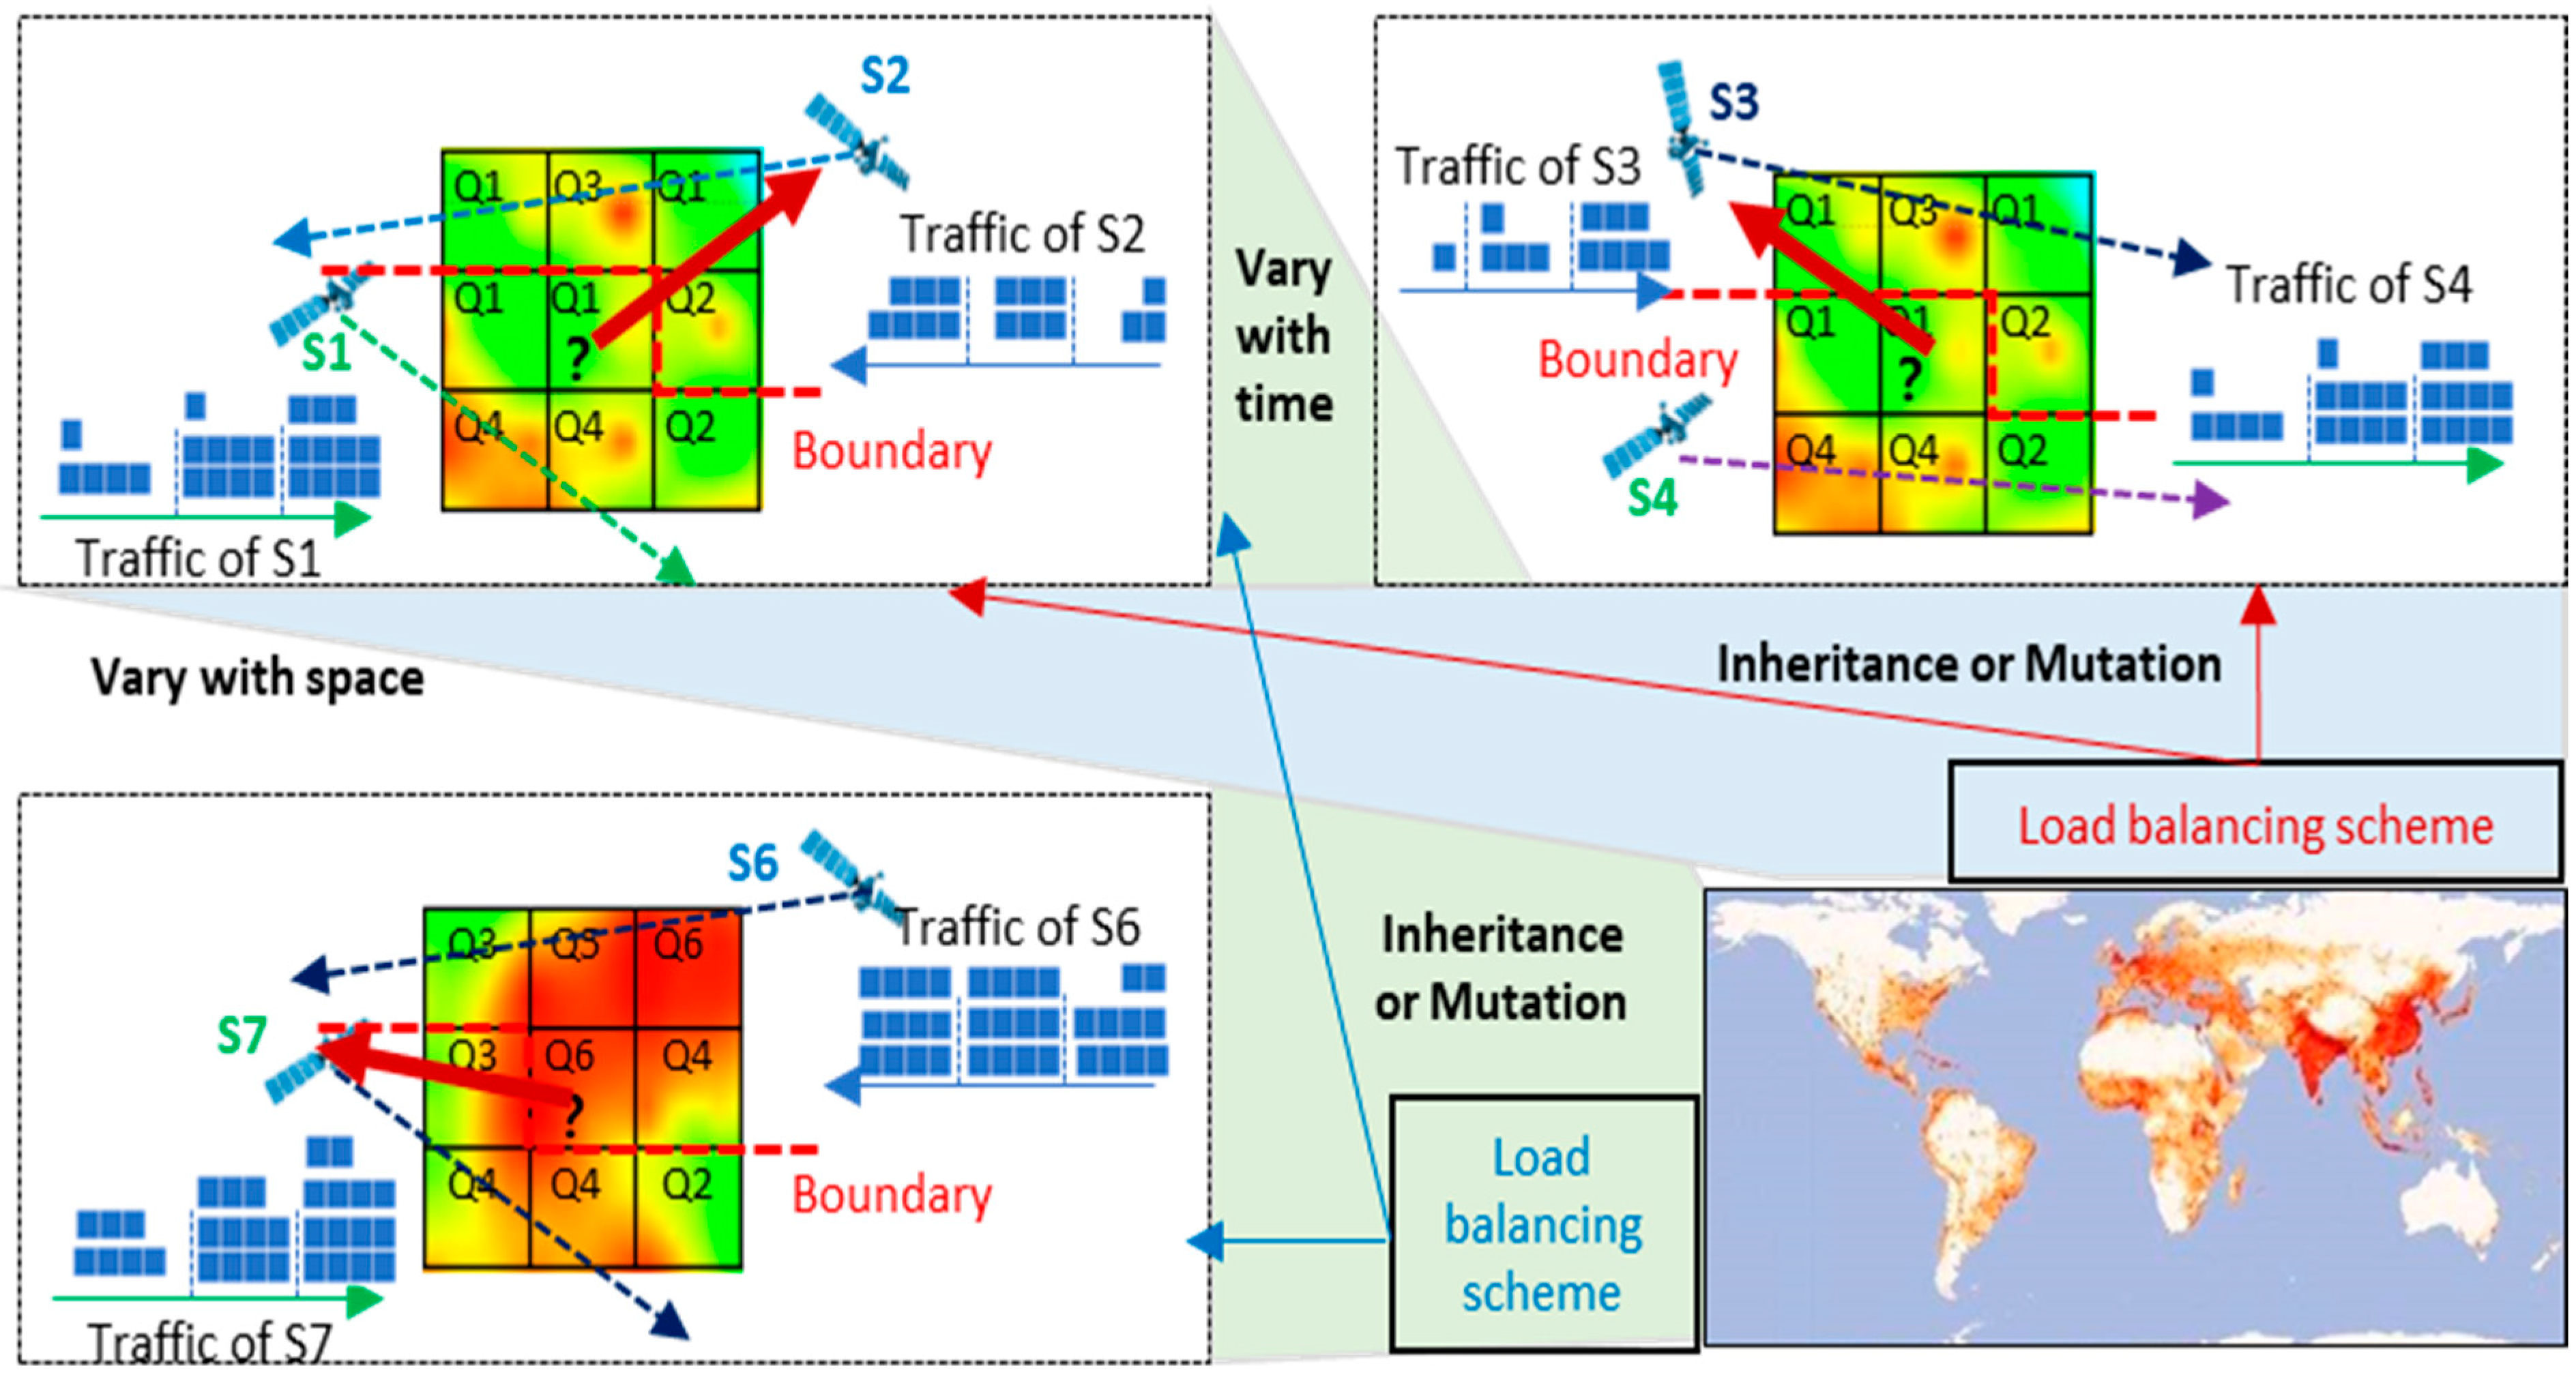
- Fully considering the prior periodicity of satellite movement and the similarity of DoU in different areas, we propose the adaptive inheritance iteration to optimize the crossover factor and mutation factor for GA for the first time. This can enhance the efficiency and convergence speed of GA for S-IoT-N scenarios;
- The Ser-BH scenario is totally new to SIN. We propose a load balancing scheme based on non-uniform spatial–temporal DoU and advanced GA, which can achieve better performance of total throughput for adjacent Ser-beams.
2. Related Works
3. System Model and Problem Formulations
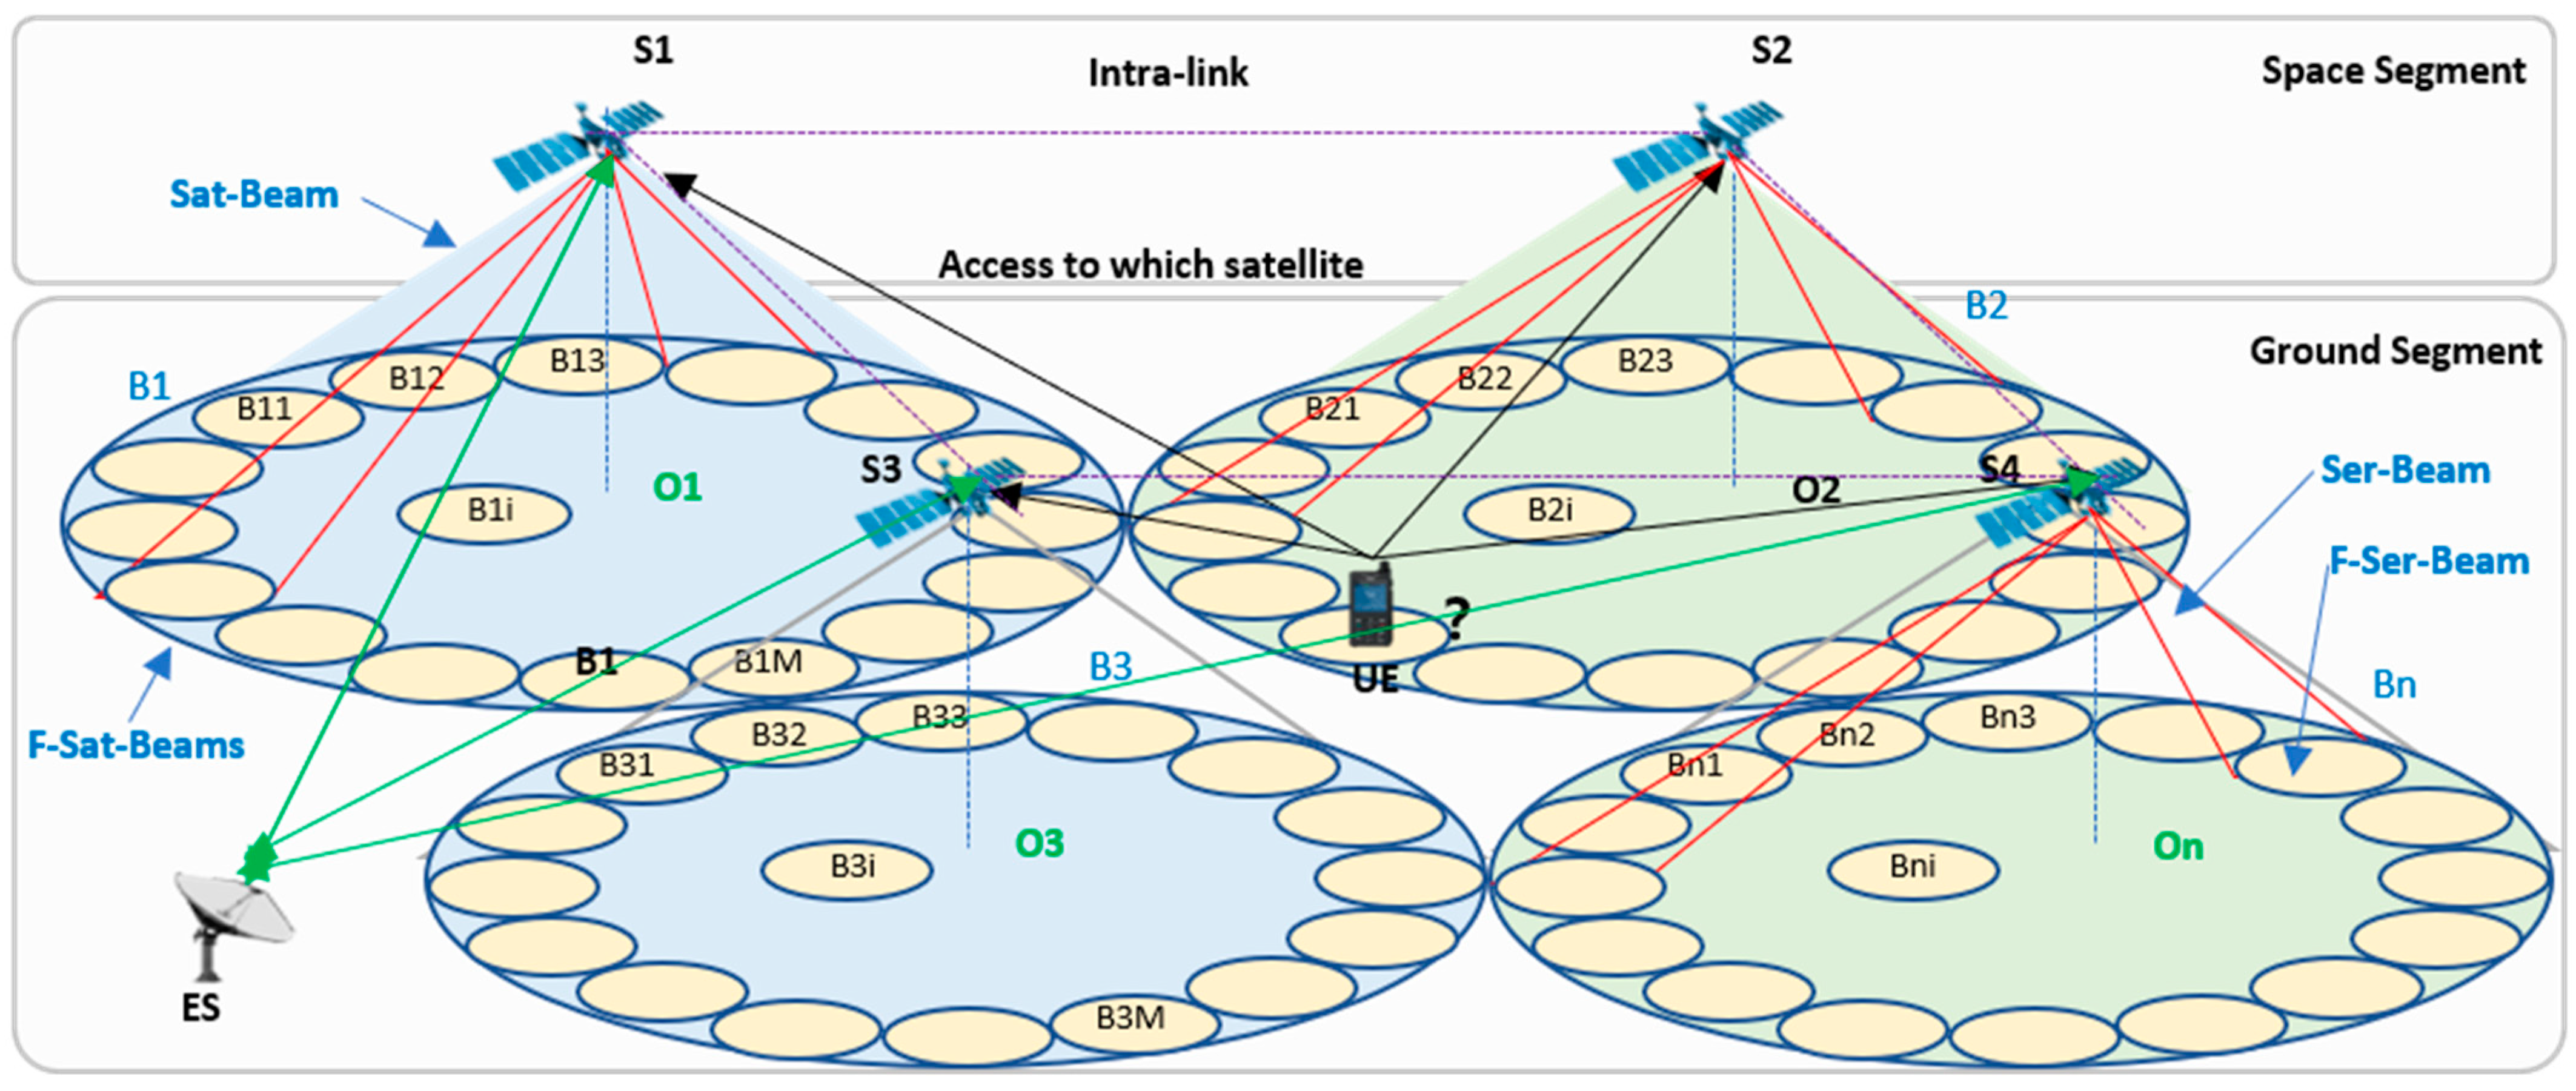
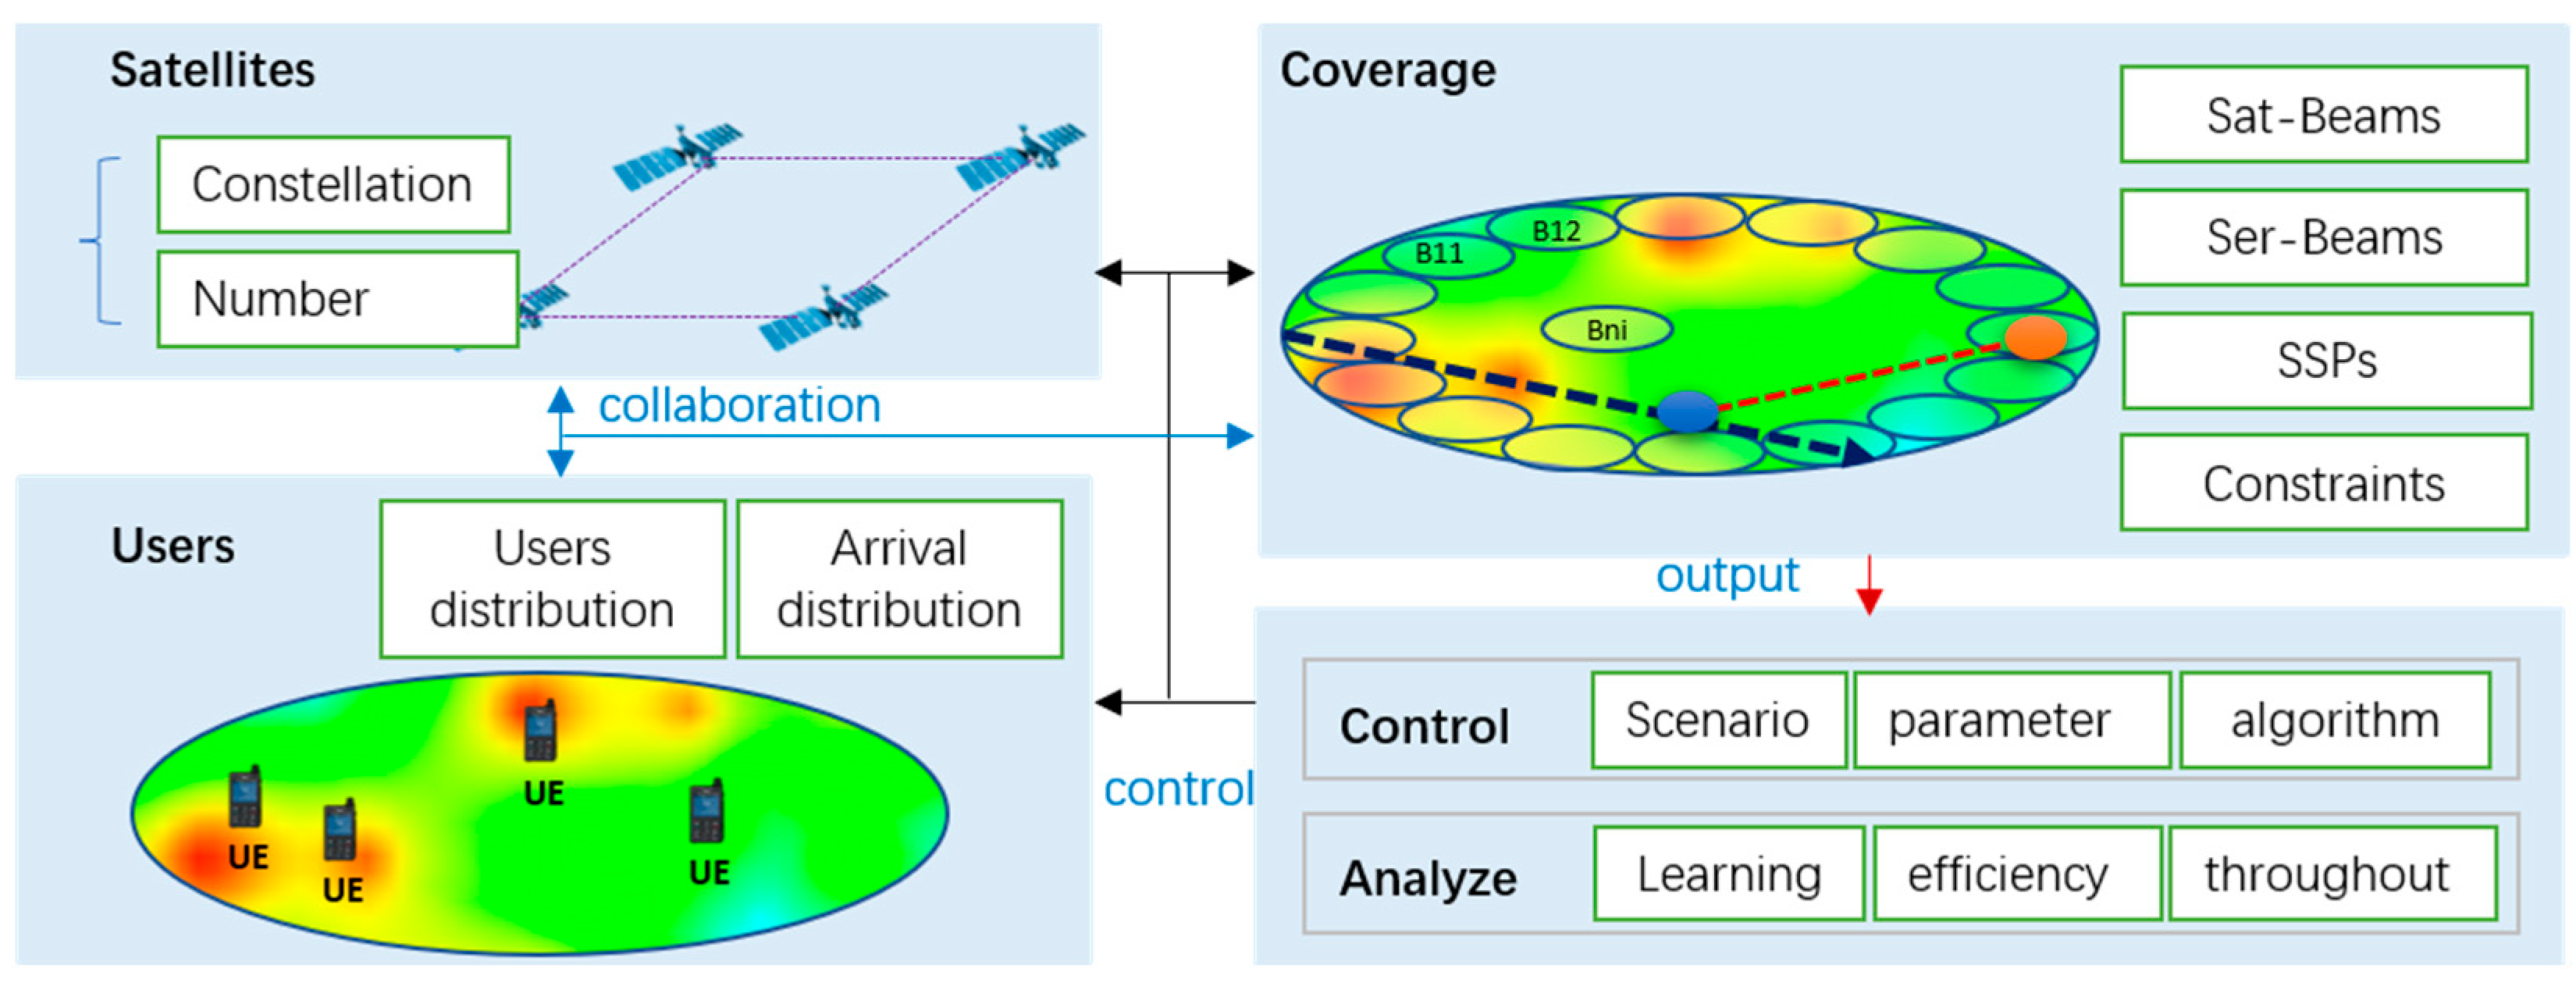
3.1. Network Architecture
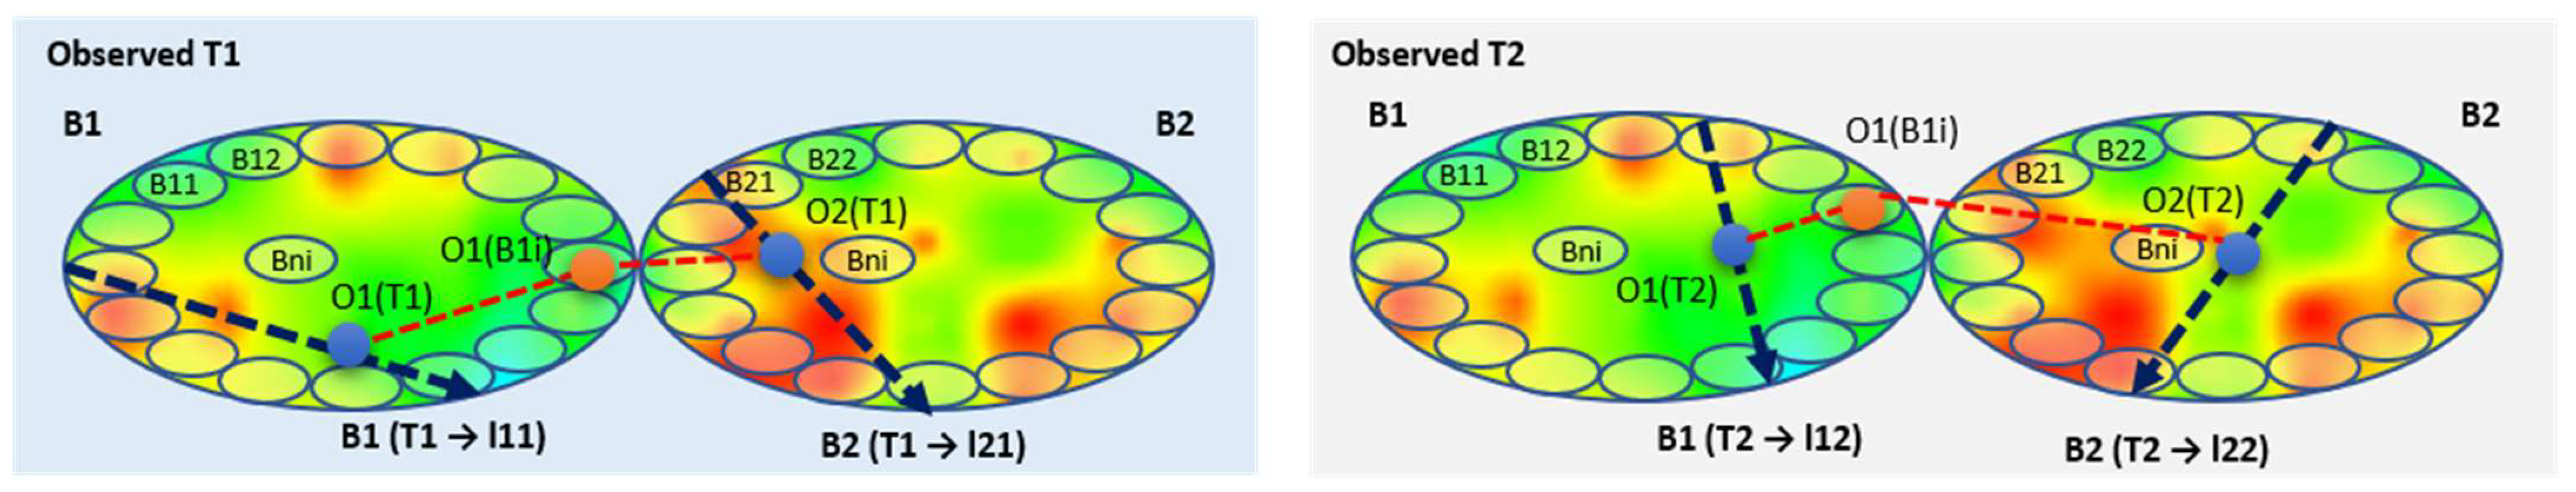
3.2. User Model and Distribution
3.3. Problems Formulations
- Objectives:
- Conditions:
- Constraints:
4. Load Balancing Scheme Based on the Modeling of Spatial–Temporal DoU and Advanced Genetic Algorithms
4.1. The Modeling of the Solution Using the Original GA
- Step 1: Modelling of Fitness Function:
- Step 2: Modelling of the Solution:
- Step 3: Modelling the Genetic Cross:
- Step4: Modelling Genetic Mutation:
4.2. GA Optimization by Improving the Genetic Crossover and Mutation Based on Controllable Adaptation to the Scenario
- Optimization of Cross Factor:
- Optimization of Mutation Factor:
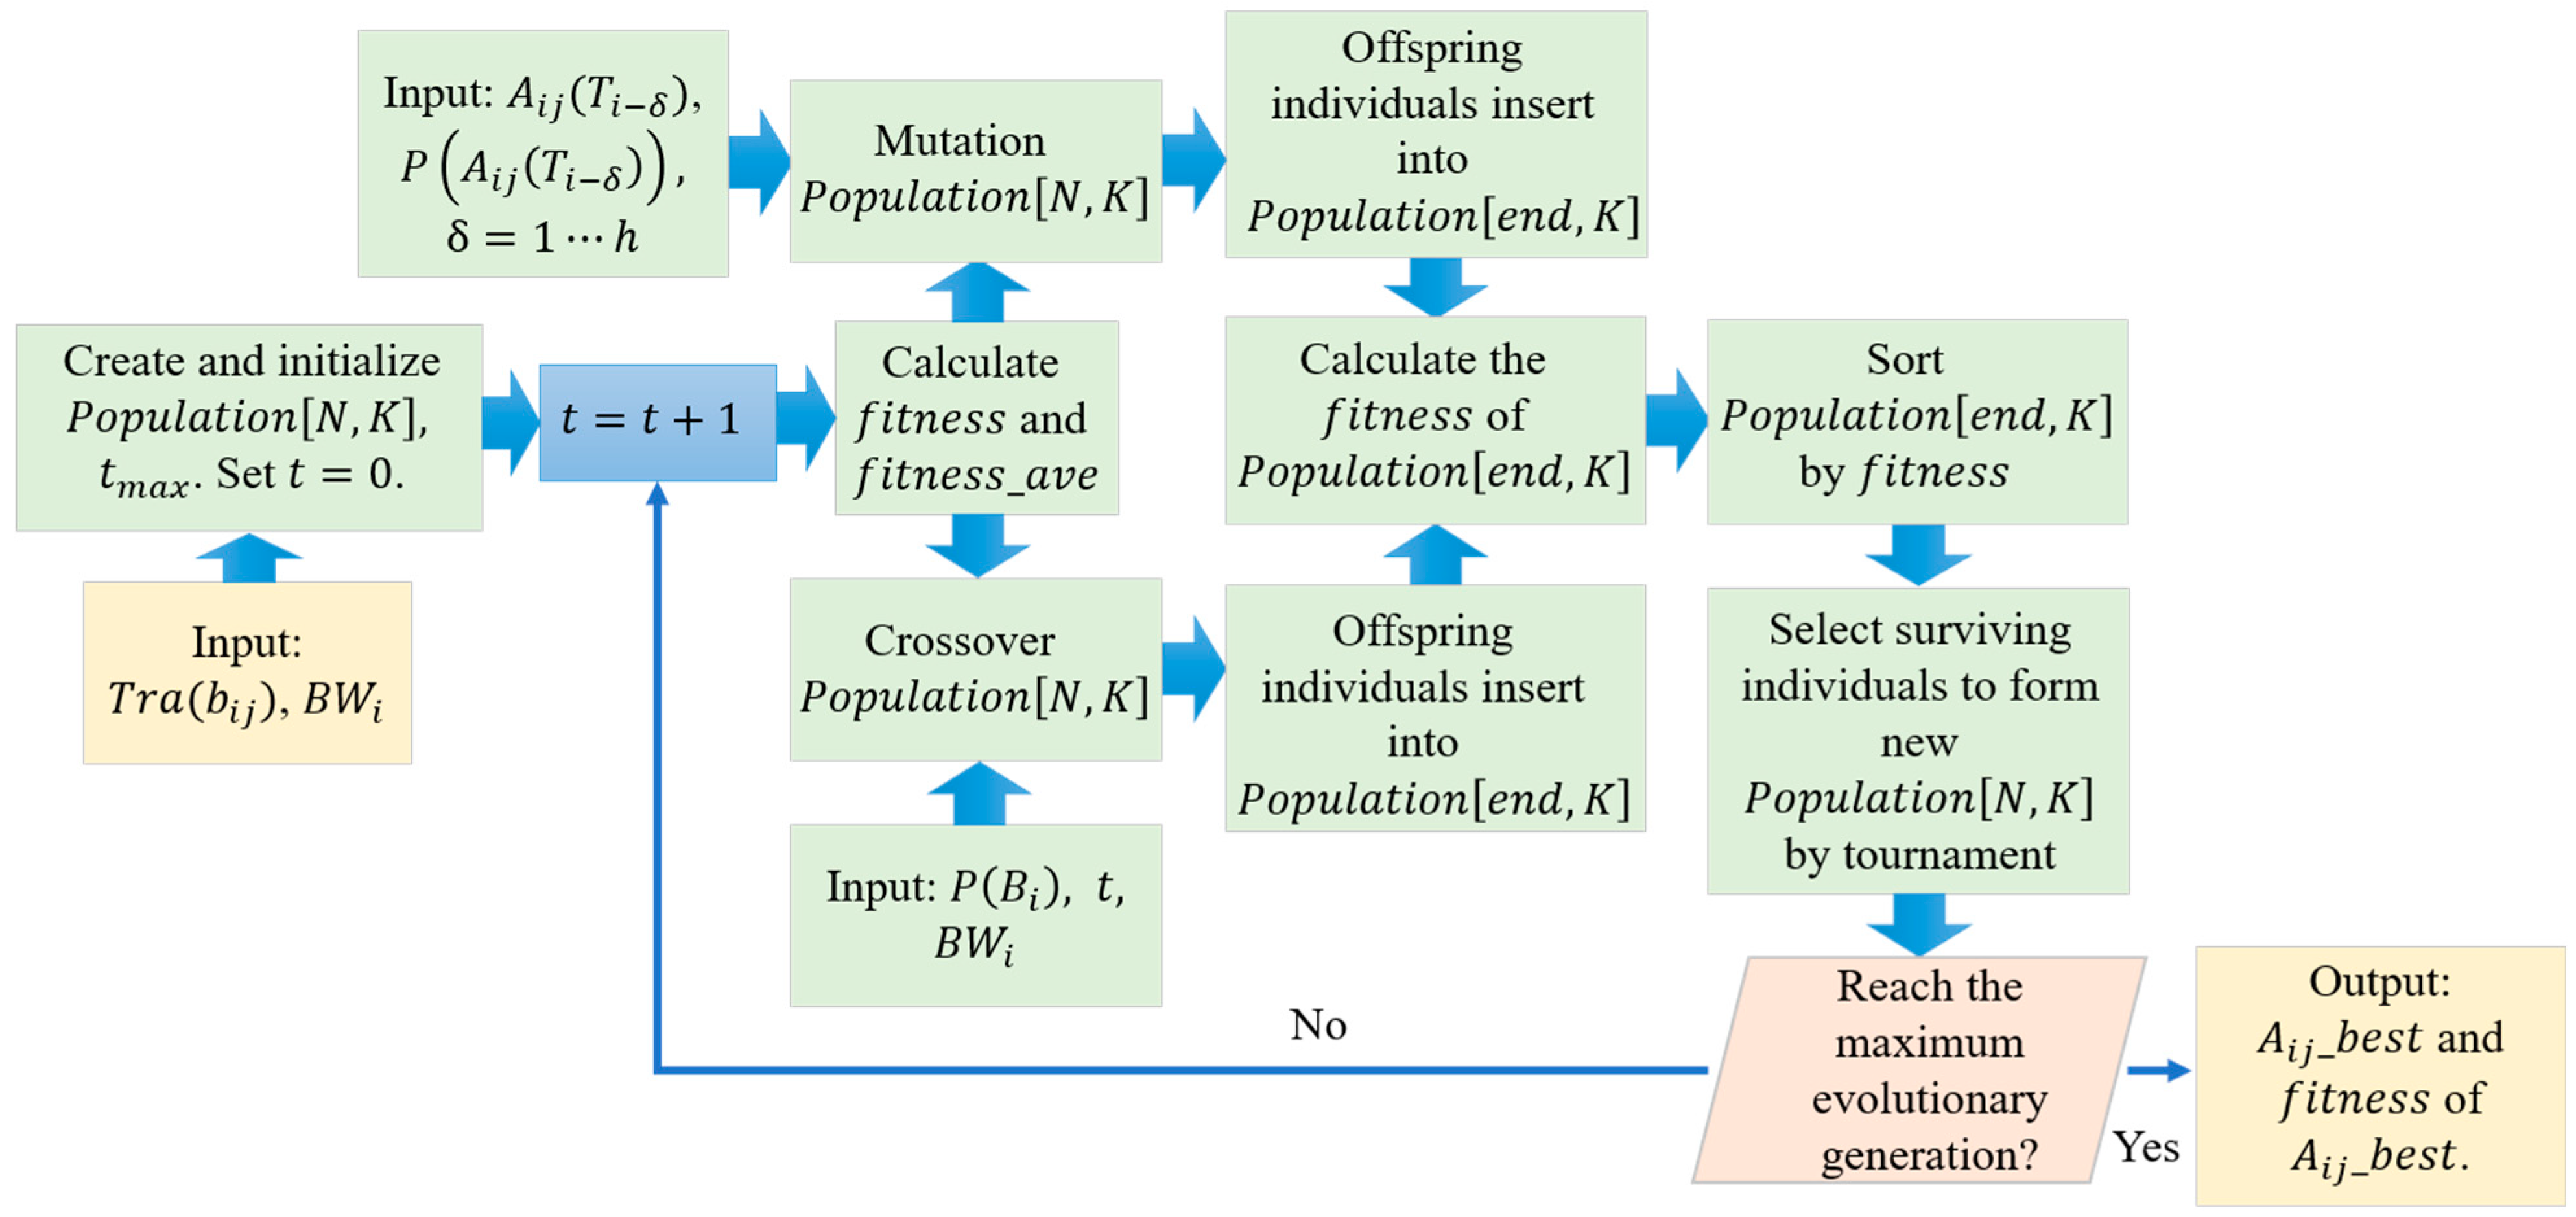
4.3. Advanced Load Balancing Scheme Based on Optimized GA
| Algorithm1: Load balance based on GA |
|
| Algorithm 2: Crossover |
|
| Algorithm 3: Mutation |
|
5. Simulation and Analysis
5.1. Simulation and Experimental Design
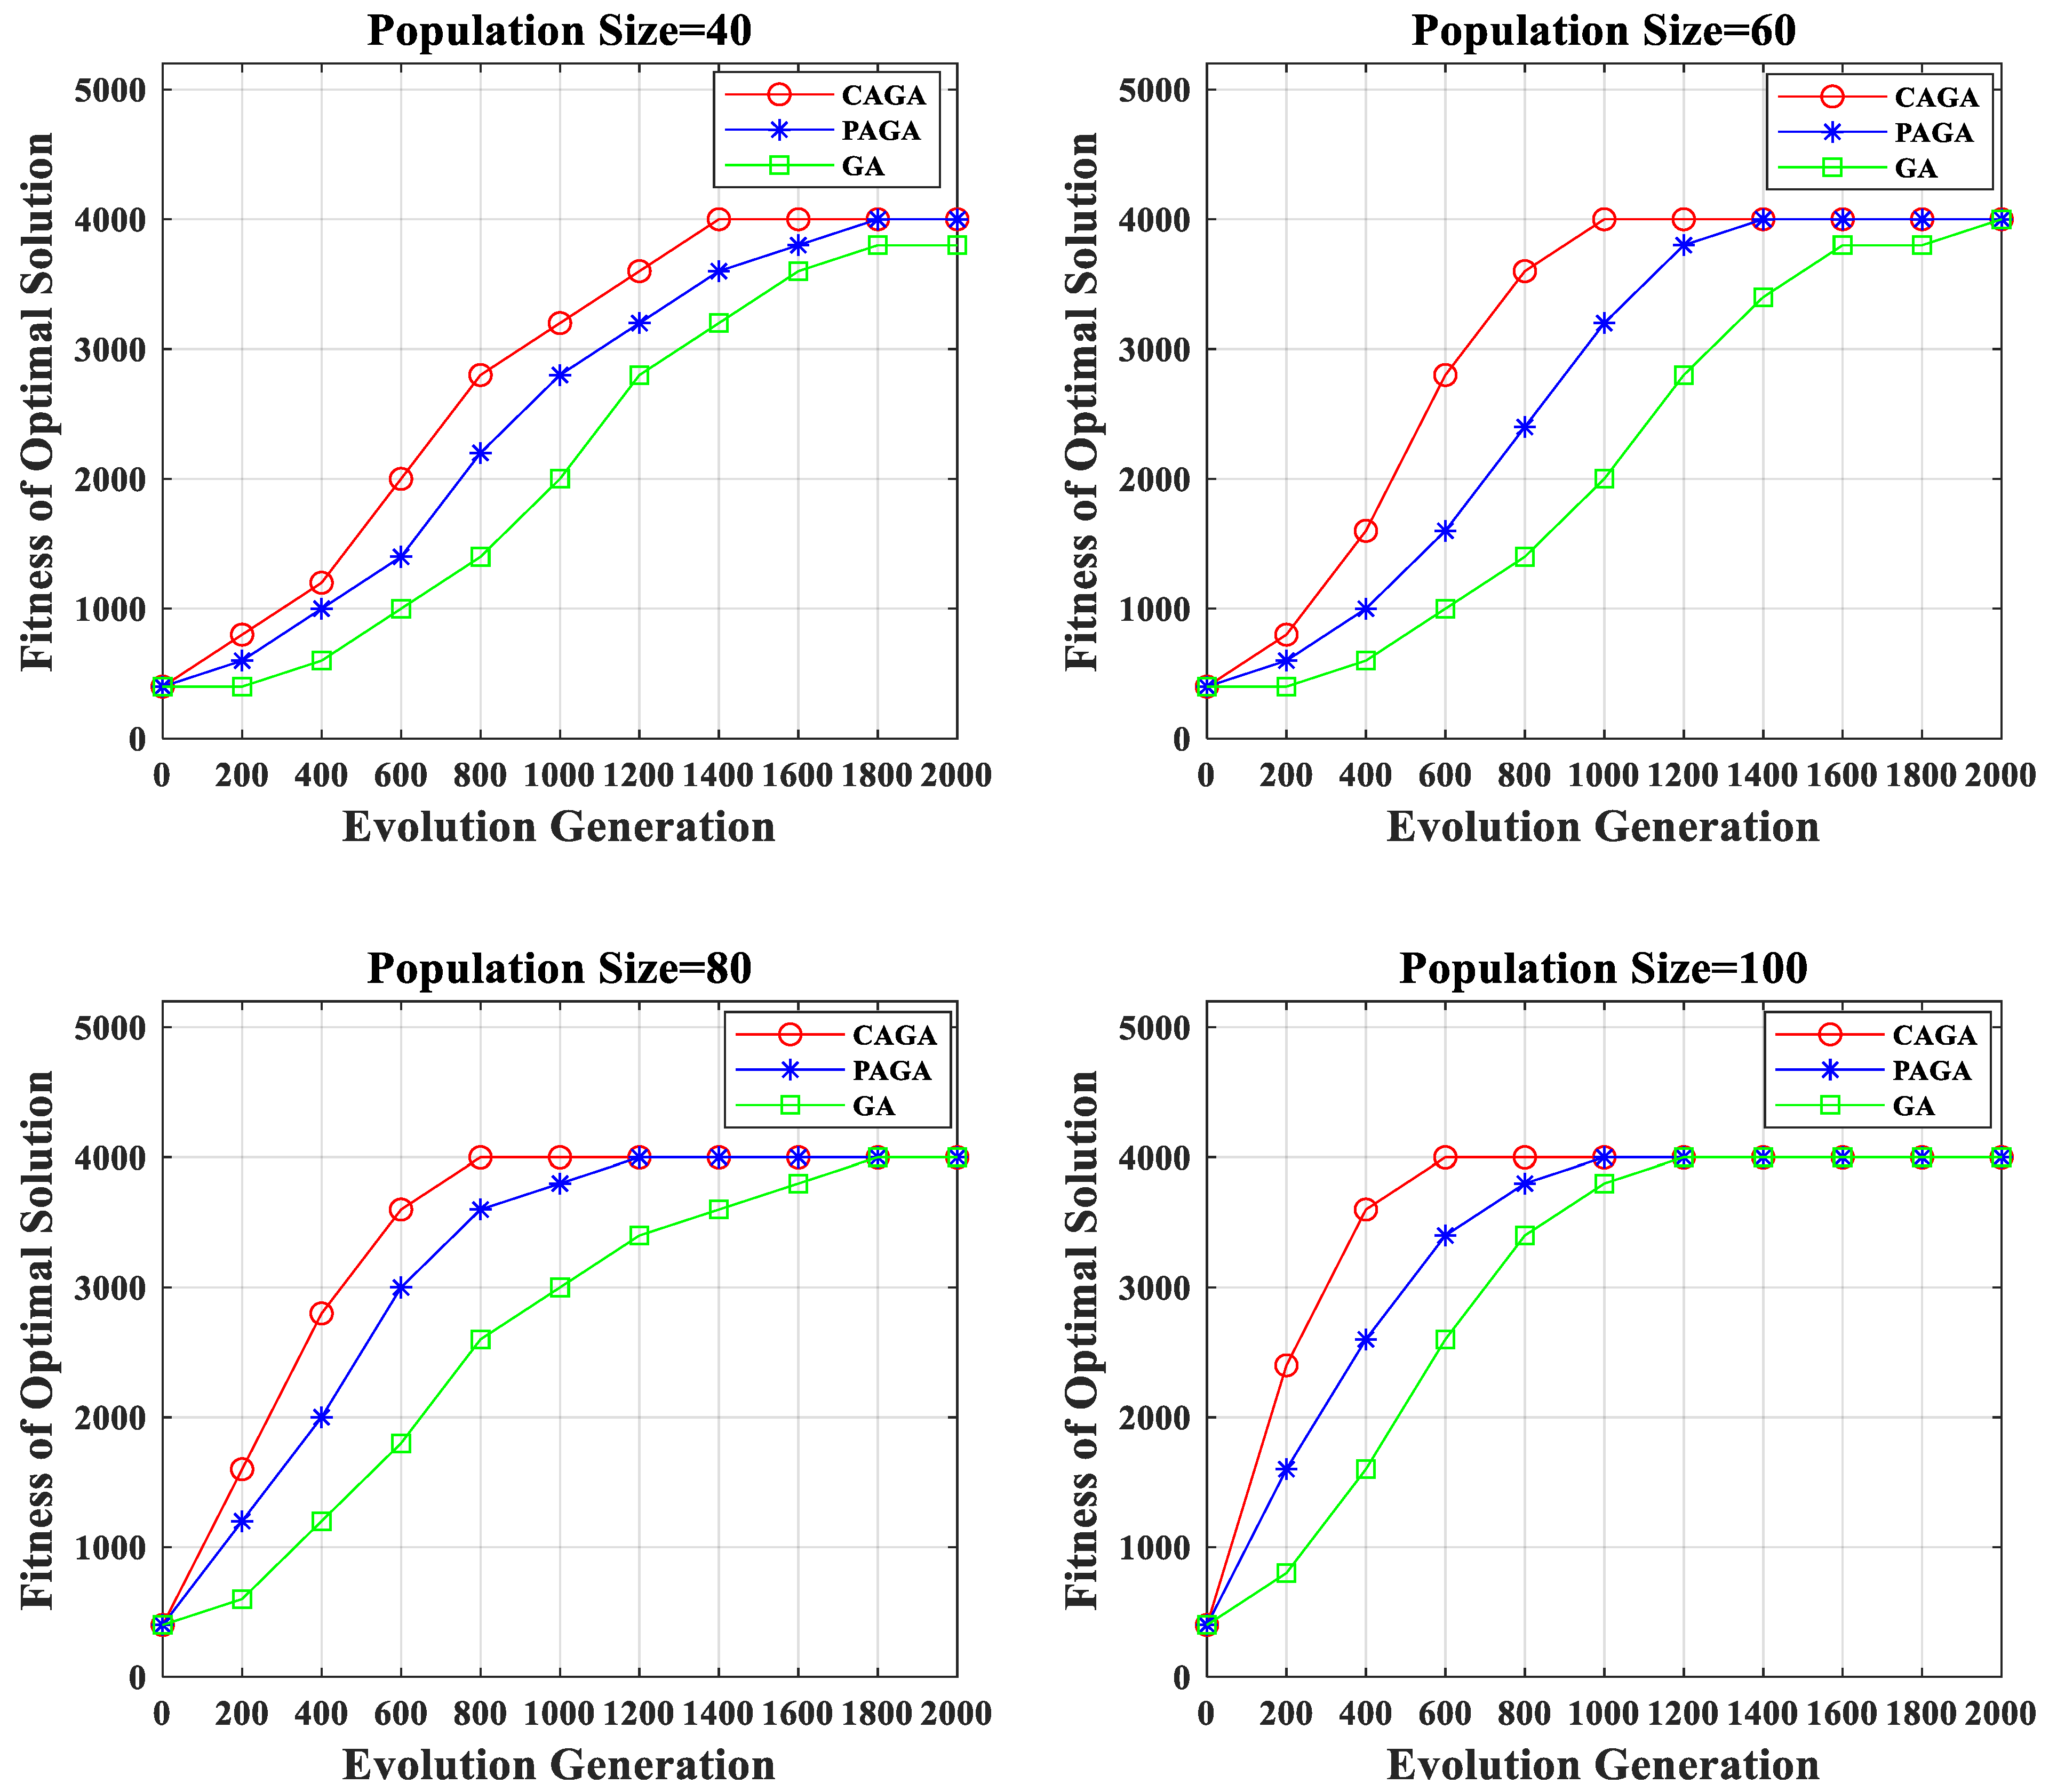
5.2. Performance of the Improved Genetic Algorithm and Analysis
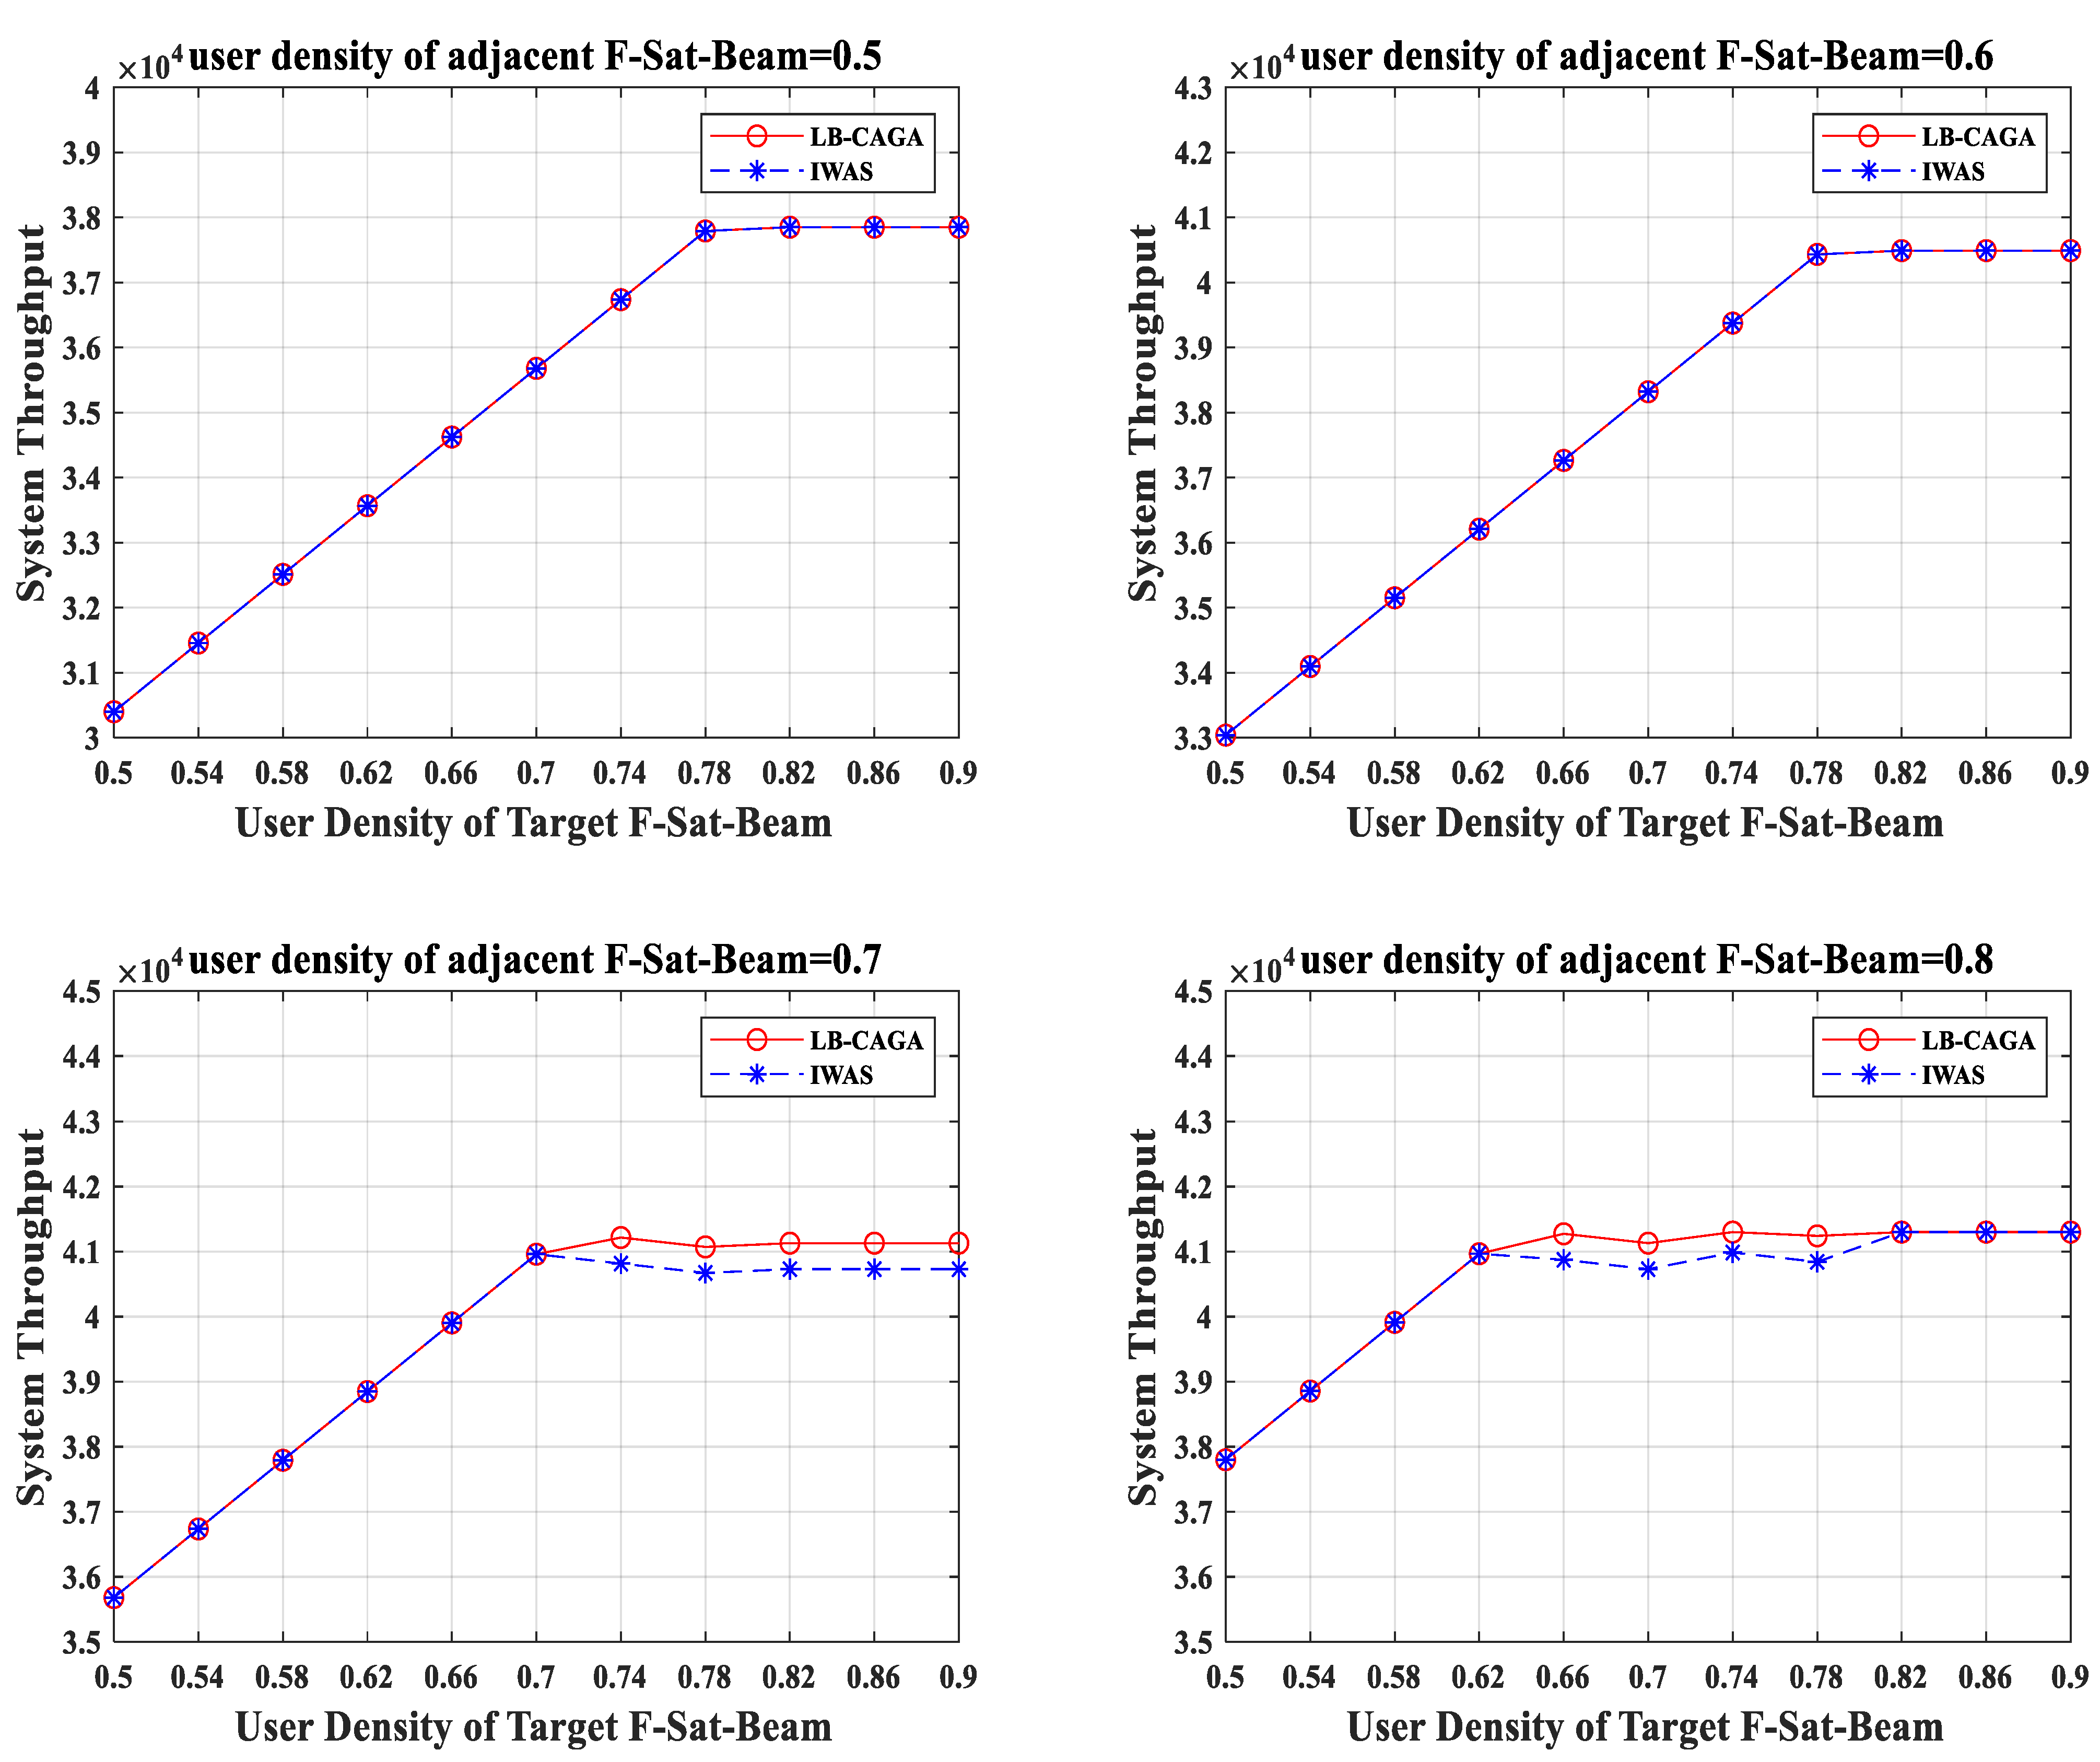
5.3. The Performance of Load Balancing for S-IoT-N and Analysis
6. Conclusions
Author Contributions
Funding
Institutional Review Board Statement
Informed Consent Statement
Conflicts of Interest
References
- Munoz, R.; Vilalta, R.; Yoshikane, N.; Casellas, R.; Martinez, R.; Tsuritani, T.; Morita, I. Integration of IoT, Transport SDN, and Edge/Cloud Computing for Dynamic Distribution of IoT Analytics and Efficient Use of Network Resources. J. Light. Technol. 2018, 36, 1420–1428. [Google Scholar] [CrossRef]
- Bhat, J.R.; Alqahtani, S.A. 6G Ecosystem: Current Status and Future Perspective. IEEE Access 2021, 9, 43134–43167. [Google Scholar] [CrossRef]
- Hosseinian, M.; Choi, J.P.; Chang, S.-H.; Lee, J. Review of 5G NTN Standards Development and Technical Challenges for Satellite Integration With the 5G Network. IEEE Aerosp. Electron. Syst. Mag. 2021, 36, 22–31. [Google Scholar] [CrossRef]
- Letaief, K.B.; Shi, Y.; Lu, J.; Lu, J. Edge Artificial Intelligence for 6G: Vision, Enabling Technologies, and Applications. IEEE J. Sel. Areas Commun. 2022, 40, 5–36. [Google Scholar] [CrossRef]
- Tang, J.; Bian, D.; Li, G.; Hu, J.; Cheng, J. Resource Allocation for LEO Beam-Hopping Satellites in a Spectrum Sharing Scenario. IEEE Access 2021, 9, 56468–56478. [Google Scholar] [CrossRef]
- Tusha, A.; Dogan, S.; Arslan, H. A Hybrid Downlink NOMA With OFDM and OFDM-IM for Beyond 5G Wireless Networks. IEEE Signal Process. Lett. 2020, 27, 491–495. [Google Scholar] [CrossRef]
- Liu, Y.; Zhang, S.; Mu, X.; Ding, Z.; Schober, R.; Al-Dhahir, N.; Hossain, E.; Shen, X. Evolution of NOMA Toward Next Generation Multiple Access (NGMA) for 6G. IEEE J. Sel. Areas Commun. 2022, 40, 1037–1071. [Google Scholar] [CrossRef]
- Liu, S.; Lin, J.; Xu, L.; Gao, X.; Liu, L.; Jiang, L. A Dynamic Beam Shut Off Algorithm for LEO Multibeam Satellite Constellation Network. IEEE Wirel. Commun. Lett. 2020, 9, 1730–1733. [Google Scholar] [CrossRef]
- del Portillo, I.; Cameron, B.G.; Crawley, E.F. A technical comparison of three low earth orbit satellite constellation systems to provide global broadband. Acta Astronaut. 2019, 159, 123–135. [Google Scholar] [CrossRef]
- Tall, A.; Altman, Z.; Altman, E. Self-Optimizing Load Balancing With Backhaul-Constrained Radio Access Networks. IEEE Wirel. Commun. Lett. 2015, 4, 645–648. [Google Scholar] [CrossRef] [Green Version]
- Kim, H.Y.; Kim, H.; Cho, Y.H.; Lee, S.-H. Self-Organizing Spectrum Breathing and User Association for Load Balancing in Wireless Networks. IEEE Trans. Wirel. Commun. 2016, 15, 3409–3421. [Google Scholar] [CrossRef]
- Nishiyama, H.; Kudoh, D.; Kato, N.; Kadowaki, N. Load Balancing and QoS Provisioning Based on Congestion Prediction for GEO/LEO Hybrid Satellite Networks. Proc. IEEE 2011, 99, 1998–2007. [Google Scholar] [CrossRef]
- Fang, X.; Feng, W.; Wei, T.; Chen, Y.; Ge, N.; Wang, C.-X. 5G Embraces Satellites for 6G Ubiquitous IoT: Basic Models for Integrated Satellite Terrestrial Networks. IEEE Internet Things J. 2021, 8, 14399–14417. [Google Scholar] [CrossRef]
- Wang, C.; Liu, L.; Ma, H.; Xia, D. A Joint Optimization Scheme for Hybrid MAC Layer in LEO Satellite Supported IoT. IEEE Internet Things J. 2021, 8, 11822–11833. [Google Scholar] [CrossRef]
- Zhang, Z.; Jiang, C.; Guo, S.; Qian, Y.; Ren, Y. Temporal Centrality-Balanced Traffic Management for Space Satellite Networks. IEEE Trans. Veh. Technol. 2017, 67, 4427–4439. [Google Scholar] [CrossRef]
- El-Shorbagy, M.A.; El-Refaey, A.M. Hybridization of Grasshopper Optimization Algorithm With Genetic Algorithm for Solving System of Non-Linear Equations. IEEE Access 2020, 8, 220944–220961. [Google Scholar] [CrossRef]
- Zhang, Y.; Yu, W.; Chen, X.; Jiang, J. Parallel Genetic Algorithm to Extend the Lifespan of Internet of Things in 5G Networks. IEEE Access 2020, 8, 149630–149642. [Google Scholar] [CrossRef]
- Zhang, Q.; Yang, S.; Liu, M.; Liu, J.; Jiang, L. A New Crossover Mechanism for Genetic Algorithms for Steiner Tree Optimization. IEEE Trans. Cybern. 2020, 52, 3147–3158. [Google Scholar] [CrossRef]
- Li, J.; Li, L. A Hybrid Genetic Algorithm Based on Information Entropy and Game Theory. IEEE Access 2020, 8, 36602–36611. [Google Scholar] [CrossRef]
- Liu, W.; Tao, Y.; Liu, L. Load-Balancing Routing Algorithm Based on Segment Routing for Traffic Return in LEO Satellite Networks. IEEE Access 2019, 7, 112044–112053. [Google Scholar] [CrossRef]
- Camino, J.-T.; Artigues, C.; Houssin, L.; Mourgues, S. Mixed-integer linear programming for multibeam satellite systems design: Application to the beam layout optimization. In Proceedings of the 2016 Annual IEEE Systems Conference (SysCon), Orlando, FL, USA, 18–21 April 2016; pp. 1–6. [Google Scholar]
- Shahid, S.M.; Seyoum, Y.T.; Won, S.H.; Kwon, S. Load Balancing for 5G Integrated Satellite-Terrestrial Networks. IEEE Access 2020, 8, 132144–132156. [Google Scholar] [CrossRef]
- Kyrgiazos, A.; Evans, B.; Thompson, P. Irregular beam sizes and non-uniform bandwidth allocation in HTS multibeam satellite systems. In Proceedings of the 31st AIAA International Communications Satellite Systems Conference (ICSSC), Florence, Italy, 14–17 October 2013. [Google Scholar]
- Liu, P.; Chen, H.; Wei, S.; Li, L.; Zhu, Z. Hybrid-Traffic-Detour based load balancing for onboard routing in LEO satellite networks. China Commun. 2018, 15, 28–41. [Google Scholar] [CrossRef]
- Liu, J.; Luo, R.; Huang, T.; Meng, C. A Load Balancing Routing Strategy for LEO Satellite Network. IEEE Access 2020, 8, 155136–155144. [Google Scholar] [CrossRef]
- Dong, C.; Xu, X.; Liu, A.; Liang, X. Load balancing routing algorithm based on extended link states in LEO constellation network. China Commun. 2022, 19, 247–260. [Google Scholar] [CrossRef]
- Cao, H.; Su, Y.; Zhou, Y.; Hu, J. QoS Guaranteed Load Balancing in Broadband Multi-Beam Satellite Networks. In Proceedings of the 2019 IEEE International Conference on Communications (ICC), Shanghai, China, 20–24 May 2019; pp. 1–6. [Google Scholar]


| Genetic Algorithm Mode | Modeling of Satellite User Load Balancing Based on Genetic Algorithms |
|---|---|
| Fitness Function | The throughput of adjacent Sat-Beam in the satellite service period and average waiting time for users of adjacent Sat-Beam . |
| Fitness Rules | The fitness increases with the increase of throughput and decreases with the increase of the average waiting time for users. |
| Single Optimal Solution | The load balancing scheme of the local Ser-Beams when the user density is and the serving satellite is . |
| Solution Encoding | Natural number encoding. |
| Solution Code | , denotes the access scheme of the -th F-Sat-Beams. |
| Factors Influencing the Solution | The densities variances of DoU in the direction of SSPs moving in a Ser-Beam and serving time , differences with that of adjacent Ser-Beams . |
| Selected Set of Solutions | n load balancing schemes of local Ser-Beams when the user density is and the serving satellite is |
| A Set of Solutions Selected According to Fitness | The N schemes with the highest fitness among the existing load balancing schemes |
| The Process of Coding Crossover | Select two load balancing schemes with similar fitness according to the crossover probability. Randomly select the points for crossover and exchange the elements of the corresponding points of the two solutions. |
| The Process of Coding Mutation | Select a load balancing scheme based on mutation probability. The mutation points are randomly selected, and the elements of the corresponding points of are changed according to the selection probability in the value set. |
| CAGA | PAGA | GA | |
|---|---|---|---|
| Crossover | Two-point crossover | Two-point crossover | Two-point crossover |
| Mutation | Single-point mutation | Single-point mutation | Single-point mutation |
| Select | Tournament | Tournament | Tournament |
| Crossover Probability | Base probability 0.6 | Base probability 0.6 | fixed probability 0.6 |
| Mutation Probability | Base probability 0.1 | Base probability 0.1 | fixed probability 0.1 |
| Population Size | 40/60/ 80/100 | 40/60/ 80/100 | 40/60/ 80/100 |
| Evolution Generation | 0:200:2000 | 0:200:2000 | 0:200:2000 |
| Elitist Preservation | use | use | use |
| Termination Condition | Reach the maximum evolutionary generation | Reach the maximum evolutionary generation | Reach the maximum evolutionary generation |
| Number of F-Ser-Beam | 9 |
|---|---|
| Traffic Value of F-Ser-Beam | 400M |
| User Density of Target F-Sat-Beam | 0.5: 0.04: 0.9 |
| User Density of Adjacent F-Sat-Beam | 0.5/0.6/0.7/0.8 |
| Satellite Total Bandwidth | 2G |
| Average Traffic Value of User Request | 15M |
| Average Arrival Rate of User Request | 0.6 |
Publisher’s Note: MDPI stays neutral with regard to jurisdictional claims in published maps and institutional affiliations. |
© 2022 by the authors. Licensee MDPI, Basel, Switzerland. This article is an open access article distributed under the terms and conditions of the Creative Commons Attribution (CC BY) license (https://creativecommons.org/licenses/by/4.0/).
Share and Cite
Lin, W.; Dong, Z.; Wang, K.; Wang, D.; Deng, Y.; Liao, Y.; Liu, Y.; Wan, D.; Xu, B.; Wu, G. A Novel Load Balancing Scheme for Satellite IoT Networks Based on Spatial–Temporal Distribution of Users and Advanced Genetic Algorithms. Sensors 2022, 22, 7930. https://doi.org/10.3390/s22207930
Lin W, Dong Z, Wang K, Wang D, Deng Y, Liao Y, Liu Y, Wan D, Xu B, Wu G. A Novel Load Balancing Scheme for Satellite IoT Networks Based on Spatial–Temporal Distribution of Users and Advanced Genetic Algorithms. Sensors. 2022; 22(20):7930. https://doi.org/10.3390/s22207930
Chicago/Turabian StyleLin, Wenliang, Zewen Dong, Ke Wang, Dongdong Wang, Yaohua Deng, Yicheng Liao, Yang Liu, Da Wan, Bingyu Xu, and Genan Wu. 2022. "A Novel Load Balancing Scheme for Satellite IoT Networks Based on Spatial–Temporal Distribution of Users and Advanced Genetic Algorithms" Sensors 22, no. 20: 7930. https://doi.org/10.3390/s22207930