
Acoustic Power Measurement and Thermal Bioeffect Evaluation of Therapeutic Langevin Transducers


Abstract
:1. Introduction
2. Materials and Methods
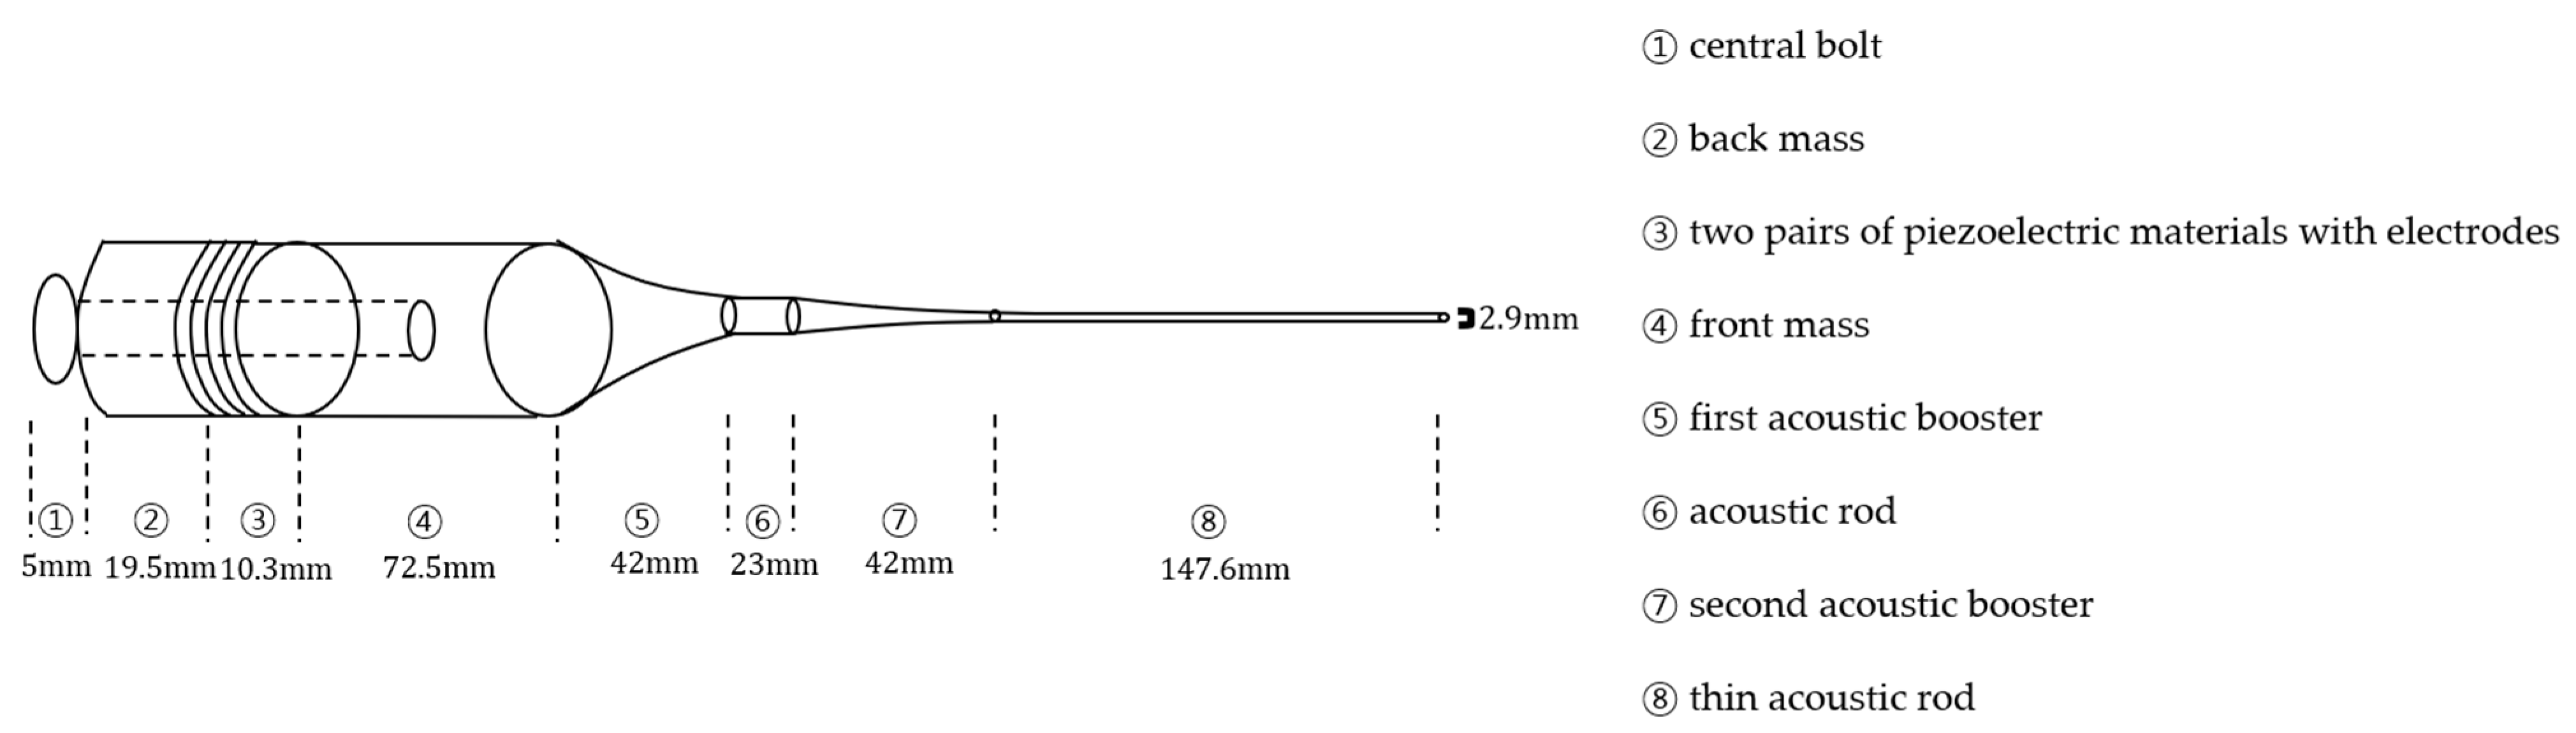
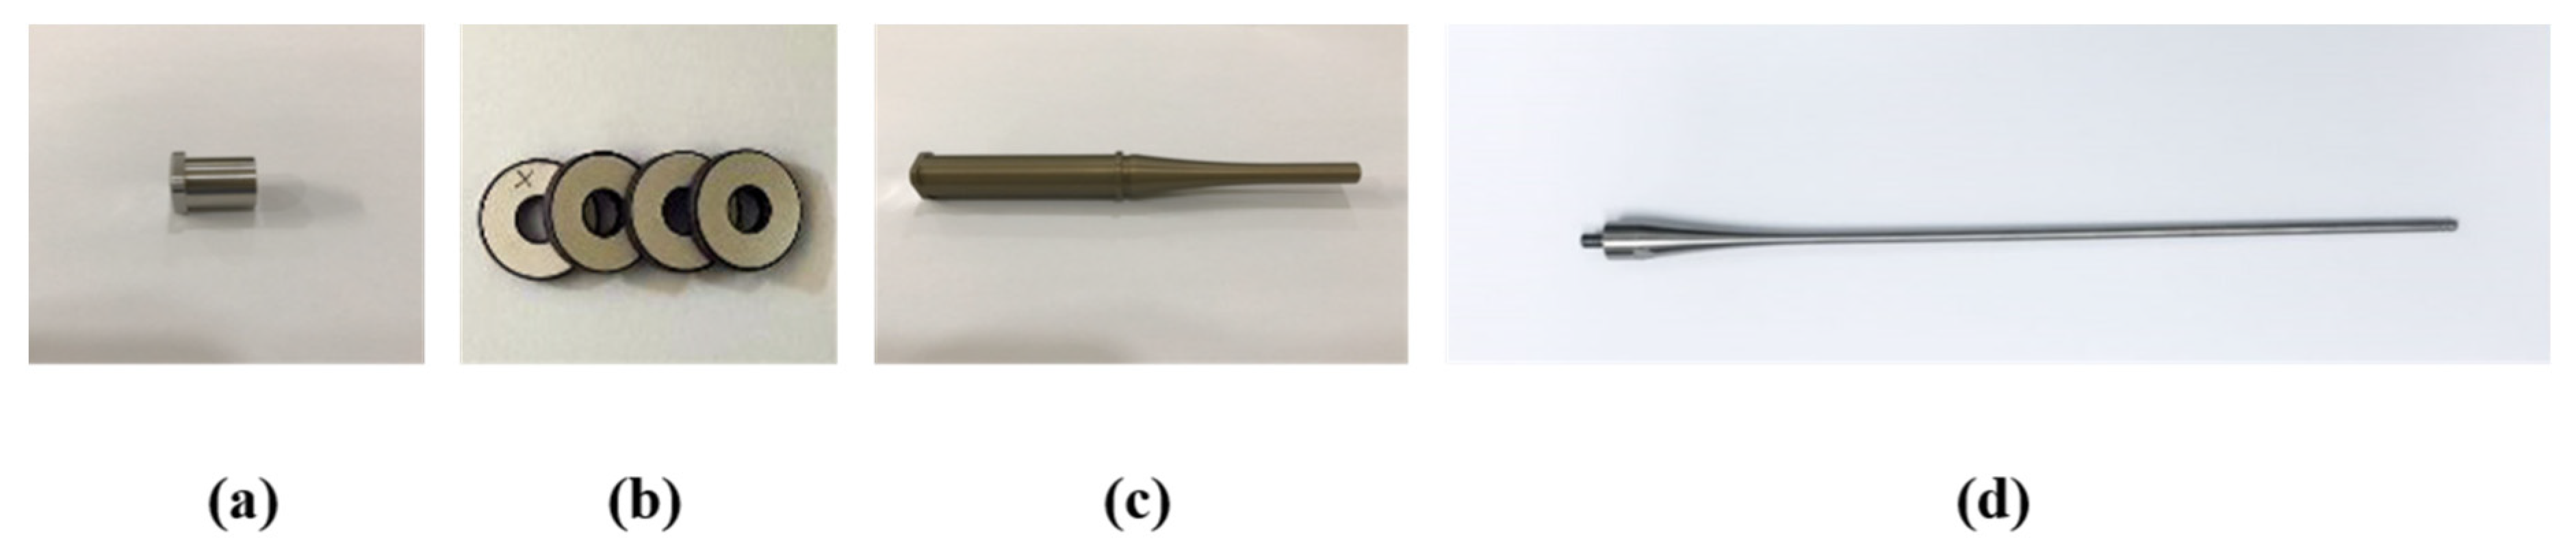
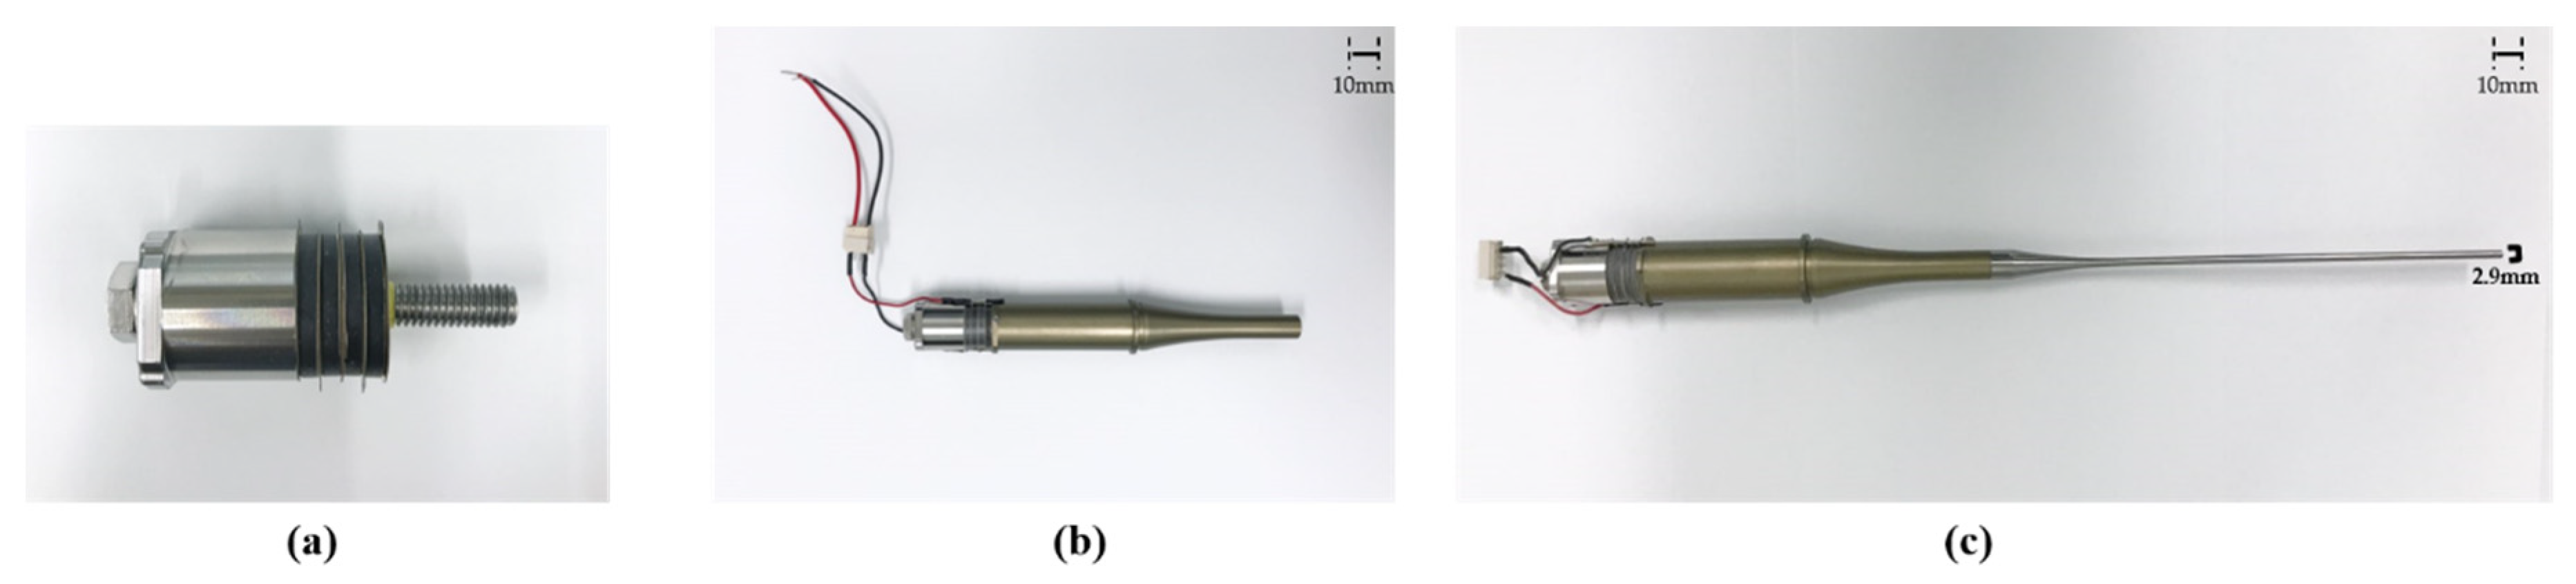
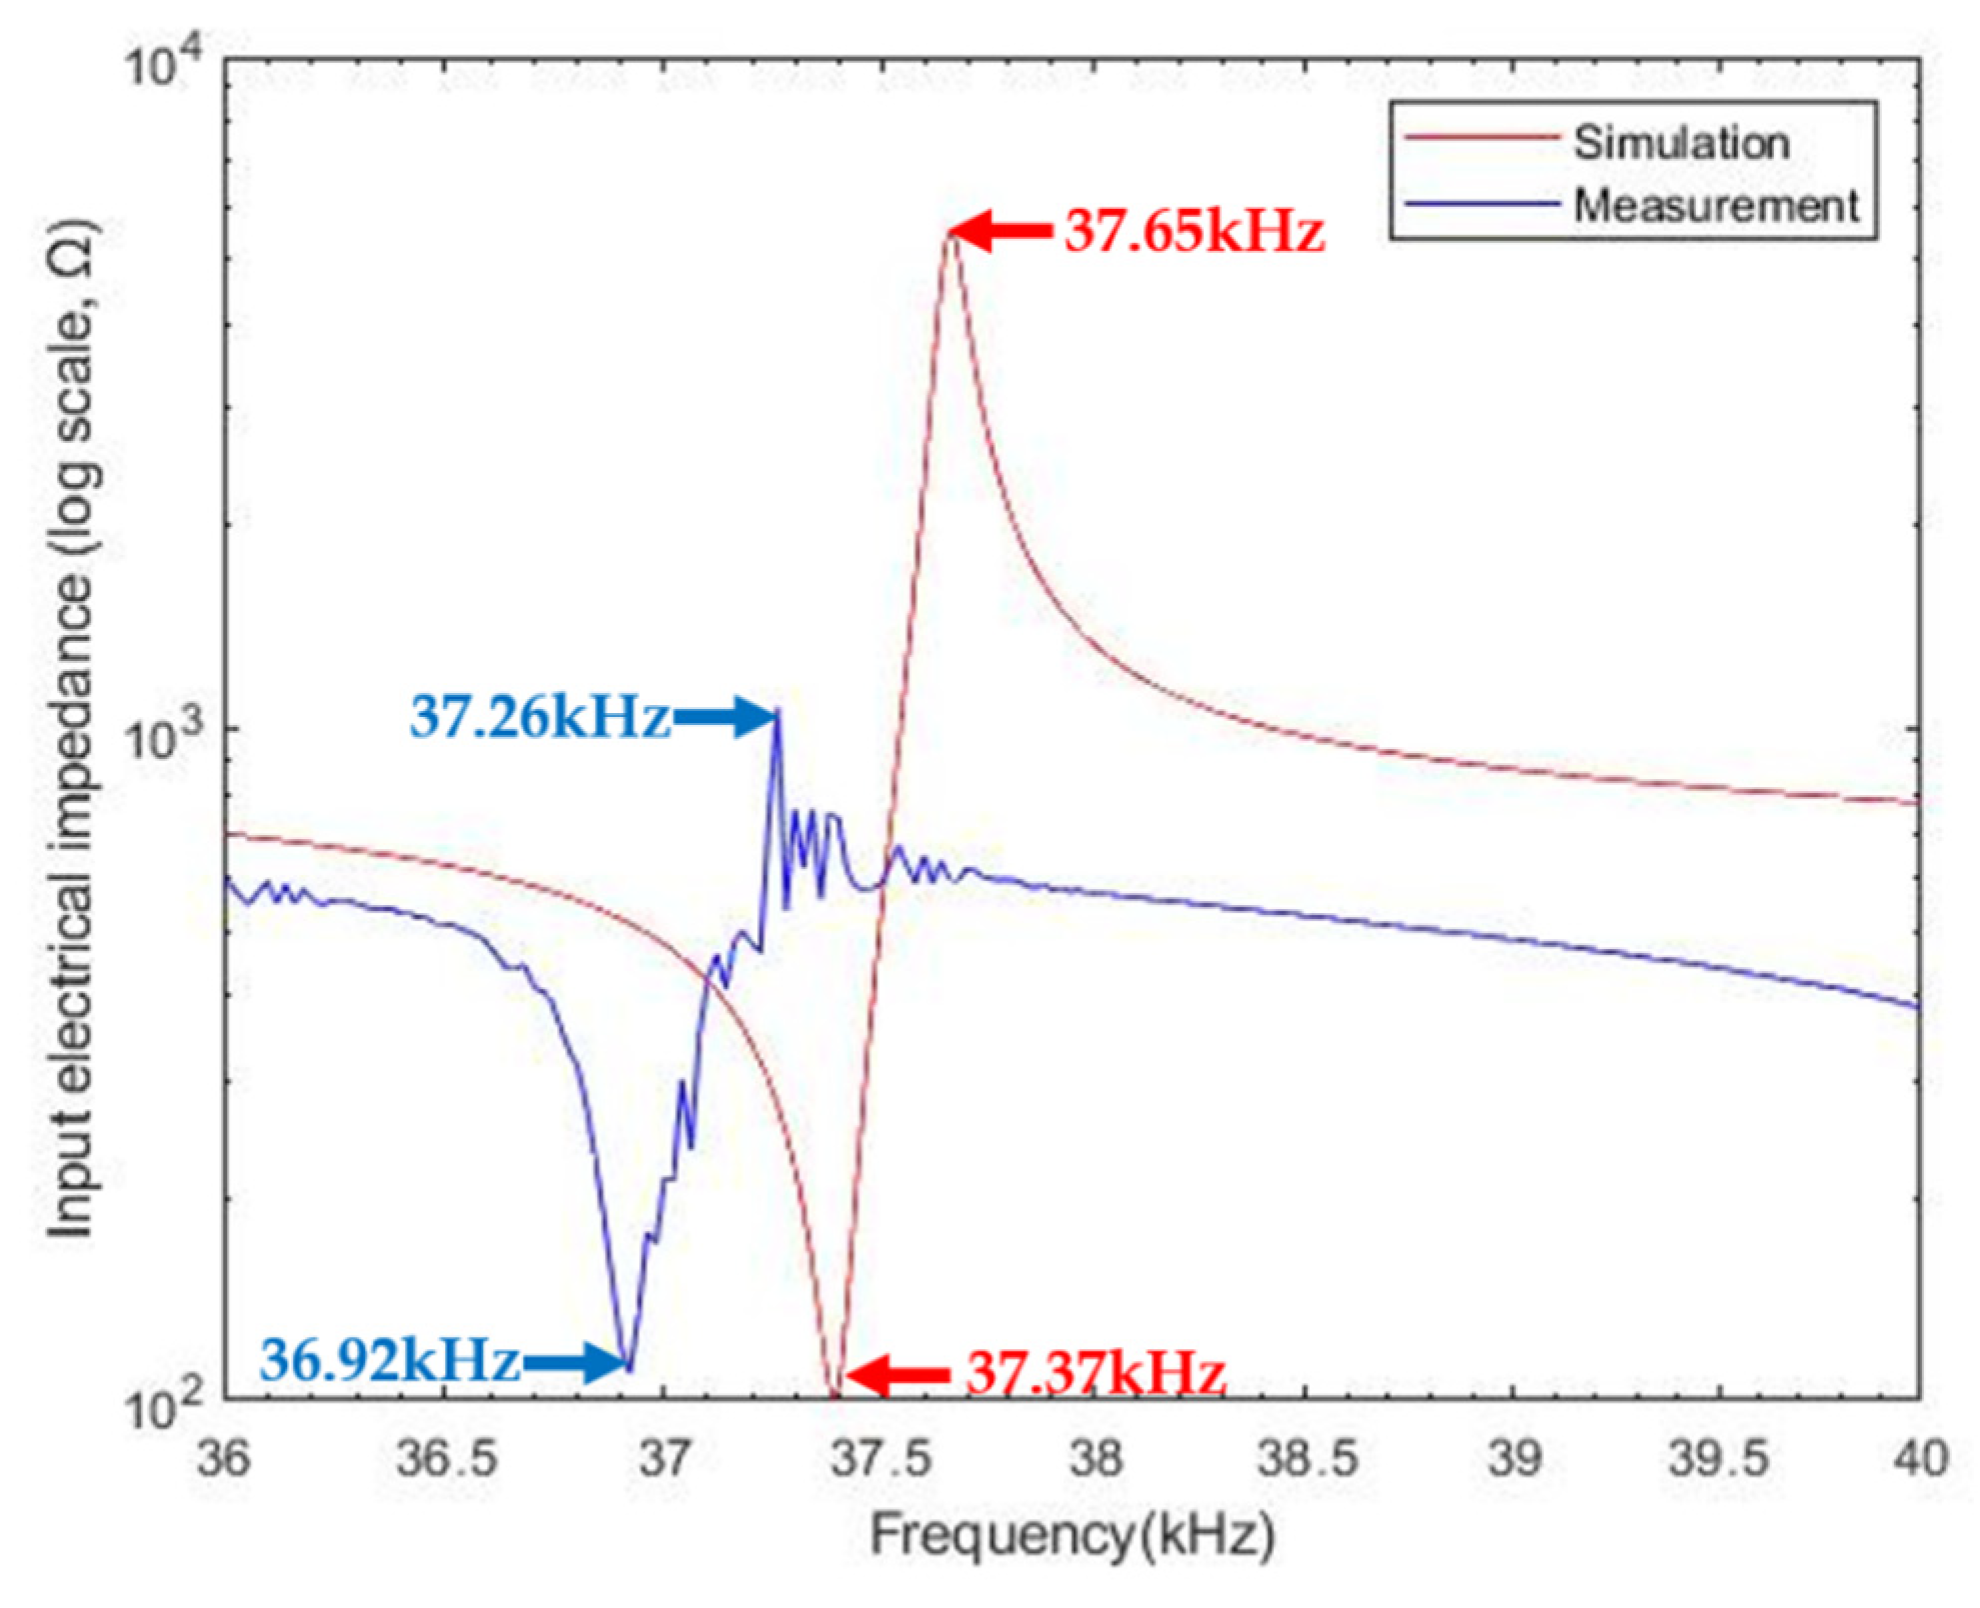
2.1. Design and Fabrication of Langevin Transducer
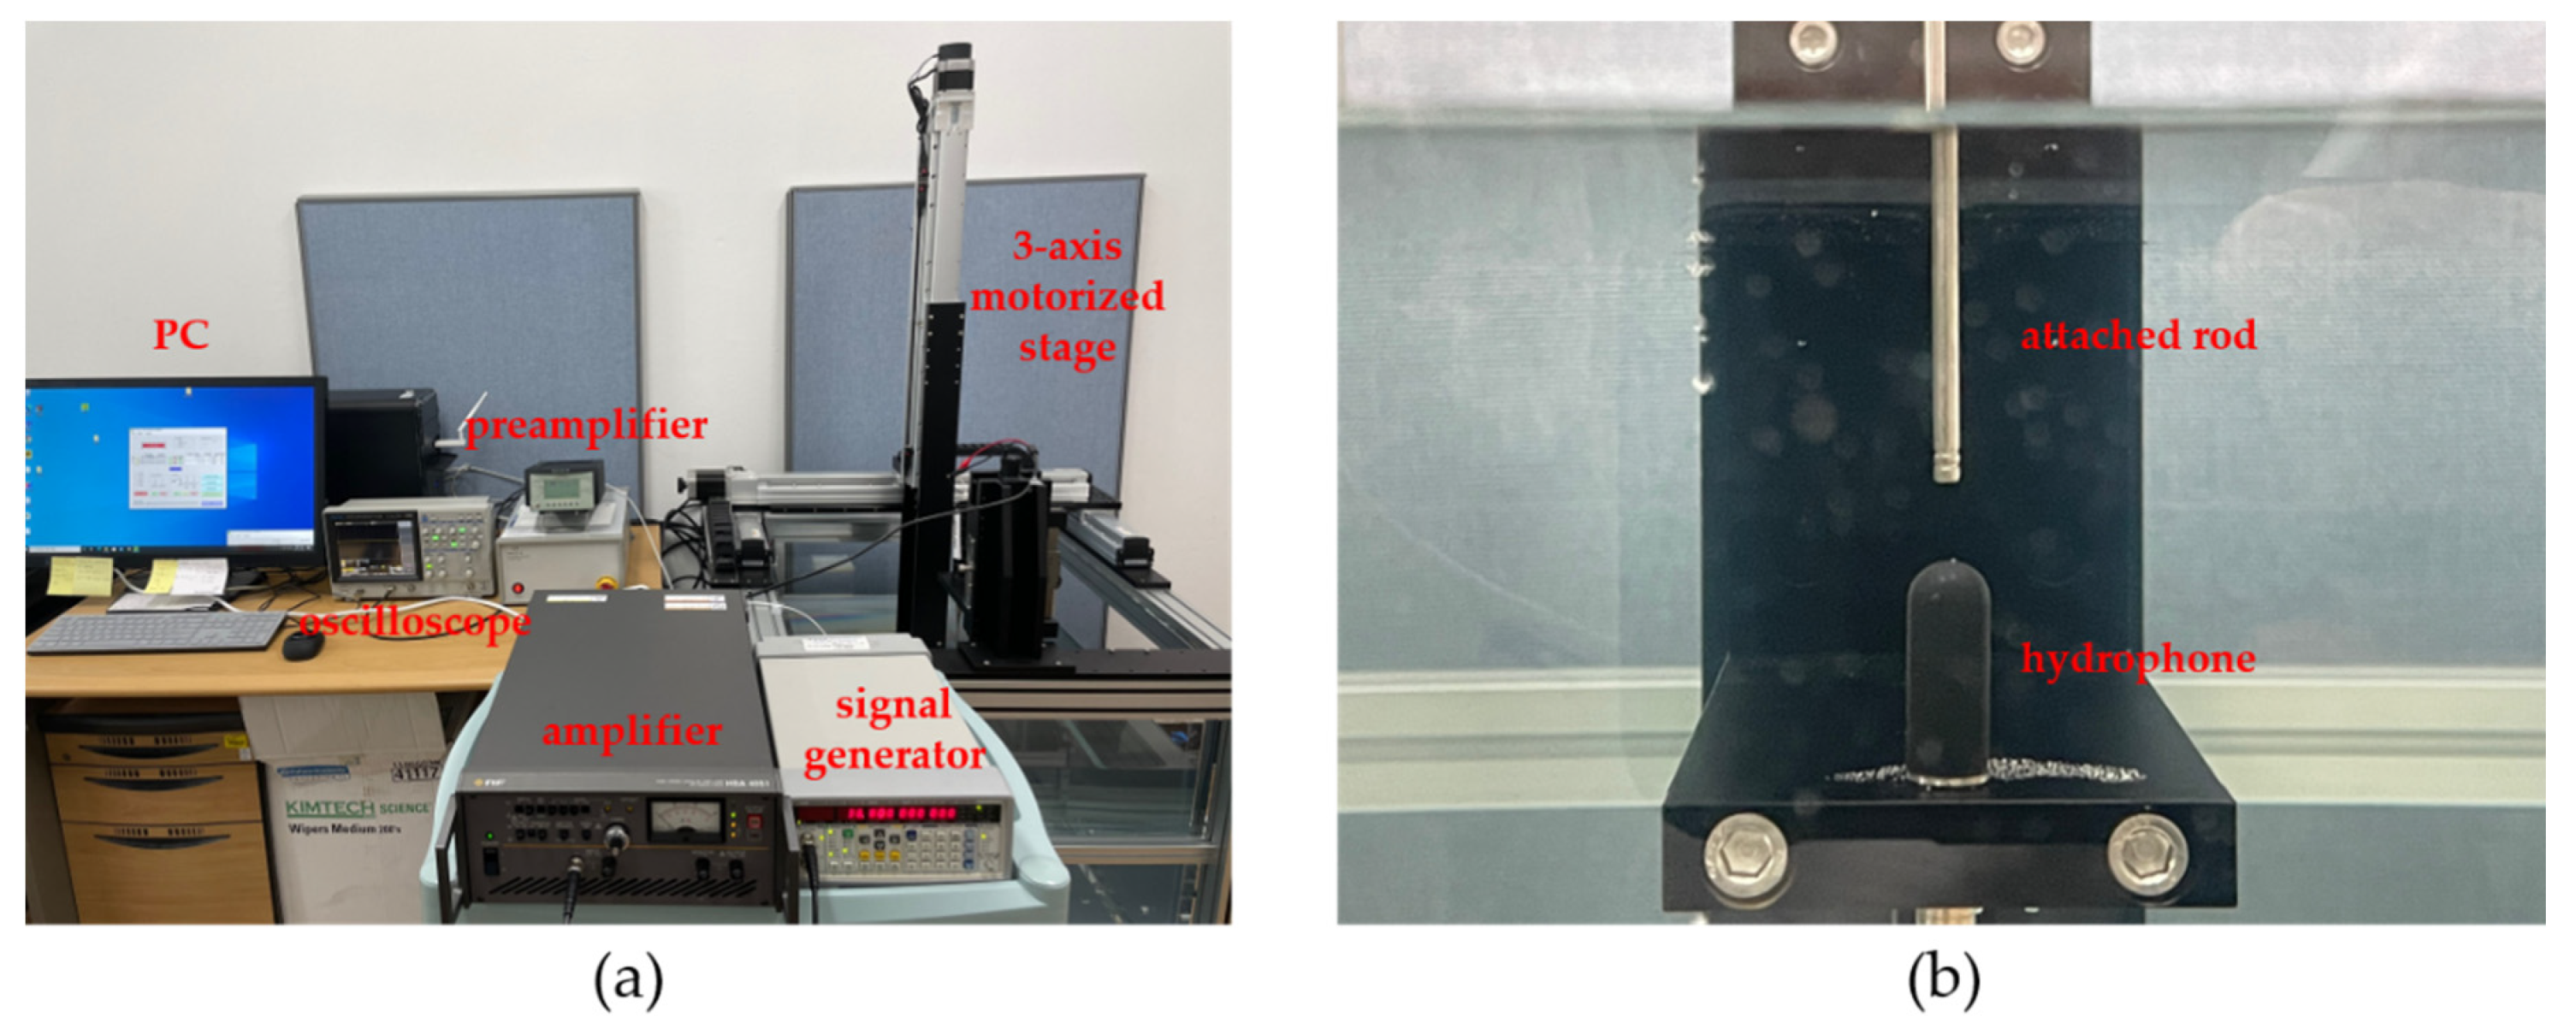
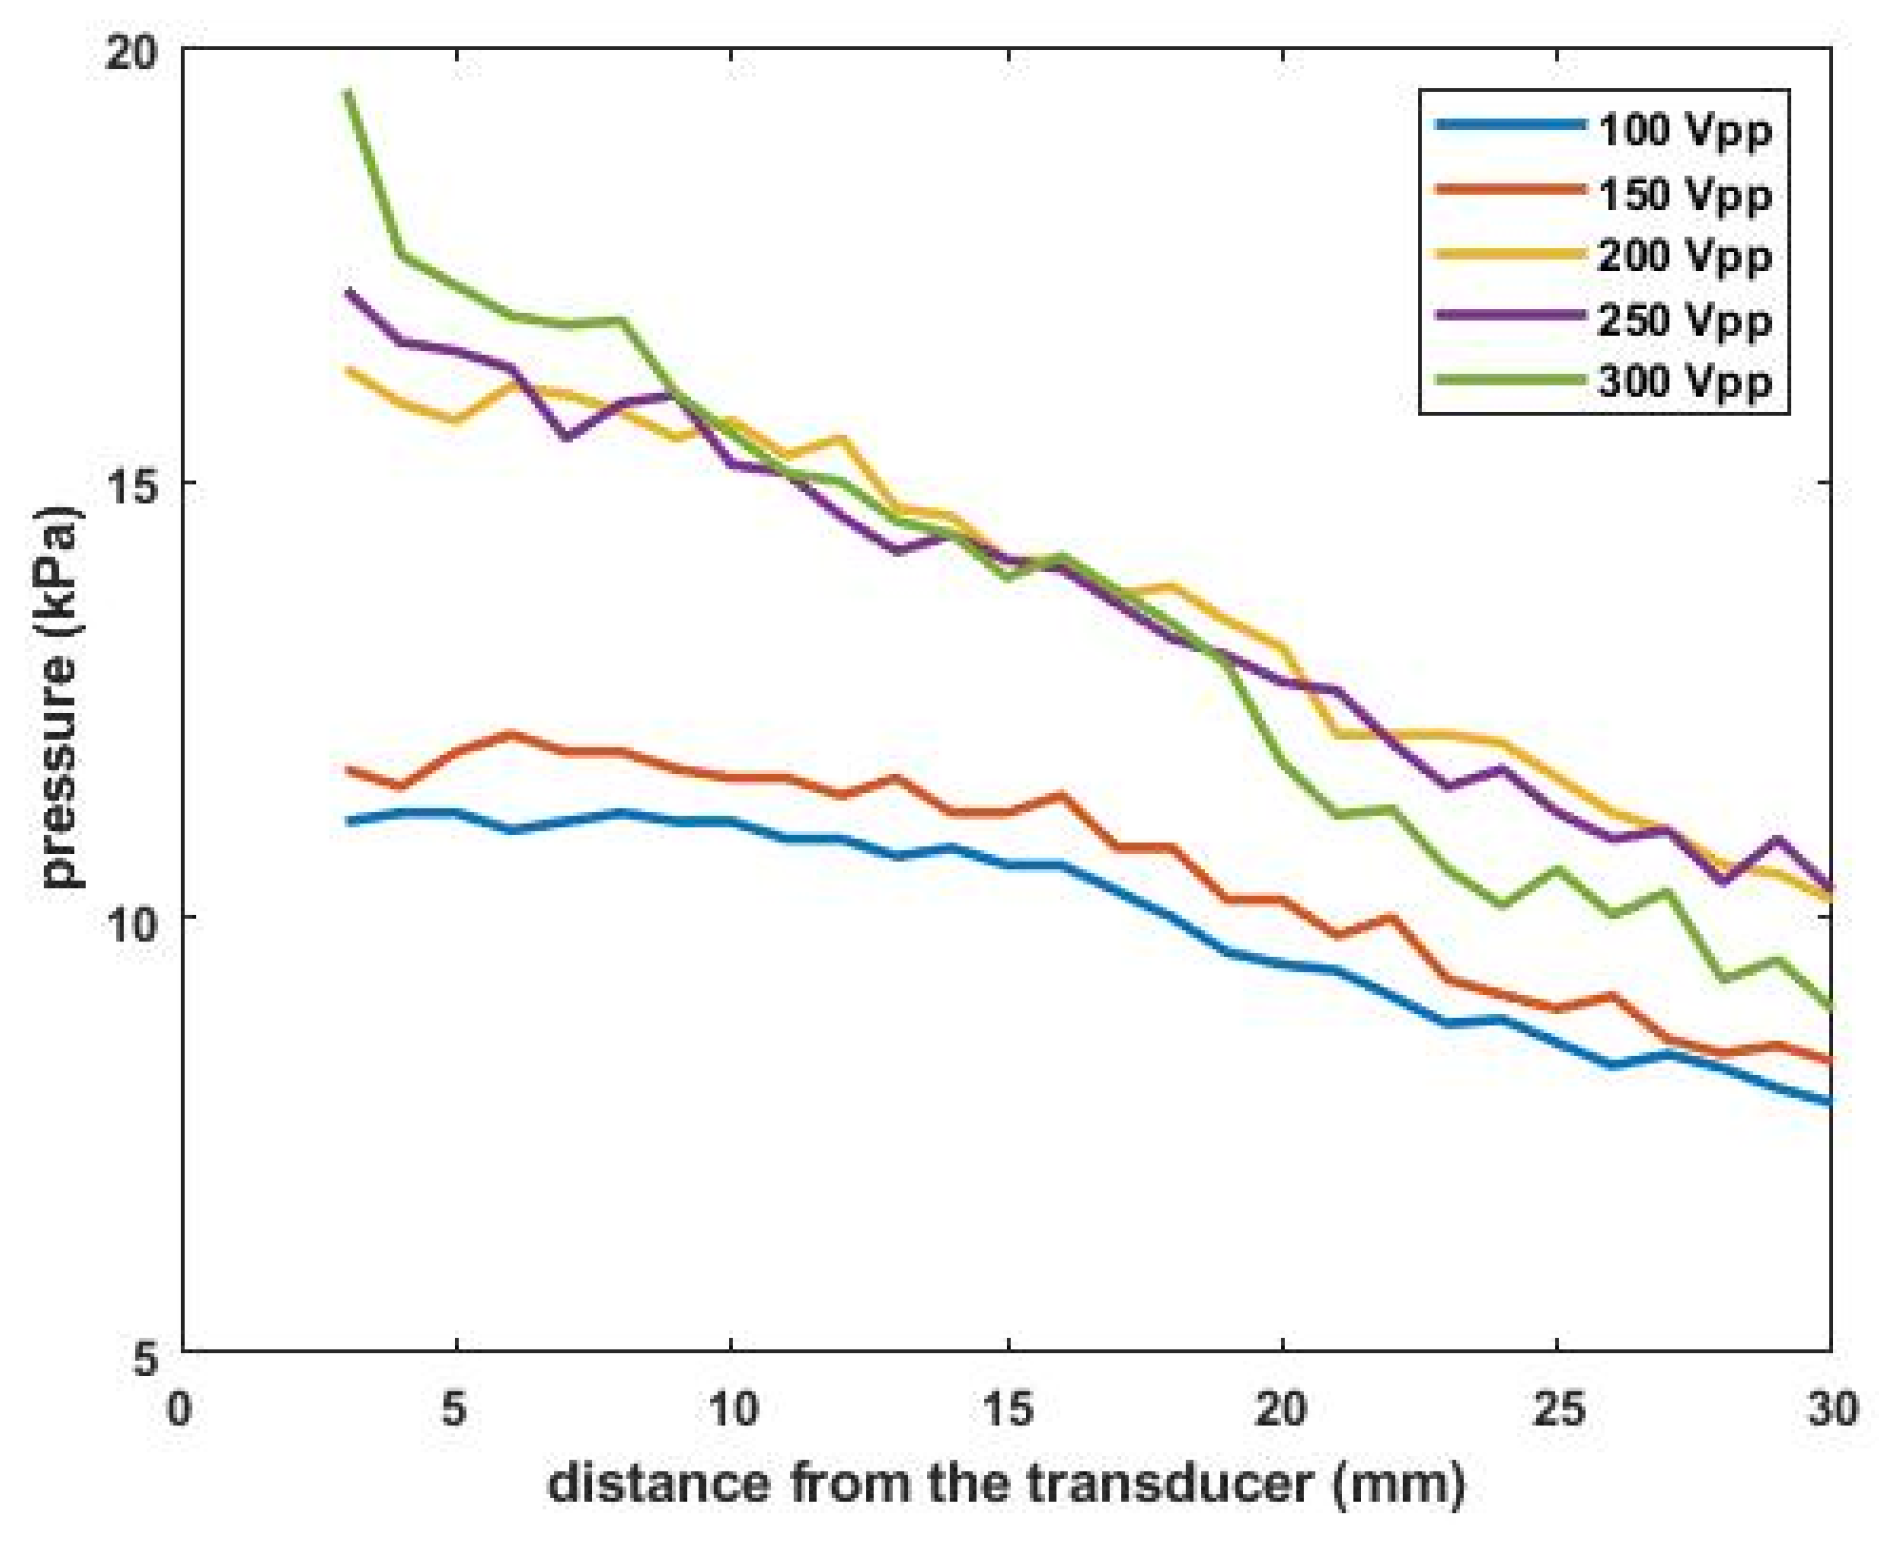
2.2. Calibration of Acoustic Pressure
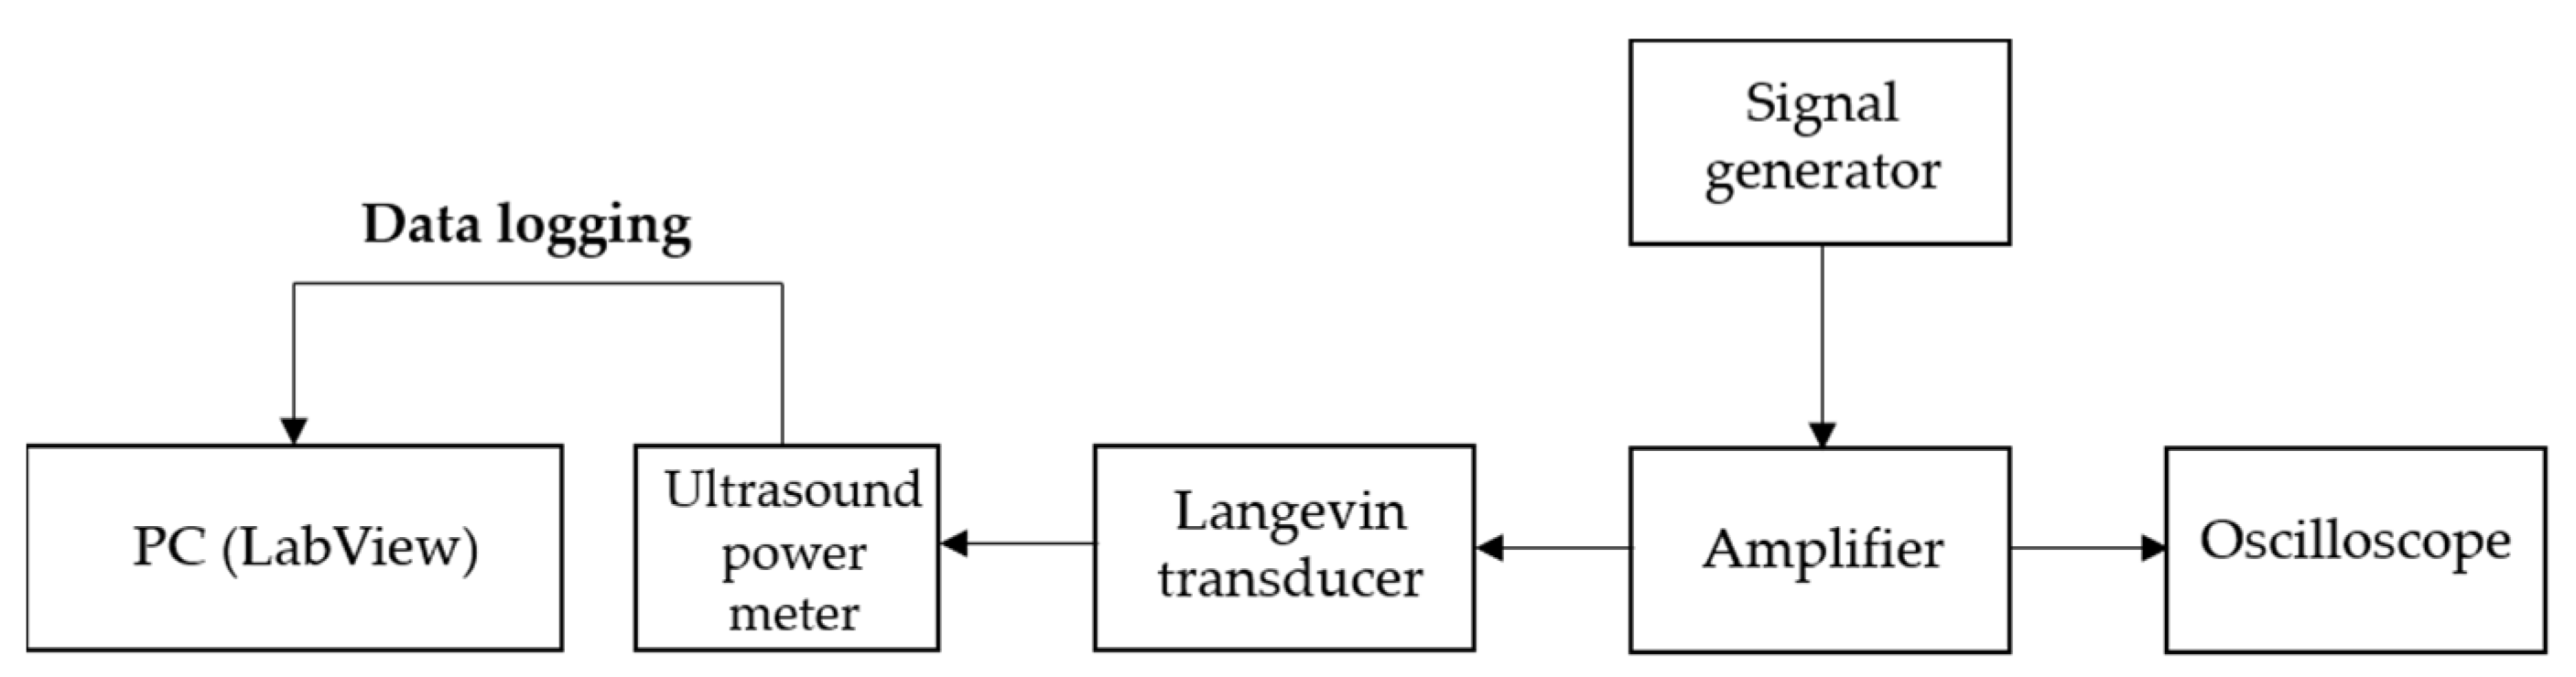
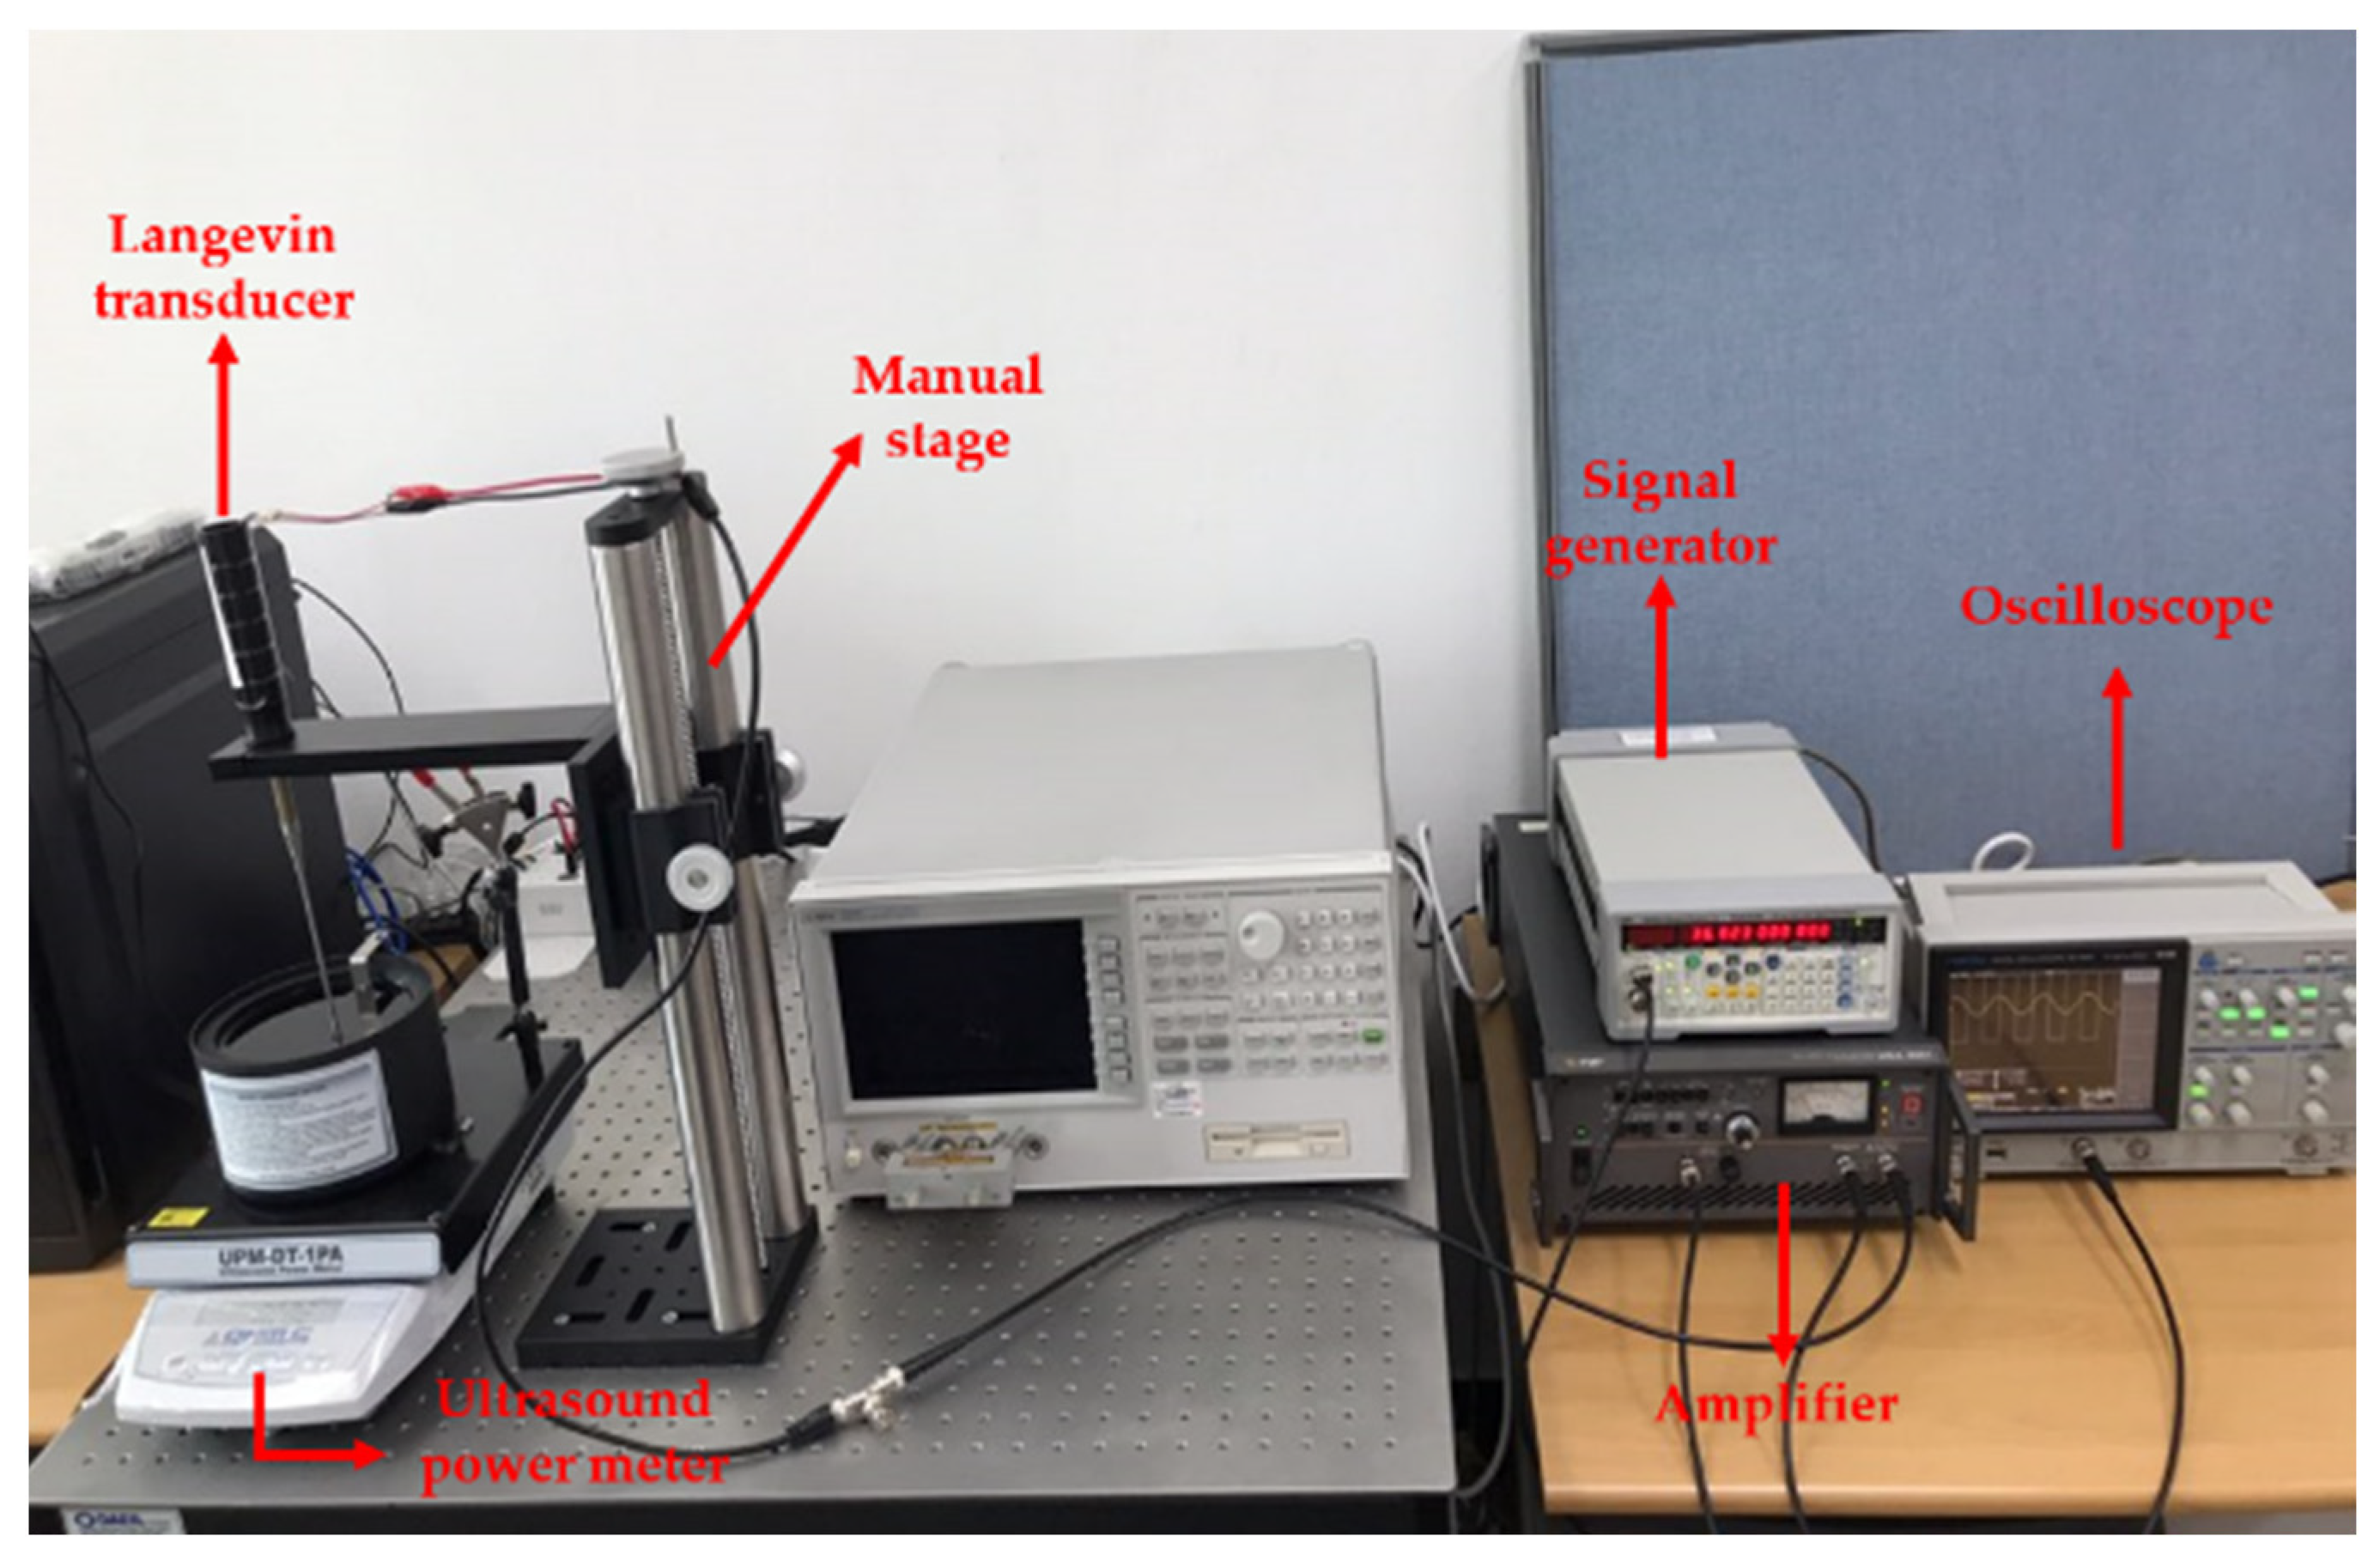
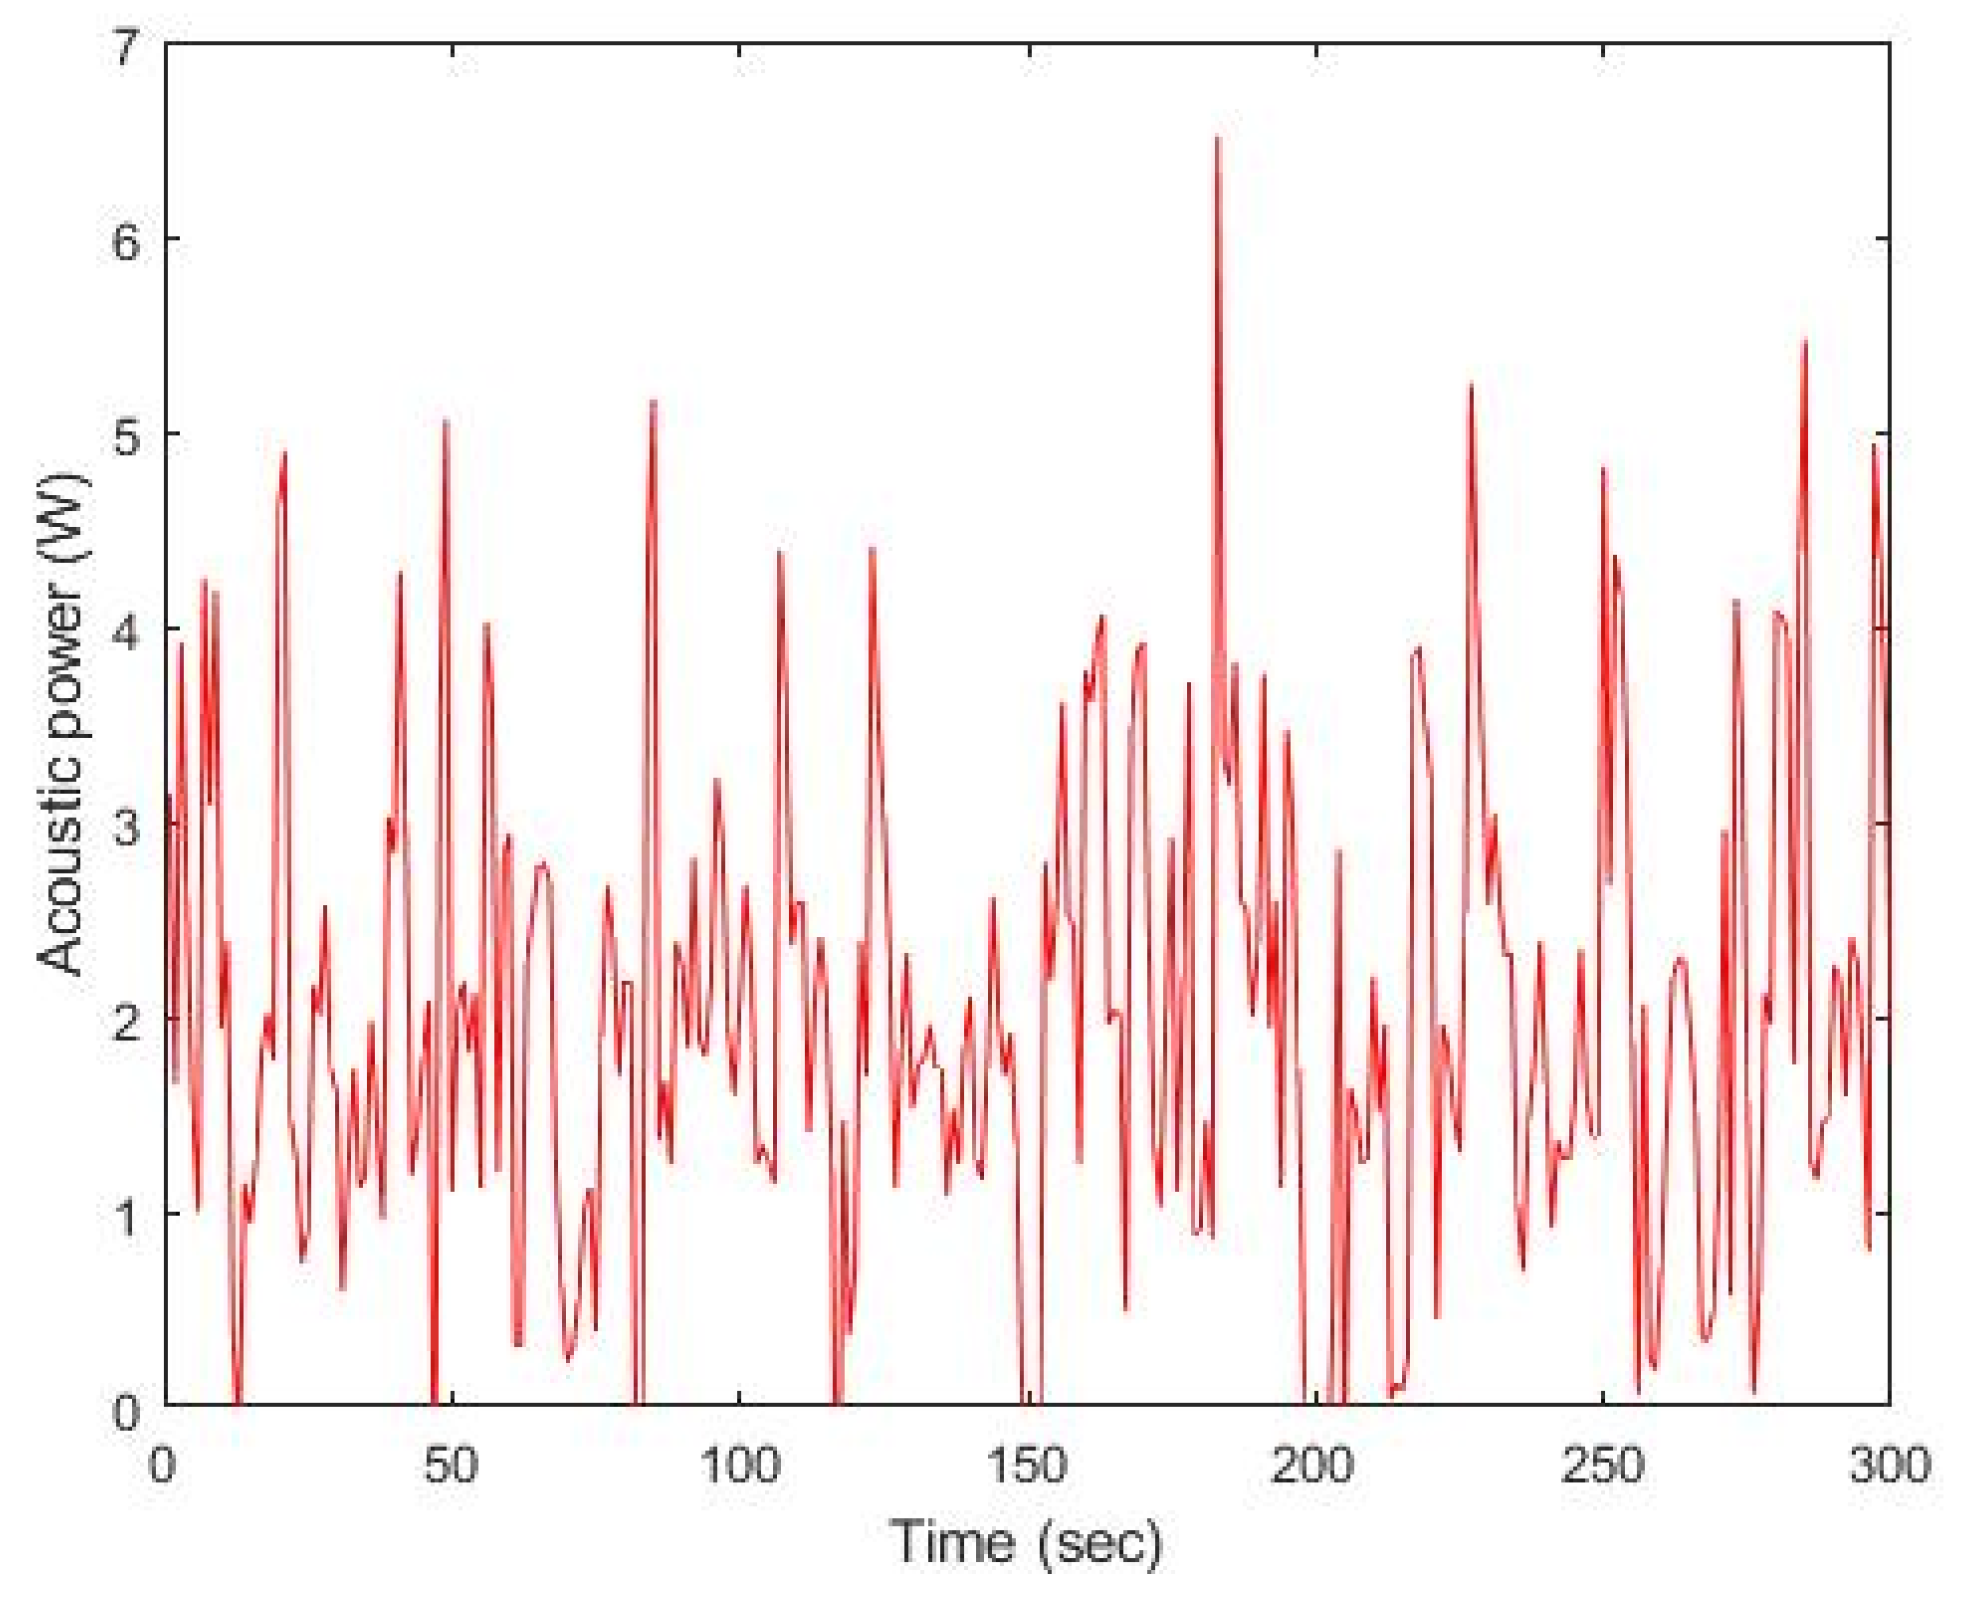
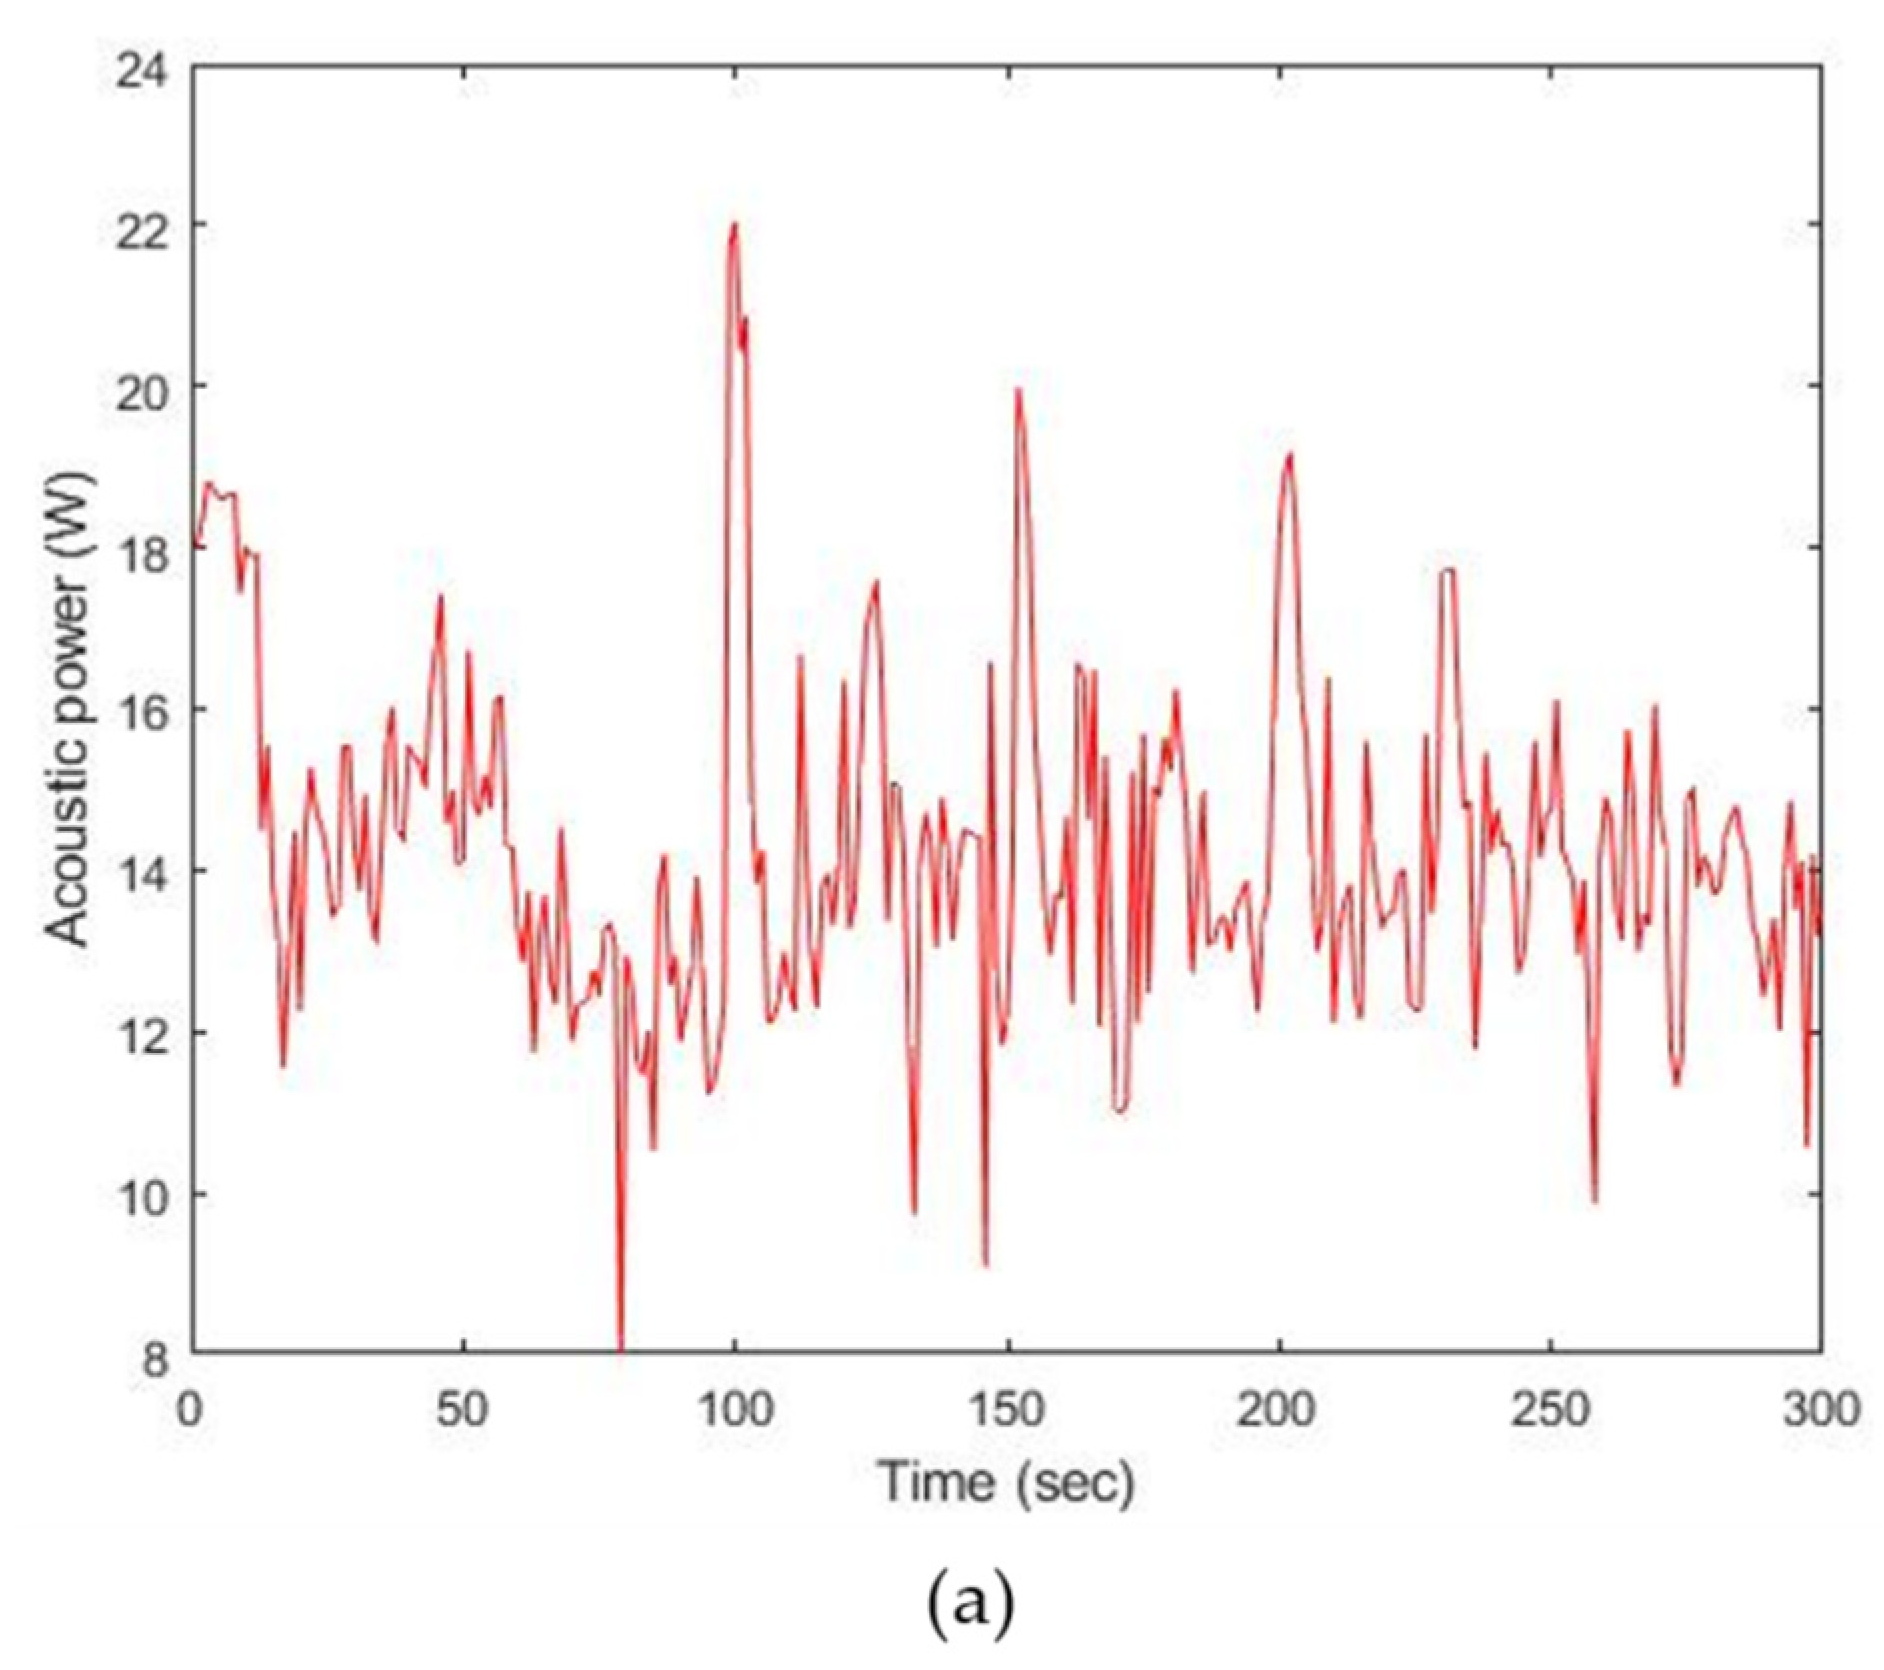
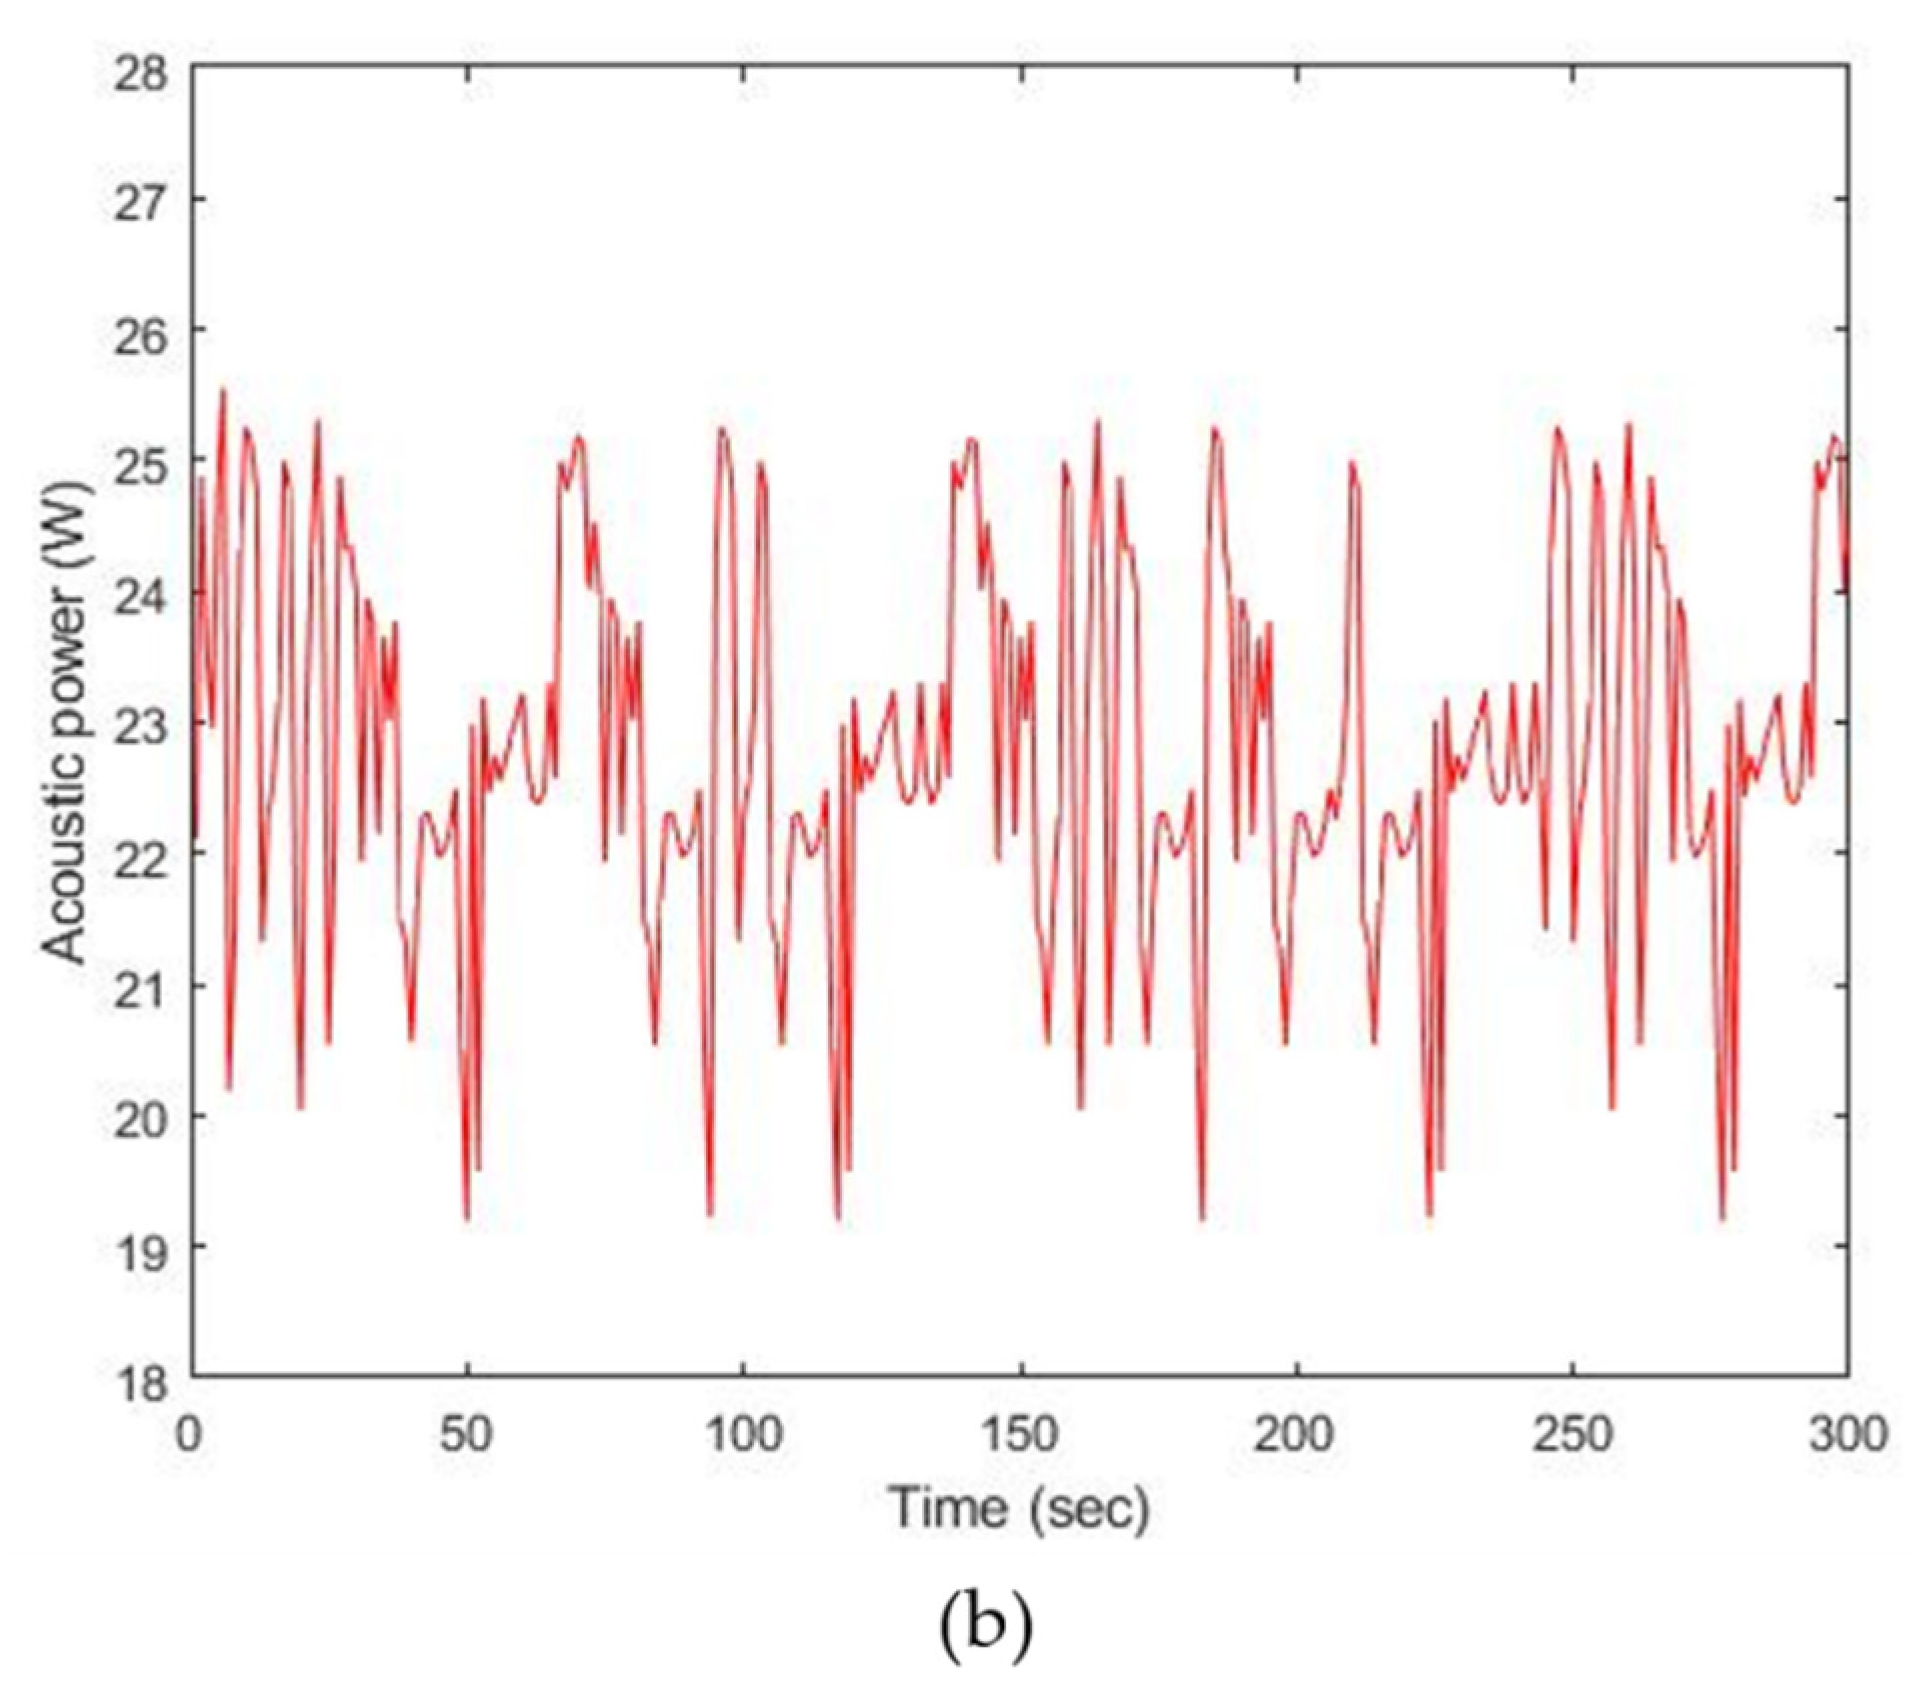
2.3. Acoustic Power Measurement
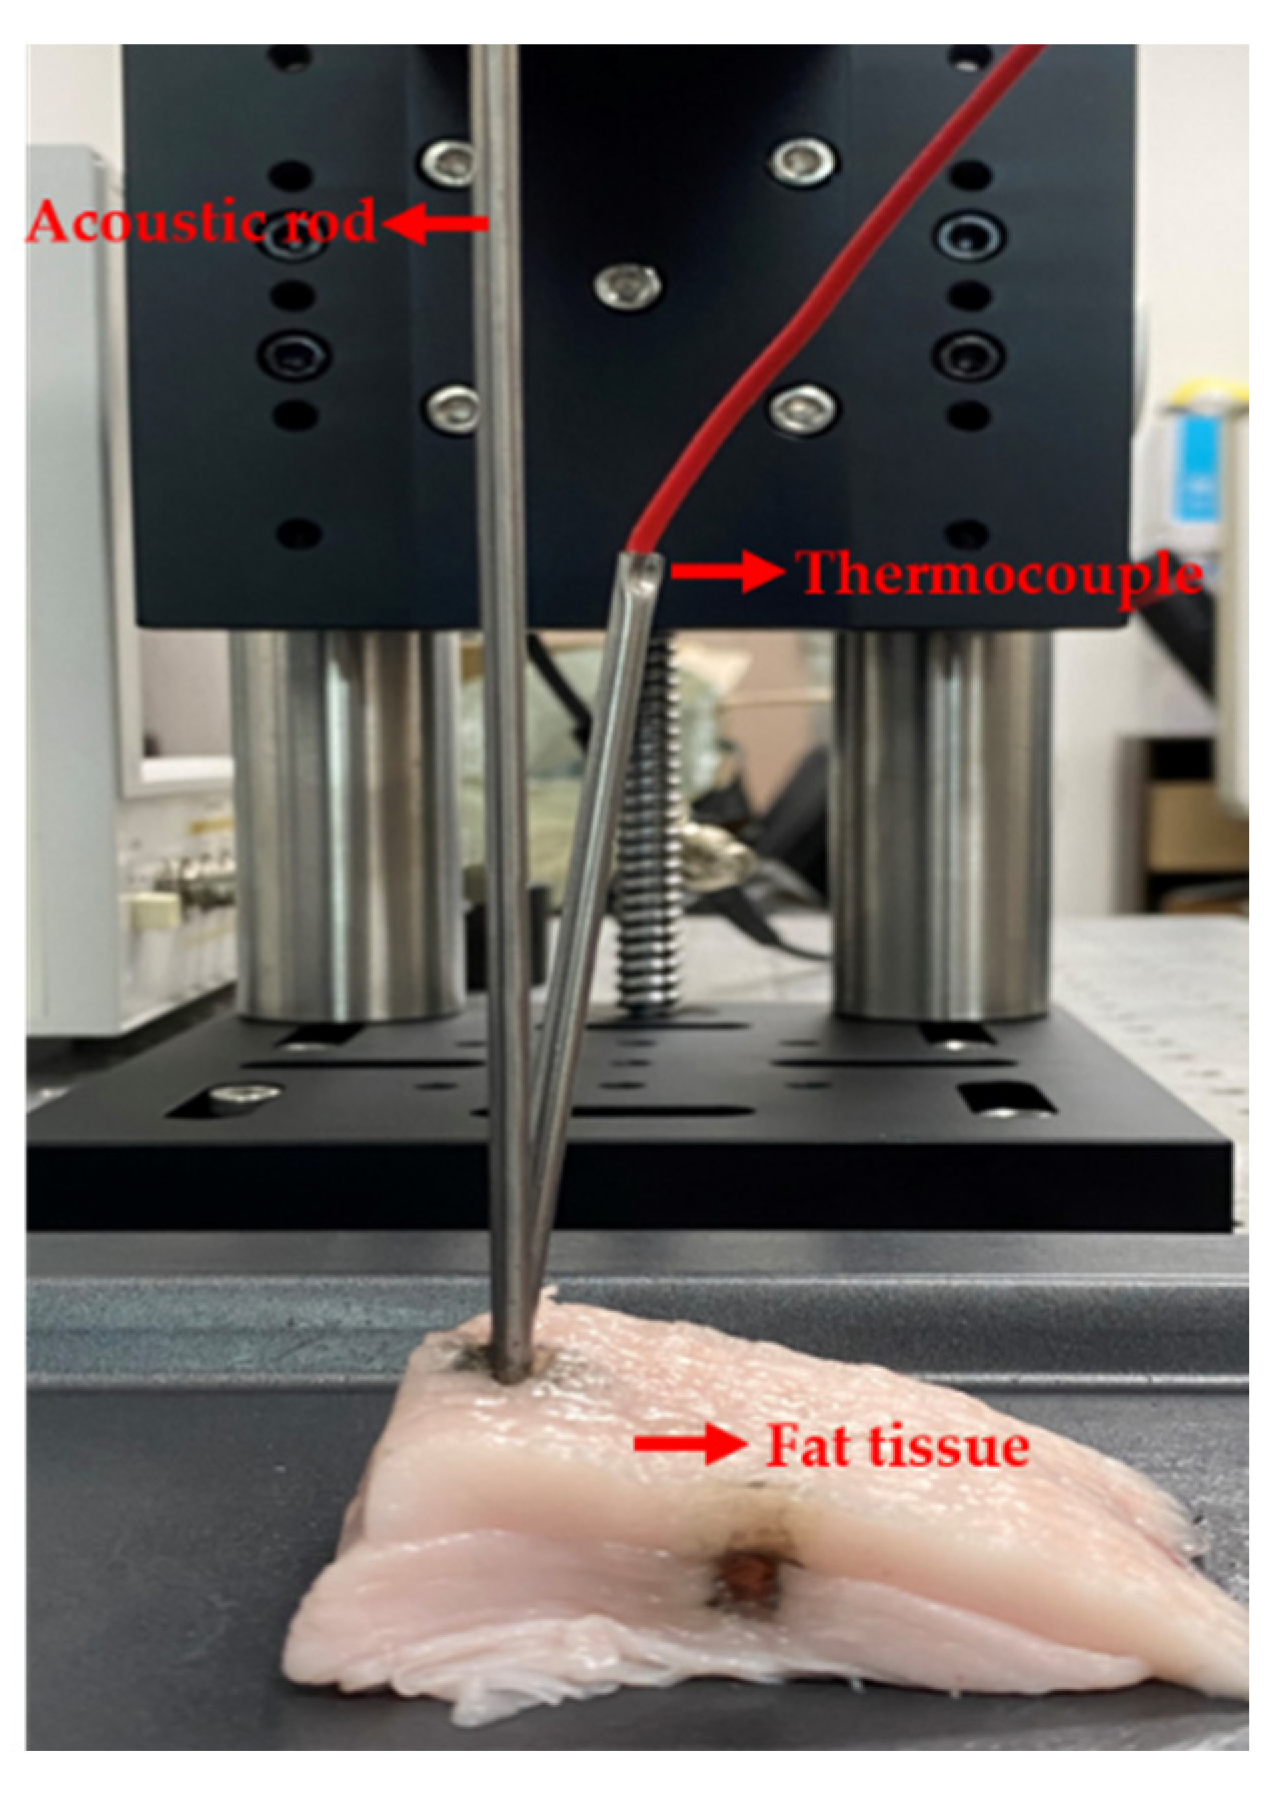
2.4. Tracking of Temperature Variation and Evaluation of Thermal Index (TI)
2.5. Thermal Index (TI)
3. Results and Discussion
4. Conclusions
Author Contributions
Funding
Conflicts of Interest
References
- Bilek, S.E.; Turantaş, F. Decontamination efficiency of high power ultrasound in the fruit and vegetable industry, a review. Int. J. Food Microbiol. 2013, 166, 155–162. [Google Scholar] [CrossRef] [Green Version]
- Chemat, F.; Zill-e-Huma; Khan, M.K. Applications of ultrasound in food technology: Processing, preservation and extraction. Ultrason Sonochem. 2011, 18, 813–835. [Google Scholar] [CrossRef]
- Cintas, P.; Palmisano, G.; Cravotto, G. Power ultrasound in metal-assisted synthesis: From classical Barbier-like reactions to click chemistry. Ultrason Sonochem. 2011, 18, 836–841. [Google Scholar] [CrossRef]
- Li, X.; Stritch, T.; Lucas, M. Design of Miniature Ultrasonic Surgical Devices. In Proceedings of the IEEE International Ultrasonics Symposium, IUS, Glasgow, Scotland, 6–9 October 2019; pp. 2641–2644. [Google Scholar] [CrossRef]
- Henzi, S.; Krayenbühl, N.; Bozinov, O.; Regli, L.; Stienen, M.N. Ultrasonic aspiration in neurosurgery: Comparative analysis of complications and outcome for three commonly used models. Acta Neurochir. 2019, 161, 2073–2082. [Google Scholar] [CrossRef] [Green Version]
- Abdullah, A.; Shahini, M.; Pak, A. An approach to design a high power piezoelectric ultrasonic transducer. J. Electroceram. 2009, 22, 369–382. [Google Scholar] [CrossRef]
- Lin, J.; Lin, S.; Xu, J. Analysis and experimental validation of longitudinally composite ultrasonic transducers. J. Acoust. 2019, 145, 263–271. [Google Scholar] [CrossRef] [PubMed]
- Kim, J.; Lee, J. Theoretical Resonance Analysis of Langevin Transducers with Equivalent Circuit Models for Therapeutic Ultrasound. J. Electr. Eng. Technol. 2019, 14, 2437–2445. [Google Scholar] [CrossRef]
- Kim, J.; Lee, J. Parametric study of bolt clamping effect on resonance characteristics of langevin transducers with lumped circuit models. Sensors 2020, 20, 1952. [Google Scholar] [CrossRef] [Green Version]
- Lin, S.; Xu, C. Analysis of the sandwich ultrasonic transducer with two sets of piezoelectric elements. Smart Mater. Struct. 2008, 17, 065008. [Google Scholar] [CrossRef]
- Sohn, C.H.; Park, J.H. A comparative study on acoustic damping induced by half-wave, quarter-wave, and Helmholtz resonators. Aerosp. Sci. Technol. 2011, 15, 606–614. [Google Scholar] [CrossRef]
- Nakao, M.; Imashiro, C.; Kuribara, T.; Kurashina, Y.; Totani, K.; Takemura, K. Formation of large scaffold-free 3-D aggregates in a cell culture dish by ultrasound standing wave trapping. Ultrasound Med. Biol. 2019, 45, 1306–1315. [Google Scholar] [CrossRef] [Green Version]
- Church, C.C. A Proposal to Clarify the Relationship between the Thermal Index and the Corresponding Risk to the Patient. Ultrasound Med. Biol. 2007, 33, 1489–1494. [Google Scholar] [CrossRef]
- Bigelow, T.A.; Church, C.C.; Sandstrom, K.; Abbott, J.G.; Ziskin, M.C.; Edmonds, P.D.; Herman, B.; Thomenius, K.E.; Teo, T.J. The Thermal Index. J. Ultrasound Med. 2011, 30, 714–734. [Google Scholar] [CrossRef] [PubMed]
- Martin, K. Special Feature The acoustic safety of new ultrasound technologies. Ultrasound 2015, 18, 110–118. [Google Scholar] [CrossRef]
- Horder, M.M.; Barnett, S.B.; Vella, G.J.; Edwards, M.J.; Wood, A.K.W. In vivo heating of the guinea-pig fetal brain by pulsed ultrasound and estimates of thermal index. Ultrasound Med. Biol. 1998, 24, 1467–1474. [Google Scholar] [CrossRef]
- Hamilton, M.F.; Blackstock, D.T. Nonlinear Acoustics; Academic Press: Cambridge, MA, USA, 1998; pp. 25–139. [Google Scholar]
- Muhr, M.; Nikolić, V.; Wohlmuth, B.; Wunderlich, L. Isogeometric shape optimization for nonlinear ultrasound focusing. Evol. Equ. 2019, 8, 163–202. [Google Scholar] [CrossRef] [Green Version]
- Kuang, Y.; Jin, Y.; Cochran, S.; Huang, Z. Resonance tracking and vibration stablilization for high power ultrasonic transducers. Ultrasonics 2014, 54, 187–194. [Google Scholar] [CrossRef]
- Zhang, H.; Wang, F.; Zhang, D.; Wang, L.; Hou, Y.; Xi, T. A new automatic resonance frequency tracking method for piezoelectric ultrasonic transducers used in thermosonic wire bonding. Sens. Actuators A Phys. 2015, 235, 140–150. [Google Scholar] [CrossRef]
- Aurelle, N.; Guyomar, D.; Eyraud, L. Power limitations in acoustic transducer due to PZT material nonlinearities. In Proceedings of the 3rd International Conference on Intelligent Materials and 3rd European Conference on Smart Structures and Materials, Lyon, France, 3–5 June 1996; Volume 2779, p. 592. [Google Scholar] [CrossRef]
- Karagoz, I.; Kartal, M.K. Evaluation of nonscanned mode soft-tissue thermal index in the presence of the residual temperature rise. Ultrasound Med. Biol. 2006, 32, 741–750. [Google Scholar] [CrossRef]
- Abramowicz, J.S. An Increased Thermal Index Can Be Achieved When Performing Doppler Studies in Obstetric Sonography. Mi. J. Ultrasound Med. 2007, 26, 71–76. [Google Scholar]
- Solovchuk, M.A.; Hwang, S.C.; Chang, H.; Thiriet, M.; Sheu, T.W.H. Temperature elevation by HIFU in ex vivo porcine muscle: MRI measurement and simulation study. J. Med. Phys. 2014, 41, 052903. [Google Scholar] [CrossRef] [Green Version]
- Al-Bataineh, O.; Jenne, J.; Huber, P. Clinical and future applications of high intensity focused ultrasound in cancer. Cancer Treat. Rev. 2012, 38, 346–353. [Google Scholar] [CrossRef] [PubMed]
- Hoang, V.; Doan, M.; Nguyen, V.T.; Choi, J.; Park, S. Fuzzy Logic Control-Based HIFU System Integrated with Photoacoustic Imaging Module for Ex Vivo Artificial Tumor Treatment. Appl. Sci. 2020, 10, 7888. [Google Scholar]
- Napoli, A.; Anzidei, M.; Ciolina, F.; Marotta, E.; Marincola, B.C.; Brachetti, G.; Di Mare, L.; Cartocci, G.; Boni, F.; Noce, V.; et al. MR-guided high-intensity focused ultrasound: Current status of an emerging technology. Cardiovasc. Intervent. Radiol. 2013, 36, 1190–1203. [Google Scholar] [CrossRef] [PubMed]
- Inui, T.; Kurashina, Y.; Imashiro, C.; Takemura, K. Method of localized removal of cells using a bolt-clamped Langevin transducer. Eng. Life Sci. 2019, 19, 575–583. [Google Scholar] [CrossRef] [Green Version]
- Kang, B.; Shin, J.; Park, H.J.; Rhyou, C.; Kang, D.; Lee, S.J.; Yoon, Y.S.; Cho, S.W.; Lee, H. High-resolution acoustophoretic 3D cell patterning to construct functional collateral cylindroids for ischemia therapy. Nat. Commun. 2018, 9. [Google Scholar] [CrossRef] [Green Version]
- Li, H.; Friend, J.; Yeo, L. A scaffold cell seeding method driven by surface acoustic waves. Biomaterials 2007, 28, 4098–4104. [Google Scholar] [CrossRef] [PubMed] [Green Version]


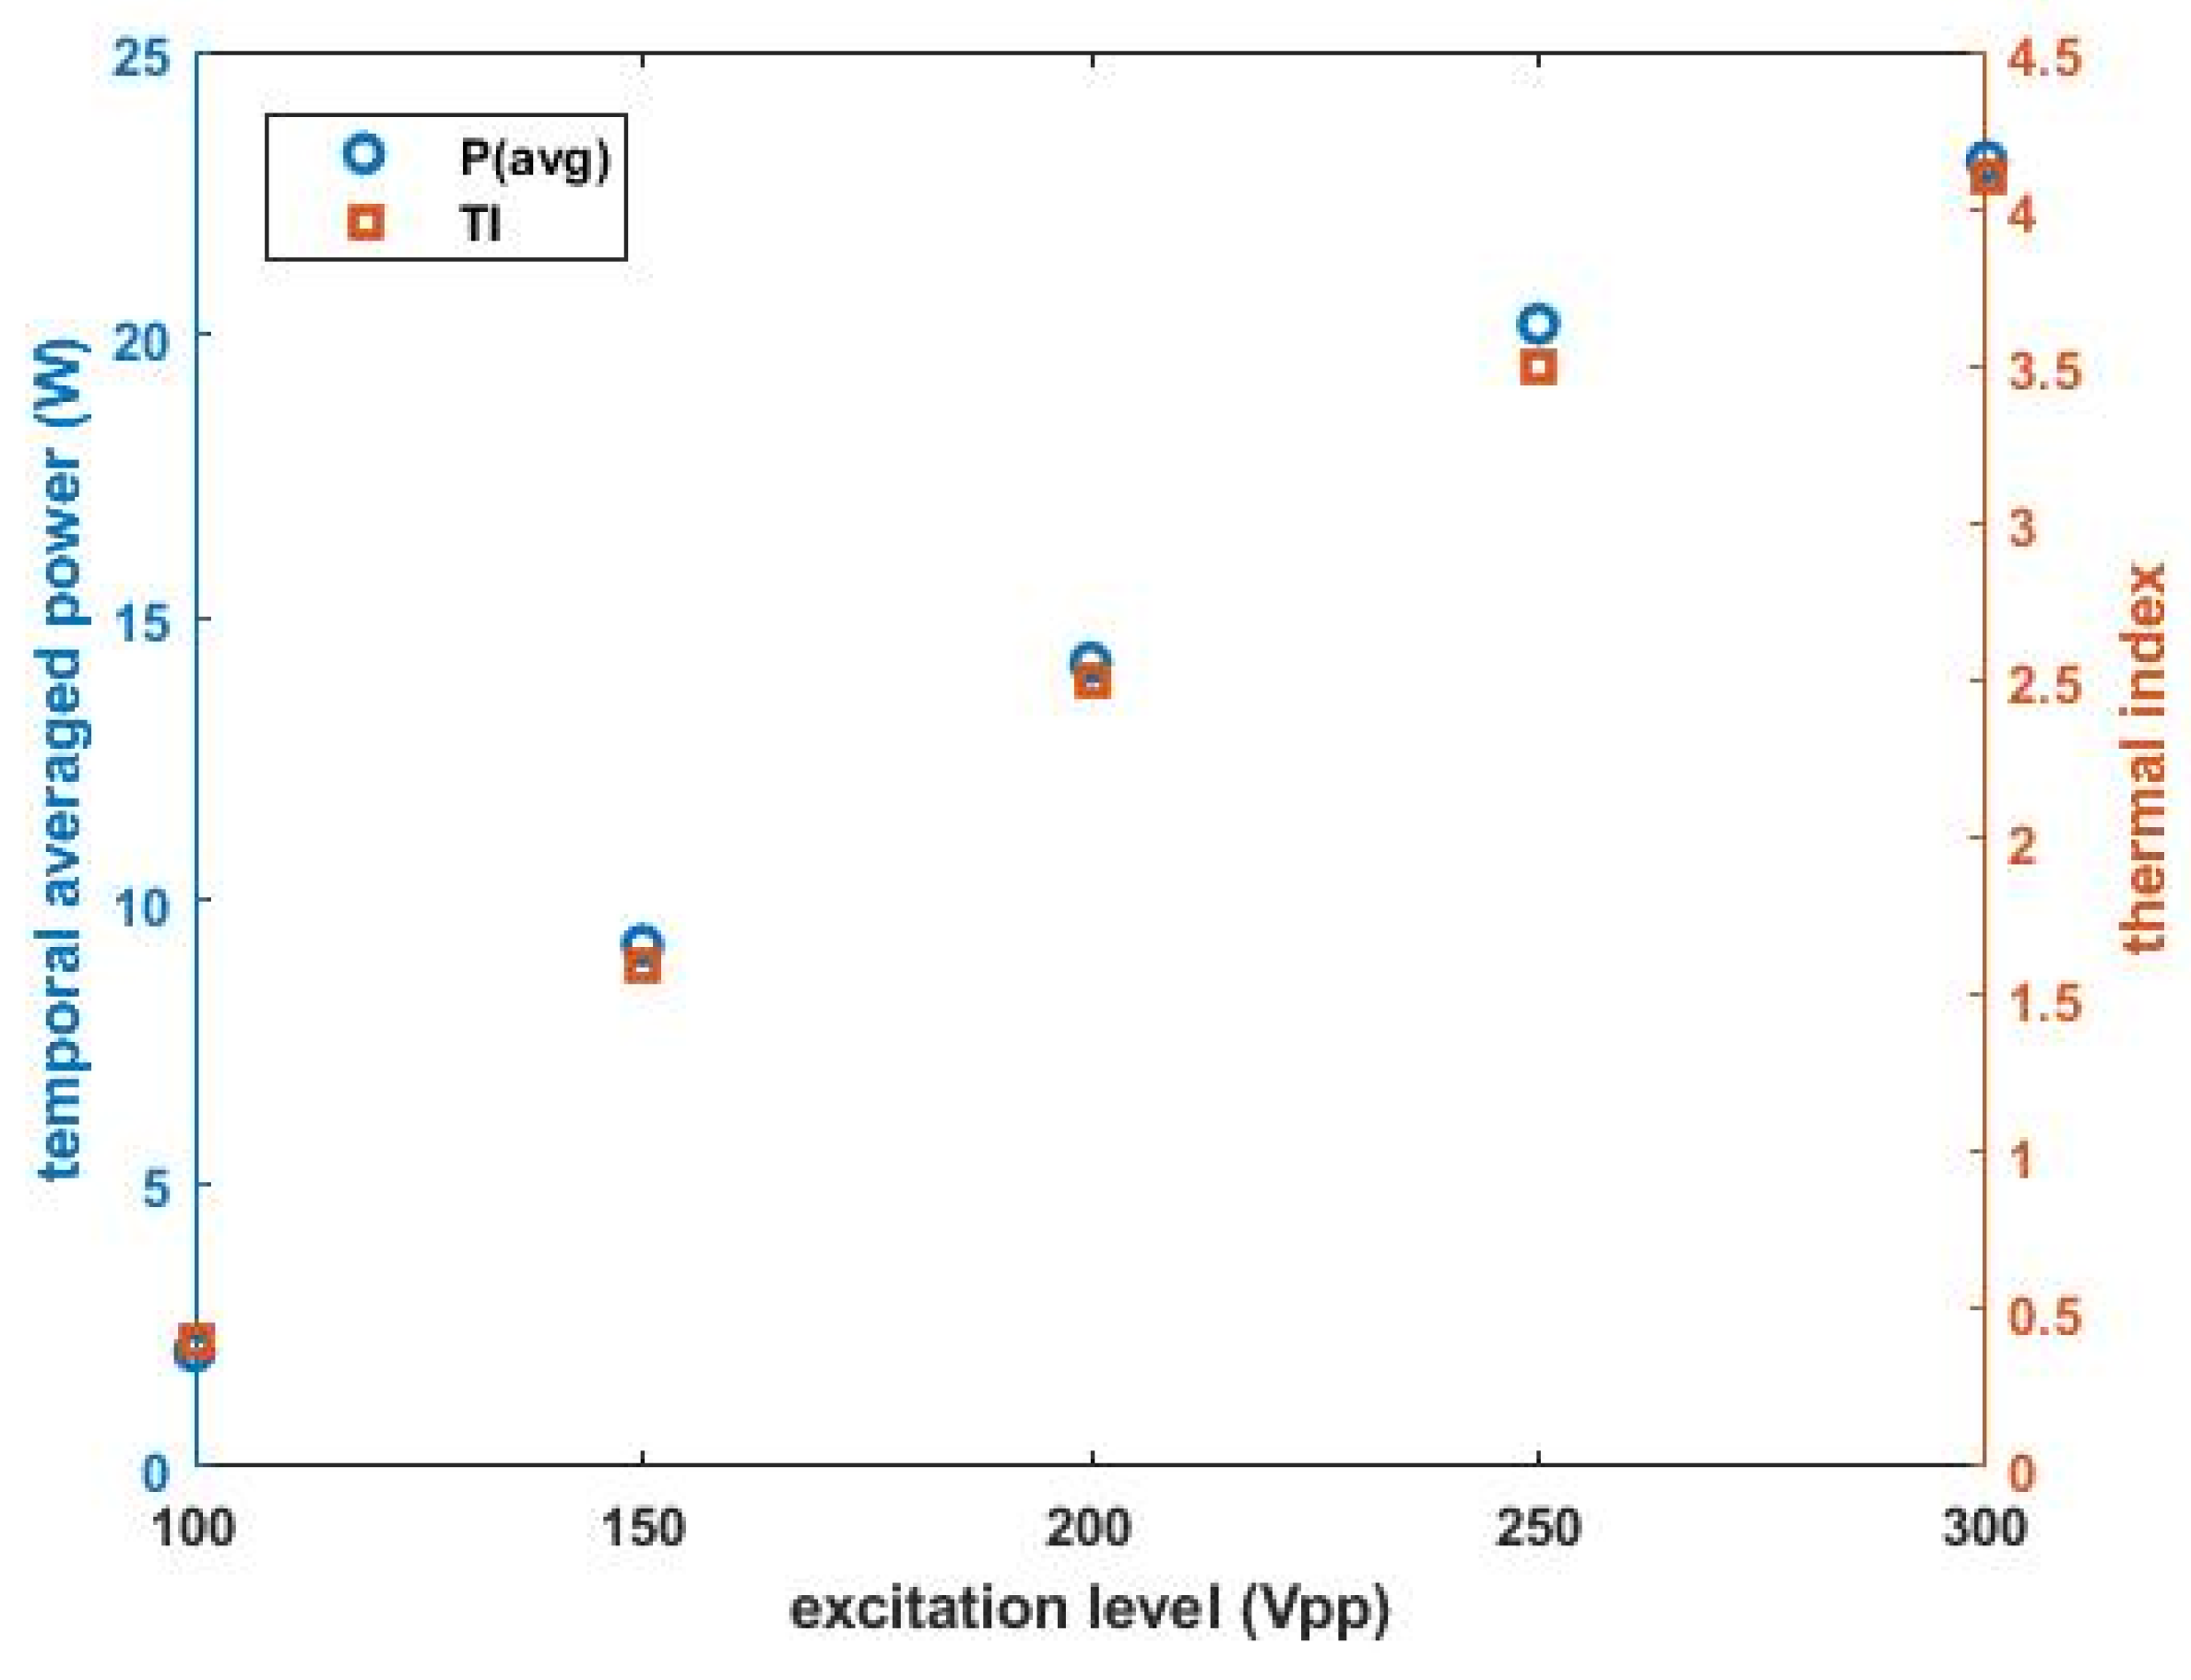
| 100 Vpp | 150 Vpp | 200 Vpp | 250 Vpp | 300 Vpp | |
|---|---|---|---|---|---|
| Pmin | 0.03 | 5.46 | 7.86 | 18.57 | 19.90 |
| Pmax | 6.50 | 11.44 | 22.04 | 21.5 | 26.45 |
| Pavg | 2.04 | 9.21 | 14.27 | 20.18 | 23.05 |
| TI | 0.4 | 1.6 | 2.5 | 3.5 | 4.1 |
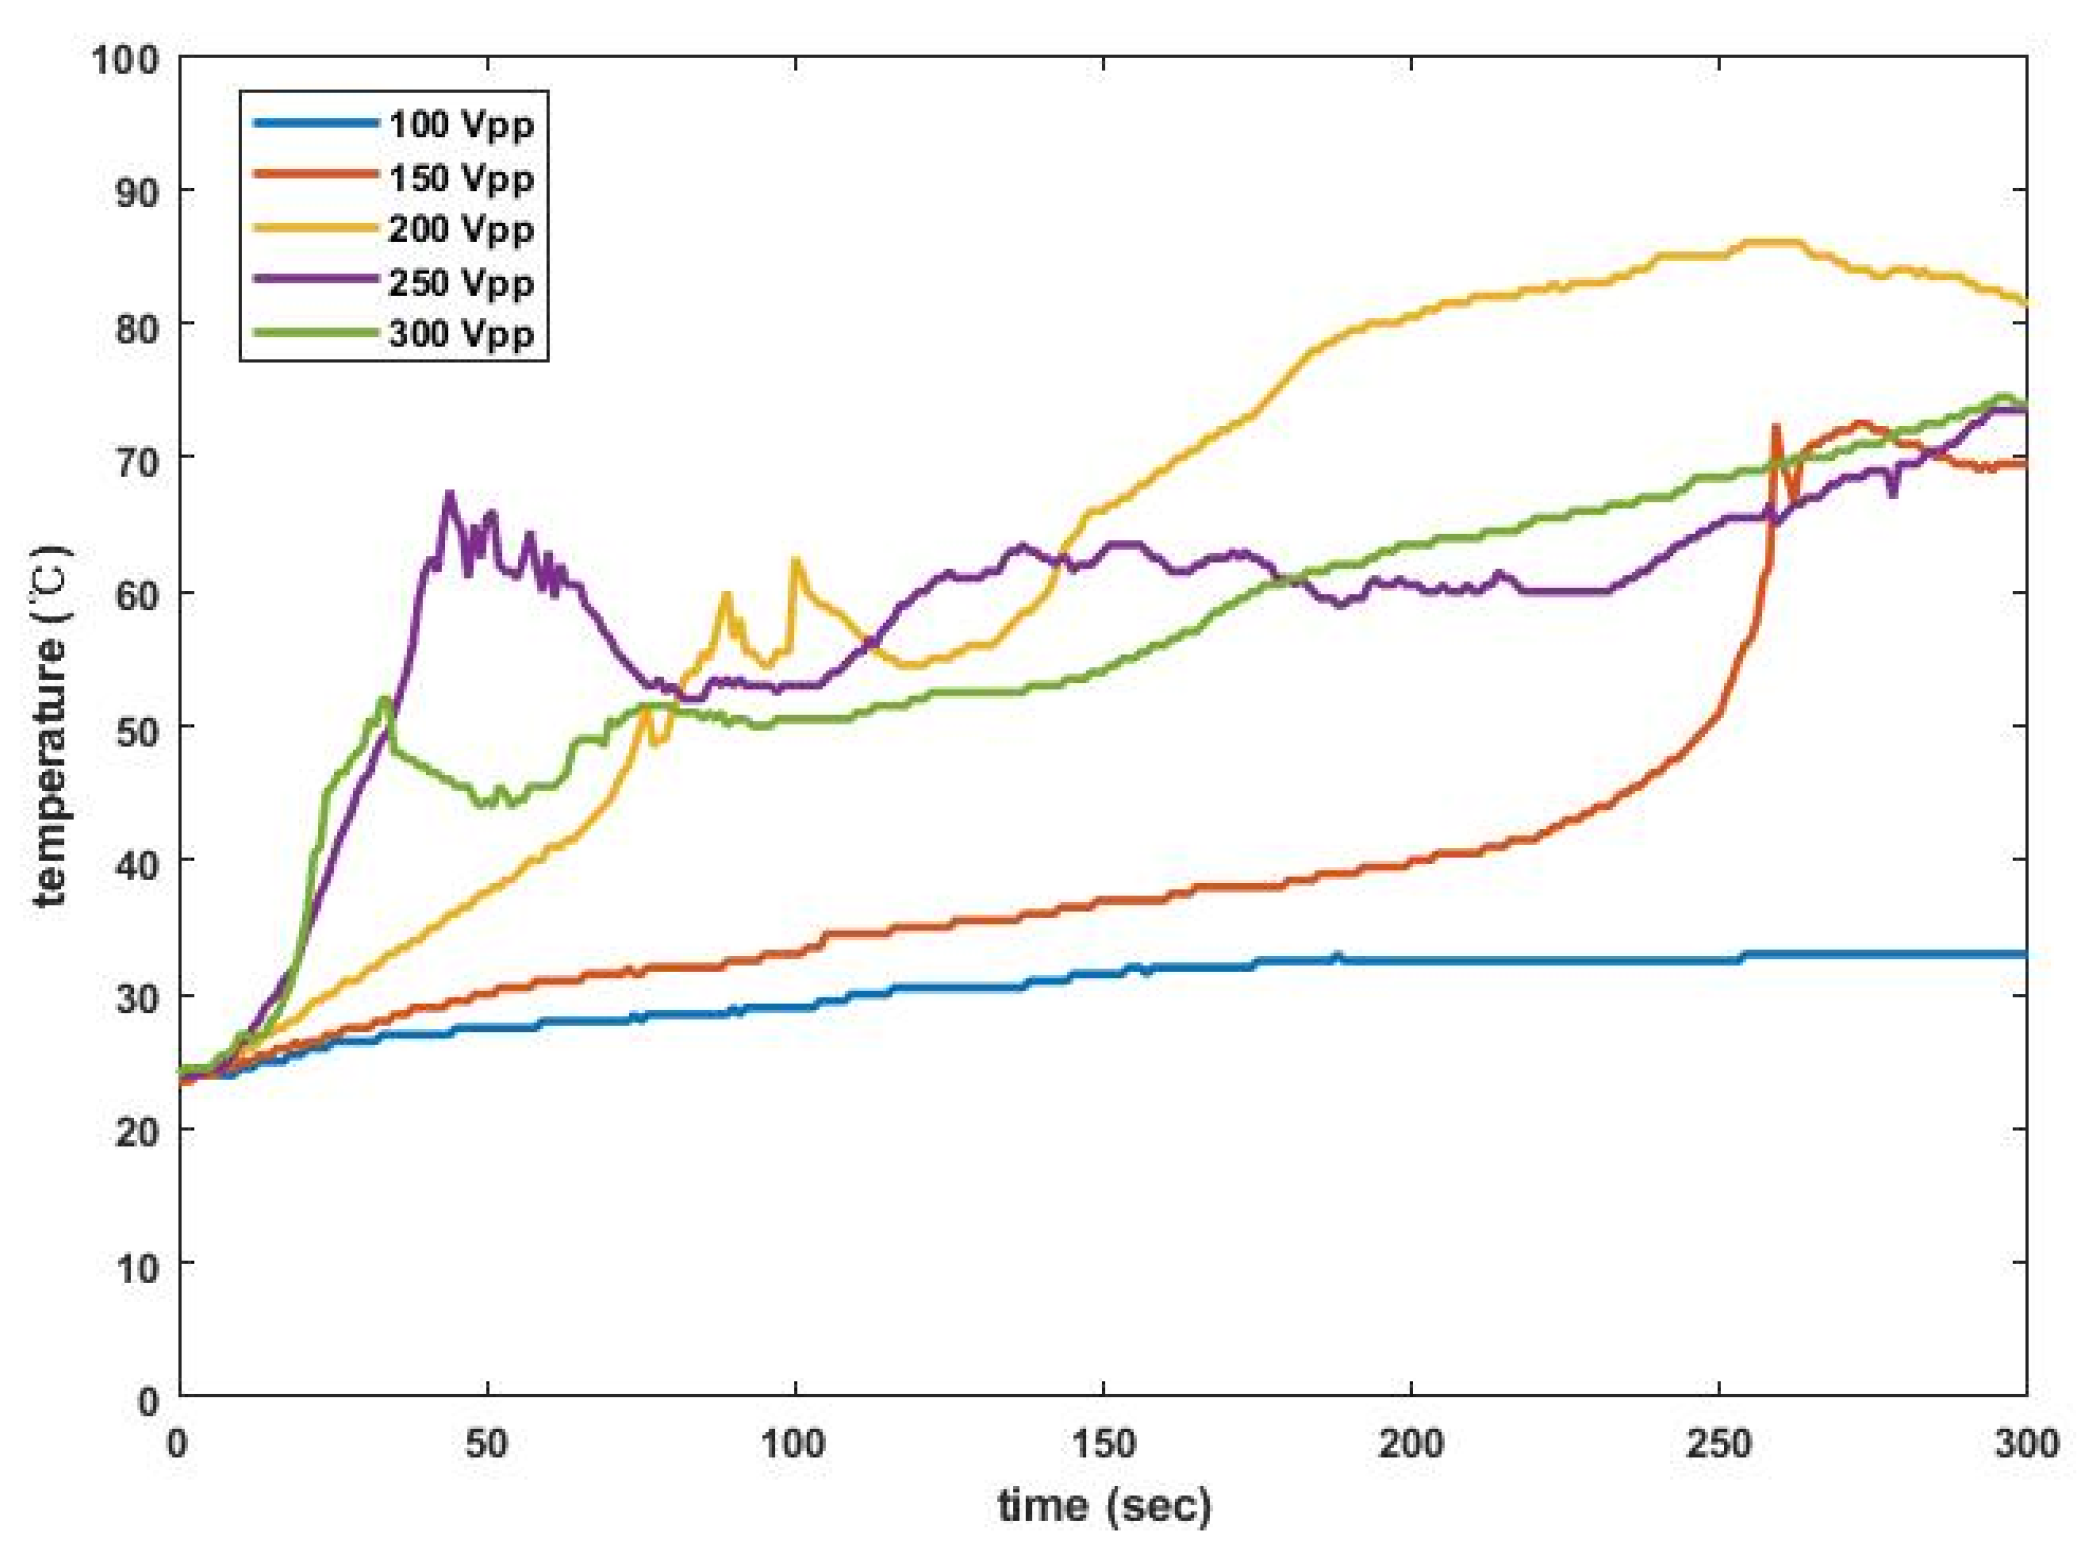
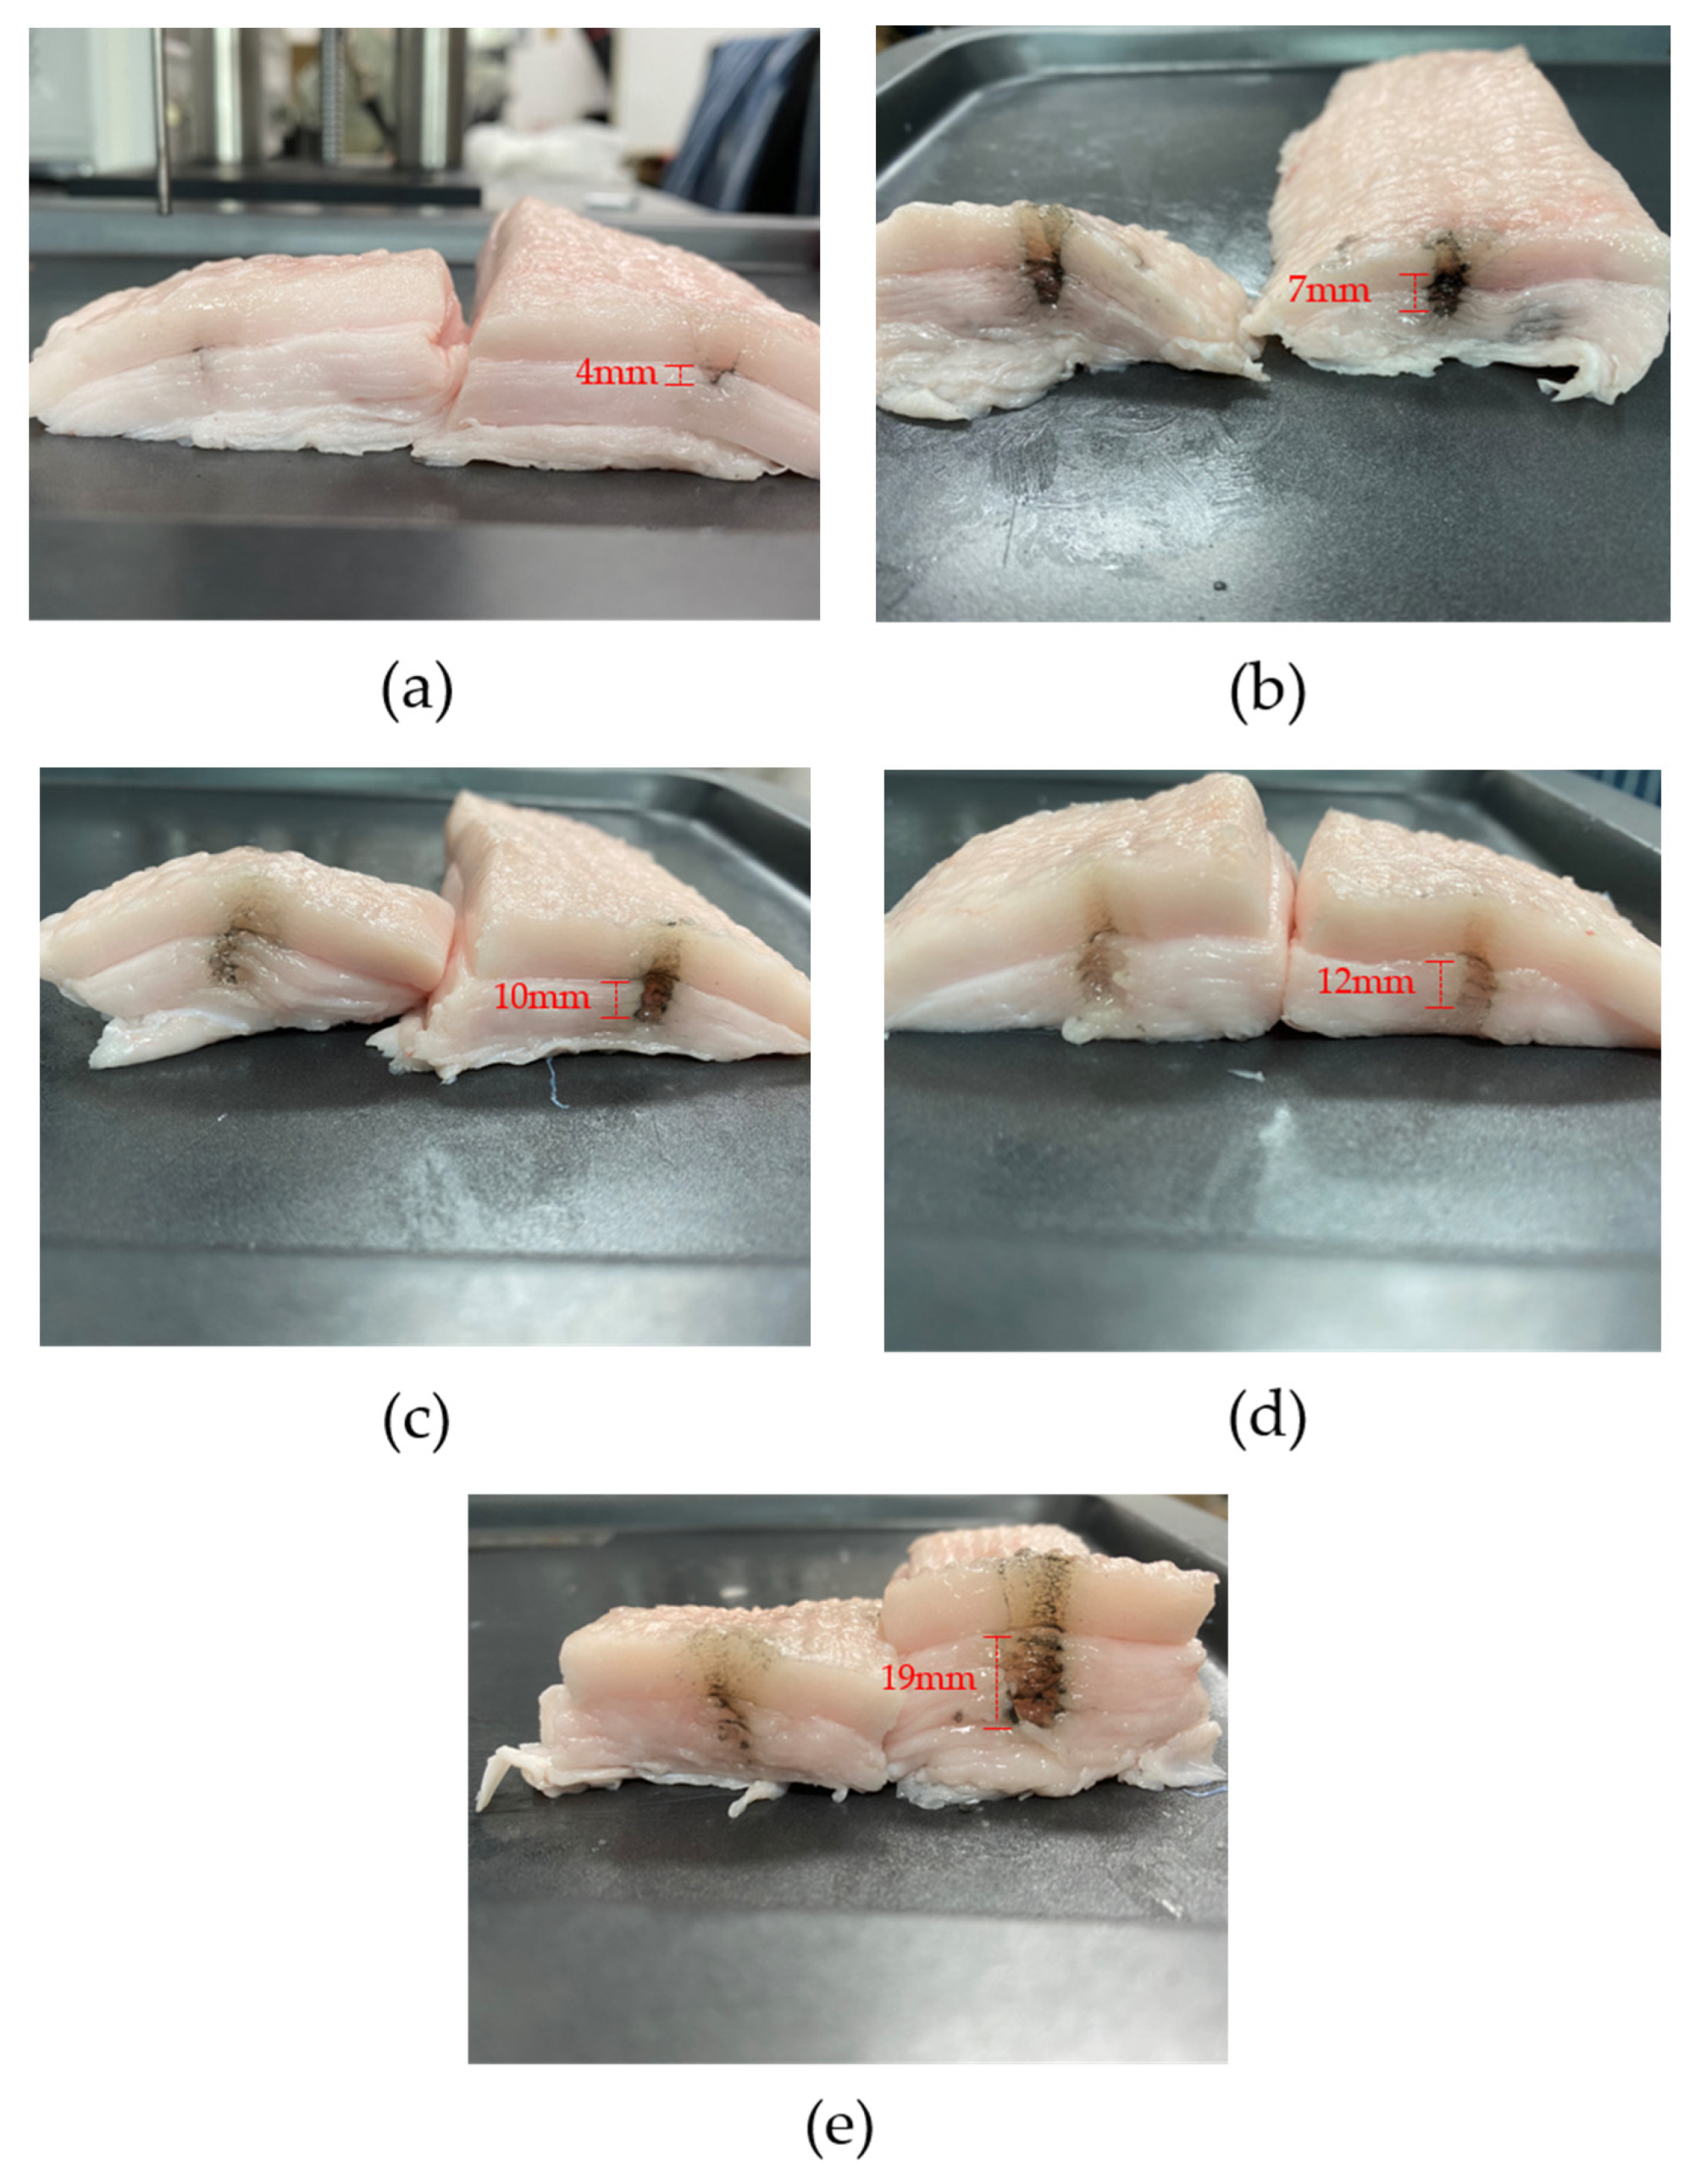
| 100 Vpp | 150 Vpp | 200 Vpp | 250 Vpp | 300 Vpp | |
|---|---|---|---|---|---|
| Maximum temperature (°C) | 33 | 72.5 | 83.5 | 73.5 | 74.5 |
| Depth (mm) | 4 | 7 | 10 | 12 | 19 |
Publisher’s Note: MDPI stays neutral with regard to jurisdictional claims in published maps and institutional affiliations. |
© 2022 by the authors. Licensee MDPI, Basel, Switzerland. This article is an open access article distributed under the terms and conditions of the Creative Commons Attribution (CC BY) license (https://creativecommons.org/licenses/by/4.0/).
Share and Cite
Kim, J.; Lee, J. Acoustic Power Measurement and Thermal Bioeffect Evaluation of Therapeutic Langevin Transducers. Sensors 2022, 22, 624. https://doi.org/10.3390/s22020624
Kim J, Lee J. Acoustic Power Measurement and Thermal Bioeffect Evaluation of Therapeutic Langevin Transducers. Sensors. 2022; 22(2):624. https://doi.org/10.3390/s22020624
Chicago/Turabian StyleKim, Jinhyuk, and Jungwoo Lee. 2022. "Acoustic Power Measurement and Thermal Bioeffect Evaluation of Therapeutic Langevin Transducers" Sensors 22, no. 2: 624. https://doi.org/10.3390/s22020624