
A Convolutional Neural Network-Based Intelligent Medical System with Sensors for Assistive Diagnosis and Decision-Making in Non-Small Cell Lung Cancer


Abstract
:1. Introduction
- Heavy physician burden. The number of patients is large while the number of doctors is small. As a result, doctors are overwhelmed by the repetition of inefficient and cumbersome diagnostic tasks, making it difficult to attend to all patients and delaying the diagnosis or treatment of some patients.
- Uneven geographical distribution of medical resources. While advanced medical resources are scarce and concentrated in large cities, most patients come from underdeveloped rural areas without better medical conditions or resources, which may delay their treatment, causing their condition to deteriorate.
- Overtreatment due to doctor misdiagnosis. The lack of advanced medical testing technology and excellent qualified doctors can easily lead to misdiagnosis. Not only does this result in the burden of additional physical treatment as well as high and unnecessary medical costs for the patient, but it also worsens the doctor–patient relationship.
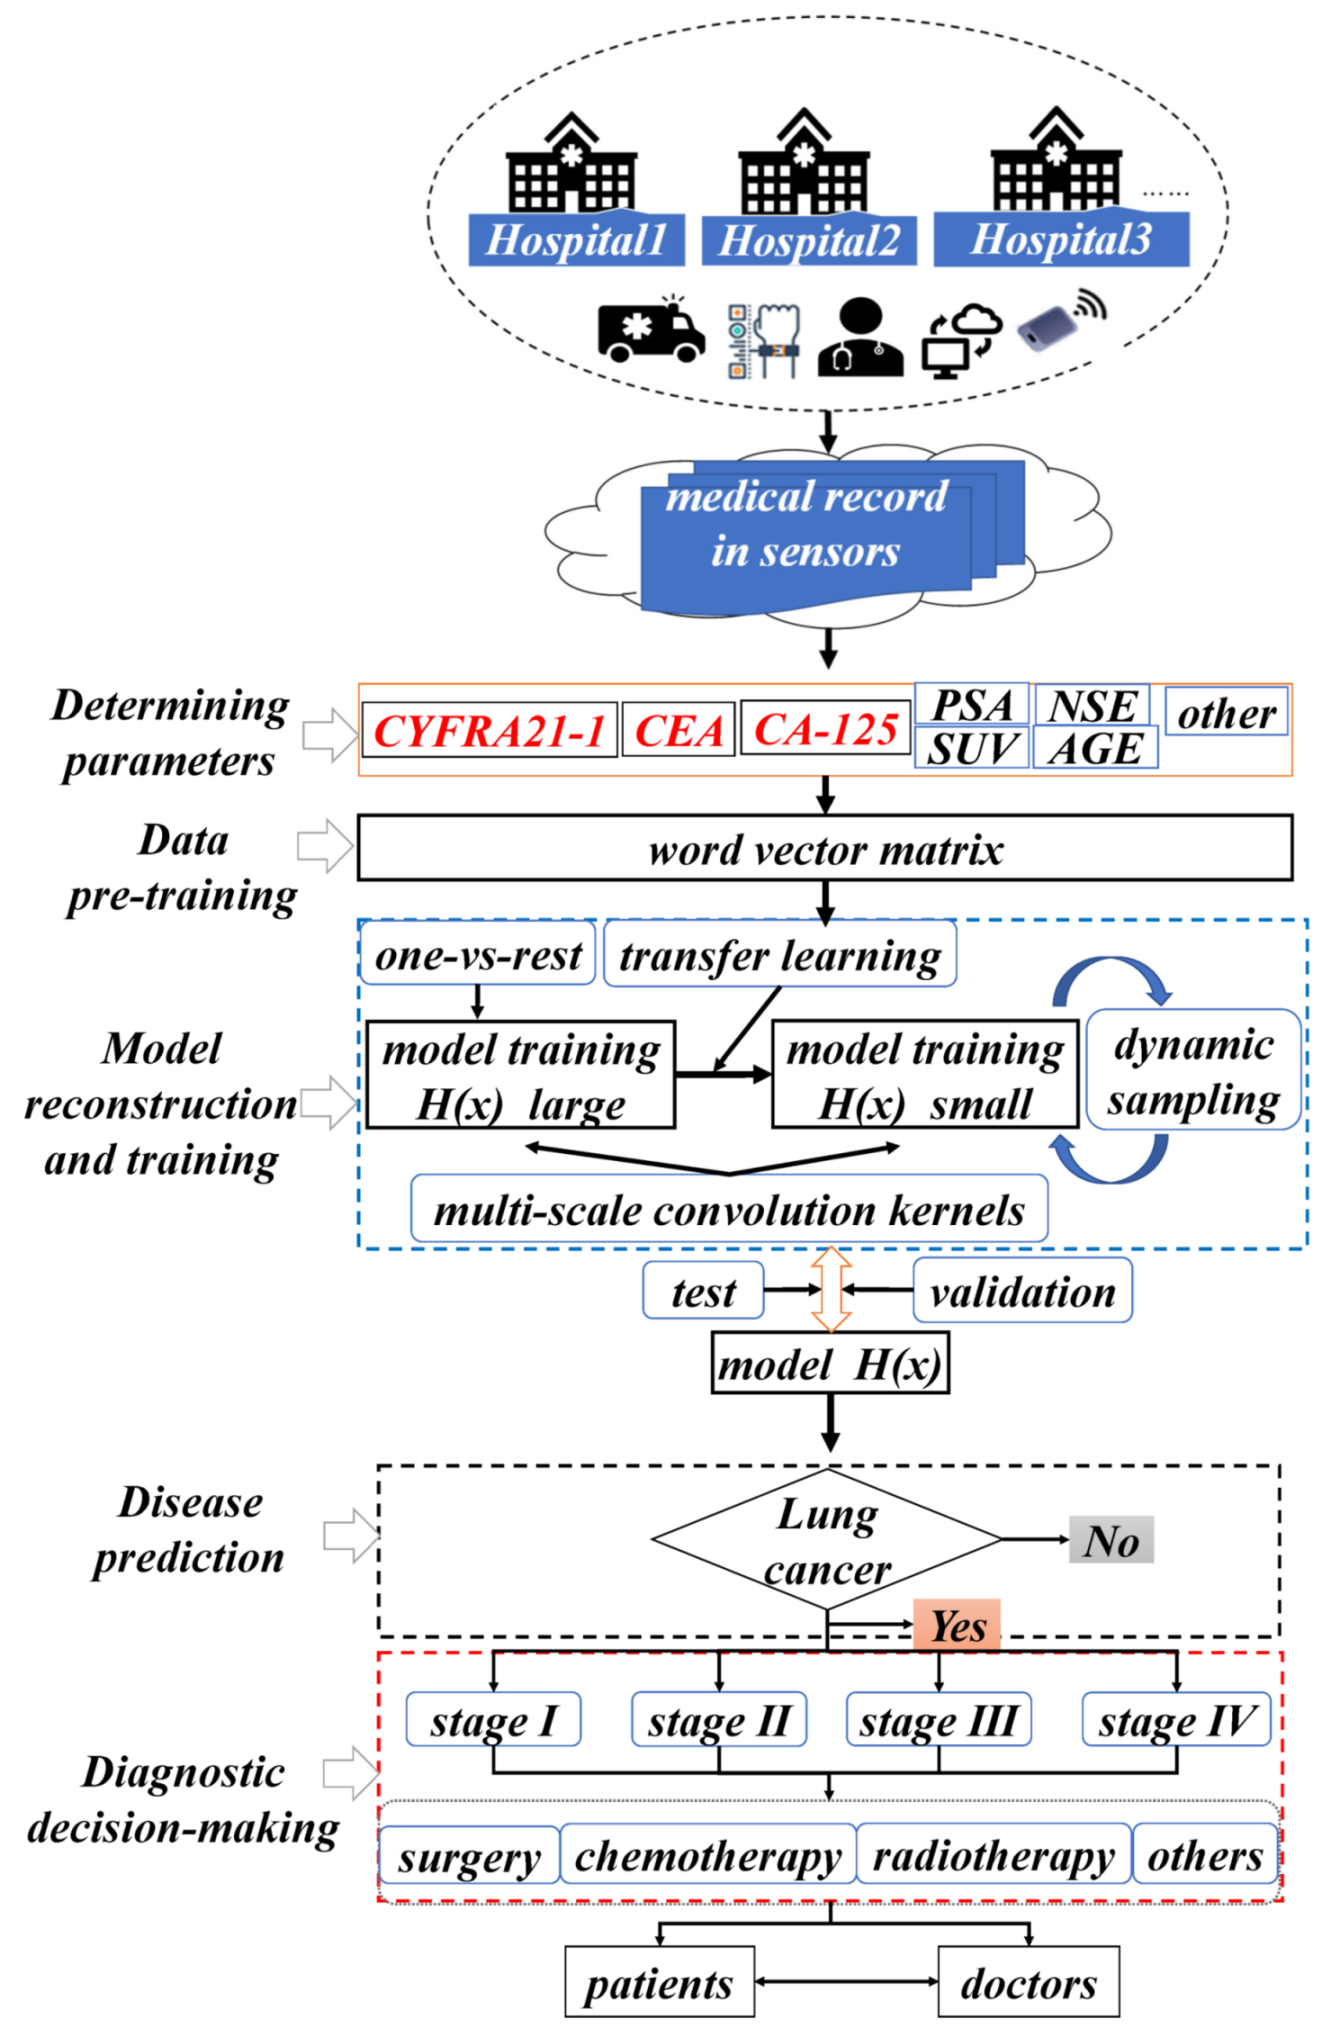
- The development of a new CNN-based assisted diagnosis and decision-making intelligent medical system with sensors, which can diagnose the staging of NSCLC patients and provide recommend treatment strategies to physicians by extracting semantic features from the text of highly relevant diagnostic and decision parameters. The system can be used to help physicians assess the effectiveness of patient treatment and adjust the next stage of the treatment plan in a timely manner according to the patient’s recovery.
- The method of migrating the parameters of large-sample training models to small-sample training models using transfer learning techniques, which realizes the knowledge sharing and solves the impact on model performance caused by the problem of insufficient training samples.
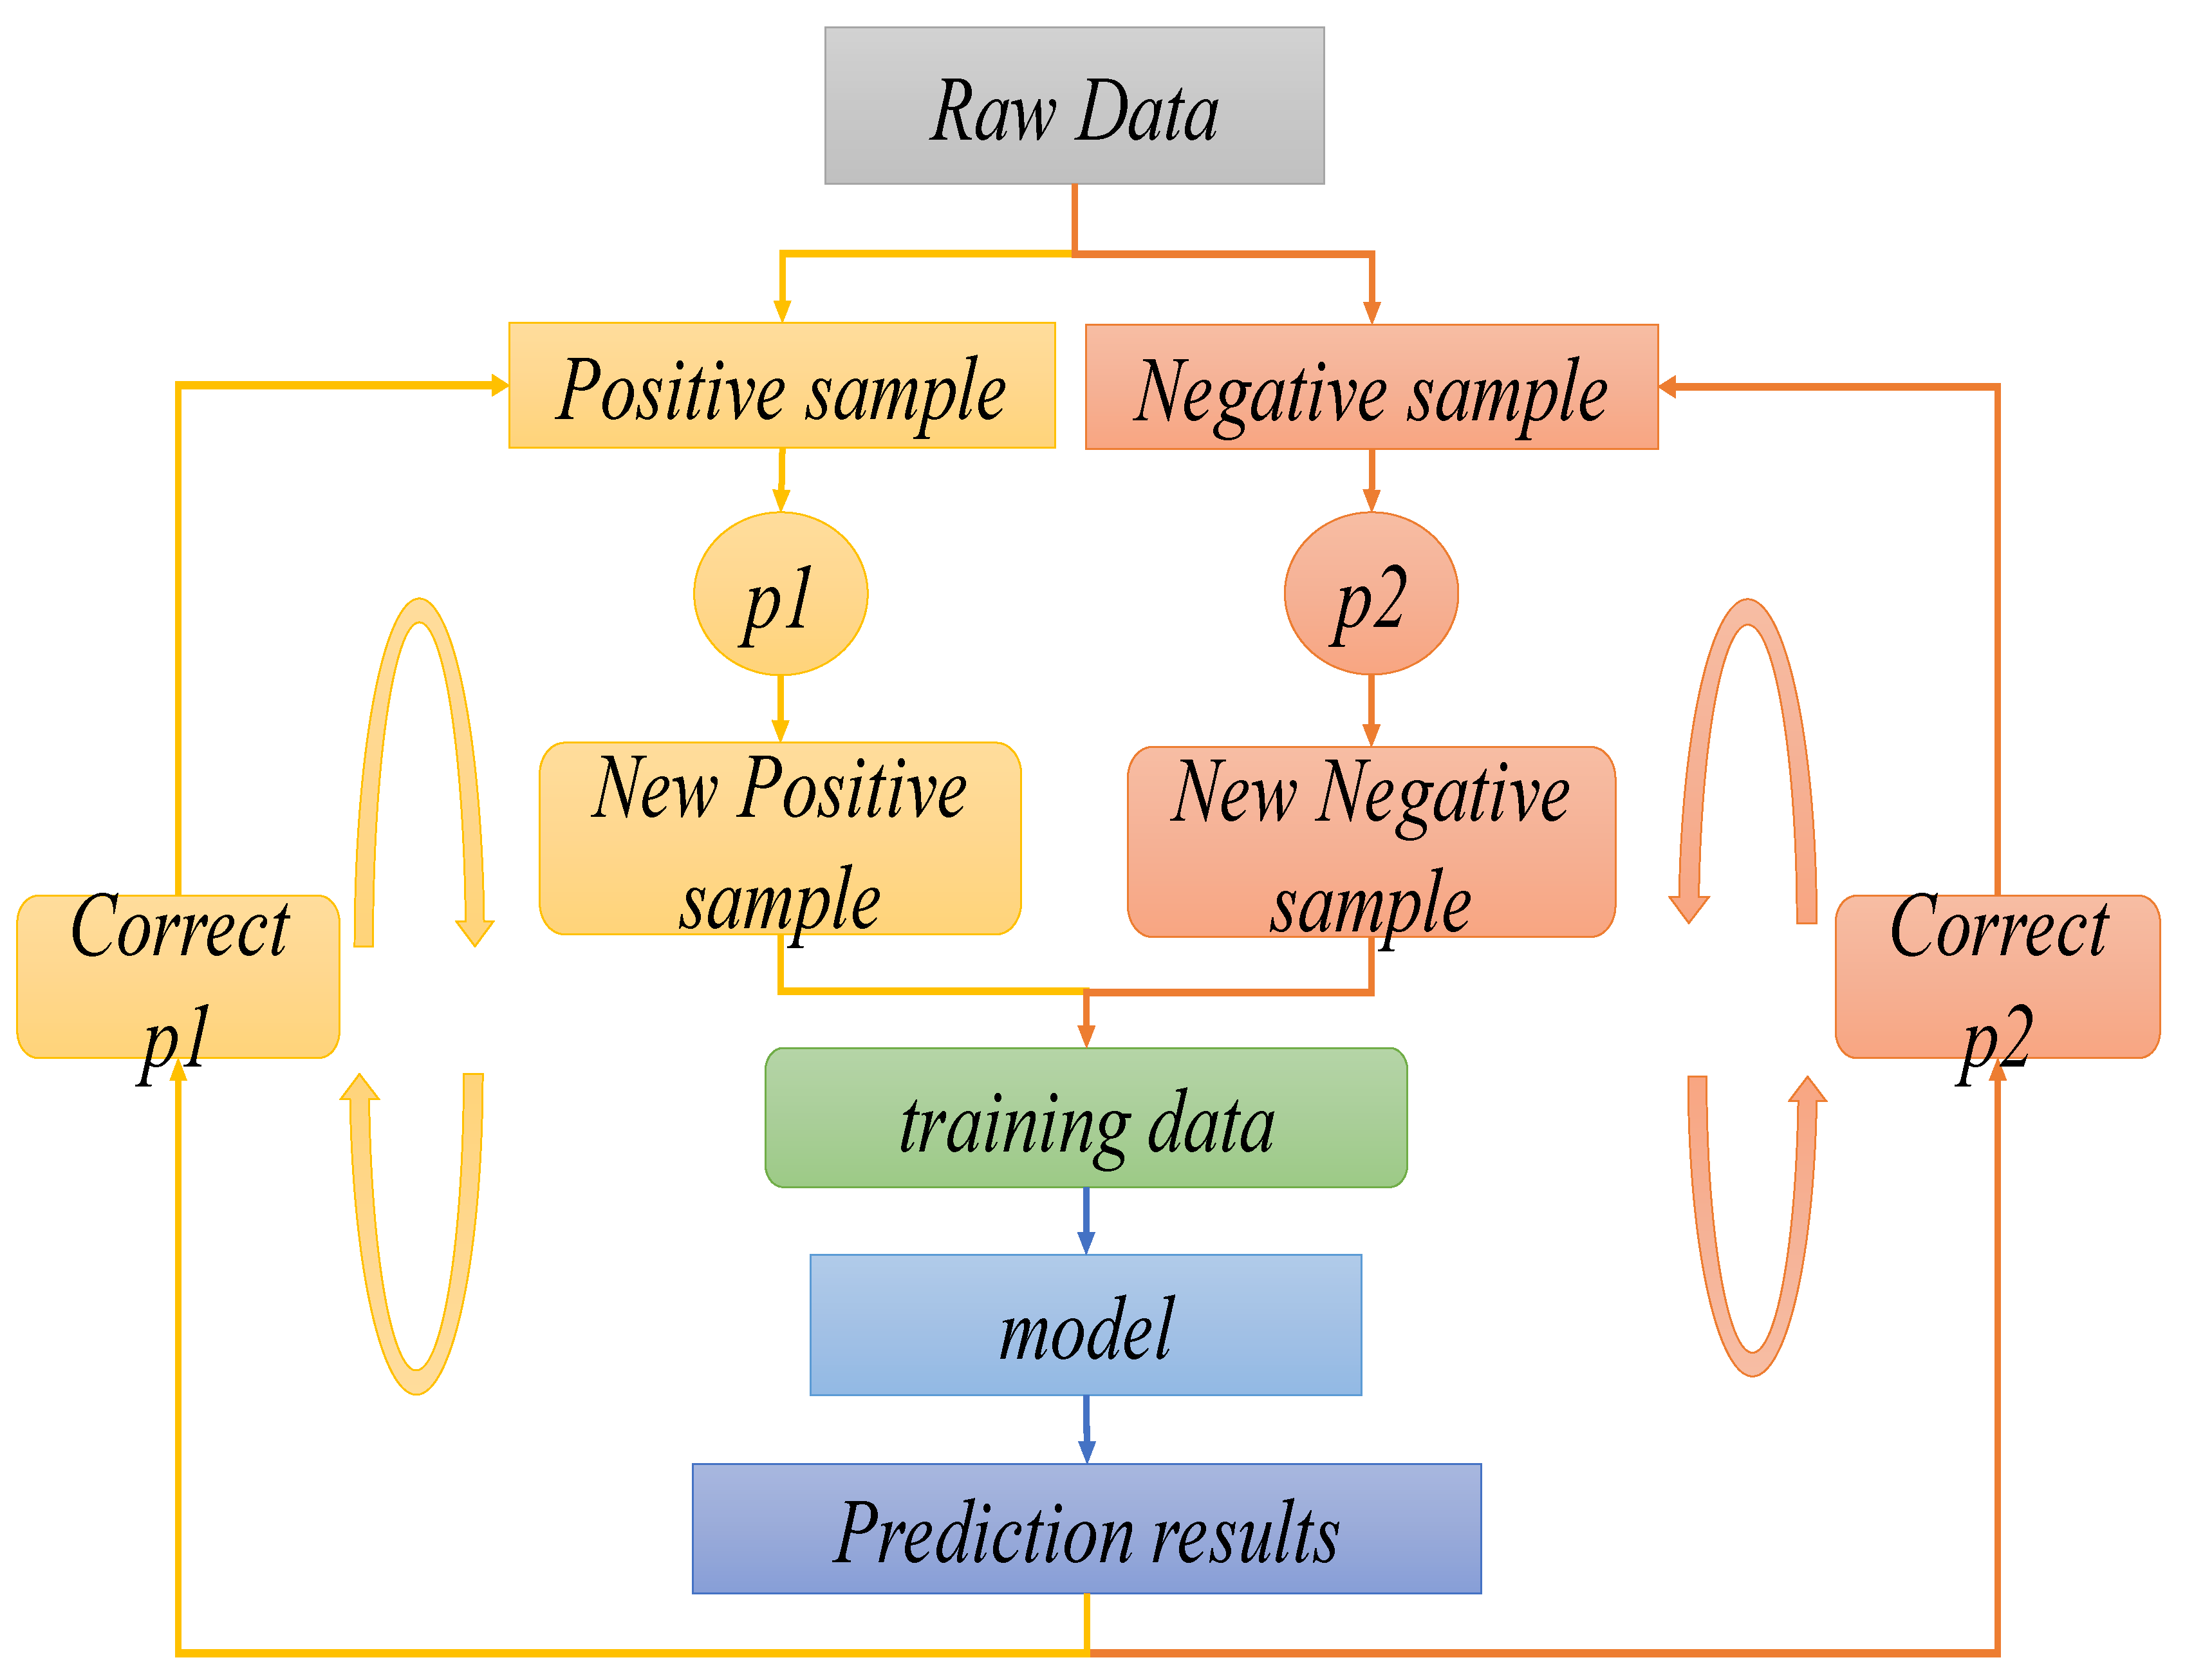
- The dynamic sampling technique training algorithm is proposed to construct a balanced training set of positive and negative samples for iterative training to improve the accuracy and robustness of the auxiliary diagnosis model.
- The experimental data were all obtained from real-world NSCLC patient case samples recorded in three hospitals in China. The results show that our proposed new intelligent medical system can approach the diagnostic accuracy of NSCLC staging to the level of real doctors with good performance.
2. Related Work
3. System Design
3.1. Overall System Framework
3.2. NSCLC Staging Prediction Model
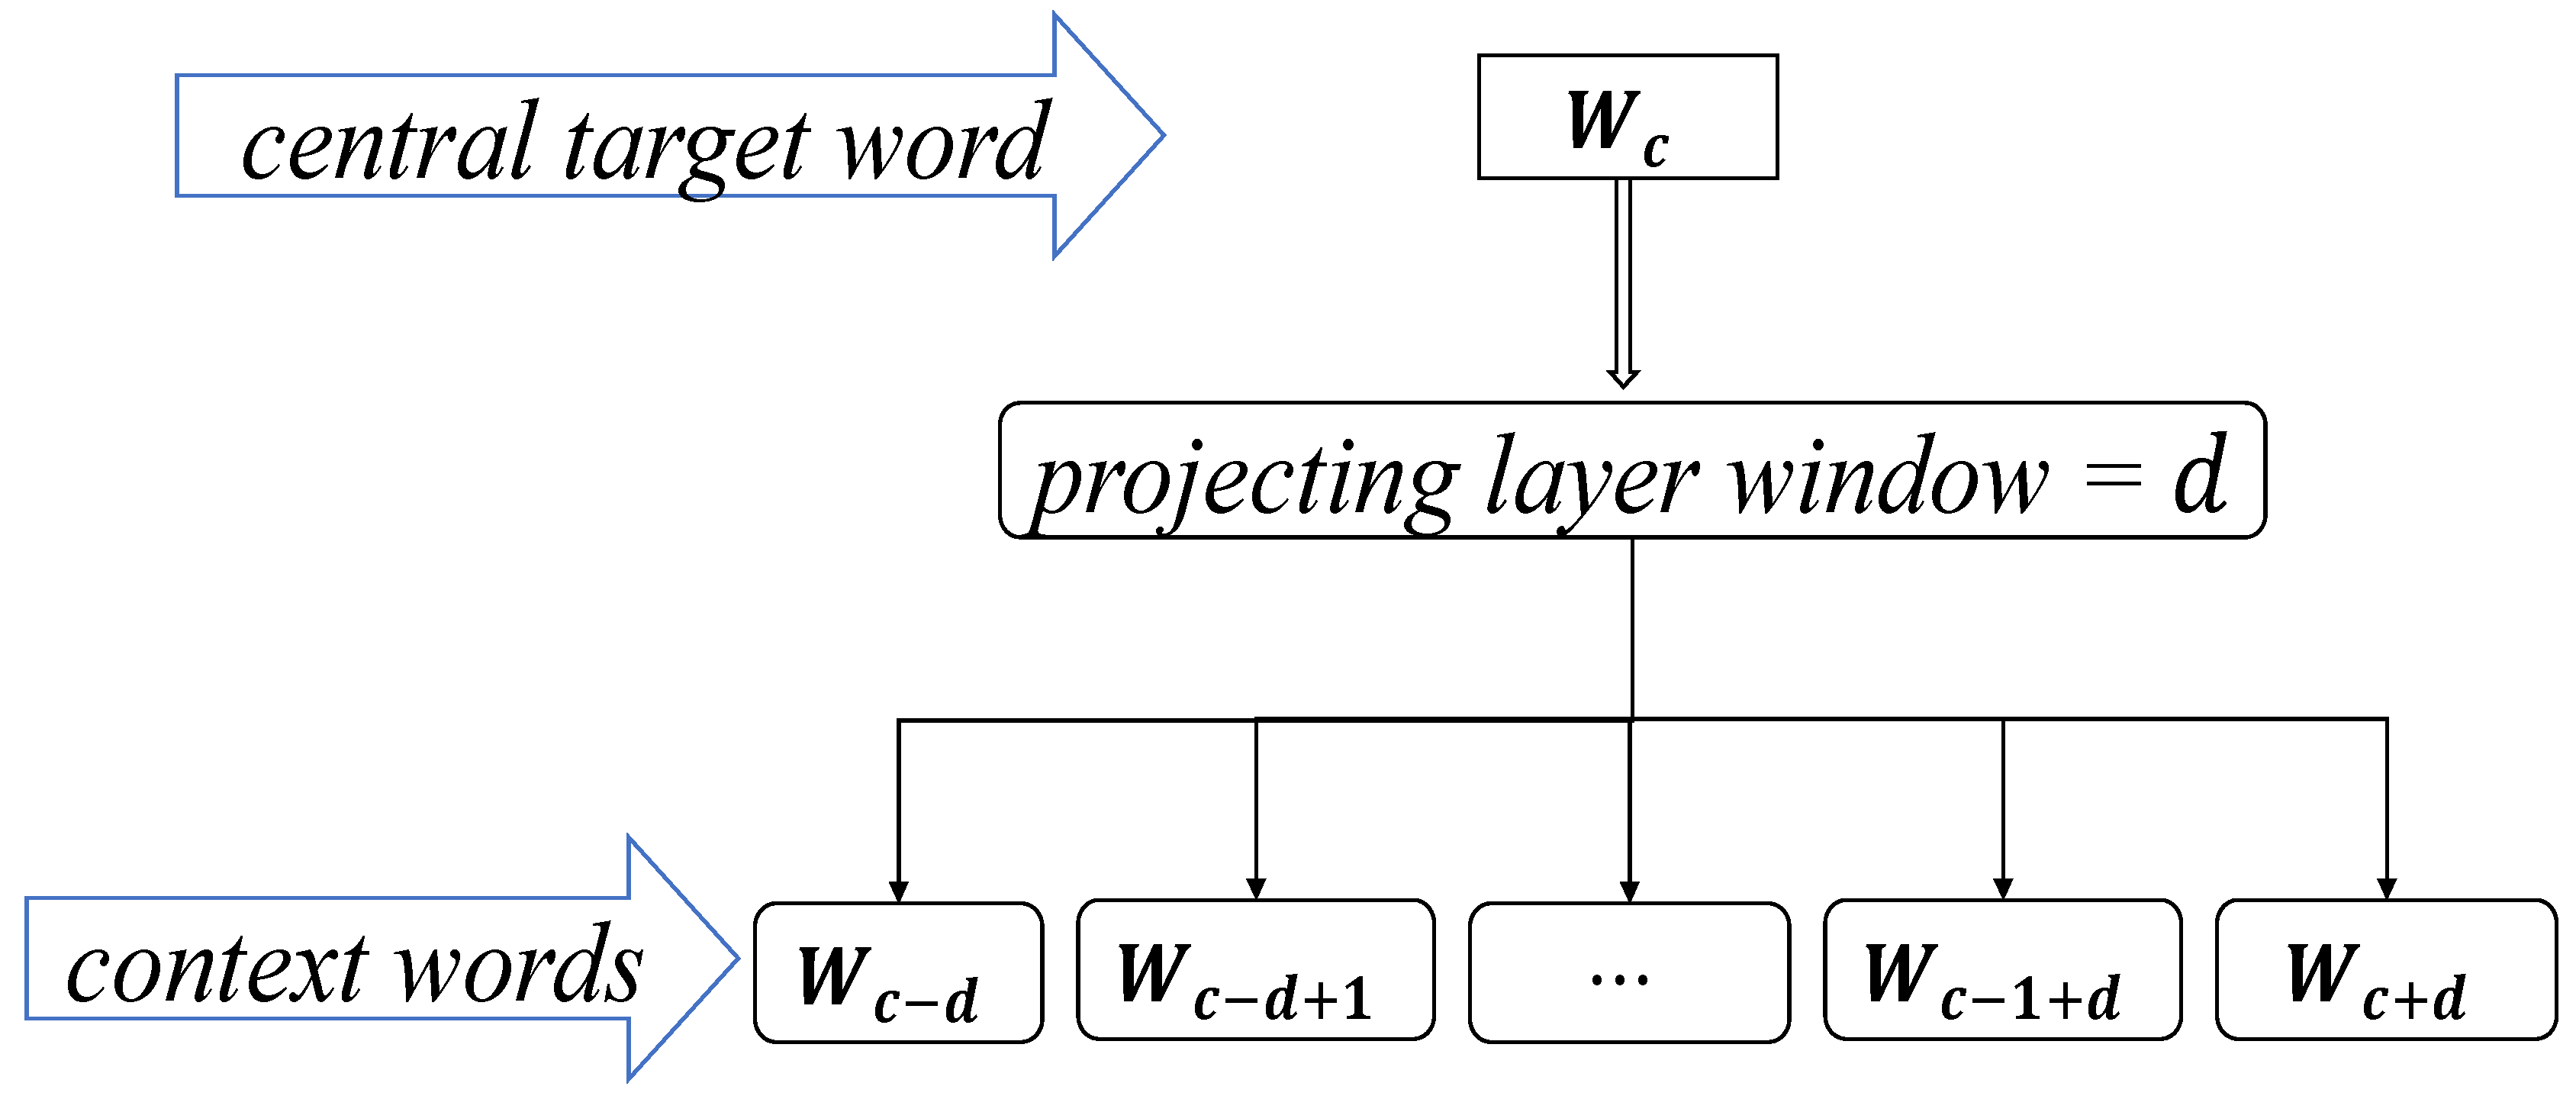
3.2.1. The Skip-Gram Word Vector Model
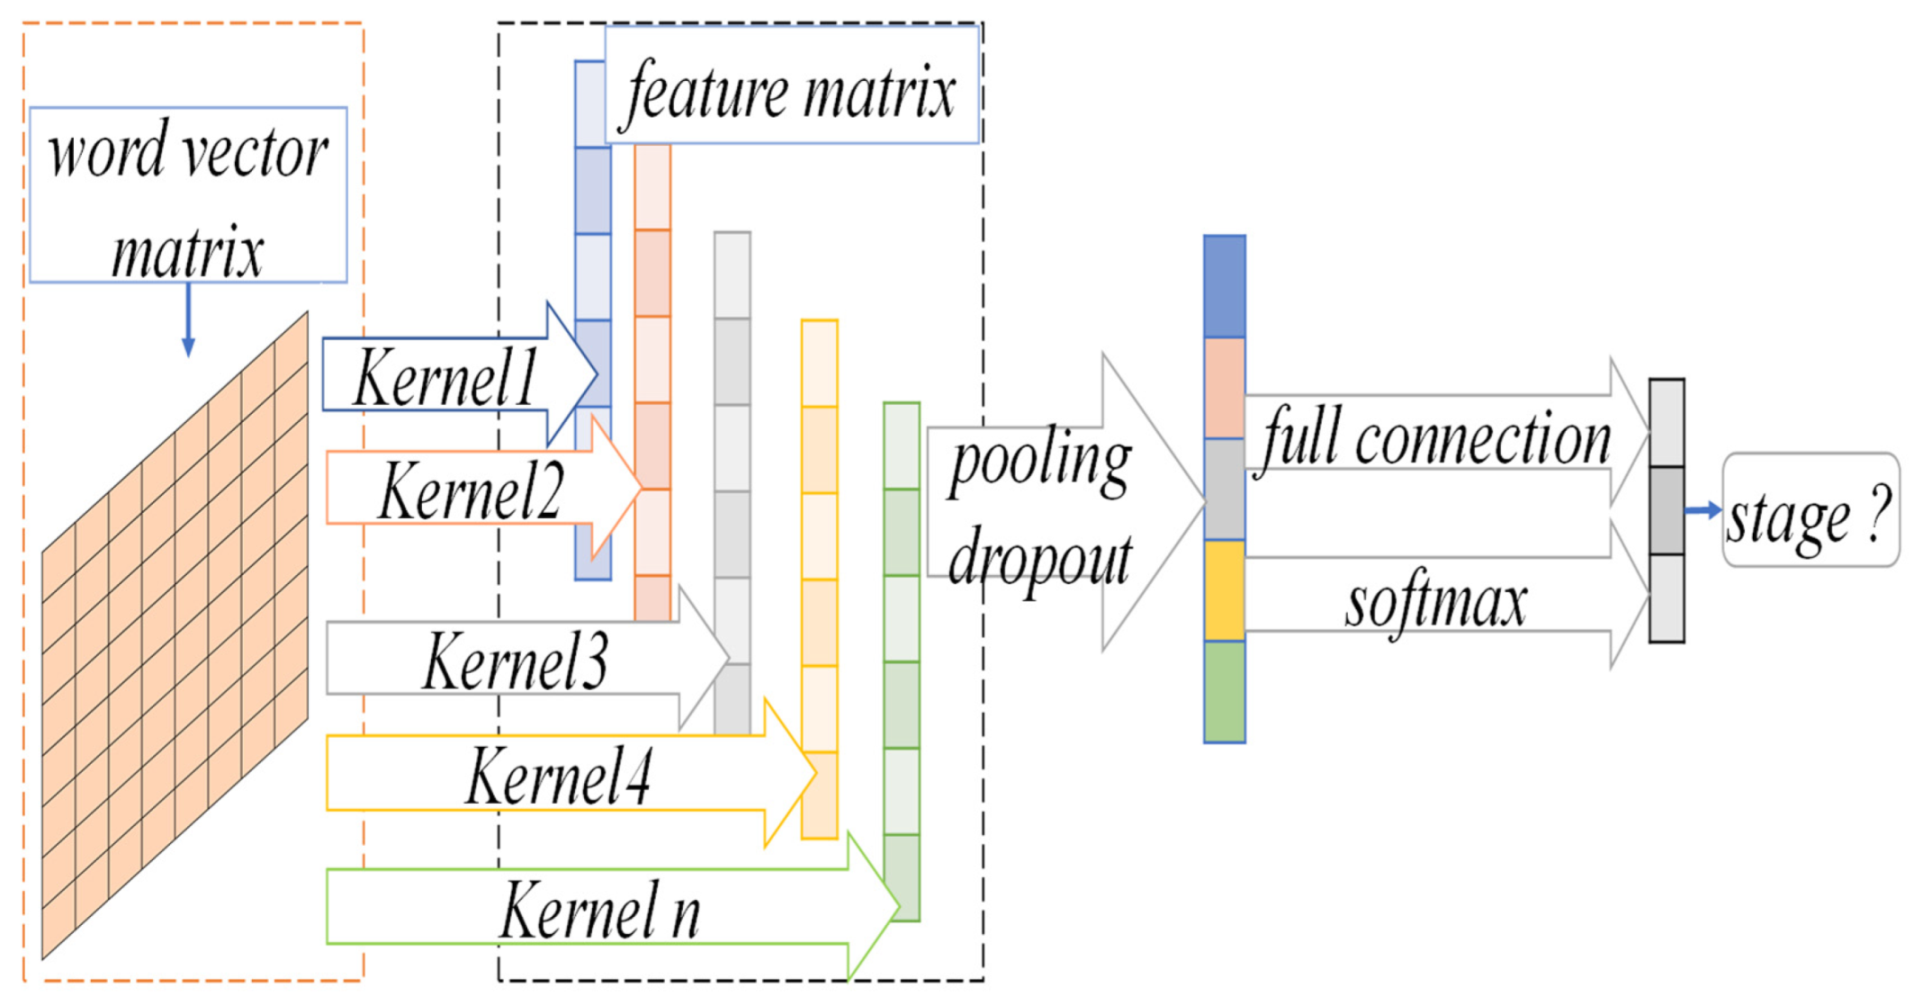
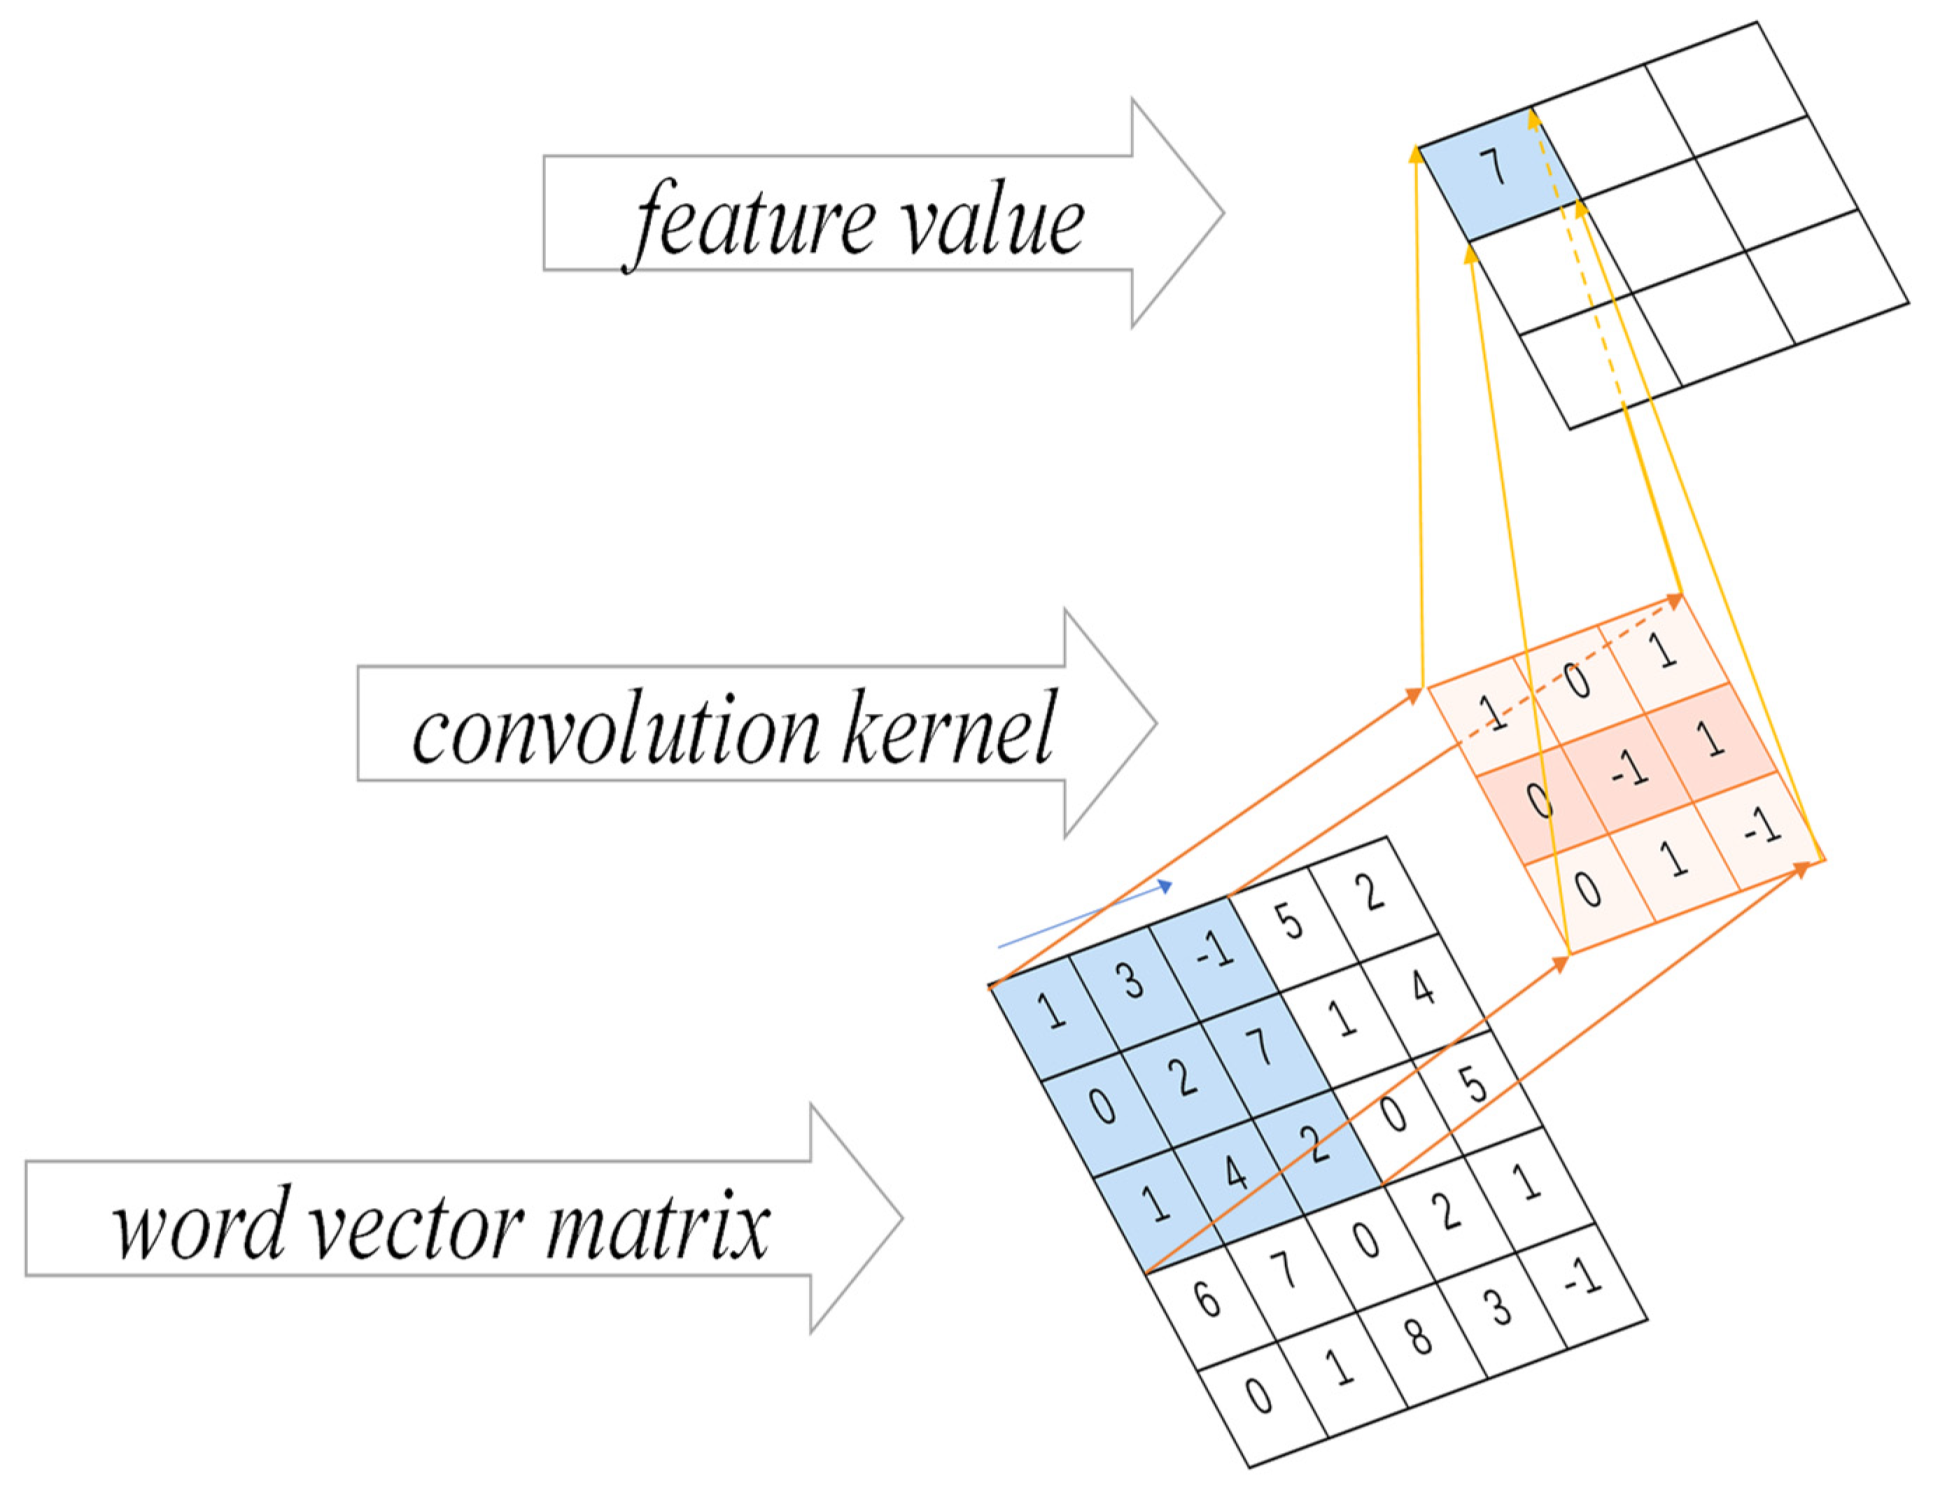
3.2.2. CNN Convolution Operation
3.3. Prediction Model for NSCLC Staging Based on Transfer Learning and Dynamic Sampling for Small Samples
| Algorithm 1: The dynamic sampling technique training algorithm |
| Input: is the multi-label data set. where is the total number of labels, NSCLC has four stages, so , the labels to be trained are , the number of iterations is and the size of the training data block for each iteration is . Output: The prediction model . Step 1: For any label , the co-occurrence frequency of the small sample pathological stage label and is calculated, as shown in Equation (4). Then, the parameters of the training model for the large sample case dataset are selected and saved according to the label corresponding to the maximum value, which is used as the initialization value for the small sample pathological period prediction model. where is a binary function that labels each case sample of NSCLC patients, and the labeling value is 1 if and have appeared in the same case sample, otherwise the labeling value is 0, as shown in Equation (5). The sampling probabilities of positive samples are regulized, where is the sum of all positive sample sampling probabilities, as shown in Equations (13) and (14). |
4. Experiments and Analysis
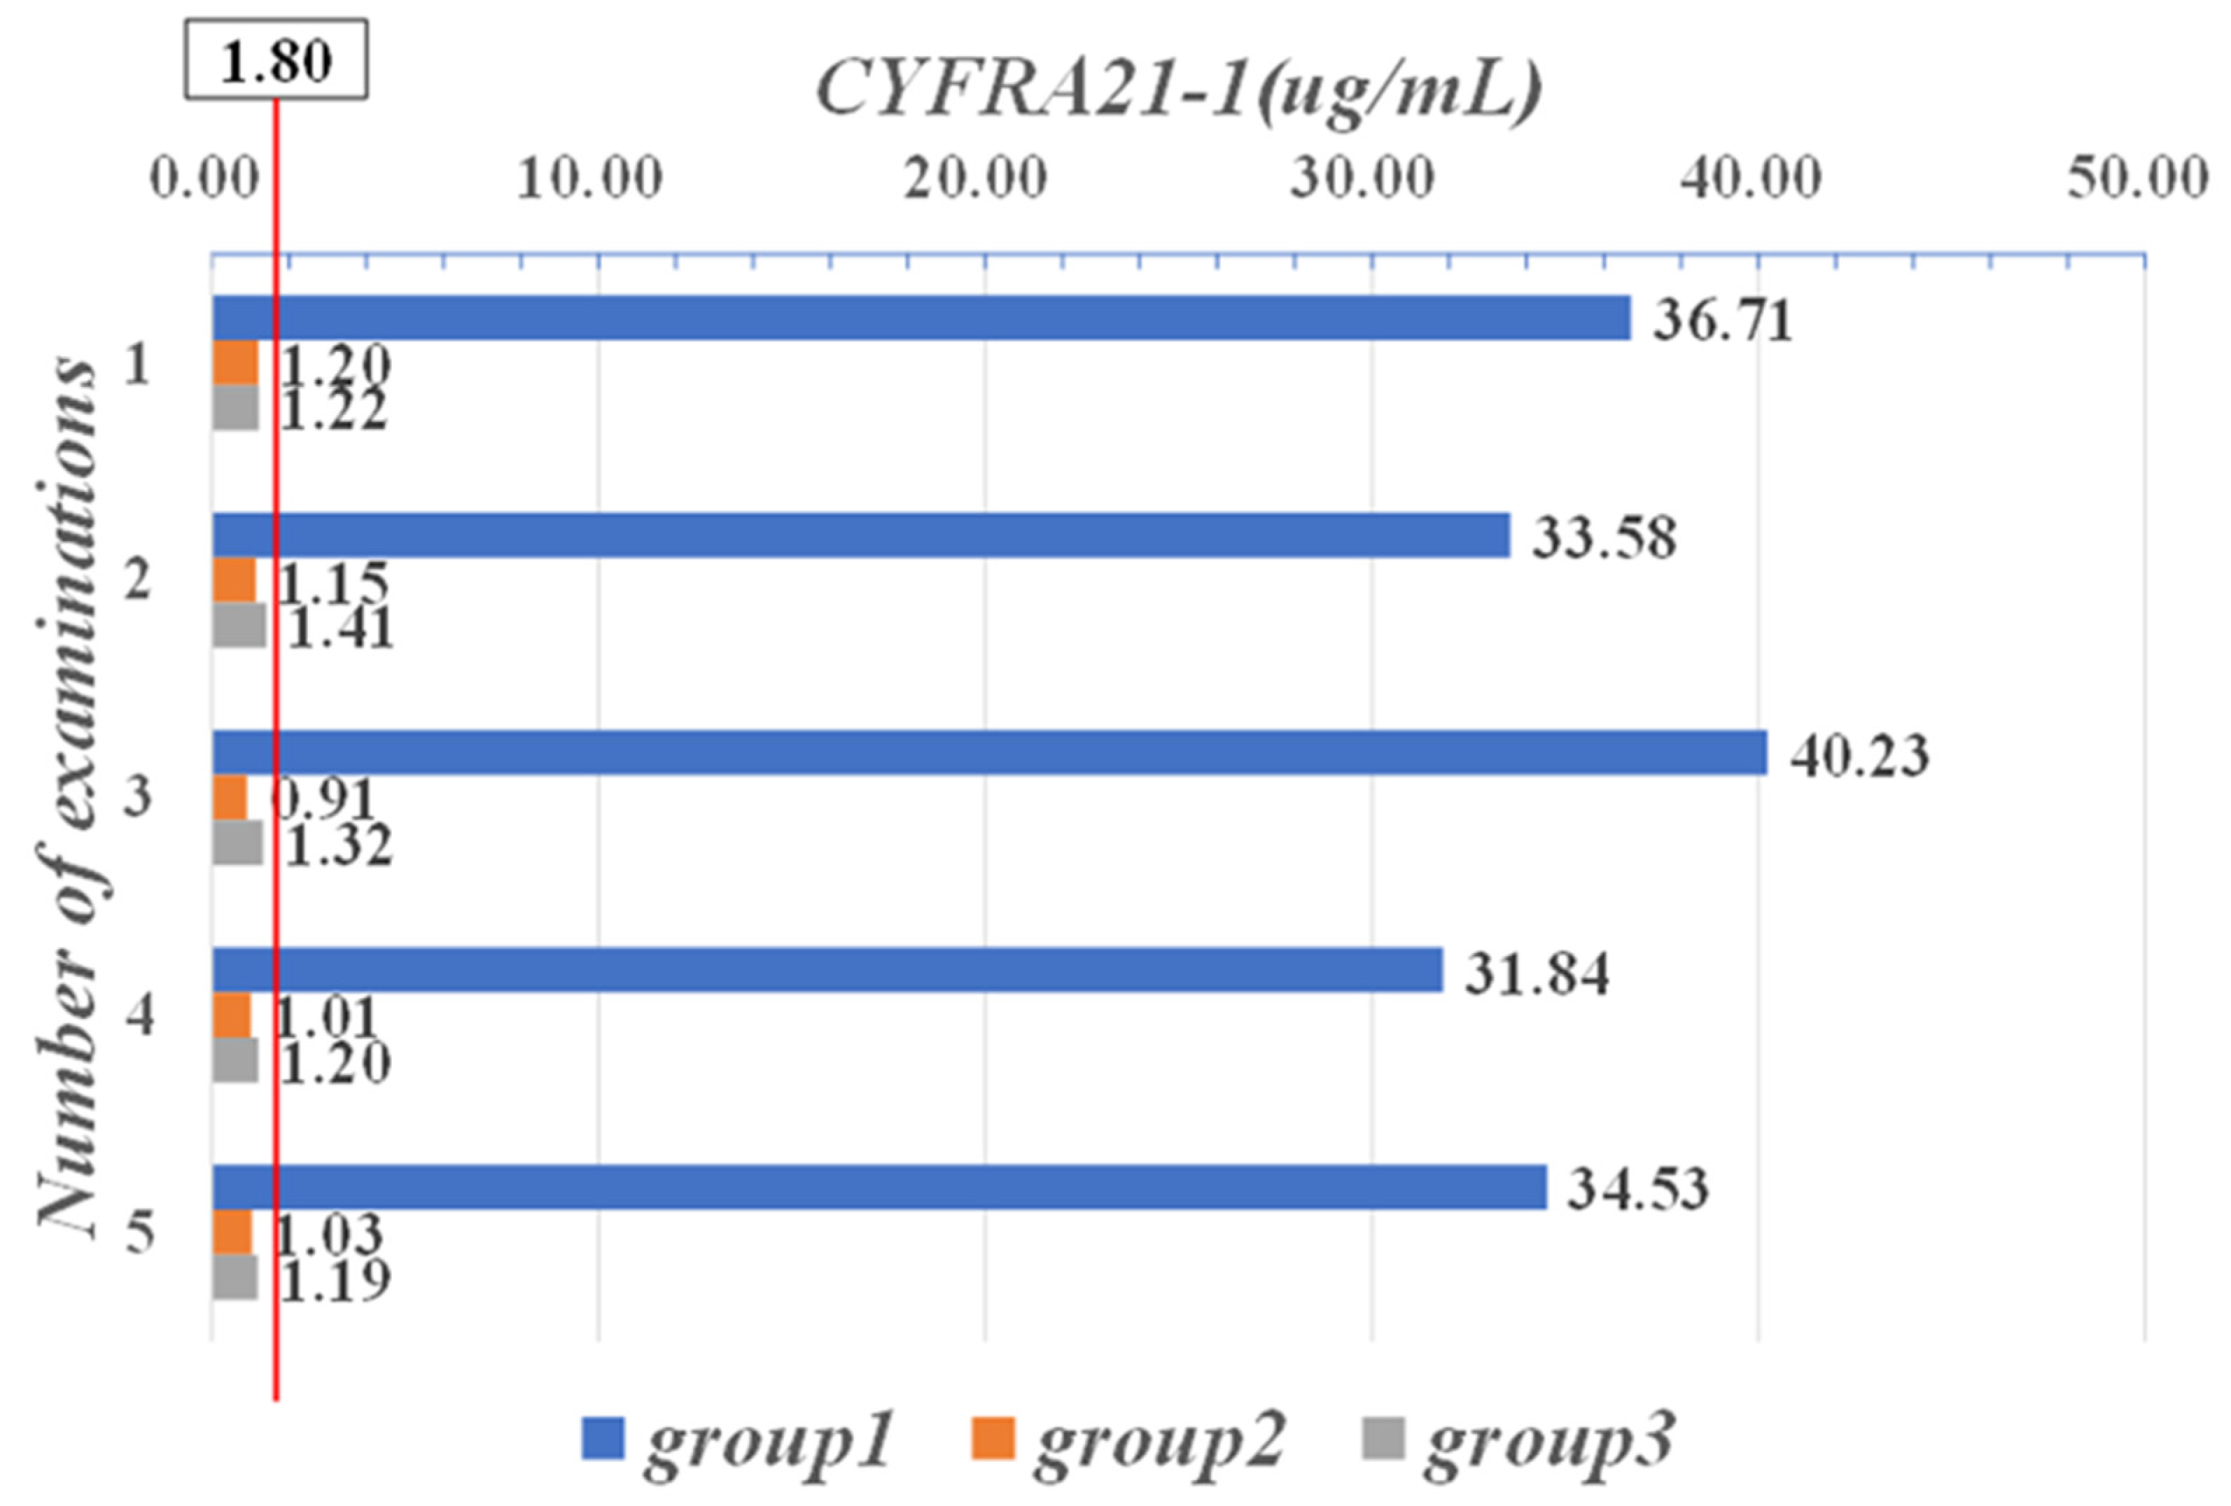
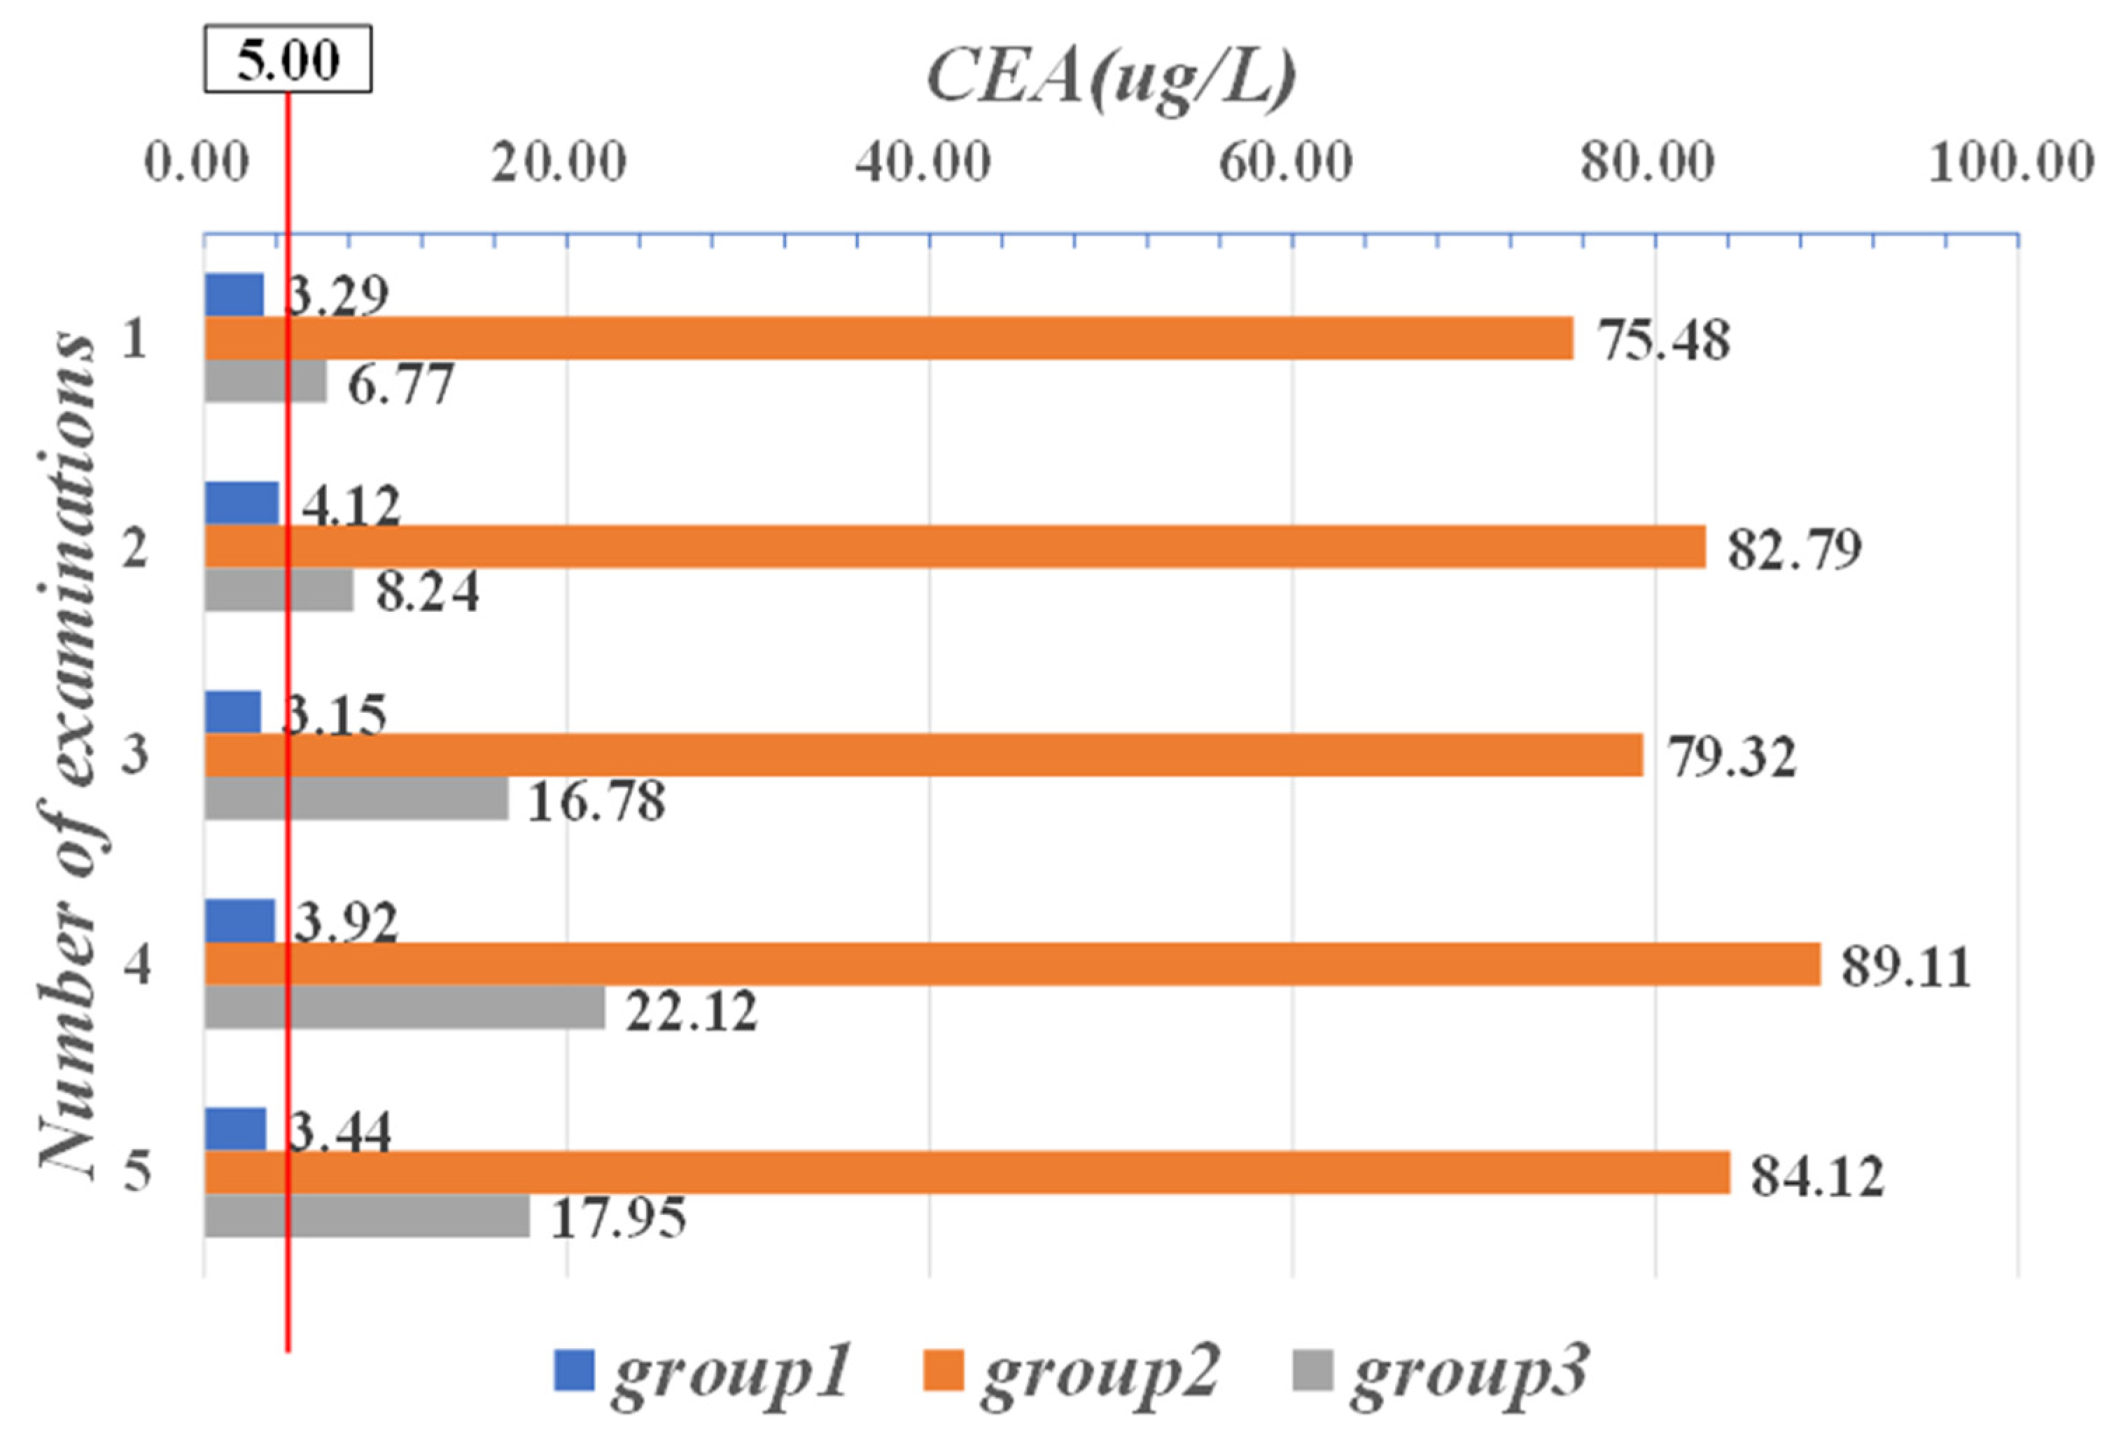
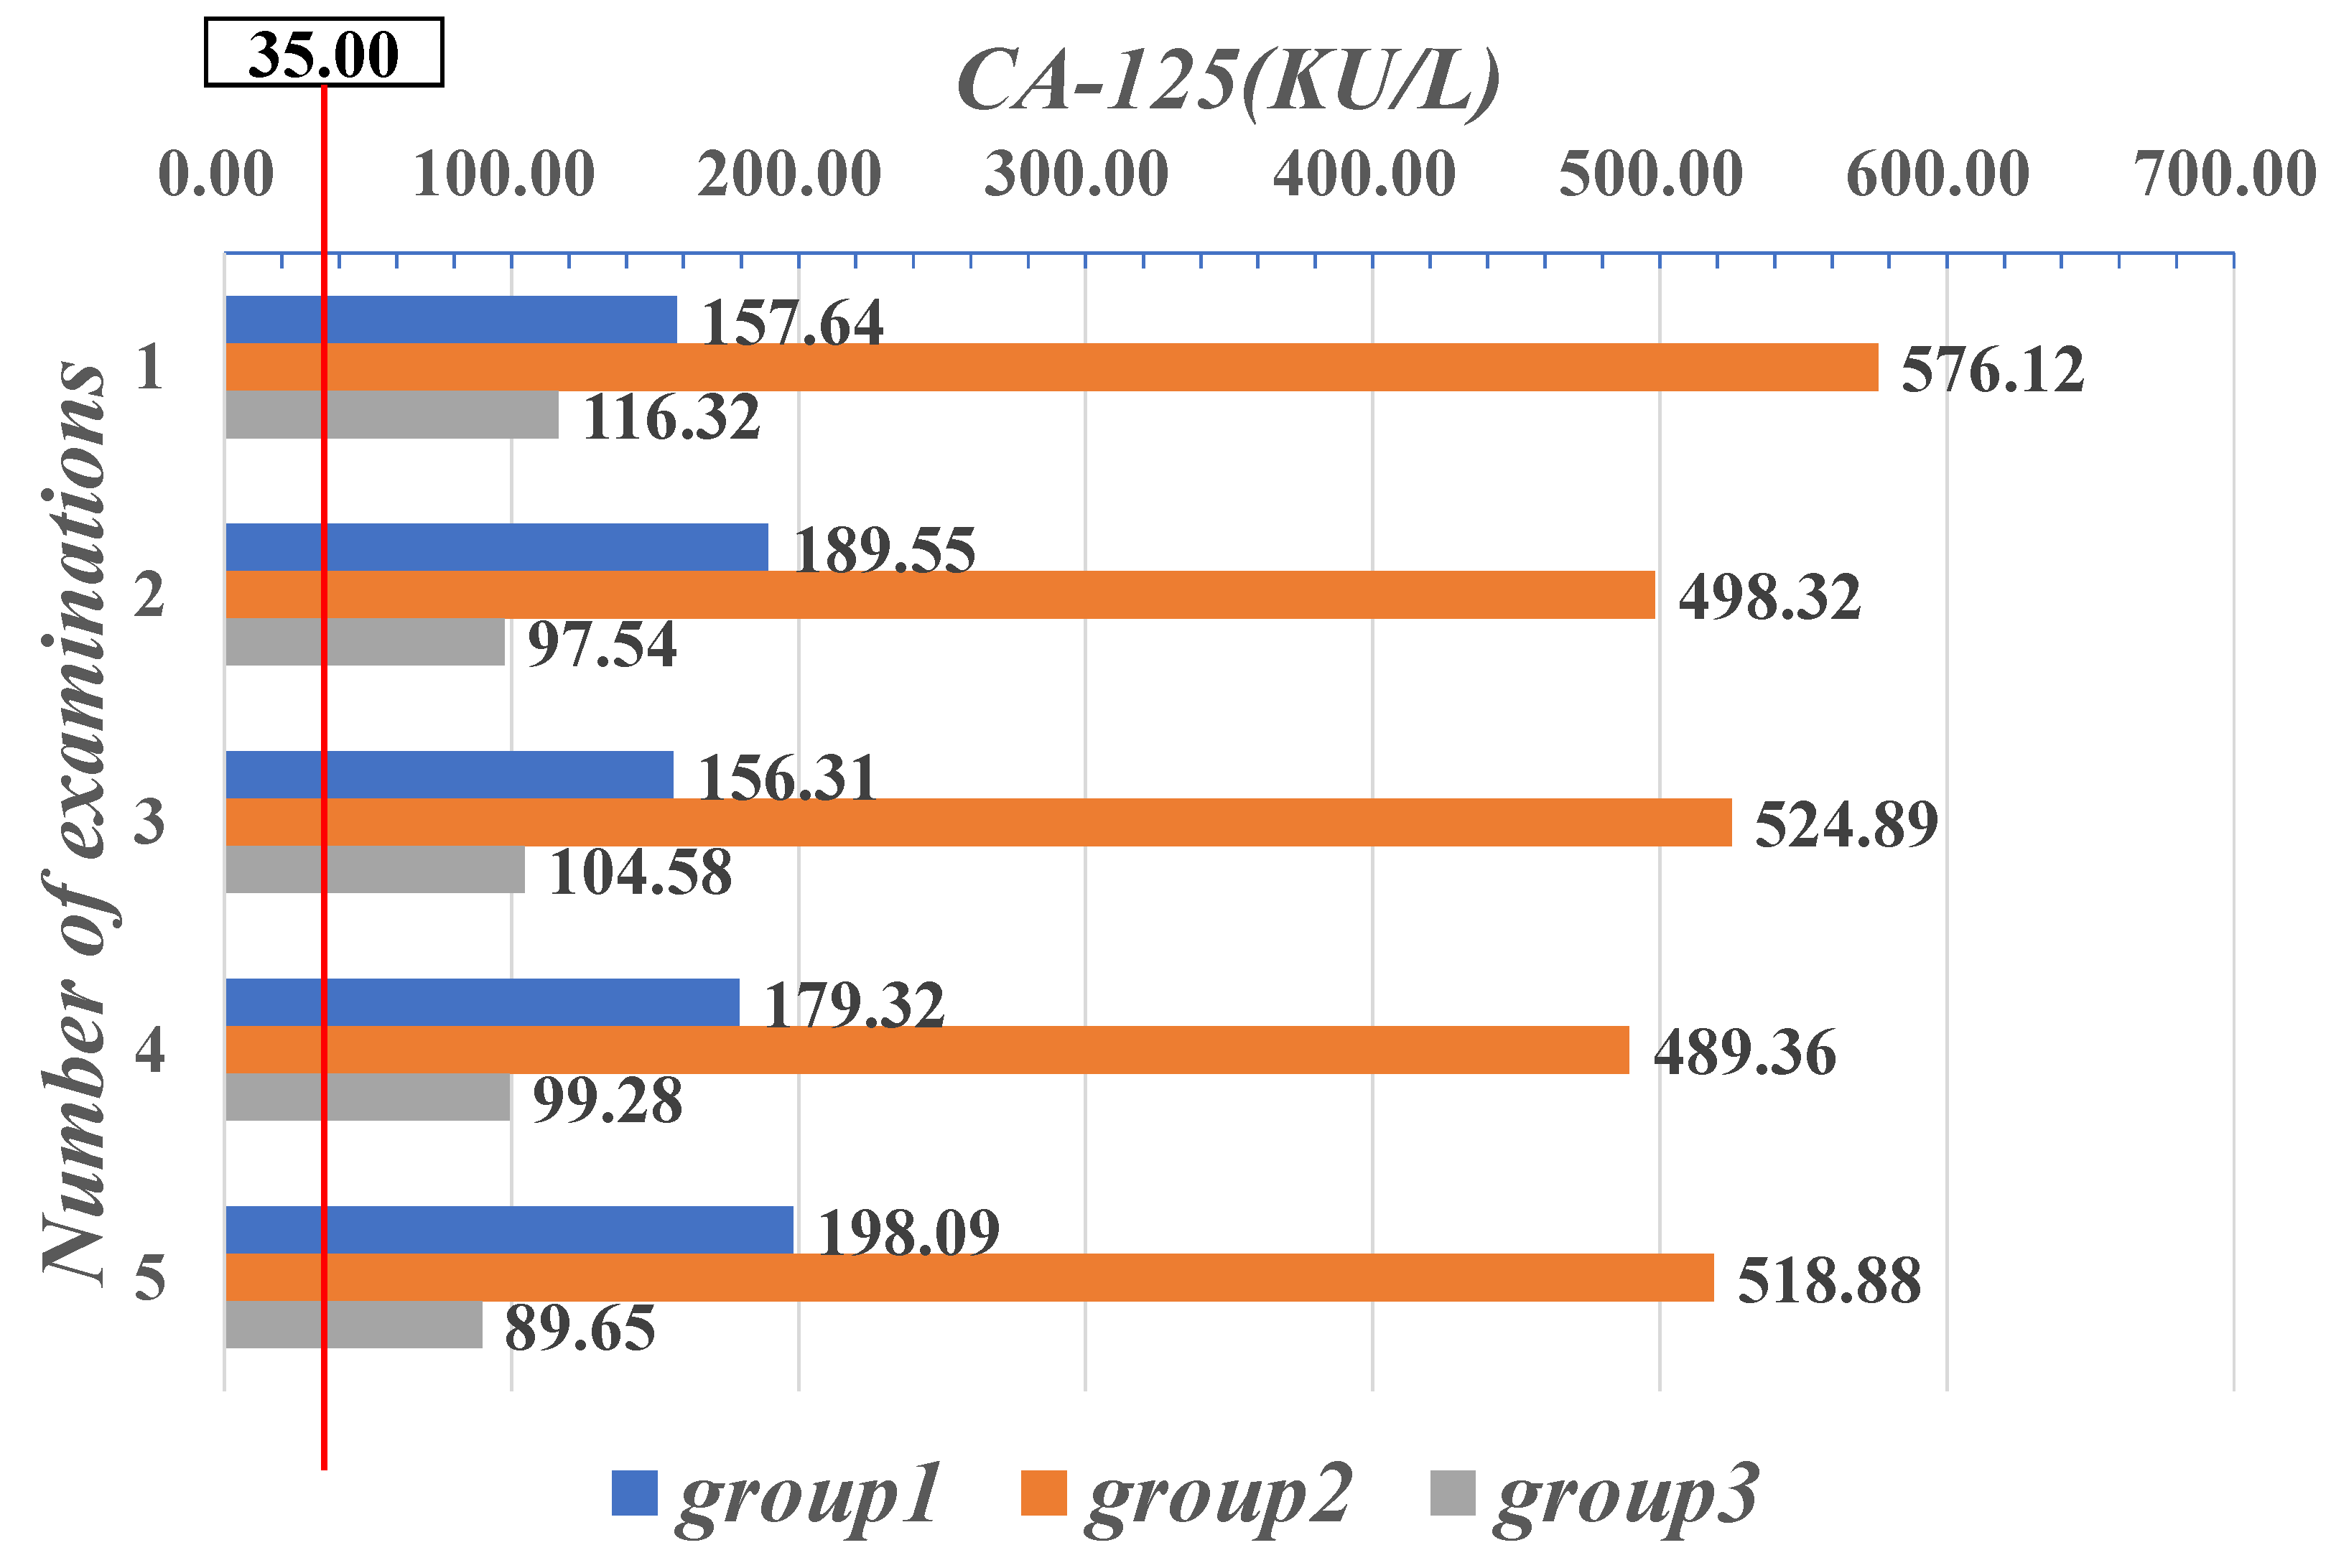
4.1. Diagnostic Data Parameters
4.2. Evaluate Performance
4.3. Decision-Making and Discussion
5. Conclusions
Author Contributions
Funding
Conflicts of Interest
References
- Sung, H.; Ferlay, J.; Siegel, R.L.; Laversanne, M.; Soerjomataram, I.; Jemal, A.; Bray, F. Global Cancer Statistics 2020: GLOBOCAN Estimates of Incidence and Mortality Worldwide for 36 Cancers in 185 Countries. CA Cancer J. Clin. 2021, 71, 209–249. [Google Scholar] [CrossRef] [PubMed]
- Chen, H.; Xiong, W.; Wu, J.; Zhuang, Q.; Yu, G. Decision-making model based on ensemble method in auxiliary medical system for non-small cell lung cancer. IEEE Access 2020, 8, 171903–171911. [Google Scholar] [CrossRef]
- Wu, J.; Tan, Y.; Chen, Z.; Zhao, M. Decision based on big data research for non-small cell lung cancer in medical artificial system in developing country. Comput. Methods Programs Biomed. 2018, 159, 87–101. [Google Scholar] [CrossRef]
- Wu, J.; Guan, P.; Tan, Y. Diagnosis and Data Probability Decision Based on Non-Small Cell Lung Cancer in Medical System. IEEE Access 2019, 7, 44851–44861. [Google Scholar] [CrossRef]
- Wu, J.; Tian, X.; Tan, Y. Hospital evaluation mechanism based on mobile health for IoT system in social networks. Comput. Biol. Med. 2019, 109, 138–147. [Google Scholar] [CrossRef]
- Wu, J.; Chen, Z. Data Decision and Transmission Based on Mobile Data Health Records on Sensor Devices in Wireless Networks. Wirel. Pers. Commun. 2016, 90, 2073–2087. [Google Scholar] [CrossRef]
- Wu, J.; Chang, L.; Yu, G. Effective Data Decision-Making and Transmission System Based on Mobile Health for Chronic Disease Management in the Elderly. IEEE Syst. J. 2020, 2020, 3024816. [Google Scholar] [CrossRef]
- Wu, J.; Tan, Y.; Chen, Z.; Zhao, M. Data decision and drug therapy based on non-small cell lung cancer in a big data medical system in developing countries. Symmetry 2018, 10, 152. [Google Scholar] [CrossRef] [Green Version]
- Haick, H.; Tang, N. Artificial Intelligence in Medical Sensors for Clinical Decisions. ACS Nano 2021, 15, 3557–3567. [Google Scholar] [CrossRef]
- Huynh, E.; Hosny, A.; Guthier, C.; Bitterman, D.S.; Petit, S.F.; Haas-Kogan, D.A.; Kann, B.; Aerts, H.J.W.L.; Mak, R.H. Artificial intelligence in radiation oncology. Nat. Rev. Clin. Oncol. 2020, 17, 771–781. [Google Scholar] [CrossRef]
- Iqbal, M.J.; Javed, Z.; Sadia, H.; Qureshi, I.A.; Irshad, A.; Ahmed, R.; Malik, K.; Raza, S.; Abbas, A.; Pezzani, R.; et al. Clinical applications of artificial intelligence and machine learning in cancer diagnosis: Looking into the future. Cancer Cell Int. 2021, 21, 270. [Google Scholar] [CrossRef]
- Christie, J.R.; Lang, P.; Zelko, L.M.; Palma, D.A.; Abdelrazek, M.; Mattonen, S.A. Artificial Intelligence in Lung Cancer: Bridging the Gap Between Computational Power and Clinical Decision-Making. Can. Assoc. Radiol. J. 2021, 72, 86–97. [Google Scholar] [CrossRef]
- Fang, Z.; Chang, L.; Luo, J.; Wu, J. A Data Transmission Algorithm Based on Triangle Link Structure Prediction in Opportunistic Social Networks. Electronics 2021, 10, 1128. [Google Scholar] [CrossRef]
- Lu, B.; Fu, L.; Nie, B.; Peng, Z.; Liu, H. A novel framework with high diagnostic sensitivity for lung cancer detection by electronic nose. Sensors 2019, 19, 5333. [Google Scholar] [CrossRef] [PubMed] [Green Version]
- Saidi, T.; Moufid, M.; de Jesus Beleño-Saenz, K.; Welearegay, T.G.; El Bari, N.; Lisset Jaimes-Mogollon, A.; Ionescu, R.; Bourkadi, J.E.; Benamor, J.; El Ftouh, M.; et al. Non-invasive prediction of lung cancer histological types through exhaled breath analysis by UV-irradiated electronic nose and GC/QTOF/MS. Sens. Actuators B Chem. 2020, 311. [Google Scholar] [CrossRef]
- Saba, T. Automated lung nodule detection and classification based on multiple classifiers voting. Microsc. Res. Tech. 2019, 82, 1601–1609. [Google Scholar] [CrossRef] [PubMed]
- Yu, G.; Chen, Z.; Wu, J.; Tan, Y. A diagnostic prediction framework on auxiliary medical system for breast cancer in developing countries. Knowl.-Based Syst. 2021, 232, 107459. [Google Scholar] [CrossRef]
- Yu, G.; Chen, Z.; Wu, J.; Tan, Y. Medical decision support system for cancer treatment in precision medicine in developing countries. Expert Syst. Appl. 2021, 186, 115725. [Google Scholar] [CrossRef]
- Wang, L.; Luo, L.; Wang, Y.; Wampfler, J.; Yang, P.; Liu, H. Natural language processing for populating lung cancer clinical research data. BMC Med. Inform. Decis. Mak. 2019, 19, 239. [Google Scholar] [CrossRef] [Green Version]
- Yu, L.; Tao, G.; Zhu, L.; Wang, G.; Li, Z.; Ye, J.; Chen, Q. Prediction of pathologic stage in non-small cell lung cancer using machine learning algorithm based on CT image feature analysis. BMC Cancer 2019, 19, 464. [Google Scholar] [CrossRef] [Green Version]
- Lu, Y.; Chang, L.; Luo, J. Routing Algorithm Based on User Adaptive Data Transmission Scheme in Opportunistic Social Networks. Electronics 2021, 10, 1138. [Google Scholar] [CrossRef]
- Wu, J.; Gou, F.; Tan, Y. A Staging Auxiliary Diagnosis Model for Nonsmall Cell Lung Cancer Based on the Intelligent Medical System. Comput. Math. Methods Med. 2021, 2021, 6654946. [Google Scholar] [CrossRef]
- Dong, Y.; Chang, L.; Luo, J.; Wu, J. A Routing Query Algorithm Based on Time-Varying Relationship Group in Opportunistic Social Networks. Electronics 2021, 10, 1595. [Google Scholar] [CrossRef]
- Masud, M.; Sikder, N.; AlNahid, A.; Bairagi, A.K.; Alzain, M.A. A machine learning approach to diagnosing lung and colon cancer using a deep learning-based classification framework. Sensors 2021, 21, 748. [Google Scholar] [CrossRef]
- Gou, F.; Wu, J. Triad link prediction method based on the evolutionary analysis with IoT in opportunistic social networks. Comput. Commun. 2022, 181C, 143–155. [Google Scholar] [CrossRef]
- Yu, K.H.; Wang, F.; Berry, G.J.; Ré, C.; Altman, R.B.; Snyder, M.; Kohane, I.S. Classifying non-small cell lung cancer types and transcriptomic subtypes using convolutional neural networks. J. Am. Med. Inform. Assoc. 2020, 27, 757–769. [Google Scholar] [CrossRef]
- Han, Y.; Ma, Y.; Wu, Z.; Zhang, F.; Zheng, D.; Liu, X.; Tao, L.; Liang, Z.; Yang, Z.; Li, X.; et al. Histologic subtype classification of non-small cell lung cancer using PET/CT images. Eur. J. Nucl. Med. Mol. Imaging 2021, 48, 350–360. [Google Scholar] [CrossRef] [PubMed]
- Wu, J.; Chen, Z.; Zhao, M. An efficient data packet iteration and transmission algorithm in opportunistic social networks. J. Ambient. Intell. Humaniz. Comput. 2020, 11, 3141–3153. [Google Scholar] [CrossRef]
- Bębas, E.; Borowska, M.; Derlatka, M.; Oczeretko, E.; Hładuński, M.; Szumowski, P.; Mojsak, M. Machine-learning-based classification of the histological subtype of non-small-cell lung cancer using MRI texture analysis. Biomed. Signal Process. Control 2021, 66, 102446. [Google Scholar] [CrossRef]
- Cheng, C.H.; Chen, H.H.; Chen, T.L. A clinical decision-support system based on three-stage integrated image analysis for diagnosing lung disease. Symmetry 2020, 12, 386. [Google Scholar] [CrossRef] [Green Version]
- Pandiangan, T.; Bali, I.; Silalahi, A.R.J. Early lung cancer detection using artificial neural network. Atom Indones. 2019, 45, 9–15. [Google Scholar] [CrossRef] [Green Version]
- Xie, Y.; Meng, W.Y.; Li, R.Z.; Wang, Y.W.; Qian, X.; Chan, C.; Yu, Z.F.; Fan, X.X.; Pan, H.D.; Xie, C.; et al. Early lung cancer diagnostic biomarker discovery by machine learning methods. Transl. Oncol. 2021, 14, 100907. [Google Scholar] [CrossRef] [PubMed]
- Guo, J.; Wang, C.; Xu, X.; Shao, J.; Yang, L.; Gan, Y.; Yi, Z.; Li, W. DeepLN: An artificial intelligence-based automated system for lung cancer screening. Ann. Transl. Med. 2020, 8, 1126. [Google Scholar] [CrossRef] [PubMed]
- Tu, Y.; Wu, Y.; Lu, Y.; Bi, X.; Chen, T. Development of risk prediction models for lung cancer based on tumor markers and radiological signs. J. Clin. Lab. Anal. 2021, 35, e23682. [Google Scholar] [CrossRef] [PubMed]
- Ahmad, A.S.; Mayya, A.M. A new tool to predict lung cancer based on risk factors. Heliyon 2020, 6, e03402. [Google Scholar] [CrossRef] [PubMed]
- Cui, L.; Li, H.; Hui, W.; Chen, S.; Yang, L.; Kang, Y.; Bo, Q.; Feng, J. A deep learning-based framework for lung cancer survival analysis with biomarker interpretation. BMC Bioinform. 2020, 21, 112. [Google Scholar] [CrossRef] [PubMed] [Green Version]
- Zhang, Y.H.; Lu, Y.; Lu, H.; Zhou, Y.M. Development of a Survival Prognostic Model for Non-small Cell Lung Cancer. Front. Oncol. 2020, 10, 362. [Google Scholar] [CrossRef]
- Wang, J.; Chen, N.; Guo, J.; Xu, X.; Liu, L.; Yi, Z. SurvNet: A Novel Deep Neural Network for Lung Cancer Survival Analysis with Missing Values. Front. Oncol. 2021, 10, 588990. [Google Scholar] [CrossRef]
- Huang, Z.; Hu, C.; Chi, C.; Jiang, Z.; Tong, Y.; Zhao, C. An Artificial Intelligence Model for Predicting 1-Year Survival of Bone Metastases in Non-Small-Cell Lung Cancer Patients Based on XGBoost Algorithm. BioMed Res. Int. 2020, 2020, 3462363. [Google Scholar] [CrossRef]
- Lu, C.; Bera, K.; Wang, X.; Prasanna, P.; Xu, J.; Janowczyk, A.; Beig, N.; Yang, M.; Fu, P.; Lewis, J.; et al. A prognostic model for overall survival of patients with early-stage non-small cell lung cancer: A multicentre, retrospective study. Lancet Digit. Health 2020, 2, e594–e606. [Google Scholar] [CrossRef]
- Lai, Y.H.; Chen, W.N.; Hsu, T.C.; Lin, C.; Tsao, Y.; Wu, S. Overall survival prediction of non-small cell lung cancer by integrating microarray and clinical data with deep learning. Sci. Rep. 2020, 10, 4679. [Google Scholar] [CrossRef] [PubMed]
- She, Y.; Jin, Z.; Wu, J.; Deng, J.; Zhang, L.; Su, H.; Jiang, G.; Liu, H.; Xie, D.; Cao, N.; et al. Development and Validation of a Deep Learning Model for Non-Small Cell Lung Cancer Survival. JAMA Netw. Open 2020, 3, e205842. [Google Scholar] [CrossRef]
- Cui, R.; Chen, Z.; Wu, J.; Tan, Y.L.; Yu, G.H. A Multiprocessing Scheme for PET Image Pre-Screening, Noise Reduction, Segmentation and Lesion Partitioning. IEEE J. Biomed. Heal. Inform. 2021, 25, 1699–1711. [Google Scholar] [CrossRef] [PubMed]
- Baek, S.; He, Y.; Allen, B.G.; Buatti, J.M.; Smith, B.J.; Tong, L.; Sun, Z.; Wu, J.; Diehn, M.; Loo, B.W.; et al. Deep segmentation networks predict survival of non-small cell lung cancer. Sci. Rep. 2019, 9, 17286. [Google Scholar] [CrossRef] [Green Version]
- Lee, B.; Chun, S.H.; Hong, J.H.; Woo, I.S.; Kim, S.; Jeong, J.W.; Kim, J.J.; Lee, H.W.; Na, S.J.; Beck, K.S.; et al. DeepBTS: Prediction of Recurrence-free Survival of Non-small Cell Lung Cancer Using a Time-binned Deep Neural Network. Sci. Rep. 2020, 10, 1952. [Google Scholar] [CrossRef] [PubMed] [Green Version]
- Luo, S.; Xu, J.; Jiang, Z.; Liu, L.; Wu, Q.; Leung, E.L.H.; Leung, A.P. Artificial intelligence-based collaborative filtering method with ensemble learning for personalized lung cancer medicine without genetic sequencing. Pharmacol. Res. 2020, 160, 105037. [Google Scholar] [CrossRef]
- Wu, J.; Zhuang, Q.; Tan, Y. Auxiliary Medical Decision System for Prostate Cancer Based on Ensemble Method. Comput. Math. Methods Med. 2020, 2020, 6509596. [Google Scholar] [CrossRef]
- Meldo, A.; Utkin, L.; Kovalev, M.; Kasimov, E. The natural language explanation algorithms for the lung cancer computer-aided diagnosis system. Artif. Intell. Med. 2020, 108, 101952. [Google Scholar] [CrossRef]
- Song, Z.; Liu, T.; Shi, L.; Yu, Z.; Shen, Q.; Xu, M.; Huang, Z.; Cai, Z.; Wang, W.; Xu, C.; et al. The deep learning model combining CT image and clinicopathological information for predicting ALK fusion status and response to ALK-TKI therapy in non-small cell lung cancer patients. Eur. J. Nucl. Med. Mol. Imaging 2021, 48, 361–371. [Google Scholar] [CrossRef]


| Type | Number |
|---|---|
| Patient information | 2,789,675 |
| Outpatient service | 968,545 |
| Doctors’ device in outpatient | 28,554,590 |
| Hospitalized | 1,676,899 |
| Diagnosis | 1,124,561 |
| Electronic medical records | 5,287,413 |
| Doctors’ device in clinical | 31,427,790 |
| Inspection records | 179,712 |
| Medical laboratory records | 9,483,216 |
| Routine inspection records | 24,287,612 |
| Operation records | 393,218 |
| Drug records | 90,631 |
| Parameter | CYFRA21-1 (μg/mL) | CEA (μg/L) | CA-125 (KU/L) |
|---|---|---|---|
| Range | 0–1.80 | 0–5.00 | 0–35.00 |
| Parameter | NSE (μg/mL) | CA242 (KU/L) | PSA (μg/mL) | HGH (μg/mL) | Free-PSA (μg/mL) |
|---|---|---|---|---|---|
| Normal data area | 0–13.00 | 0–20.00 | 0–5.00 | 0–7.50 | 0–1.00 |
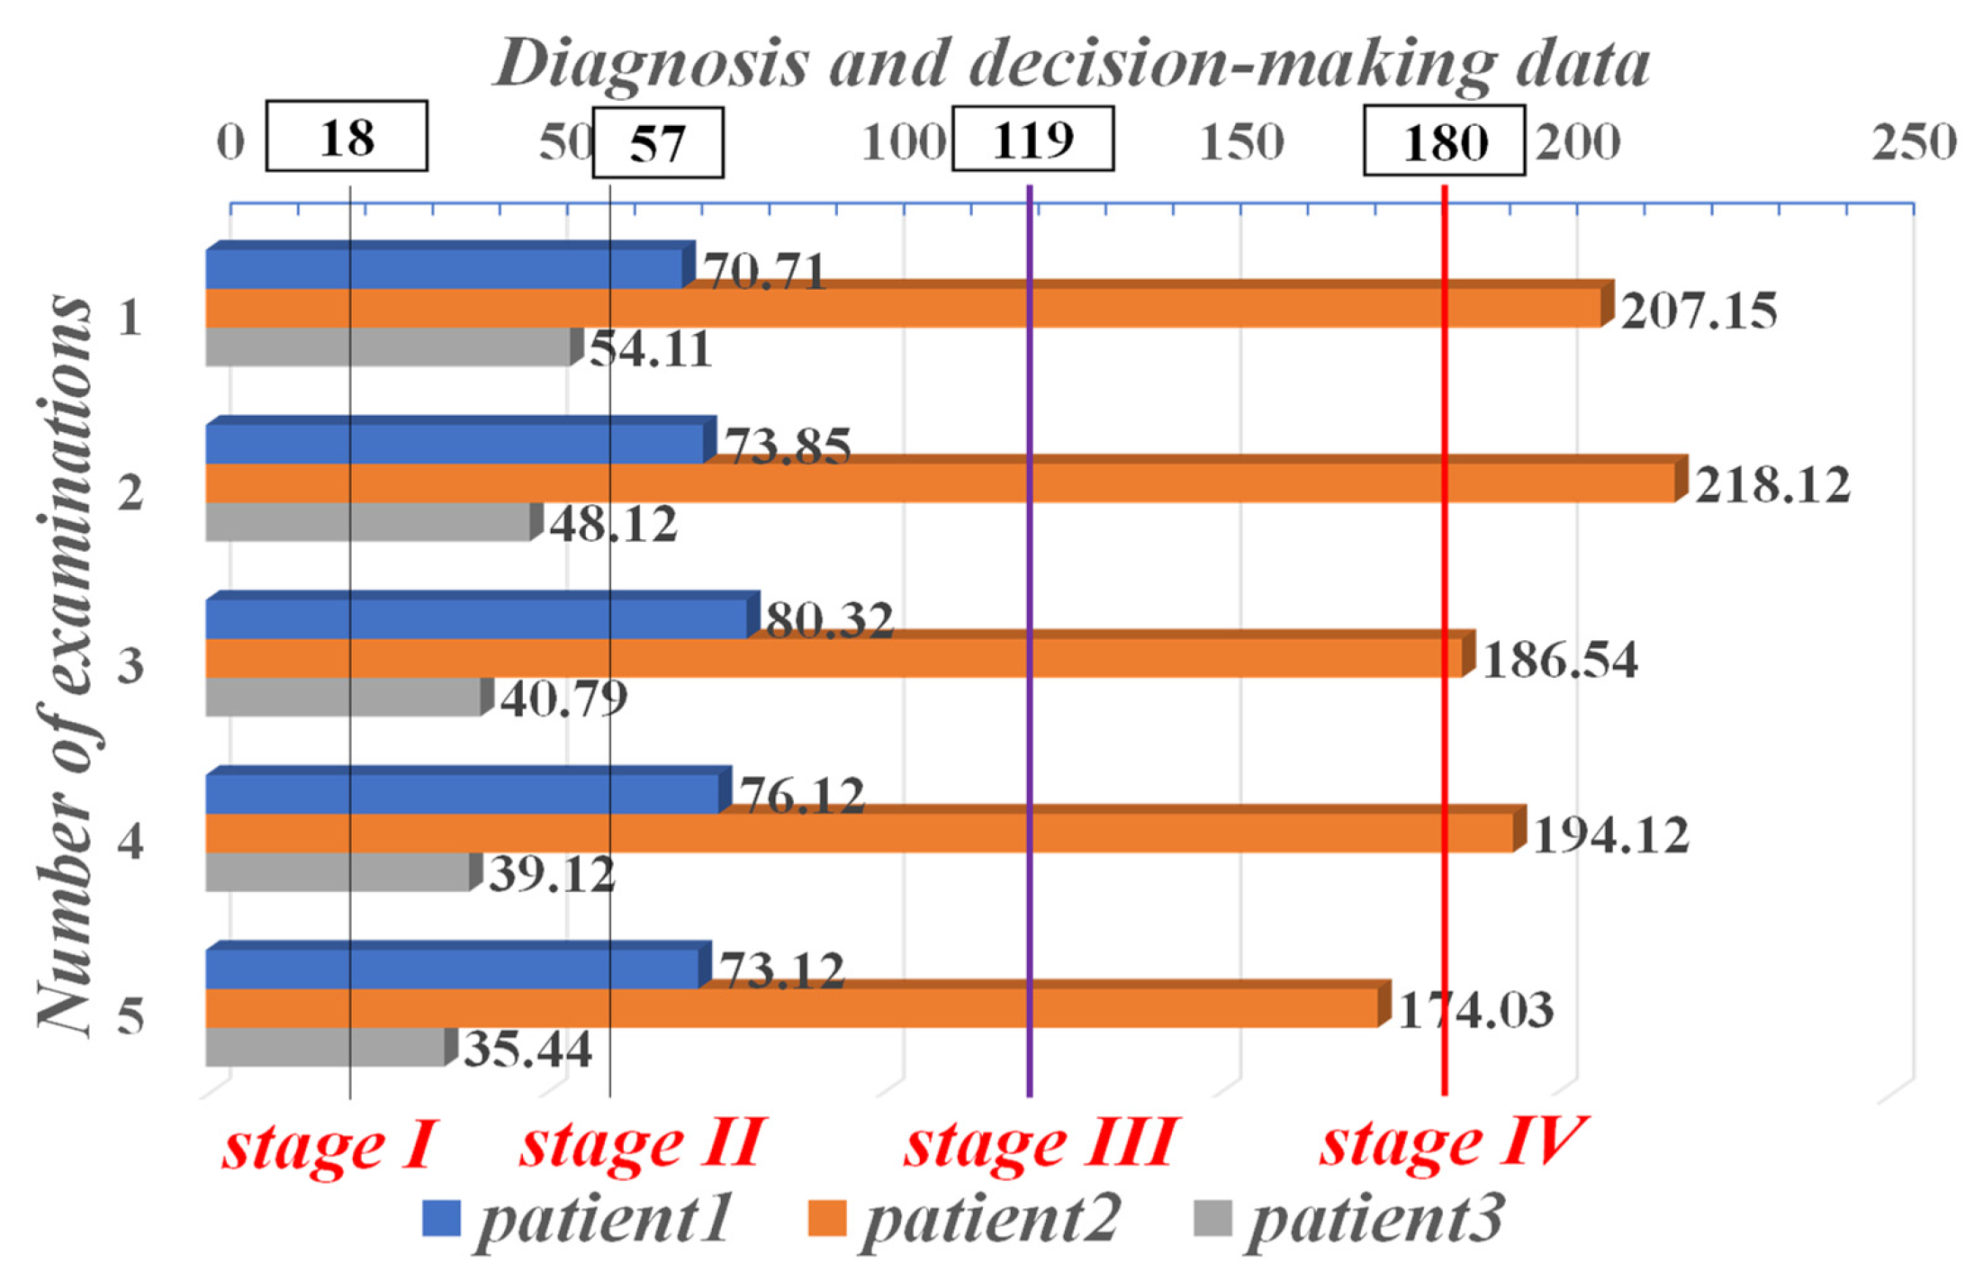
| Stage Partition | Stage I | Stage II | Stage III | Stage IV |
|---|---|---|---|---|
| Range | 18–57 | 58–119 | 119–180 | >180 |
| CYFRA21-1 (μg/mL) | CEA (μg/L) | CA-125 (KU/L) | NSE (μg/mL) | CA242 (KU/L) | PSA (μg/mL) | HGH (μg/mL) | Free-PSA (μg/mL) | FERRITIN (KU/L) |
|---|---|---|---|---|---|---|---|---|
| 36.71 | 3.29 | 157.64 | 21 | 31 | 0.81 | 0.51 | 1.88 | 154.2 |
| 33.58 | 4.12 | 189.55 | 16 | 24 | 1.01 | 0.82 | 1.45 | 189.6 |
| 40.23 | 3.15 | 156.31 | 27 | 32 | 0.95 | 0.77 | 1.78 | 175.8 |
| 31.84 | 3.92 | 179.32 | 22 | 28 | 1.45 | 0.48 | 0.81 | 193.7 |
| 34.53 | 3.44 | 198.09 | 19 | 31 | 0.98 | 0.89 | 0.57 | 173.8 |
| 1.20 | 75.48 | 576.12 | 33 | 9 | 1.22 | 11.25 | 21.88 | 935.7 |
| 1.15 | 82.79 | 498.32 | 37 | 5 | 1.48 | 22.82 | 28.74 | 854.1 |
| 0.91 | 79.32 | 524.89 | 22 | 6 | 1.88 | 19.85 | 24.32 | 718.2 |
| 1.01 | 89.11 | 489.36 | 24 | 7 | 0.99 | 23.58 | 26.81 | 921.5 |
| 1.03 | 84.12 | 518.88 | 27 | 4 | 1.57 | 18.78 | 37.58 | 814.6 |
| 1.22 | 6.77 | 116.32 | 31 | 21 | 7.22 | 6.51 | 0.12 | 258.9 |
| 1.41 | 8.24 | 97.54 | 36 | 26 | 7.52 | 5.32 | 0.55 | 322.7 |
| 1.32 | 16.78 | 104.58 | 35 | 29 | 7.14 | 4.87 | 0.17 | 278.9 |
| 1.20 | 22.12 | 99.28 | 28 | 24 | 8.56 | 5.99 | 0.45 | 341.8 |
| 1.19 | 17.95 | 89.65 | 21 | 22 | 8.47 | 6.02 | 0.67 | 304.8 |
| CYFRA21-1 (μg/mL) | CEA (μg/L) | CA-125 (KU/L) | NSE (μg/mL) | CA242 (KU/L) | PSA (μg/mL) | HGH (μg/mL) | Free-PSA (μg/mL) | FERRITIN (KU/L) | |
|---|---|---|---|---|---|---|---|---|---|
| 1 | 4.16 | 285.41 | 711.01 | 34 | 8 | 1.12 | 10.25 | 58.81 | 835.7 |
| 2 | 5.57 | 277.99 | 688.81 | 36 | 5 | 1.42 | 11.21 | 49.71 | 754.1 |
| 3 | 3.55 | 257.15 | 521.42 | 27 | 6 | 1.86 | 12.15 | 48.22 | 738.2 |
| 4 | 4.28 | 231.44 | 461.56 | 25 | 6 | 1.29 | 11.20 | 47.55 | 622.1 |
| 5 | 3.47 | 184.88 | 408.18 | 36 | 5 | 1.54 | 15.71 | 38.51 | 422.6 |
| 6 | 4.84 | 128.11 | 321.88 | 27 | 7 | 1.68 | 13.88 | 35.12 | 351.8 |
| 7 | 5.17 | 62.89 | 295.10 | 38 | 6 | 1.71 | 12.51 | 11.6 | 211.1 |
| 8 | 3.89 | 21.17 | 178.20 | 21 | 5 | 1.55 | 13.61 | 7.1 | 209.7 |
| Parameters | Description |
|---|---|
| layer 1 | word vector matrix |
| layer 2 | convolutional layer with multi-scale kernels, 3 kernels, kernel size [3,4,5] |
| layer 3 | 1-max pooling |
| layer 4 | full connection with dropout = 0.5 and softmax output |
| epoch size | 256 |
| optimizer | stochastic gradient descent (SGD) |
| k-fold | 10 |
| Category | Sensitivity (%) | Specificity (%) | Accuracy (%) | AUC |
|---|---|---|---|---|
| Stage I | 92.04 | 91.34 | 92.20 | 0.93 |
| Stage II | 93.20 | 92.30 | 94.17 | 0.94 |
| Stage III | 94.60 | 95.85 | 97.50 | 0.97 |
| Stage IV | 96.83 | 96.79 | 95.94 | 0.96 |
Publisher’s Note: MDPI stays neutral with regard to jurisdictional claims in published maps and institutional affiliations. |
© 2021 by the authors. Licensee MDPI, Basel, Switzerland. This article is an open access article distributed under the terms and conditions of the Creative Commons Attribution (CC BY) license (https://creativecommons.org/licenses/by/4.0/).
Share and Cite
Zhan, X.; Long, H.; Gou, F.; Duan, X.; Kong, G.; Wu, J. A Convolutional Neural Network-Based Intelligent Medical System with Sensors for Assistive Diagnosis and Decision-Making in Non-Small Cell Lung Cancer. Sensors 2021, 21, 7996. https://doi.org/10.3390/s21237996
Zhan X, Long H, Gou F, Duan X, Kong G, Wu J. A Convolutional Neural Network-Based Intelligent Medical System with Sensors for Assistive Diagnosis and Decision-Making in Non-Small Cell Lung Cancer. Sensors. 2021; 21(23):7996. https://doi.org/10.3390/s21237996
Chicago/Turabian StyleZhan, Xiangbing, Huiyun Long, Fangfang Gou, Xun Duan, Guangqian Kong, and Jia Wu. 2021. "A Convolutional Neural Network-Based Intelligent Medical System with Sensors for Assistive Diagnosis and Decision-Making in Non-Small Cell Lung Cancer" Sensors 21, no. 23: 7996. https://doi.org/10.3390/s21237996