1. Introduction
Plasmons are surface waves of conduction electrons inside the metallic film with a dielectric border. The dispersion relation for plasmons differs from the bulk plasma due to an interaction with the dielectric medium. An electric field decays when one penetrates deeper into the metal and dielectric areas. At plasmon resonance, there is a notable increase in electric field intensity [
1]. There is important progress in the light scattering study of small particles with plasmon excitation [
2], their dimers [
3], or other plasmonic nanostructures [
4].
Applications of surface plasmons are diverse: from optical biosensors [
5,
6,
7] to the acceleration of relativistic electrons [
8] and space jet engines [
9]. A number of applications are based on the symmetry broken structures: the “hybridisation” of plasmons, i.e., the interaction of elementary surface waves supported by nanostructures [
10,
11,
12].
Let us consider the lower dielectric half-space as the substrate with a planar periodic structure on top. The refractive index of the upper half-space strongly affects the angular and wavelength spectral characteristics of the scattering layer due to crucial changes in layer effective permittivity. These resonance responses underlie plasmon biosensors. Scattering on a layer is also essential for research in silicon photonics, such as the study, development, and manufacture of optical microcircuits in which photons propagate instead of electrons [
13]. All-optical circuits can significantly enhance the density of communication channels and lead to considerable energy savings.
Recently, the study of the plasmon–enhanced local field in the array of parallel circular metallic cylinders was proposed to improve sensitivity to refractive index variations [
14] regarding rapid changes in the Fresnel coefficients near the angle of total internal reflection (TIR). We had analyzed the grid of parallel metallic cylinders between two dielectrics; see [
15] and references therein. The idea of the boundary element method (BEM) is to reduce the Maxwell equations to boundary integral ones applying the Green theorem. In the case of a grid with parallel cylinders, the Floquet theorem reduces the problem of one cylinder within one elementary cell. To obtain analytical formulas, we exploited simplified models. The sequence of nanowires can be approximately replaced by a thin layer with averaged permittivity [
16]. The model offered approximate angular dependence but never yielded quantitative agreement. In the present paper, we treat more general models of a layer with an anisotropic dielectric tensor. Cylinders of the elliptical cross-section with different orientations are compared with the model, demonstrating its advantage.
2. BEM Calculation
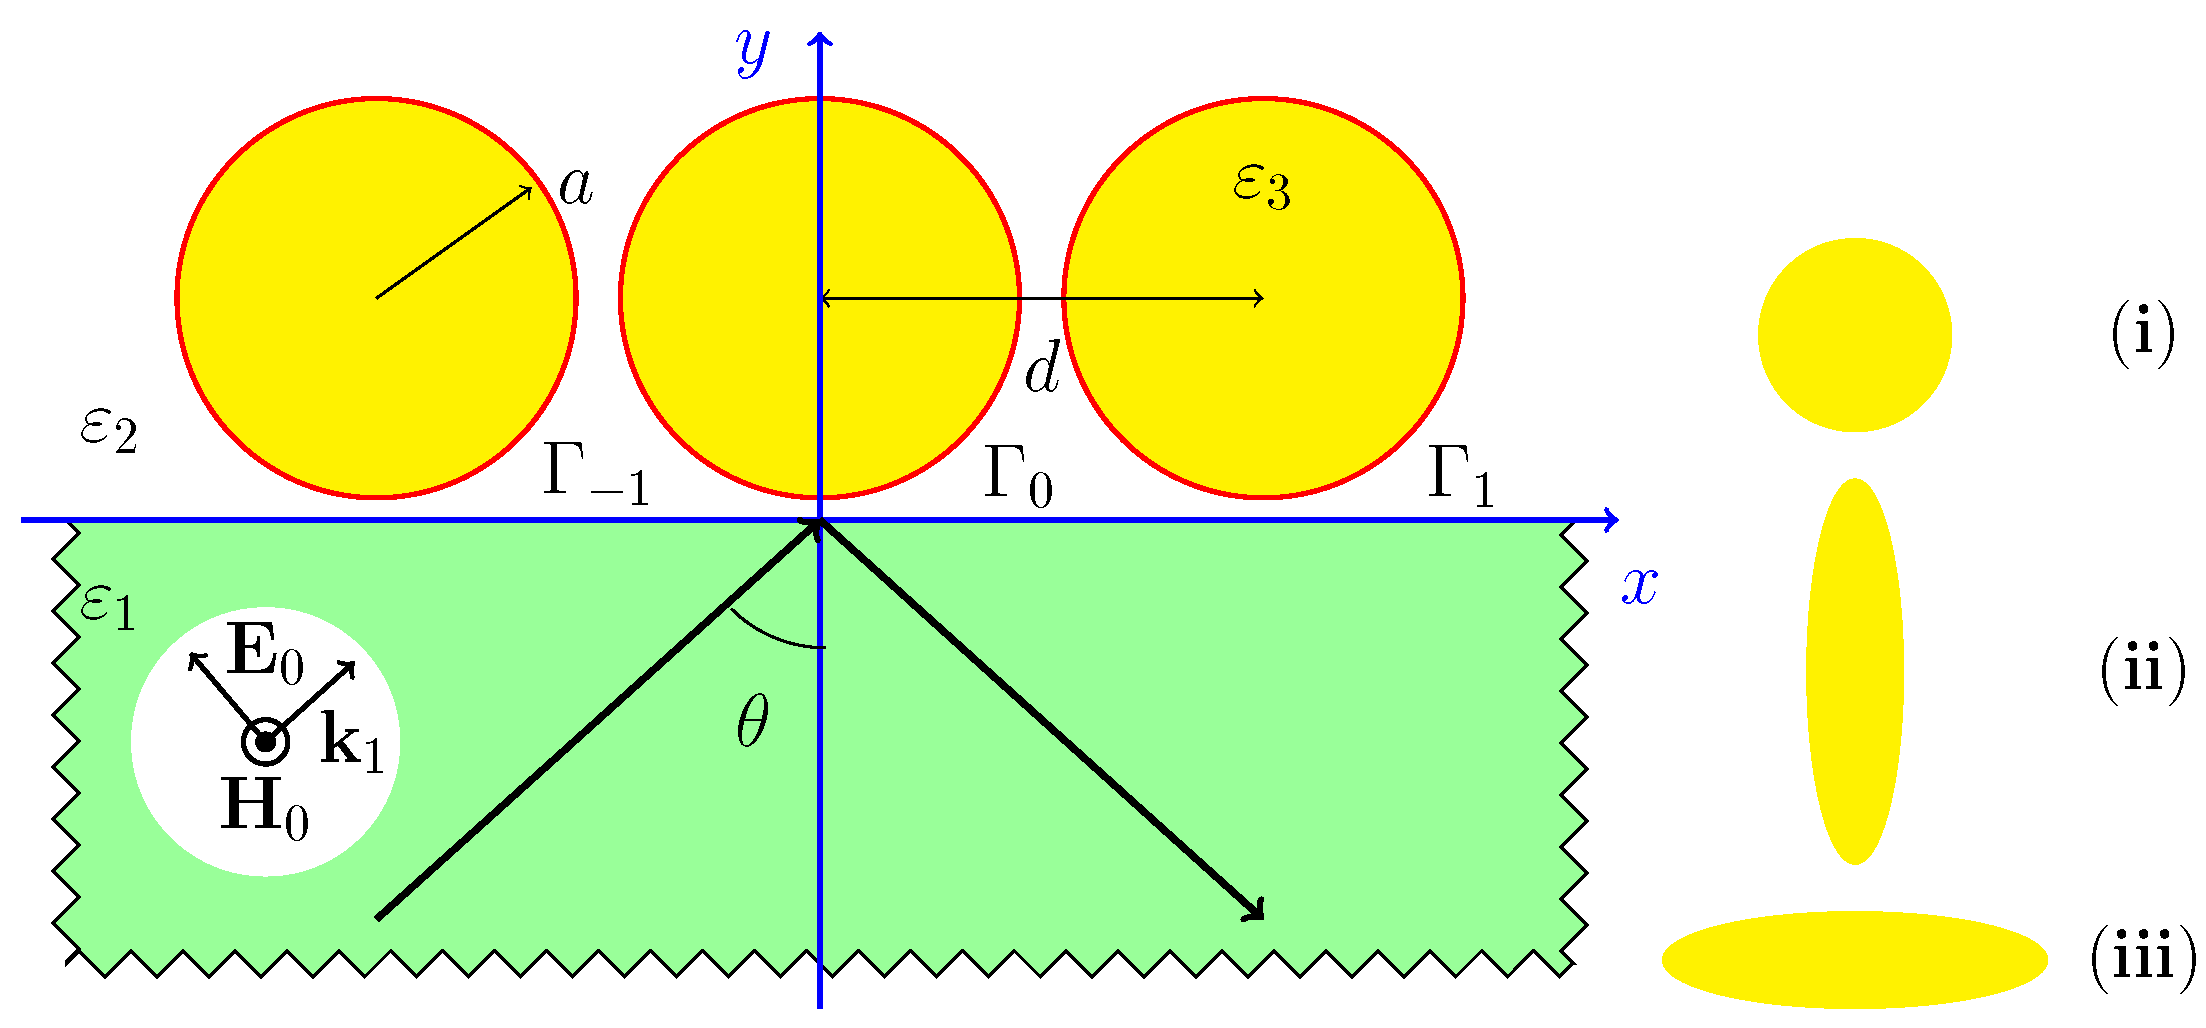
We carried out numerical modelling with the BEM [
15] for cylinders near the interface between the upper free half-space (
) and glass lower half-space
. The original codes were developed on the basis of the effective Green function of dielectric half-space [
15] that allows for us to avoid integration over the infinite interface. We analyzed a grating with period
d consisting of gold (
at
m). We chose the wavelength according to two conditions: (i) data were present in the handbook [
17] by Palic; (ii) the absolute value of the real part to imaginary part ratio of dielectric constant should be maximal. The latter is necessary to provide a large Q-factor.
We considered three shapes of cylinder cross-sections: circle of radius
m and ellipses with axial ratio 1:4 and 4:1, as shown in the inset in
Figure 1. The cross-sectional area was fixed, and the gap dimension was
m for all the cases; the period was different. This was
m for circular cylinders,
m for vertical ellipse, and
m for the horizontal. The distance between their centers and the glass half-space was a fixed
m for all cases. The incidence field was
p-wave near angle
, where
is the TIR angle. In calculations, the grid sampling was nonuniform near
by a power law with exponents 3/2.
Formulas for the extinction and scattering are
where
,
are the Pointing vectors of scattered radiation and the energy flux of interaction between scattered electric and magnetic fields
and incident fields
, responsible for the extinction,
denotes the radial unit vector. We take the integral over surface
A of a cylinder. The absorption coefficient was calculated as the difference
[
18,
19]. FEF and absorption had close qualitative behaviour. The transmission coefficient was calculated in the far field domain, neglecting all evanescent modes.
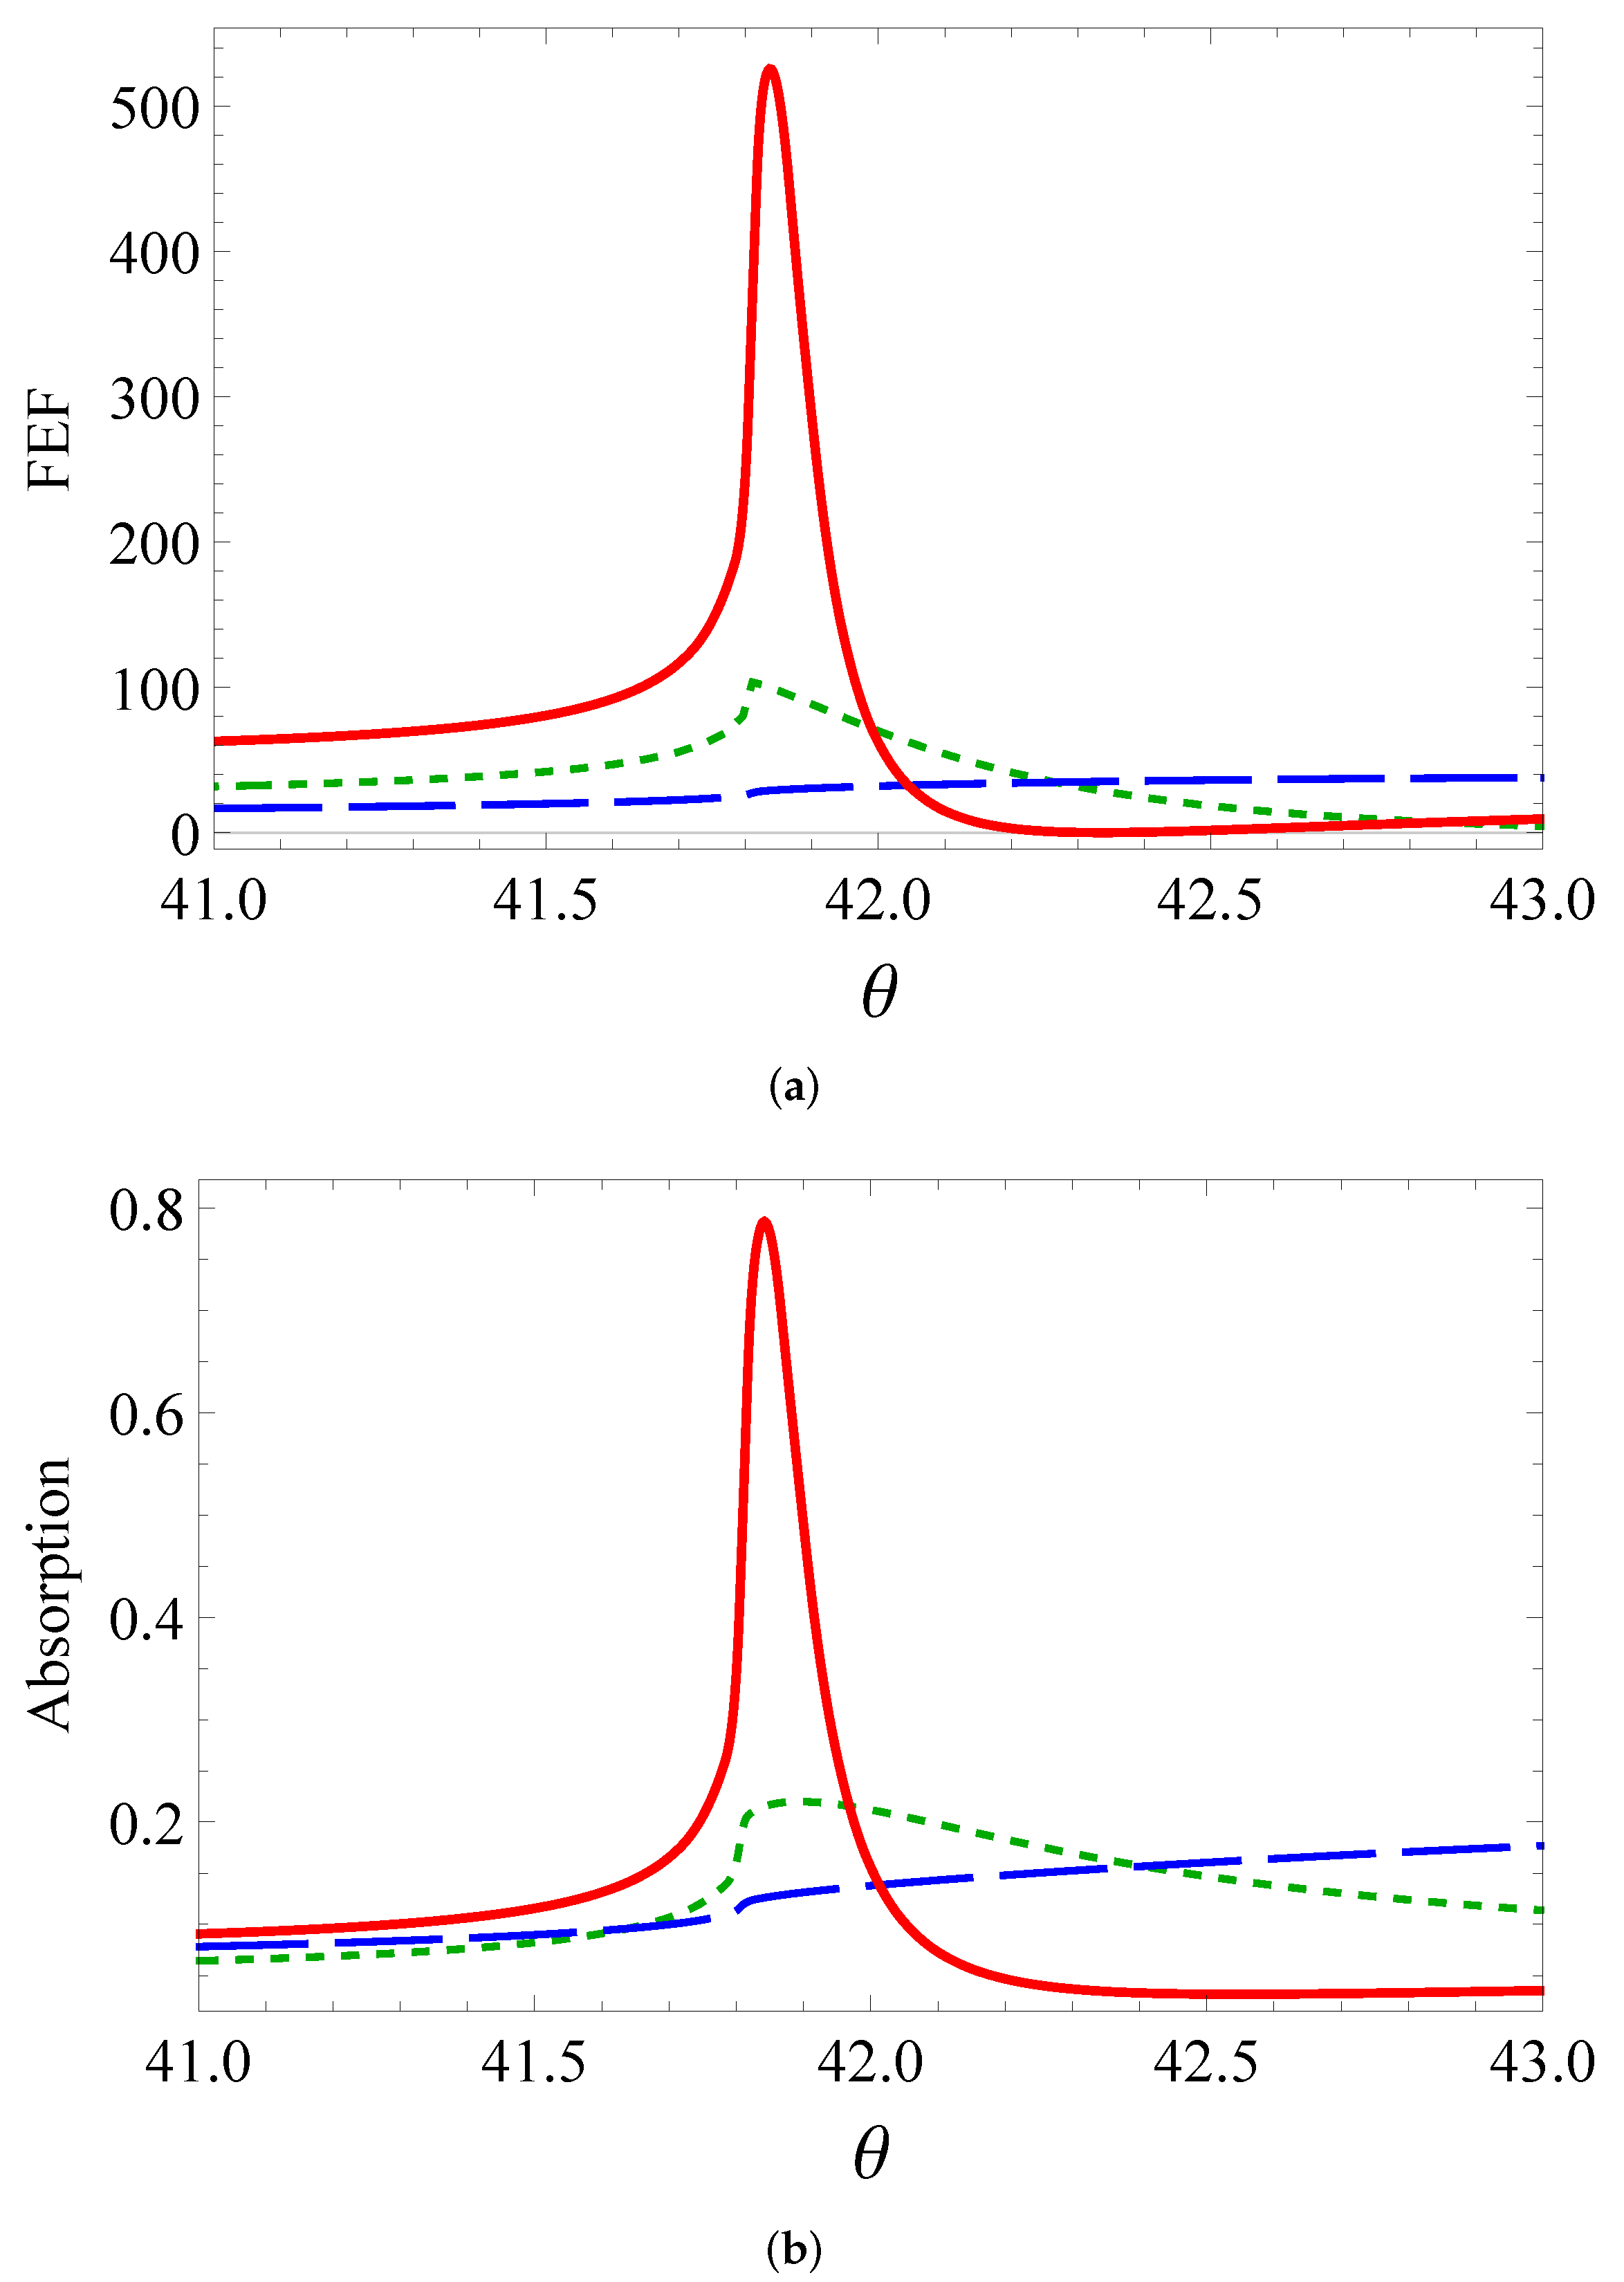
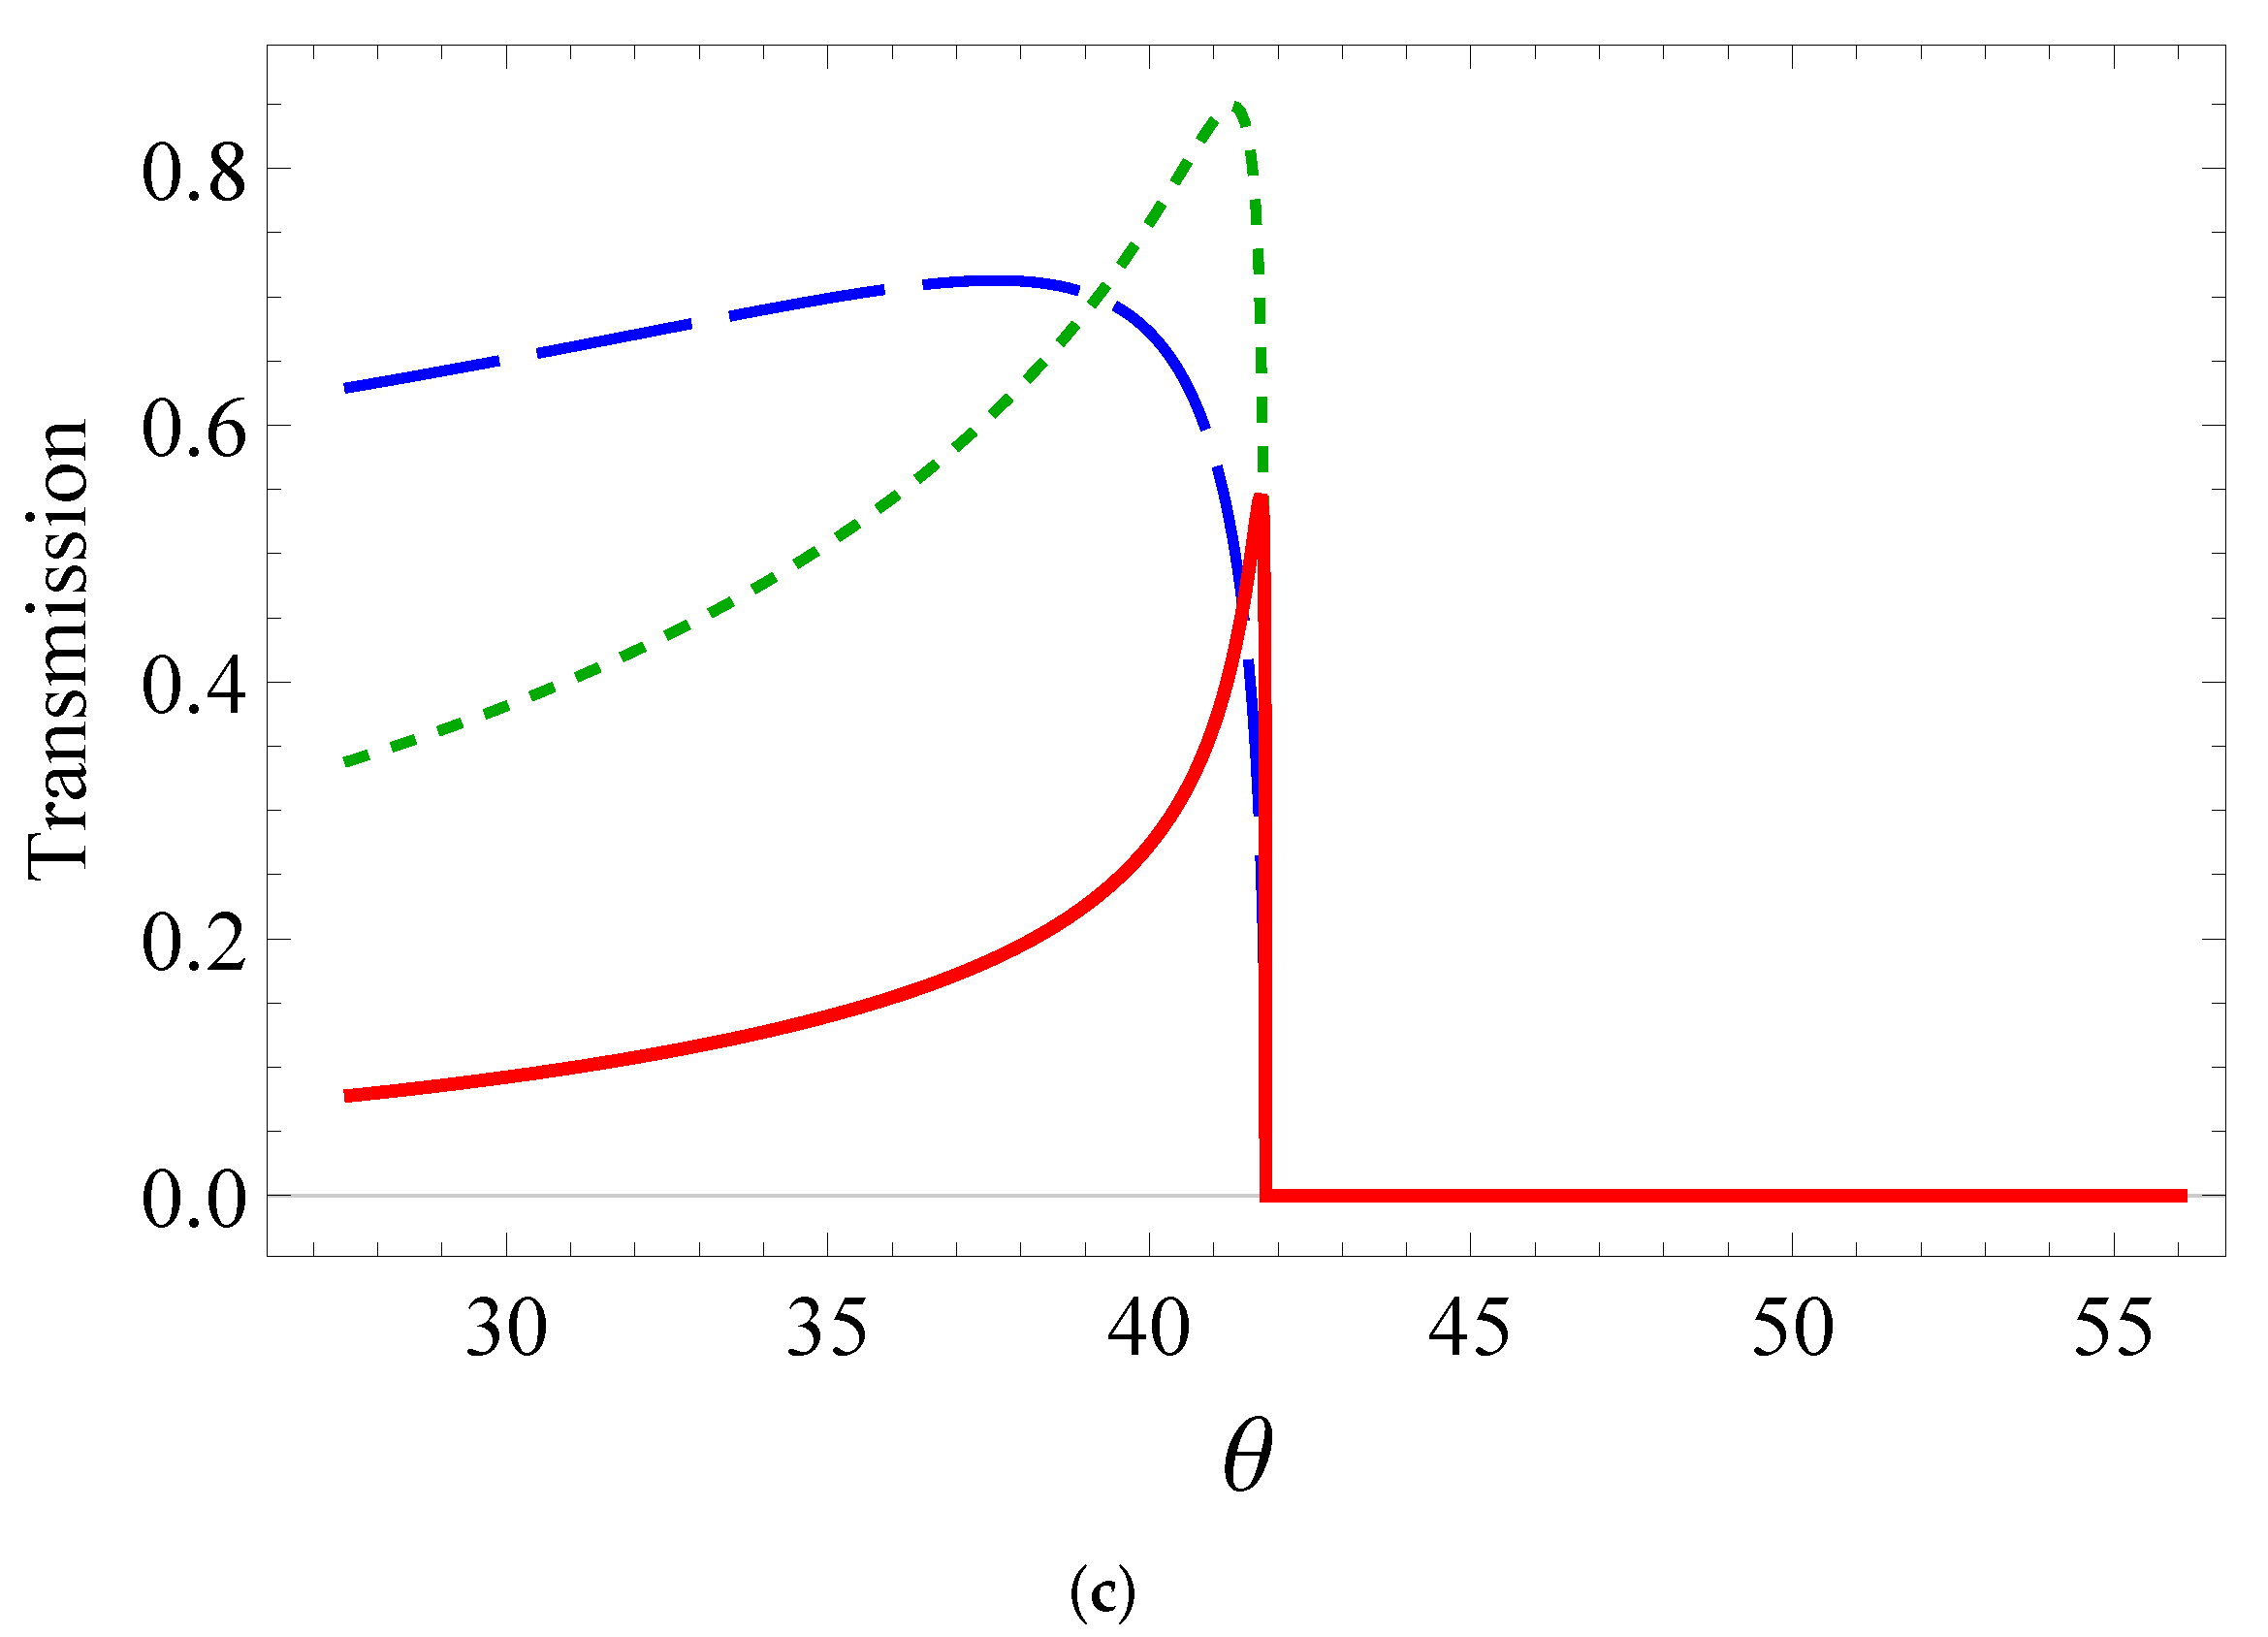
Figure 2 shows a comparison of the angular dependencies near the TIR angle of the (a) field enhancement factor (FEF), (b) absorption, and (c) transmission coefficients for three versions of cross-sections.
Figure 2a demonstrates the
in the middle between neighbor cylinders as a function of the incidence angle. Here,
E is the electric field in the middle of the gap, and
is the incident field. Plasmon resonance induces an exceptionally sharp peak for the horizontal ellipses. The highest peak was observed since the horizontal ellipse had a minimal radius of curvature in the gap. The curvature radius near the slit was
m, for the horizontal ellipse, circle, and vertical ellipse, respectively. That is why the case of the horizontal ellipse yielded a sharp peak in FEF and absorption, whereas the peak for the vertical ellipse practically vanished. The circle was intermediate between the limiting cases.
As previously mentioned [
14], the resonance of the slit grating is excited by the refracted into the upper half-space (Fresnel) field. There was only an evanescent wave when
exceeded the TIR angle. As a result, the Fresnel field achieved its maximum near the TIR angle; its
x-component vanished. The absolute maximum of the intensity is created only by the
y component of the Fresnel field;
x component
, and not
, experiences resonance in the gaps. A natural question arises: how is this possible if the Fresnel
x-component of the field vanishes? The field scattered on the cylinders had a significant
x component. Since the cylinders were not limiting the subwavelength (
for cases (i)–(iii)), then the scattering differed from that in the dipole case. The phase difference between the neighbour wires originated the additional contribution to the
x component. The gaps between the cylinders were a subwavelength:
, where
m.
Absorption in
Figure 2b correlated well with FEF in
Figure 2a. The most intensive electric field and accordingly the largest damping were precisely achieved in plasmon resonance. To a certain extent, the absorption characteristics reproduced the angular dependence of FEF. The transmittance presented in
Figure 2c vanished at a greater angle than that of the TIR. The angular distribution of the horizontal ellipses had a similar shape to that of a resonance curve. For other cross-sections, we saw a substantial broadening. The curve was wider for the vertical ellipses, and in FEF and absorption.
3. Anisotropic Layer
The Helmholz equation gives dispersion relations in each part of the area, and boundary conditions match tangential components of electric and magnetic vectors
, respectively:
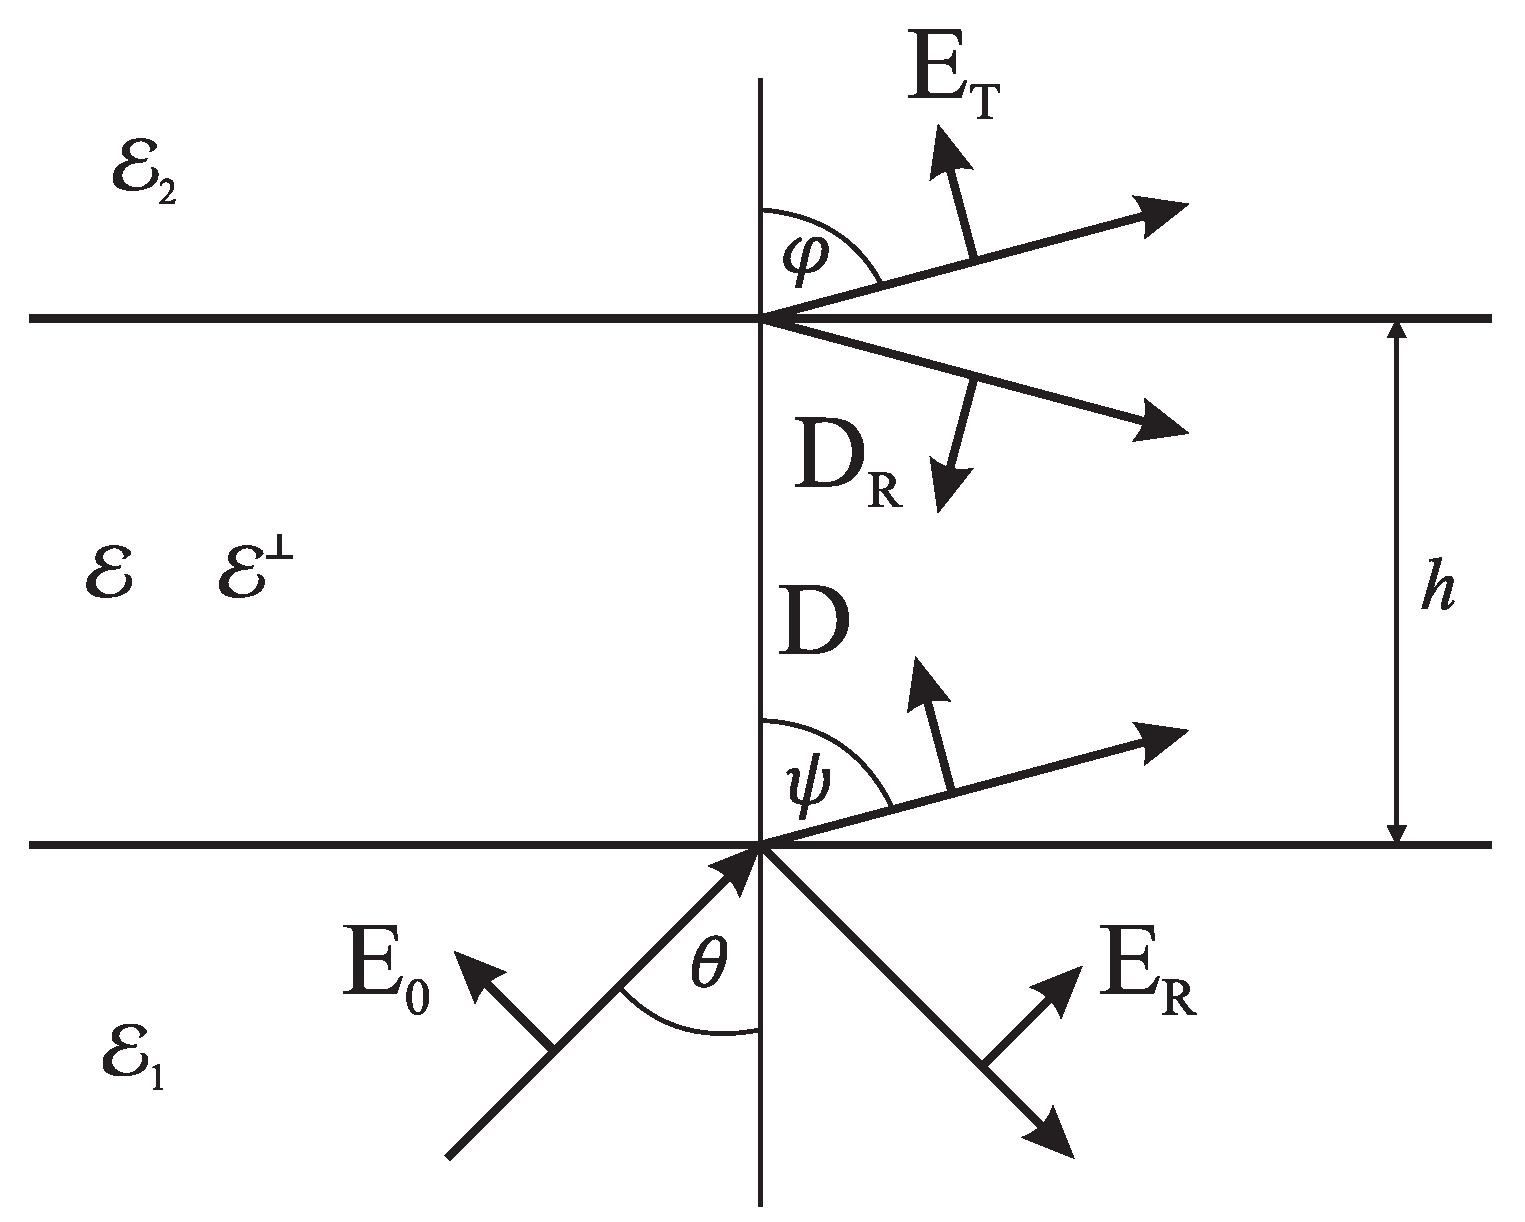
We consider the scattering of incident wave with electric field
by an isotropic or anisotropic layer of thickness
h.
The model was a thin film with permittivity for the isotropic material. In the anisotropic case, the permittivity tensor had two diagonal components, . The incidence angle was , the inside layer refraction angle was , and the transmittance angle was . Electric fields of reflected and transmitted waves are and , respectively. Vectors of electric displacement and were orthogonal to their wavevectors inside the layer.
Figure 3 illustrates the electric field notation: we calculated tangential components by multiplying vector lengths by cosines and sines of corresponding refraction angles. The imaginary part of the cosine or sine turns to zero only in nonabsorptive dielectric domains at refraction angles up to TIR. In general, they are complex and should be carefully defined. Furthermore, due to nonzero layer thickness, we take the phase shift into account:
Complex angle
inside anisotropic layer satisfies relations
where the cut in the complex plane of the square root function goes along the negative real semiaxis. For the upper half-space, the transmit refraction angle is
Equations (
2) and (
3) are sufficient to find transmittance
and absolute reflectance
These coefficients mean the ratio of transmitted through the layer and reflected energy flux to the incident one. So, transmittance
, reflectance
, and absorption
give the unity. Then, to obtain absorption coefficient
. Here, absorption is specific, i.e., normalized by period
d and
. If phase shift
tends to zero, Equations (
7) and (
8) become simpler and turn into Fresnel’s ones for two half-spaces with common boundary plane. If the anisotropic layer becomes isotropic
, then transmittance (
7) coincides with the found one for magnetic field [
20,
21]. The model of the stratified medium with scalar dielectric constant is widely used in calculations of reflectometer sensitivity [
22]. For reflectometry sensors based on a metallic–dielectric structure, ref. [
23] the model agrees with measurements. Formulas for anisotropic dielectric permittivity tensors are used in papers devoted to hyperbolic metamaterials.
Let us plot the angular distribution within the isotropic and anisotropic layer models, and compare them with numerical results. We fit the model parameters (thickness and permittivity) to minimize the offsets by the least-squares method. The functional includes both the residues of transmission and specific absorption coefficients with equal weights:
where
are the model transmittance or specific absorption depending on refraction angle,
are the transmittance or absorption calculated by BEM numerically at the incidence angle
in the glass. Number
corresponds to numerical samples of incidence angle in our calculations. We gathered the best-fit parameters of the least-squares procedure in
Table 1.
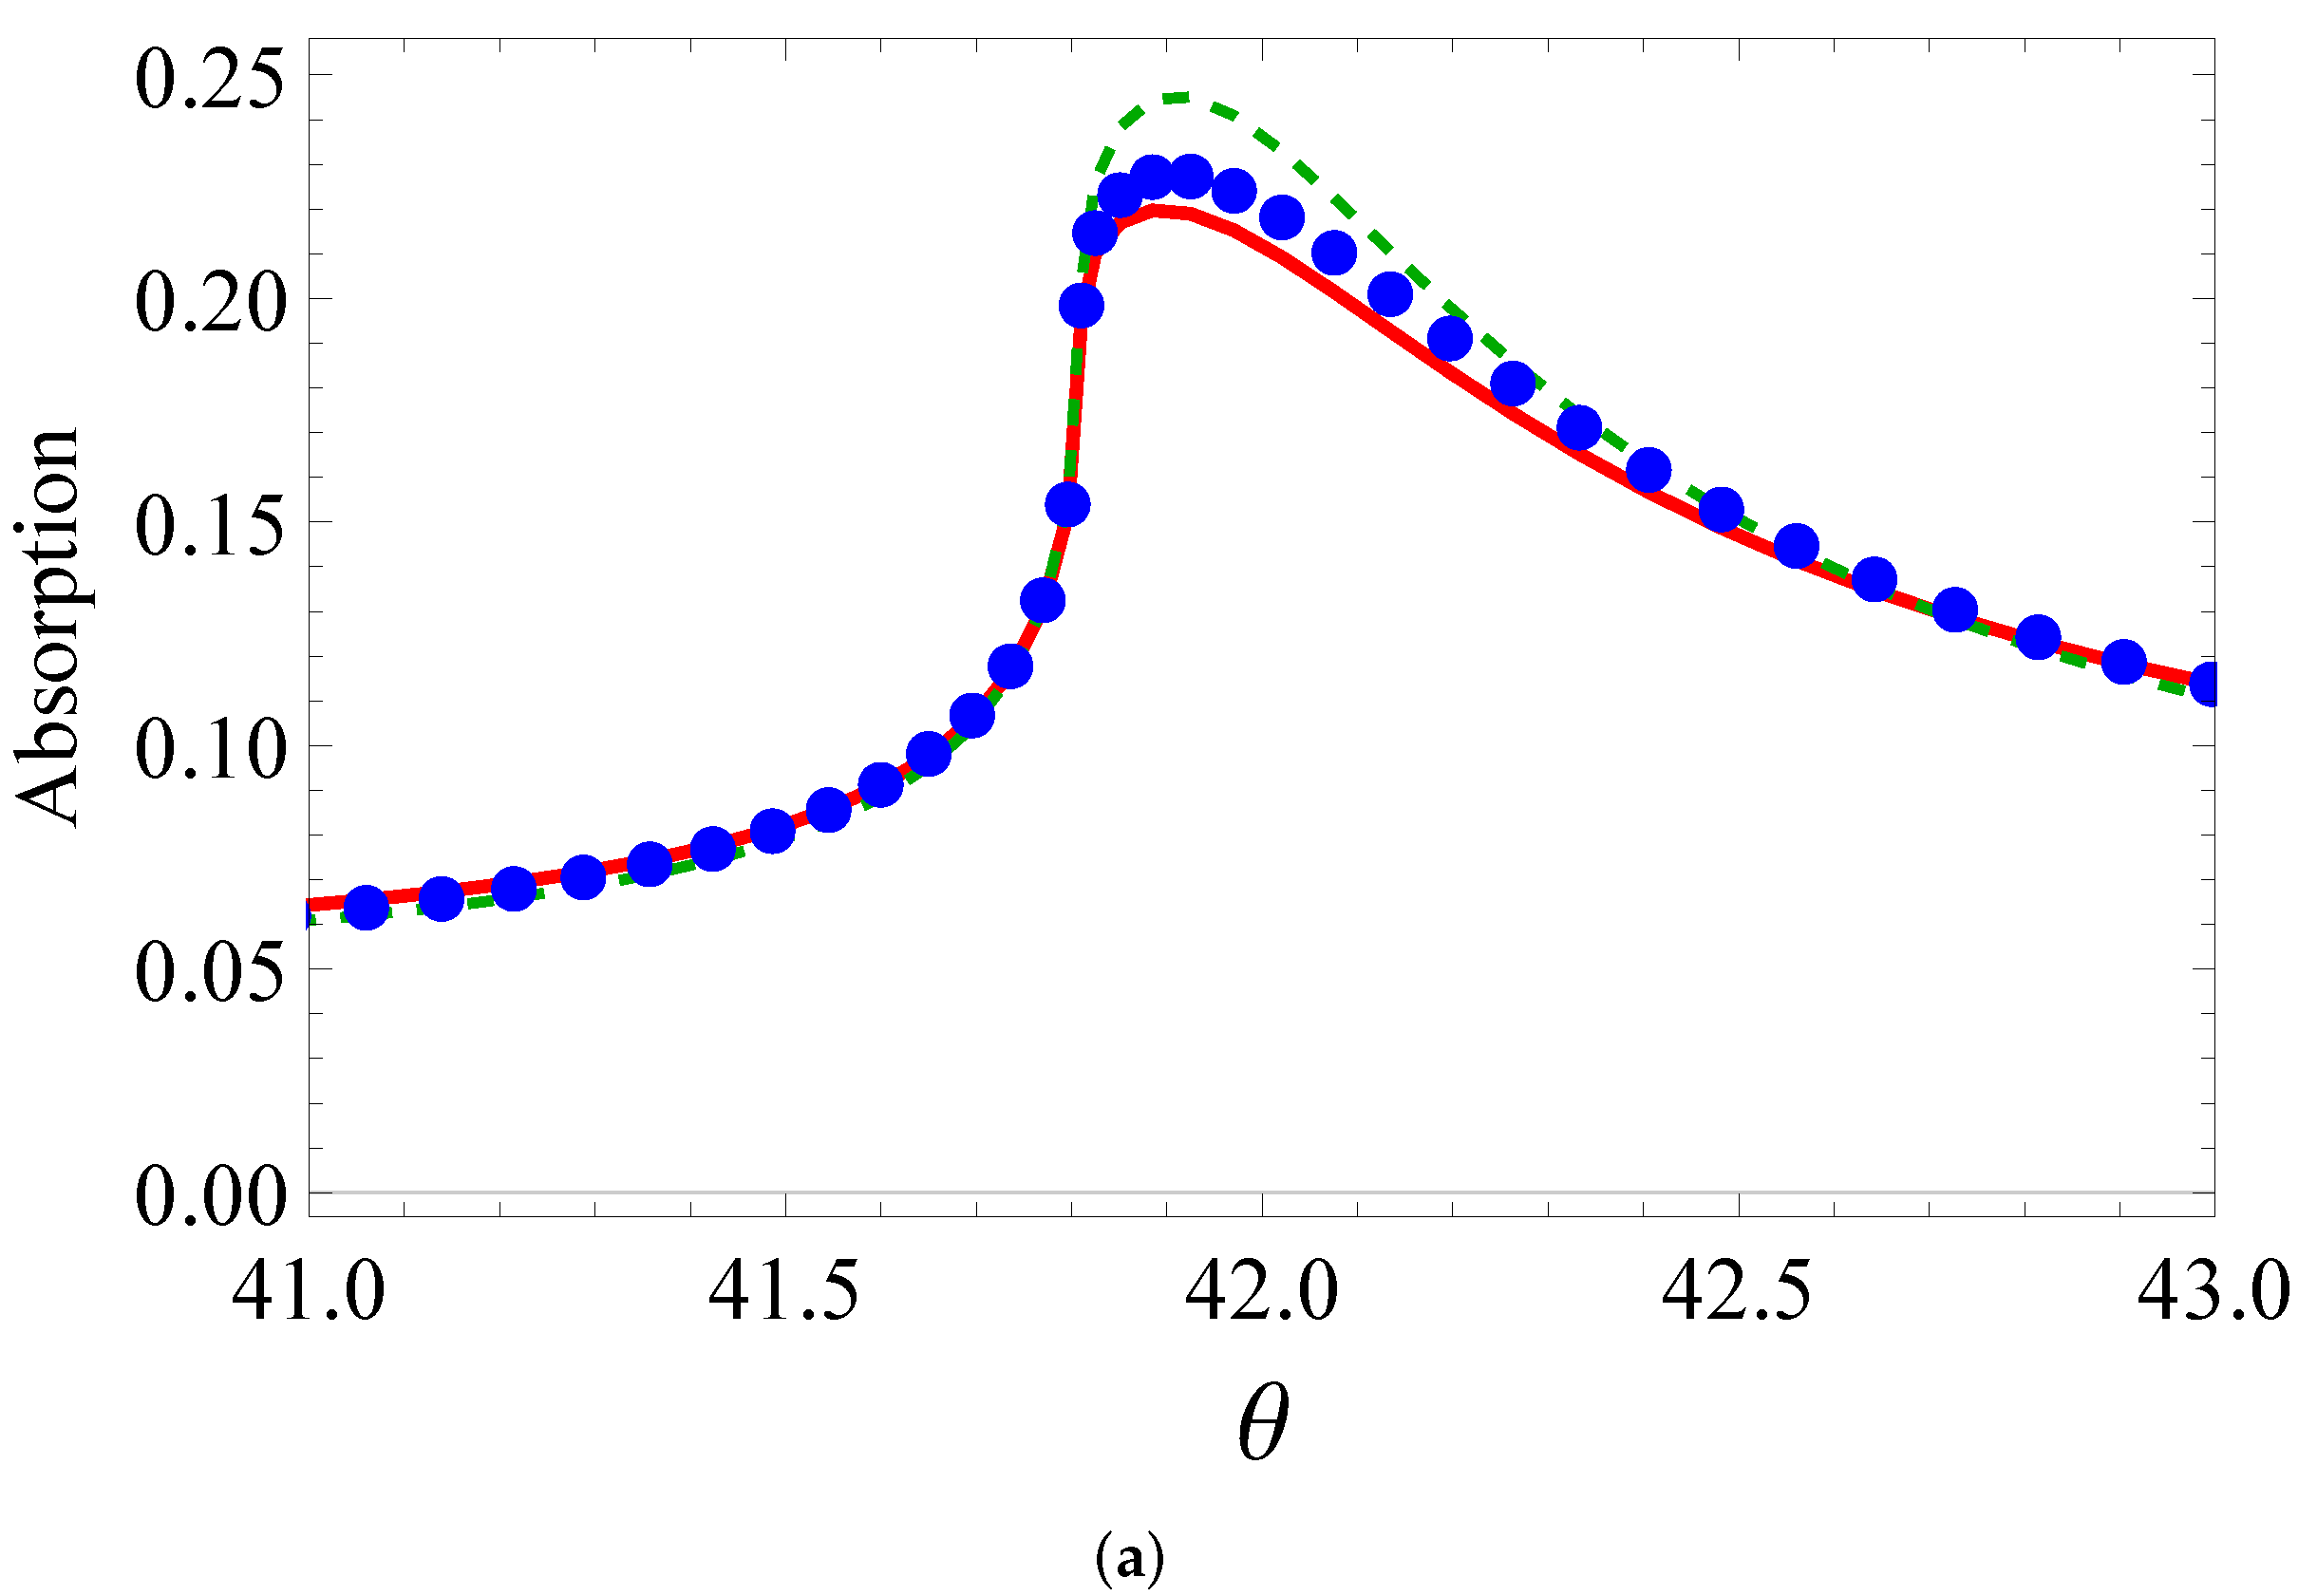
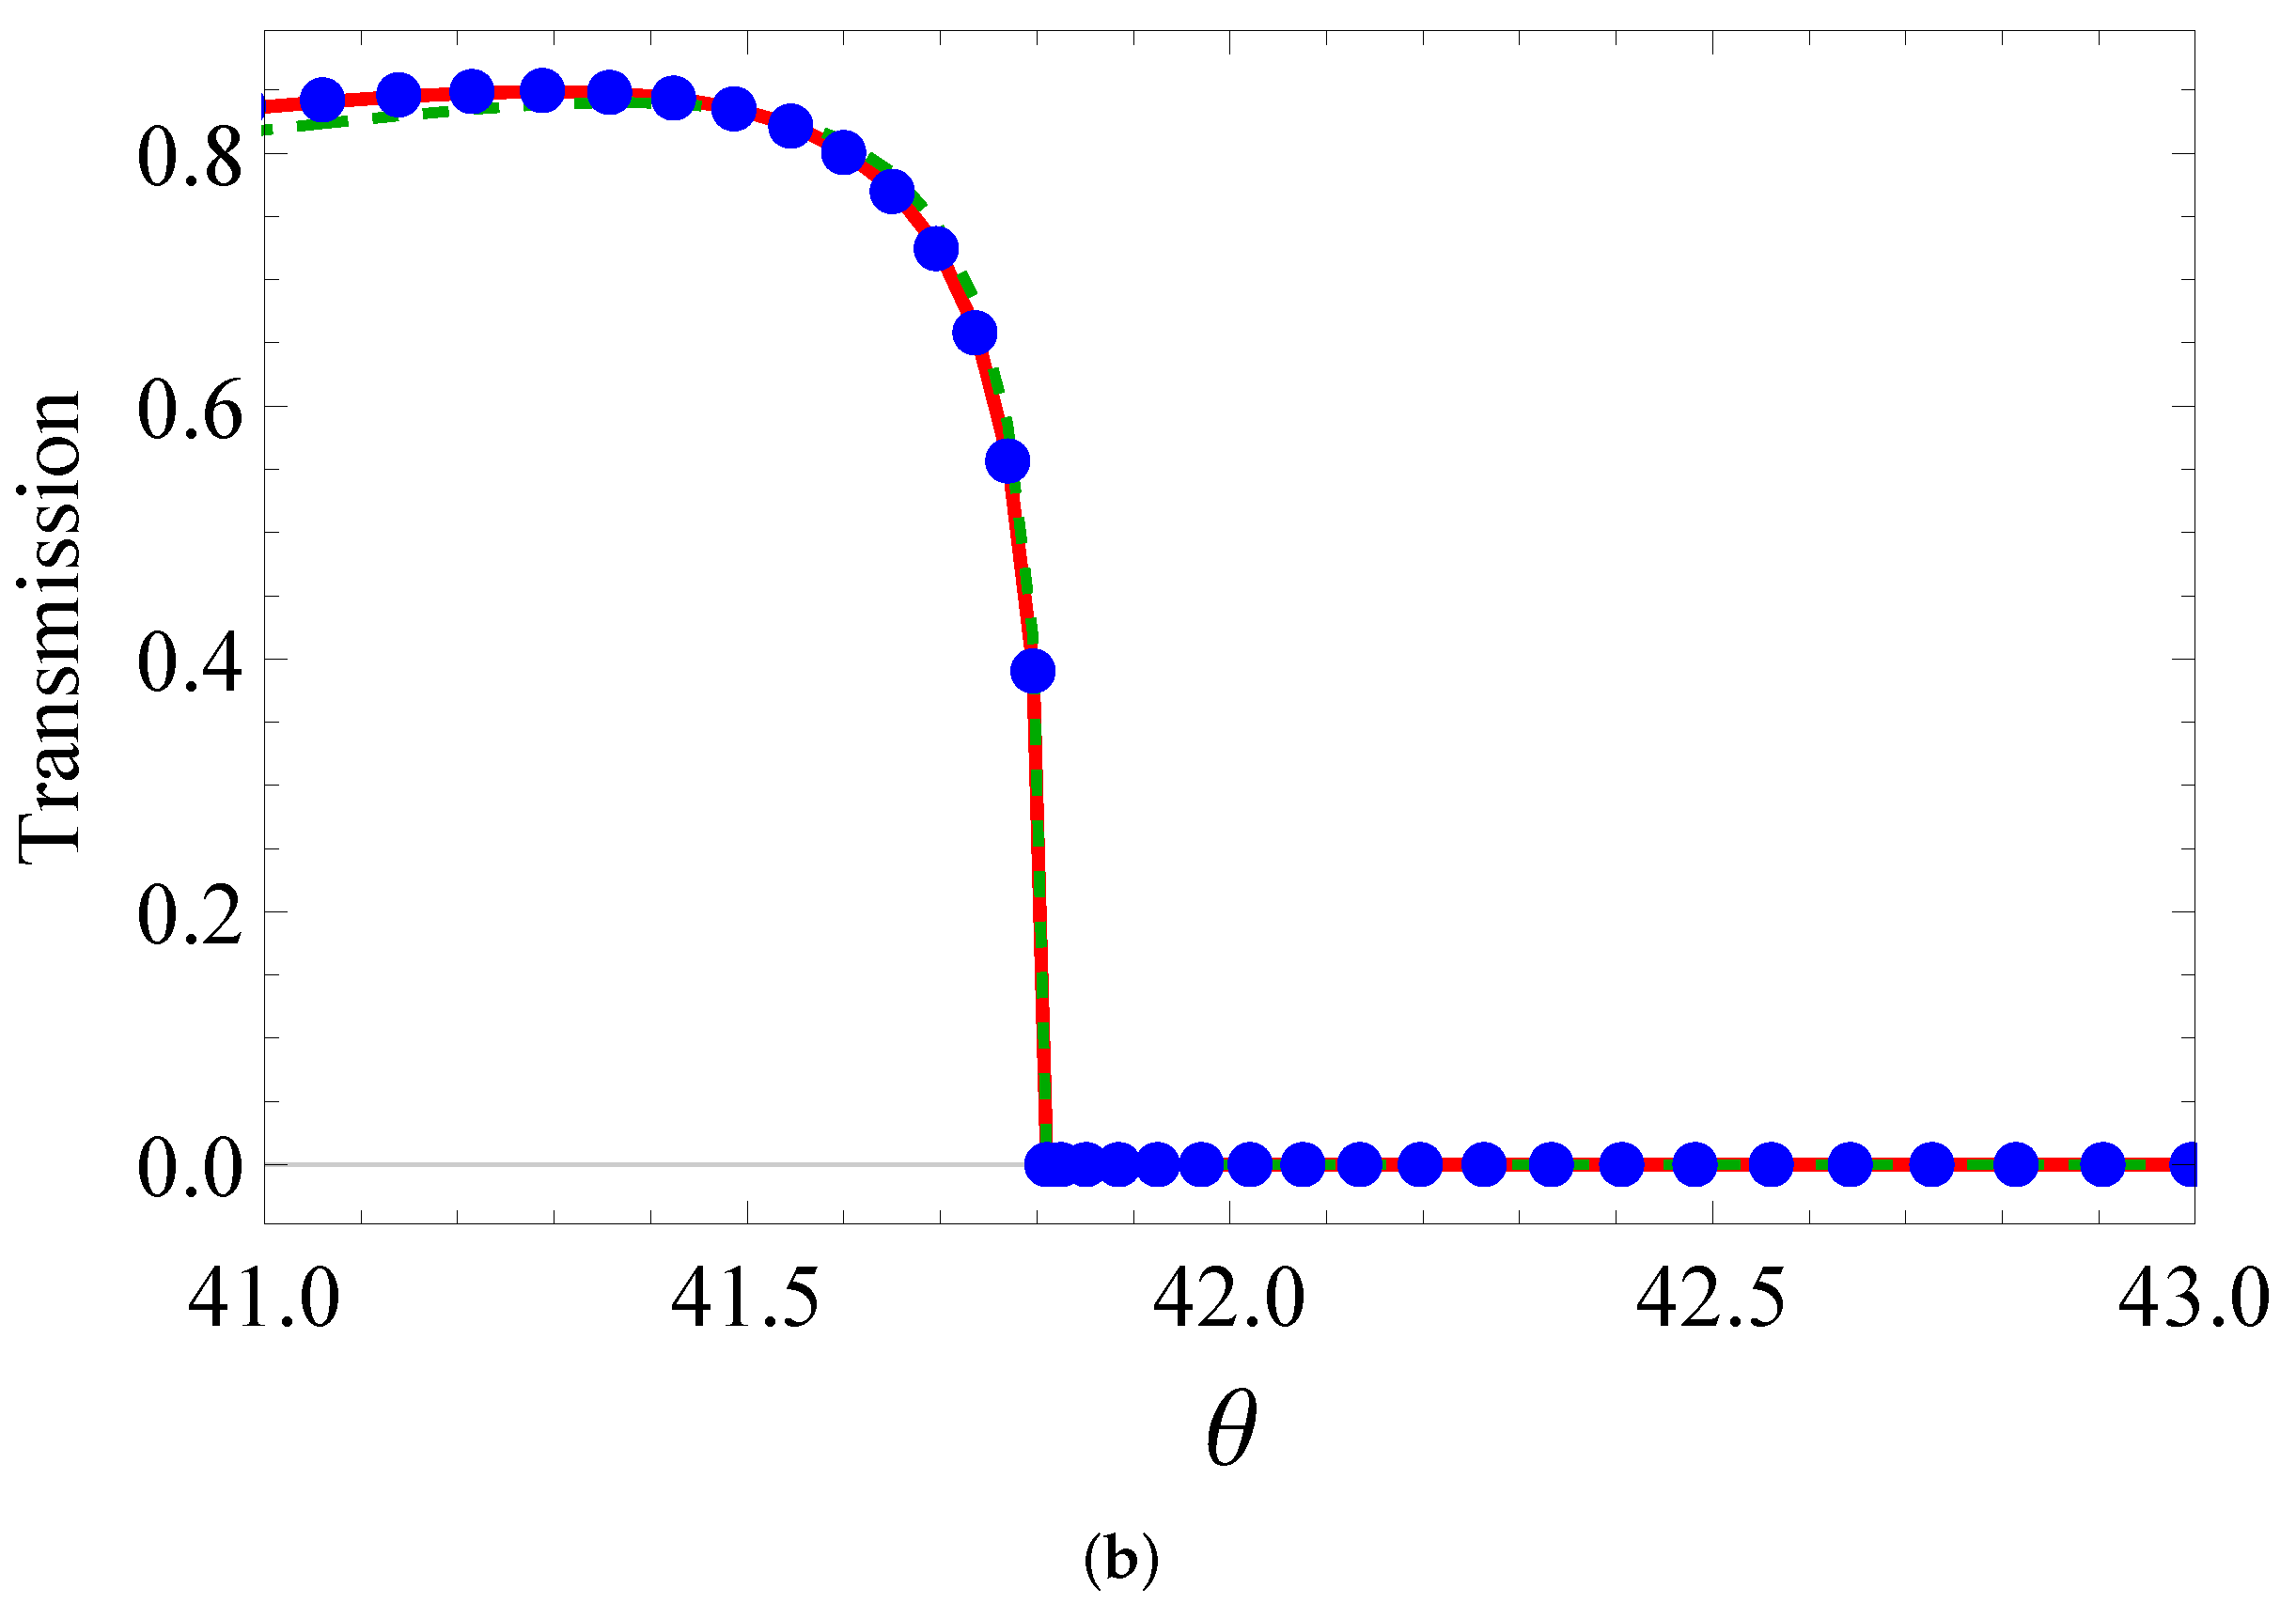
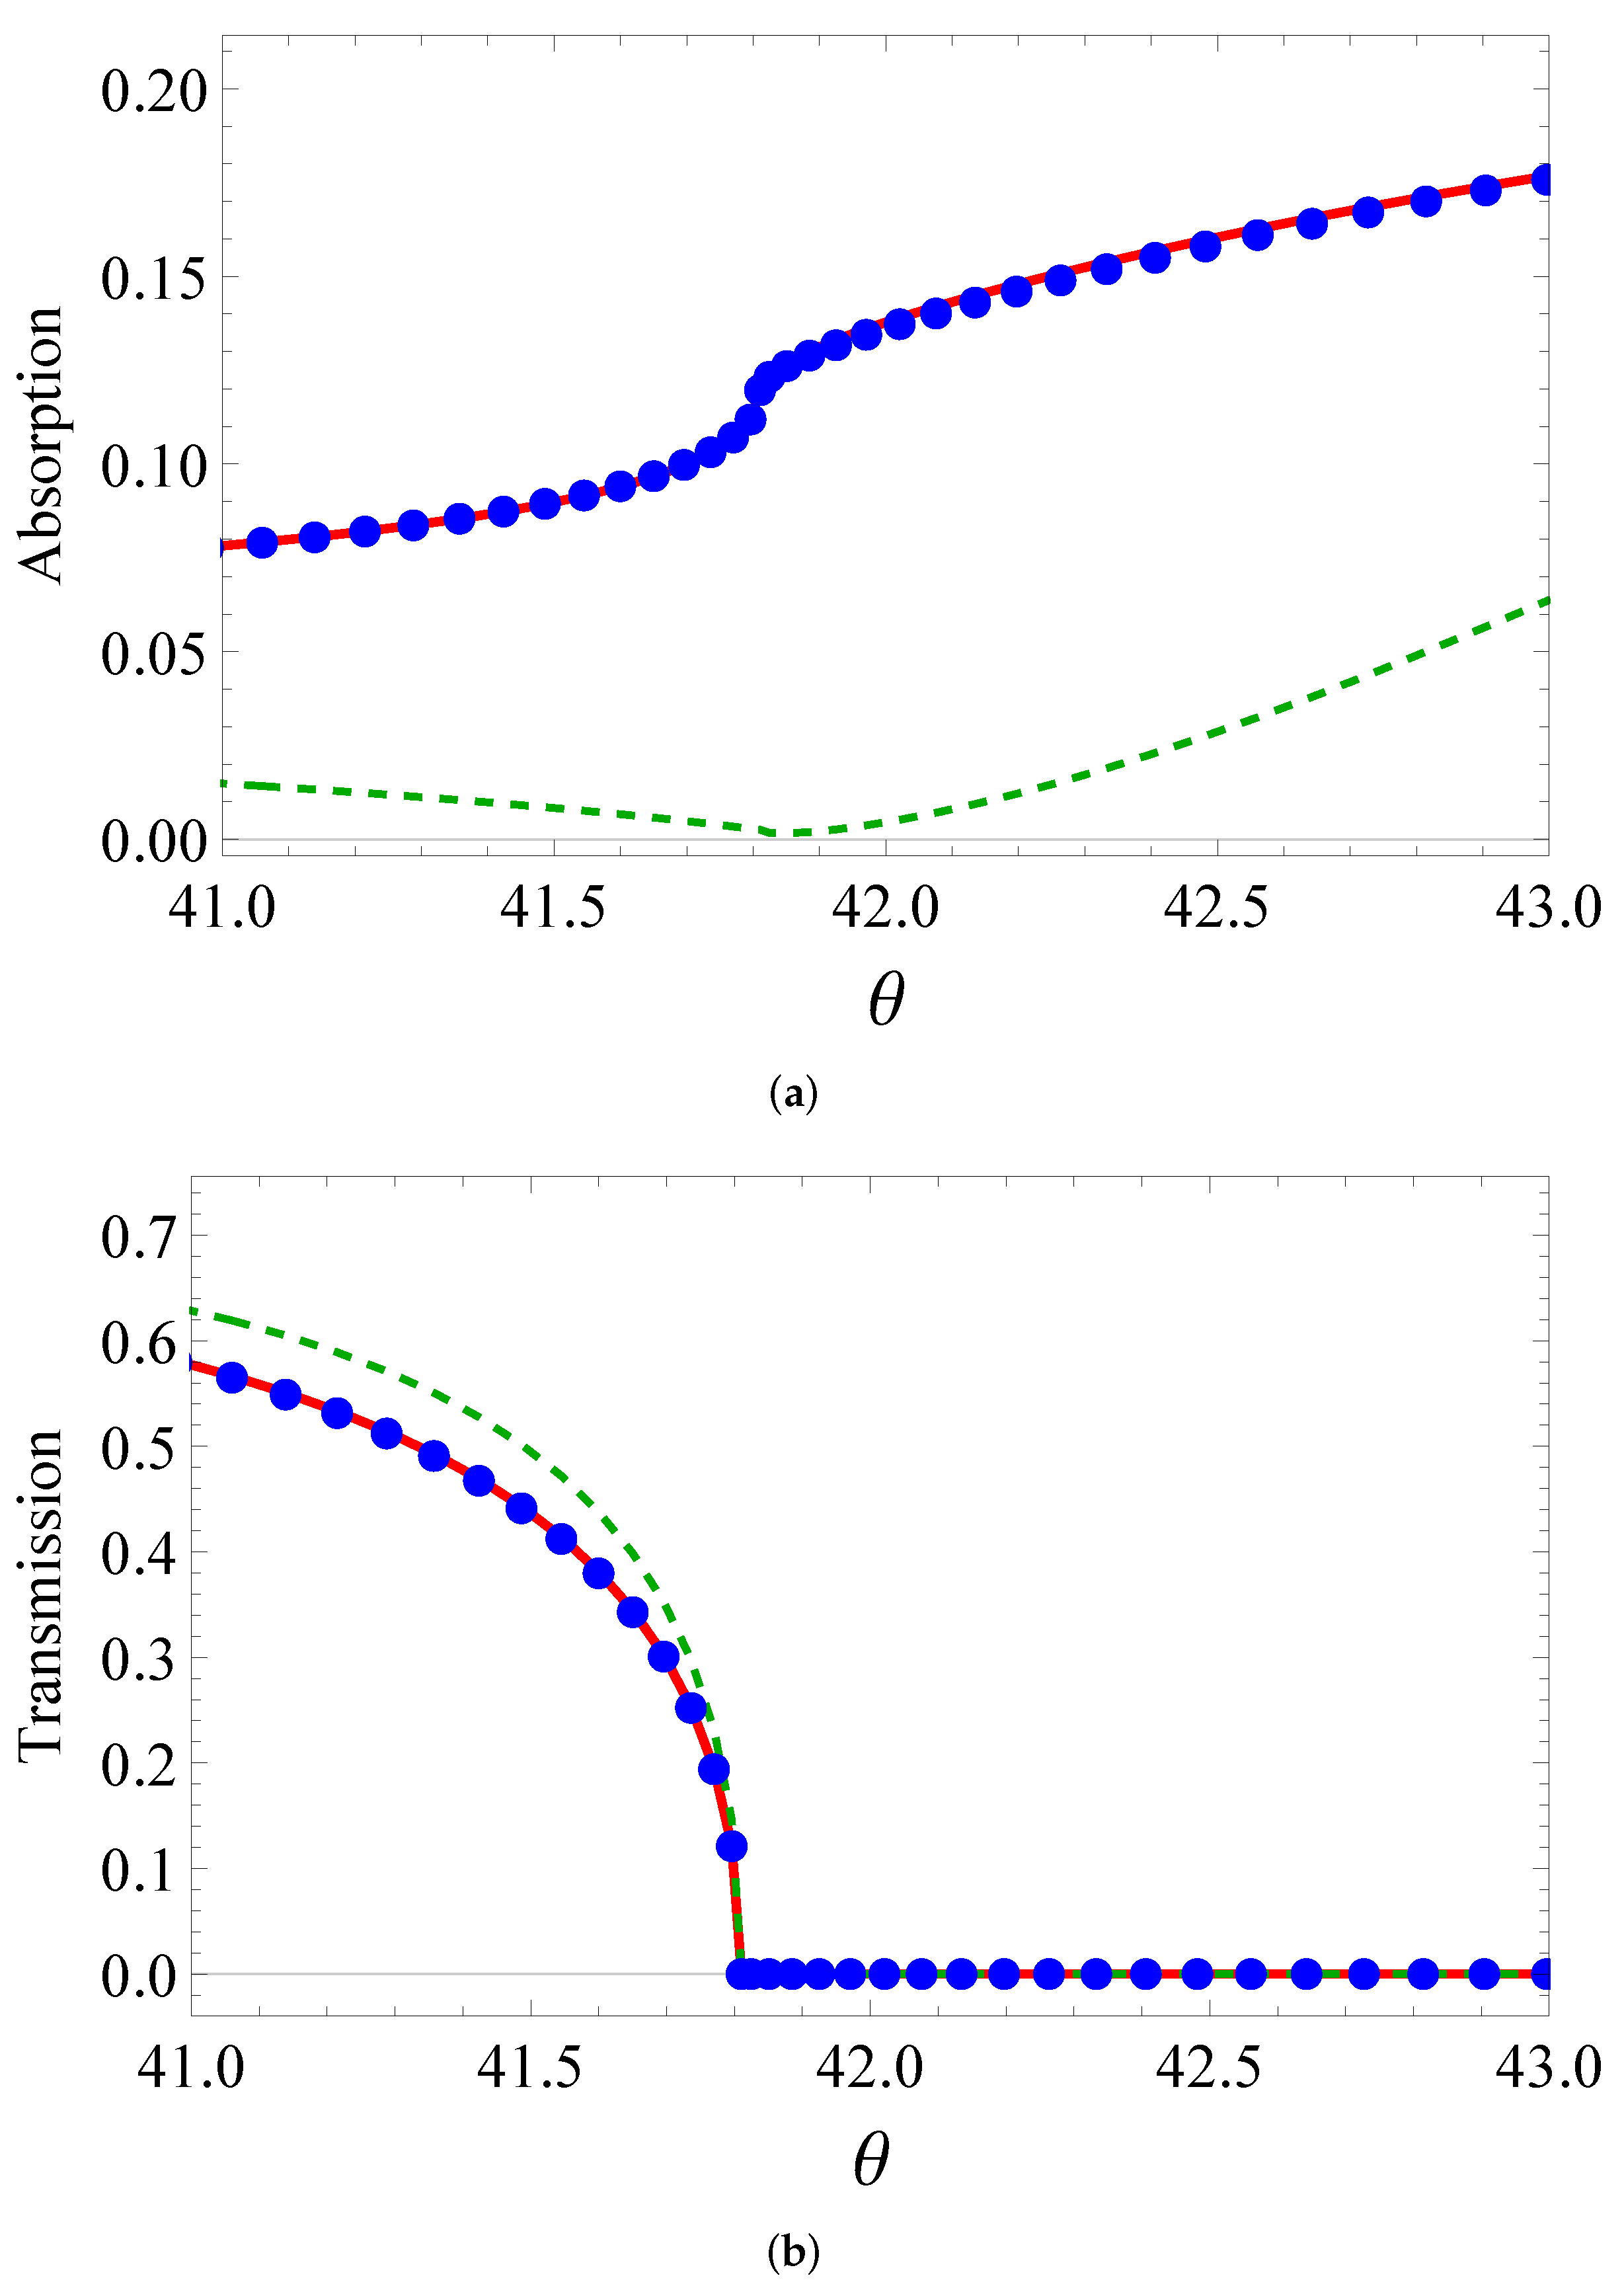
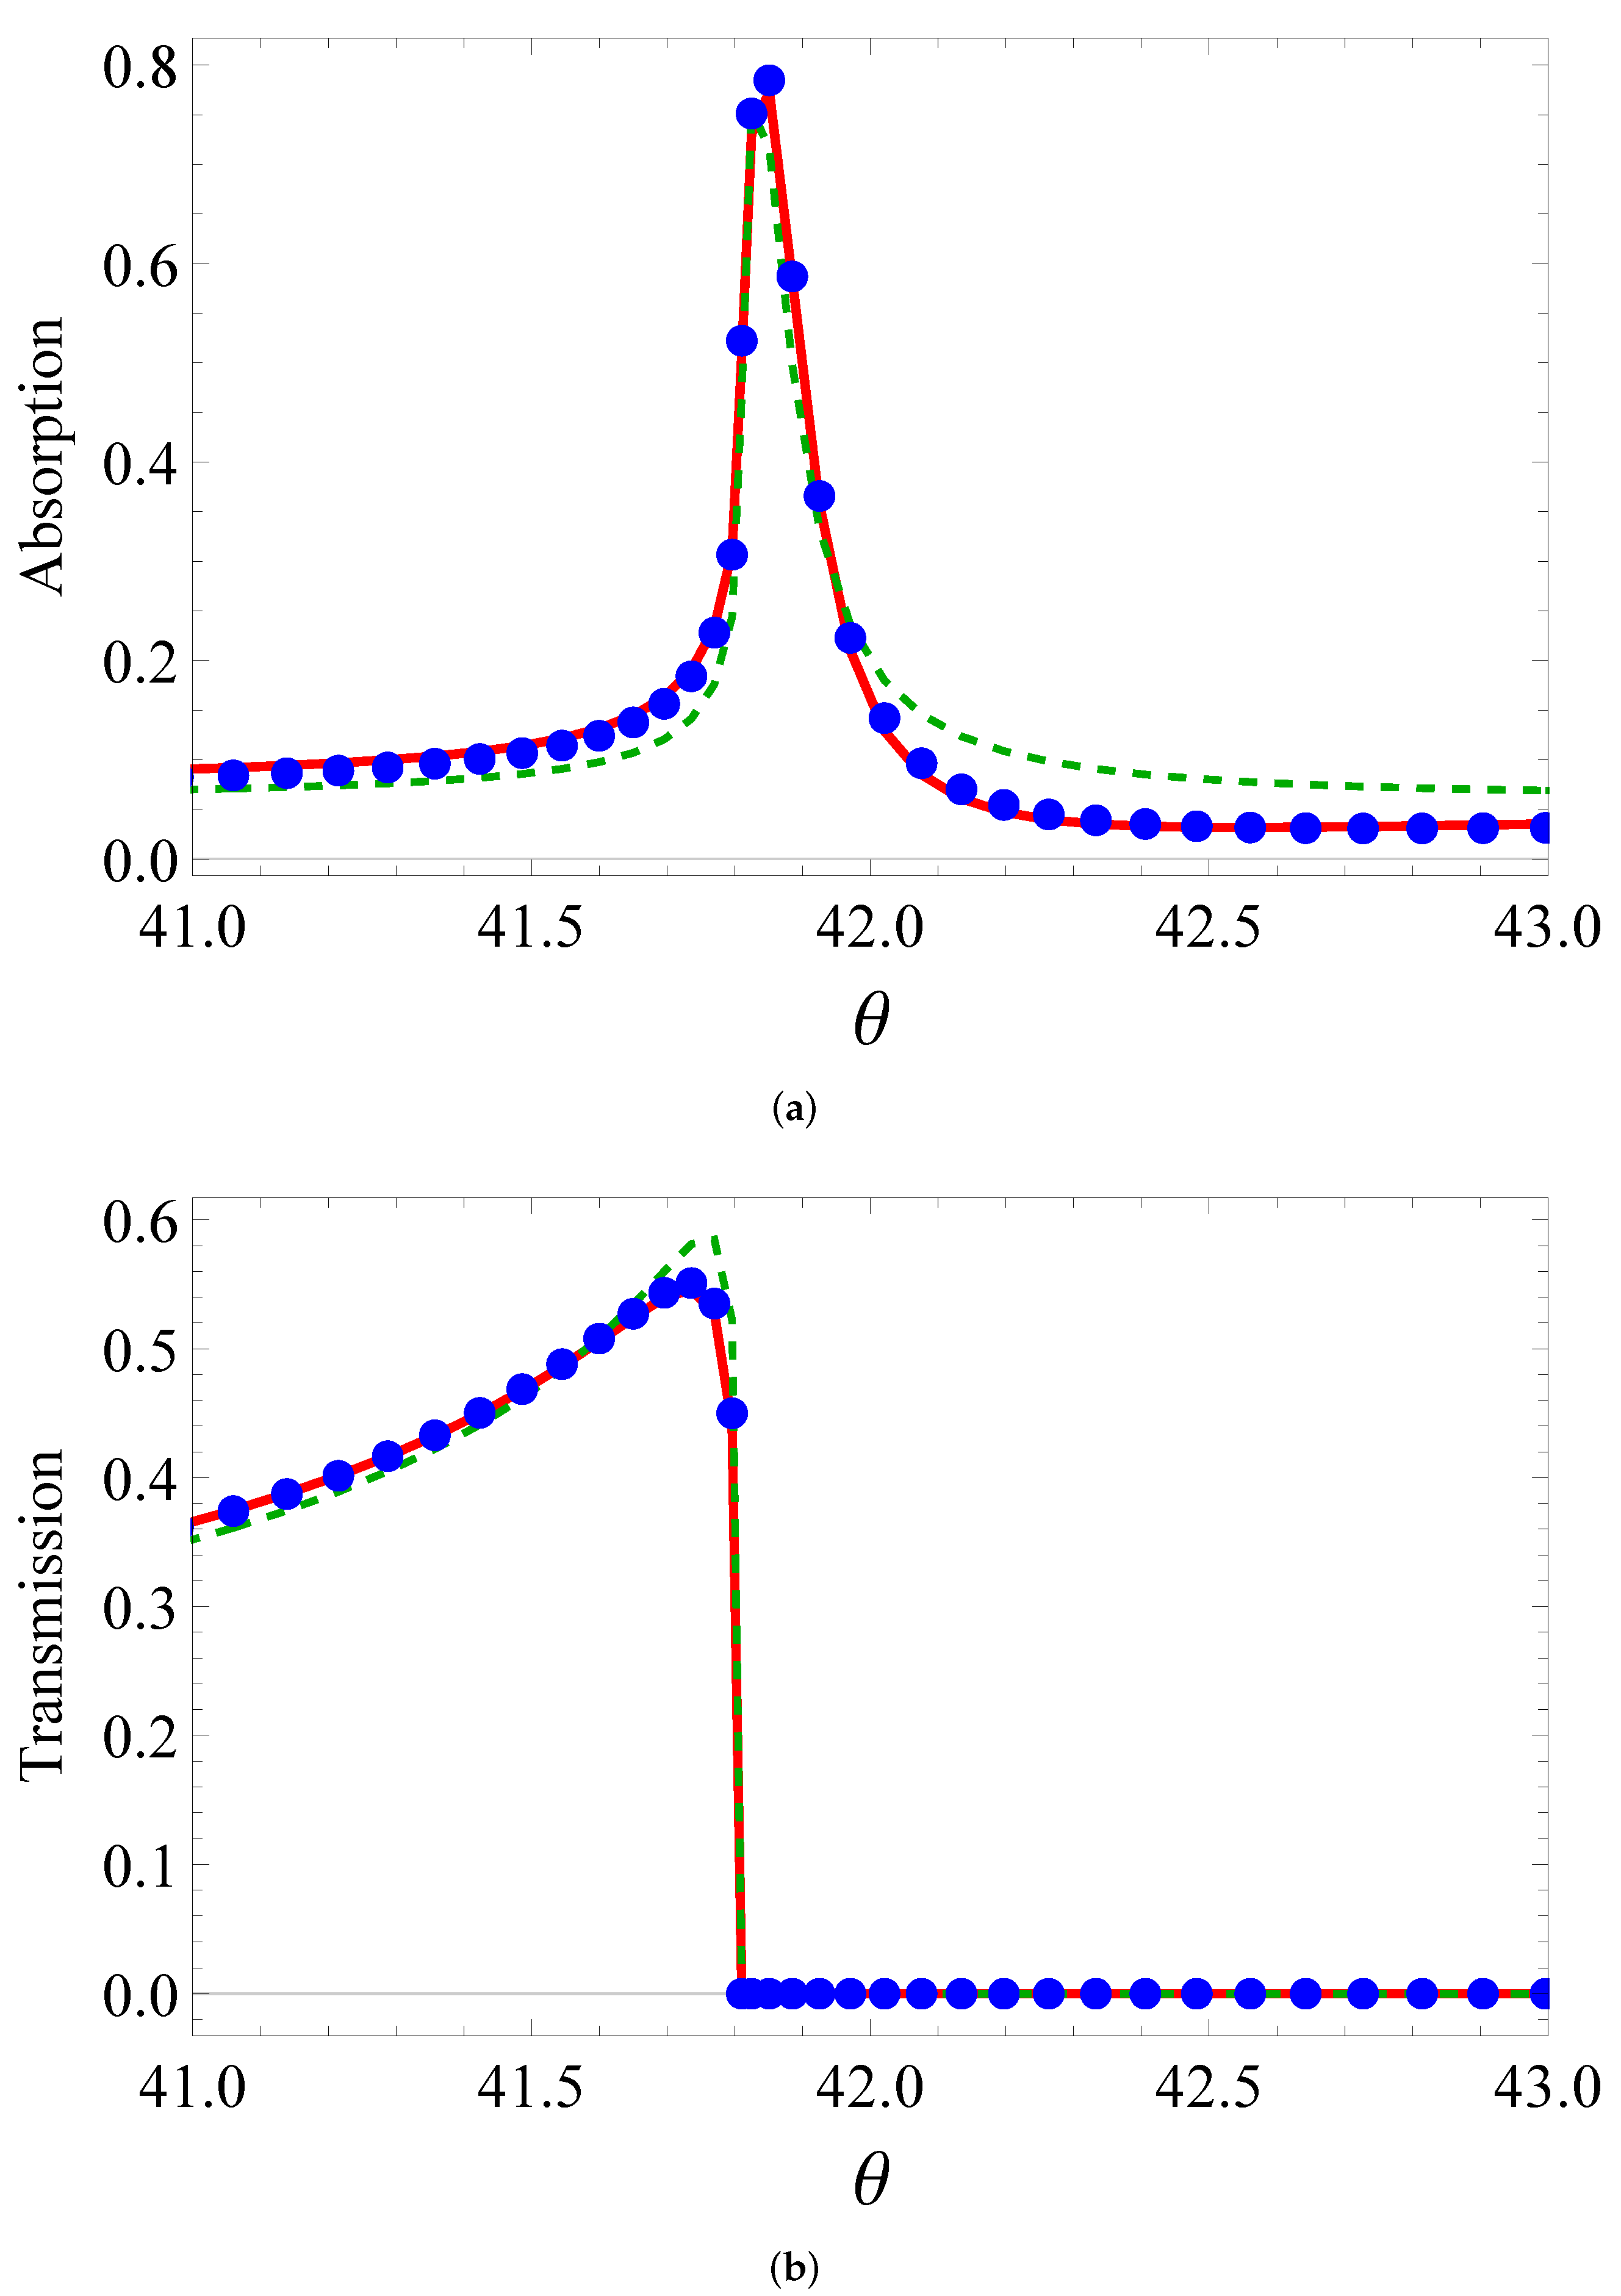
One can see how accurate the fit for absorption and transmission is from
Figure 4,
Figure 5 and
Figure 6. The isotropic model qualitatively describes the BEM curves. When the real part of permittivity is negative (the third line and third column of the table), the fitting is satisfactory in transmission, but loses its accuracy in absorption. Otherwise, the curve comes to a huge mismatch. For example, if the real part becomes negative for vertical ellipses, the dashed curve comes in the bottom of
Figure 5a. Meanwhile, the anisotropic model quantitatively describes all the curves with high accuracy. This is evident from the bottom line in
Table 1. The better fit by the anisotropic model than that by the isotropic one was at least due to to more fitting parameters (5 vs. 3).
Anisotropy was sufficiently high in this structure. Different signs of the real part in the second and third lines from the bottom indicated that the media behaved as hyperbolic metamaterials, i.e., media with the hyperbolic dispersion law [
24]. The circuit diagram could explain this observation within the concatenated capacitor model. For circular cylinders (nanowires) at a small fill-fraction of the metal compared to dielectric media in a unit cell, the Maxwell–Garnett approach is exploited in the calculation of dielectric tensor components for metamaterials [
25]. In recent experiments on subwavelength imaging in the visible range [
26], the anisotropic model was useful.
4. Conclusions
To study the angular dependence of scattering parameters near the TIR angle, we performed numerical calculations with the BEM. We considered circular and elliptic cylinders of a 4:1 axis ratio and treated changes in absorption, transmittance, and field enhancement factor. In addition, we analyzed two possible directions of the large elliptical axis: horizontal and vertical. Plasmonic resonance in transmission and absorption characteristics was sharper for horizontal ellipses, where the curvature radius at the slit was minimal.
We compared the calculated absorption and transmission coefficient with the “sandwich” model. Instead of the parallel wires, we placed a medium with some effective average permittivity and fixed thickness between two dielectric half-spaces and fit the data. This model allows for the analytical expressions of transmission and absorption coefficients. Least-squares minimisation showed that both models reproduced the behaviour of curves well. Furthermore, the fitted dependence for the anisotropic model practically coincided with BEM computation. Thus, the anisotropic model described the grating of parallel subwavelength wires.


