Article

Establishment of an Improved ELONA Method for Detecting Fumonisin B1 Based on Aptamers and Hemin-CDs Conjugates

Faculty of Life Science and Technology, Kunming University of Science and Technology, Kunming 650500, China
*
Author to whom correspondence should be addressed.
These authors contributed equally to this work.
Sensors 2022, 22(17), 6714; https://doi.org/10.3390/s22176714
Submission received: 20 August 2022 / Revised: 2 September 2022 / Accepted: 2 September 2022 / Published: 5 September 2022
(This article belongs to the Special Issue Recent Advances in Apta-Biosensors)

Abstract

:
Fumonisin B1 (FB1) is a strong mycotoxin that is ubiquitous in agricultural products. The establishment of rapid detection methods is an important means to prevent and control FB1 contamination. In this study, an improved enzyme-linked oligonucleotide assay (ELONA) method was designed and tested to detect the contents of FB1 in maize (corn) samples. F10 modified with biotin was bound to an enzyme label plate that was coated with streptavidin (SA) in advance, and carbon dots (CDs) were used to catalyze the color of tetramethylbenzidine (TMB). The complementary chain of F10 was modified with an amino group and coupled with CDs to obtain conjugates. The sample and conjugates were then added to the enzyme plate coated with F10 (an FB1 aptamer). Upon completion of the color reaction, the absorbance was measured at 450 nm. The LOD of this method was 4.30 ng/mL and the LOQ was 13.03 ng/mL. We observed a linear relationship in the FB1 concentration range of 0–100 ng/mL. The standard curve was y = −0.001482 × x + 0.3463, R2 = 0.9918, and the experimental results could be directly measured visually. The recovery of the maize sample was 97.5–99.23% and 94.54–99.25%, and the total detection time was 1 h.

1. Introduction

Fumonisins (FB) are important members of the mycotoxin family which are produced by Fusarium moniliforme Sheld. The group is partly comprised of fumonisin A1 (FA1), fumonisin A2 (FA2), fumonisin B1 (FB1), fumonisin B2 (FB2), and fumonisin B3 (FB3), of which FB1 is both the most common and most toxic [1]. The European Union (EU) and US Food and Drug Administration (FDA) have set the upper limit of FB1 in feed to be 200–2000 μg/kg and 3000–4000 μg/kg, respectively [2]. Iran, France, Bulgaria, Switzerland, and other countries stipulate that the upper limit of FB1 contamination for corn-based breakfast cereals should be 800 μg/kg, while that for baby food should be estimated at 200 μg/kg [3]. Maize (corn) is the crop most polluted by FB1, though the toxin has also been found in wheat and soybeans. As maize is the most common crop used for producing animal feed, its contamination with toxins is likely to lead to serious adverse reactions in the animals consuming it [2]. The toxic mechanism of FB1 involves the inhibition of sphingolipid biosynthesis; an important cellular regulator; thus leading to organ failure [4,5]. Existing studies have shown that a variety of diseases in mammals can be caused by FB1, such as equine white matter encephalomalacia [6], porcine pulmonary edema [7], mouse liver tumorigenesis [8], and acute kidney poisoning in goats [9]. FB1 can also cause adverse effects in poultry including sudden weight loss, shrinkage of the organs such as the spleen, acute myocarditis, liver function injury, and increased mortality [10,11,12].
Several methods have been developed for the detection of FB1. The main common methods for FB1 detection are ELISA, molecularly imprinted polymers (MIPs), chromatography, electrochemistry, and immunochromatography (ICA). Munawar proposed one such competitive method based on molecularly imprinted polymer nanoparticles (MINA). In the method, FB1 was fixed on a solid carrier for the preparation of nano-molecularly imprinted polymers (MIPs). The LOD for the method was in the concentration range of 10 pM–10 nM is 1.9 pM [4]. Another method was developed by Qian et al., whereby a Max column was combined with high-performance liquid chromatography-tandem mass spectrometry (UPLC-MS/MS) to determine the content of FB1 in dairy products. The LODs of FB1 and FB2 in combination with their hydrolytic metabolites were 0.03 μg/L and 0.1 μg/L, respectively [13]. However, disadvantages of the above two outlined technologies include their expensiveness, high consumption of human and material resources, a relatively long detection time, and the requirement of having results analyzed by professionals. The electrochemical method possessed a relatively high sensitivity, a low LOD, and the advantage of strong specificity for target recognition. Zheng et al. carried out a series of chemical modifications on gold nanoparticles and graphene oxide (GO) to amplify the electrochemical signal to a certain extent and provide an anchor location for the modification of the FB1 recognition probe. From this, they established an electrochemical detection sensor and the LOD was 10 pg/mL [14]. Compared to the other methods, this method performed with good practicability and stability. However, a series of cumbersome pretreatments of the samples is required before monitoring can be performed. Based on the antigen-antibody reaction and the color development characteristics of colloidal gold, immunochromatography assays (ICA) with colloidal gold as the medium have been widely used in the field of rapid detection for human health and food safety applications. Ren et al. developed a colloidal gold test strip for FB1 detection by immunochromatography with the LOD of 2.5 ng/mL. This was used for the rapid detection of FB1 in maize [15]. Because antibodies are expensive, the research and development of test strips require a lot of human capital and material resources. In conclusion, the above methods have the obvious advantage of all being low LOD values; however, the cost of these methods is high and it is difficult to achieve rapid detection in the field. Therefore, there exists the need for a new method that introduces raw materials with lower costs, creates strong affinity and specificity, and uses suitable aptamers.
Aptamer is a single-stranded DNA or RNA that has the ability to recognize different types of targets, including cells, proteins, and small molecules [16]. Due to their excellent affinity and specificity, aptamers are often considered comparable to antibodies and have advantages in field detection due to their chemical synthesis, ease of chemical modification, and exponential self-amplification [17]. These advantages allow aptamers to be used in diagnostics, therapeutics, drug delivery, environmental monitoring, and food safety [18,19]. Aptamers also play a key role in food safety detecting. An optical probe nanosensor based on multi-walled carbon nanotubes, reduced graphene quantum dots, and was developed for the specific detection of organophosphorus pesticide diazinon with a detection limit of 0.4 nM (0.1 μg/L) [20]. FAM was used to modify its specific aptamer and TAMRA burst group was used to modify its complementary DNA to detect aflatoxin M1 in milk. In the presence of AFM1, the formation of the AFM1/aptamer complex resulted in a structural switch of the aptamer. The change in the aptamer structure lead to the release of cDNA, resulting in a fluorescent signal with a detection line of 0.5 ng/mL [21].
Specific FB1 inducers (F10) with high affinity were successfully selected by phylogenetic evolution of exponentially enriched ligands (SELEX) [22]. Carbon dots (CDs) were first discovered by Xu et al. while separating a carbon nanotube suspension by electrophoretic purification in 2004 [23]. Carbon dots have stable optical properties, catalytic activity, biocompatibility, and low toxicity, and therefore have a wide range of applications in food safety [24,25,26]. In this study, the method selects an aptamer that has high specificity and selectivity for specific targets, innovatively modifies the complementary chain of aptamers, binds the complementary chain of aptamers to carbon dots (CDs) through the amidation reaction, and uses the catalytic ability of CDs. A method for detecting FB1 by the ELONA based on an aptamer complementary chain and a fluorescent CDs conjugate was established. The method not only possesses all the advantages of the traditional ELISA; such as being fast, convenient, highly sensitive, and having low requirements for a sample pretreatment; it also possesses the unique advantage of the low cost resulting from using aptamers. As shown in Scheme 1, when the assay FB1 is present in the system, FB1 and the aptamer complementary chain-carbon dot coupling form a competitive relationship and bind to the aptamer, leading to a decrease in the efficiency of the carbon dot being bound to the enzyme plate and a weakening of the catalytic effect, resulting in a low measured value of OD450.

2. Materials and Methods

2.1. Reagents and Apparatuses

FB1 was purchased from Binzhi Biotechnology (Shanghai, China). Ochratoxin A (OTA) was purchased from Xiheng Biotechnology (Shanghai, China). Zearalenone (ZEN) was purchased from Fubo Biotechnology (Beijing, China). Aflatoxin B1, aflatoxin G1, aflatoxin G2, 1-(3-dimethylaminopropyl)-3-ethylcarbodiimide hydrochloride (EDC), and 4-morpholineethanesulfonic acid (MES) were purchased from the Sigma-Aldrich Corporation (USA). Bovine serum albumin (BSA) was purchased from Shanghai Baisai Biotechnology Co., Ltd. (Shanghai, China). N-Hydroxysuccinimide was purchased from Shanghai Hongshun Biotechnology Co., Ltd. (Shanghai, China). All reagents used in the experiment were of analytical grade. The corn flour samples were purchased from local markets. A 0.01 M of phosphate-buffered saline (PBS) (pH 7.4) was used for fluorescence measurements. The carbonate buffer solution was prepared to contain 35 mmol/L NaHCO3 and 15 mmol/L Na2CO3 with ddH2O, and the pH was adjusted to 9.6. The oligonucleotides used in the experiment were synthesized by Tsingke Biological Technology (Beijing, China). The sequence of the F10 oligonucleotide is as follows: 5′-bio-CGATCTGGATATTATTTTTGATACCCCTTTGGGGAGACAT-3′. The sequence of the F10-com oligonucleotide is as follows: 5′-NH2-6(CH2)-ATGTCTCCCCAAAGGGGTAT-3′. An Agilent G9800A spectrofluorometer was used for measuring spectra. Thermo BIOMATE 3S was used to detect the results of the ELISA kit.

2.2. Synthesis of Hemin-CDs Conjugates

The Hemin-CDs were synthesized by the one-step hydrothermal method [27]. Choline chloride, glycine, and heme were calculated to have a molar ratio of 1:1:1. First, an amount of 0.606 g of urea, 1.39 g of choline chloride, 0.75 g of glycine, and 0.02 g of heme chloride were mixed in 40 mL of ddH2O and calcined in the autoclave at 180 °C for 8 h. Then, the resulting mixture was removed when the autoclave had recovered to room temperature and then centrifuged at 10,000 rpm for 10 min. Finally, the supernatant was filtered with a 0.22 μm filter membrane to obtain hemin-CDs conjugates, which were stored at 4 °C. The 10 μL preparation of hemin-CDs conjugates was placed in the refrigerator at −80 °C for freezing overnight and then freeze-dried with a freeze dryer before being weighed. The hemin-CDs conjugate preparation was then diluted to 30 mg/mL with ddH2O before usage.

2.3. Coupling F10-com with Hemin-CDs

The 300 mM NHS and 150 mM EDC solutions were prepared with ddH2O. A volume of 300 μL of 300 mM NHS, 300 μL of 150 mM EDC, and 325 μL of hemin-CDs conjugates were added into the 5 mL tube, then vortexed and vibrated for 1 min to fully mix the components, and stood at room temperature for 30 min. A volume of 300 μL of 10 mM F10-com and 400 μL of MES buffer was added to the above centrifuge tube and incubated overnight on a shaking table at 37 °C 120 rpm. Optimization of the F10-com concentration: F10-com was diluted to 10 μM with ddH2O. A volume of 300 μL of F10-com and 400 μL of MES buffer with different concentrations were added to the carboxyl-activated hemin-CDs conjugates so that the final concentrations of F10-com in the system were 0, 0.615, 1.23, 1.85, 2.46, and 3.07 μM, respectively. A volume of 35 μL of F10-com-hemin-CDs conjugates containing different concentrations of F10-com and 65 μL PBS was added to each well on the bio-F10 coated enzyme label plates, then gently shaken and mixed, and incubated at 37 °C at 60 rpm in a shaking table for 1 h. The microplates were then washed with PBST buffer 3X. A volume of 100 μL of TMB substrate solution was added to each well and incubated in the dark at room temperature for 30 min. Then, 100 μL of 10% sulfuric acid solution was added to each well to terminate the reaction and the absorbance values of all groups were measured within 10 min at 450 nm.

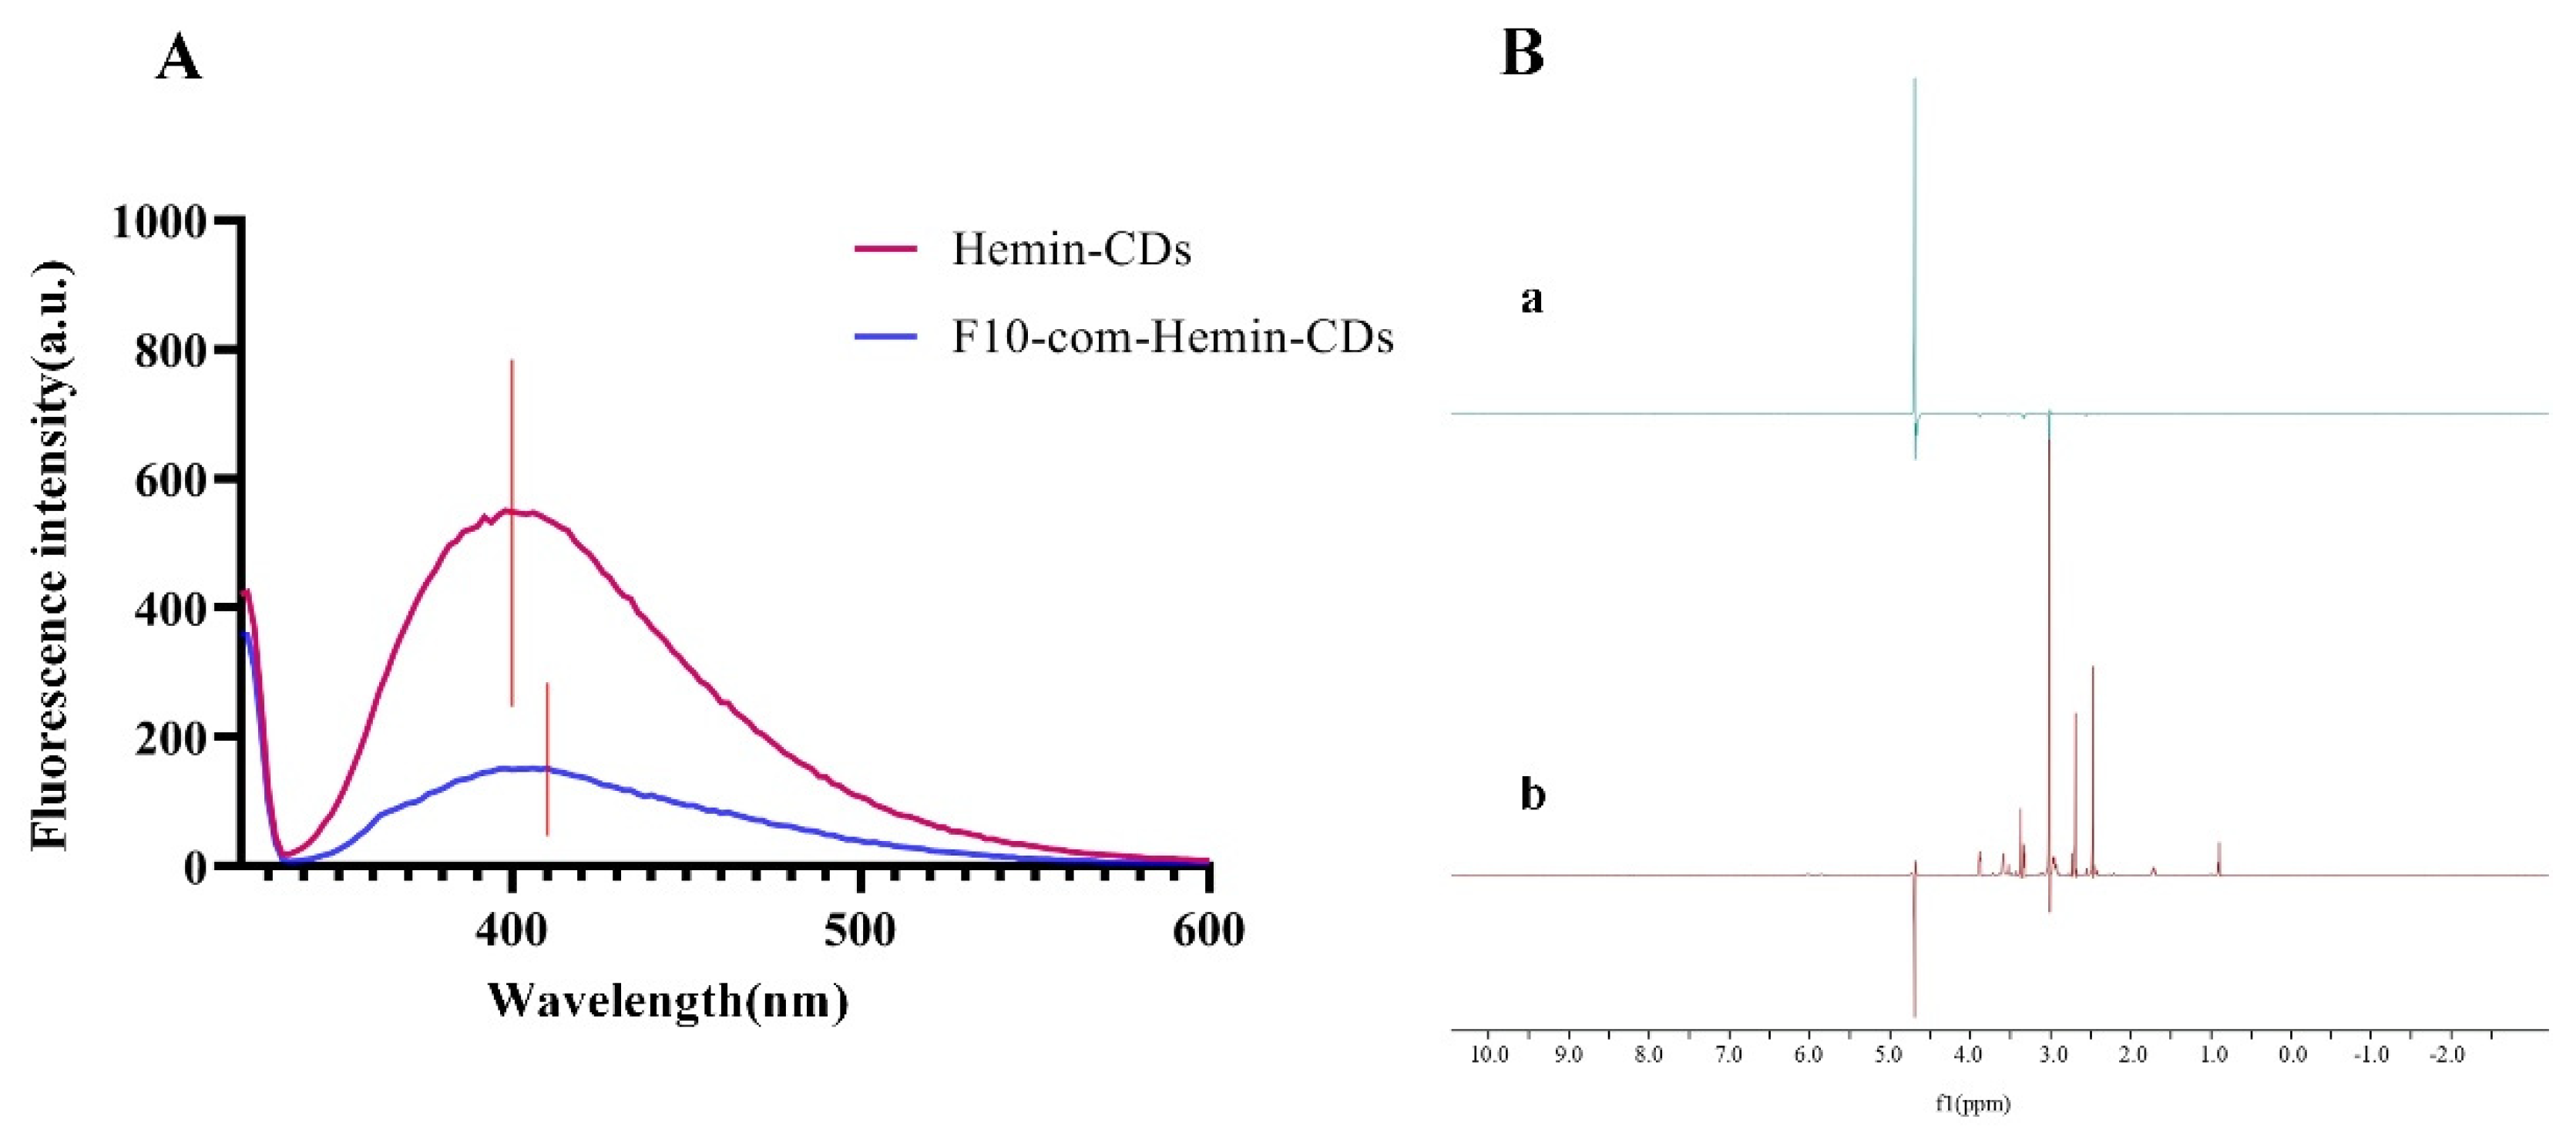
2.4. Verification of the Successful Coupling between Hemin-CDs and F10-com

Fluorescence migration method: A volume of 40 μL 30 mg/mL of hemin-CDs and a volume of 40 μL of F10-com hemin-CDs conjugates were aliquoted into two 5 mL centrifuge tubes, respectively. The volumes were fixed with PBS to 3000 μL, then vortexed and vibrated for 2 min to fully mix the solution. The parameters of the fluorescence meter were then set to the excitation wavelength of 322 nm under the emission condition, and the fluorescence spectra of the solutions in the two centrifugal tubes were measured.
Nuclear magnetic resonance: For F10-com-Hemin-CDs coupling product sample preparation, 365 μL of NMR buffer (10 mM NaCl, 12.3 mM KCl, 2 mM KH2PO4, 10 mM Na2HPO4, and 0.01% Tween-20, H2O: D2O = 9:1) was added to 135 μL of F10-com-Hemin-CDs coupling product in a total volume of 500 μL. For F10-com+Hemin-CDs sample preparation, 2.5 μL of NMR buffer was added to 470.5 μL of 100 μM F10-com and 27 μL Hemin-CDs in a total volume of 500 μL. The 1H spectra were performed at 288 K on a Bruker 600 MHz NMR spectrometer equipped with an H/C/N ultra-low temperature probe at 25 °C, all sampled using the W5 water peak.

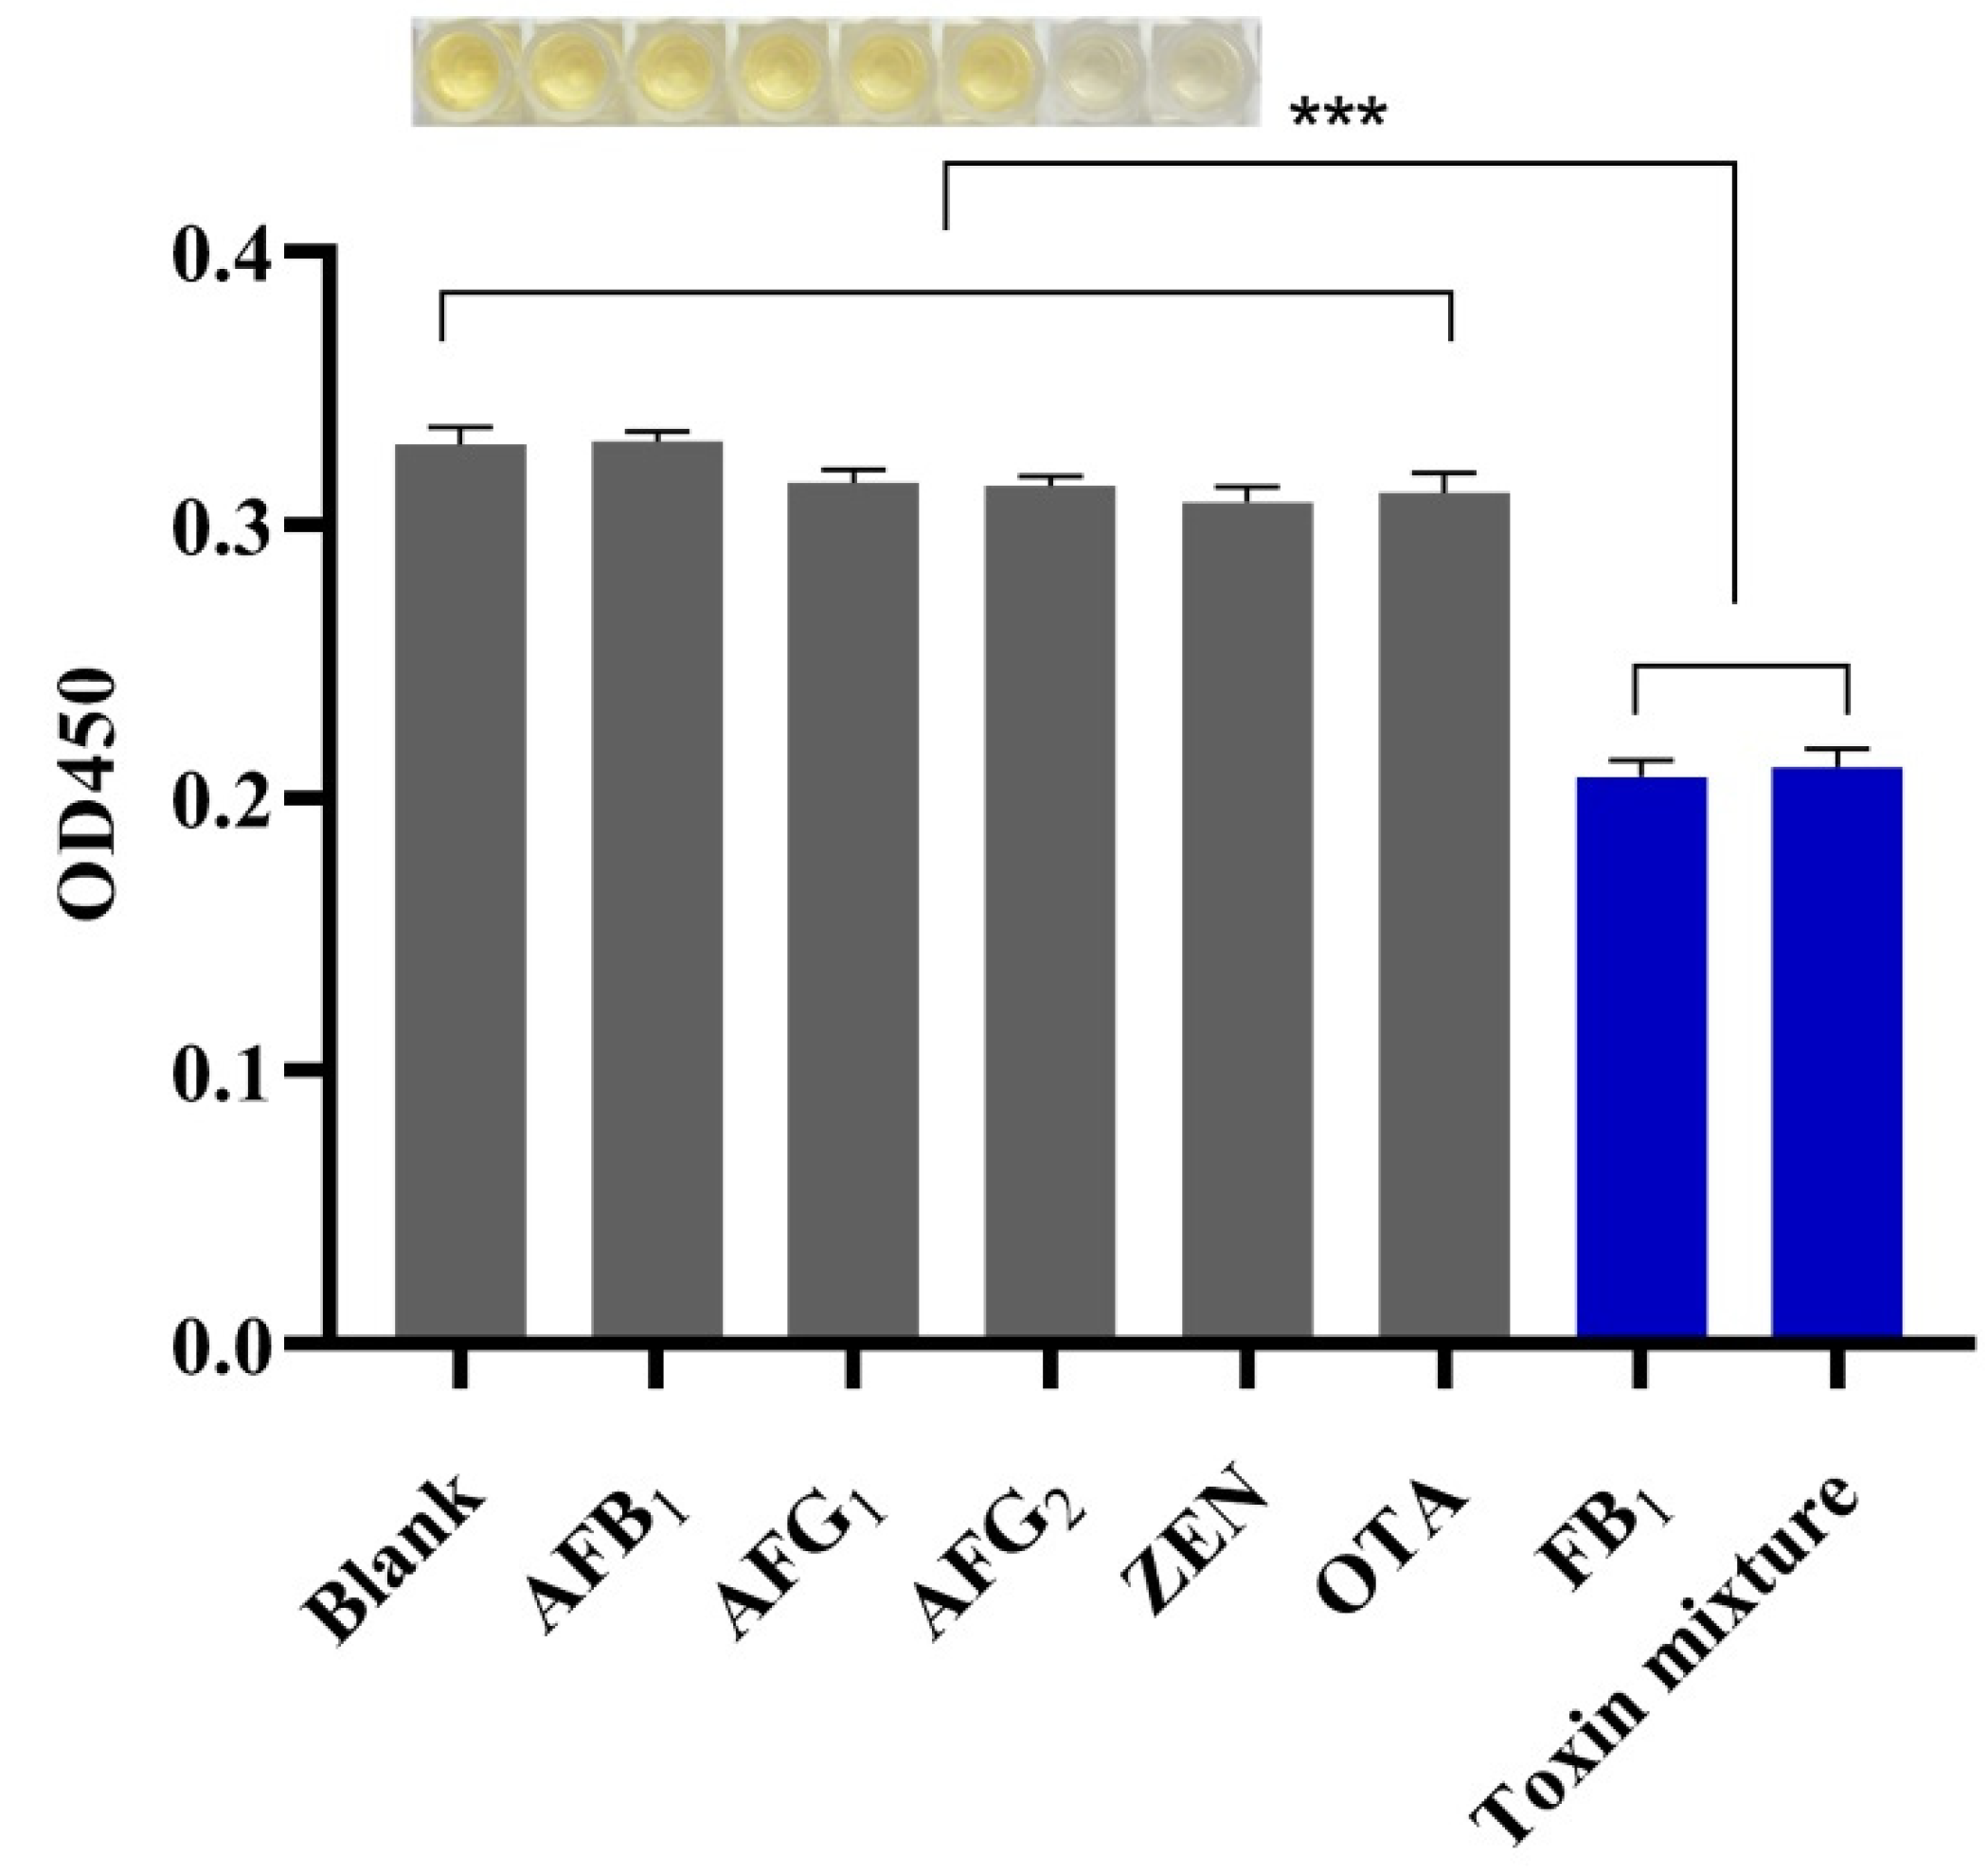
2.5. Specificity Verification

A volume of 35 μL of F10-com-hemin-CDs conjugates and 10 μL of toxin diluted to 1 mg/mL was added to the F10-coated microplates so that the resulting toxin concentrations in the AFB1, AFG1, AFG2, ZEN, OTA, and FB1 groups were 100 ng/mL. A volume of 10 μL of ddH2O was added to the blank group and all the above holes were filled with PBS to 100 μL. After incubation in the dark at room temperature for 30 min, the microplates were washed with PBST buffer 3X and left to stand for 1 min each time. A volume of 100 μL of TMB substrate solution was added to each well and incubated in the dark at room temperature for 30 min. Then, 100 μL of 10% sulfuric acid solution was added to each well to terminate the reaction and the absorbance values of all groups were measured within 10 min at 450 nm.

2.6. Detection of the FB1 Standard Solution

A volume of 35 μL of F10-com-hemin-CDs conjugates, 35 μL of PBS, and 30 μL of FB1 standard solution diluted with ddH2O were added to the F10 coated microplates so that the resulting concentration of FB1 in each well was 0, 200, 400, 600, 800, and 1000 ng/mL, respectively. After 30 min of incubation in the dark at room temperature, the microplates were washed with PBST buffer 3X for 1 min each time. A volume of 100 μL of TMB substrate solution was added to each well and incubated in the dark at room temperature for 30 min. Then, 100 μL of 10% sulfuric acid solution was added to each well to terminate the reaction and the absorbance values of all groups were measured within 10 min at 450 nm.

2.7. Analysis of FB1 in Corn Flour Samples

The corn flour used in the experiment was purchased from a local supermarket as an edible raw material and the laboratory test showed no background values. Different concentrations of FB1 were added to the corn flour samples. Because FB1 is a water-soluble toxin, ddH2O was used to extract the toxin. An amount of 1 g each of two corn flour samples, A and B, was weighed, dissolved by 5 mL ddH2O, and then centrifuged at 6000 rpm for 20 min, respectively. The obtained supernatant was passed through a 0.22 μm filter membrane on the night and stored in a refrigerator at 4 °C for backup. FB1 standard was added to the above-pretreated samples until the total volume was 30 μL and the concentrations of FB1 were 20, 80, and 200 ng/mL, respectively. The spiked 30 μL sample, 35 μL of the F10-com-hemin-CDs conjugates, and 35 μL of PBS were added into the F10 coated microplates and shaken lightly to mix the components evenly. After 30 min of incubation in the dark at room temperature, the microplates were washed with PBST buffer 3X for 1 min each time. A volume of 100 μL of TMB substrate solution was added to each well and incubated in the dark at room temperature for 30 min. Then, 100 μL of 10% sulfuric acid solution was added to each well to terminate the reaction and the absorbance values of all groups were measured within 10 min at 450 nm.

3. Results and Discussion

3.1. Characterization of Hemin-CDs

The morphological characteristics of the hemin-CDs conjugates were observed by transmission electron microscope (TEM). As shown in Figure 1, hemin-CDs are spherical structures with uniform dispersion and the average particle diameter is 3.64 nm(The size of CDs was mostly less than 10 nm).

3.2. Verification of F10-com-Hemin-CDs Coupling Products

Fluorescence migration method: the fluorescence spectra of hemin-CDs conjugates and F10-com hemin-CDs conjugates were compared. As shown in Figure 2A, the fluorescence spectra measured by hemin-CDs showed their peak value to be at 400 nm, while the peak of F10-com-hemin-CDs was at the wavelength of 412 nm. The peak of the latter conjugate possessed a 12 nm shift, thus demonstrating that hemin-CDs was successfully coupled with F10-com, rather than the two conjugates having simply been mixed together. Nuclear magnetic resonance: as seen in Figure 2B, the peak spectrum of F10-com-hemin-CDs clearly produced new peaks between 0–5 ppm compared with the uncoupled peak spectrum. This was accompanied by the disappearance of some peaks, thus showing that there were new bonds formed alongside the disappearance of others. This indicates the occurrence of carboxyl dehydroxylation between the conjugates, followed by amino dehydrogenation, thus completing the amidation reaction. The result was the successful preparation of F10-com-hemin-CDs conjugates.

3.3. Optimization of Experimental Conditions

3.3.1. F10 Encapsulated on Enzyme Labeling Plate

Detailed steps in the Supplementary Material.

3.3.2. Optimization of F10-com Concentration

In the set gradient, OD450 initially increased and then decreased (Figure 3A). The reason for this is likely that F10-com was added to excess, such that some F10-com were not coupled with hemin-CDs successfully, but were still combined with F10 in the detection step. In this scenario, the amount of hemin-CDs bound to F10 was less, resulting in the reduction of its catalytic ability and the reduction of catalytic TMB ability. Therefore, the measured OD450 decreased. When the F10 com concentration was 1.85 μM, the value of OD450 was the greatest. Hence, the optimal concentration of F10-com was 1.85 μM. The fluorescent carbon dots prepared in this study were prepared by a one-step hydrothermal method and heme chloride was added to them to give the carbon dots good oxidation properties and can oxidize TMB, which is used as a catalyst instead of HRP in this method [28].

3.3.3. Optimization of F10-com-Hemin-CDs Addition

To maximize the competition between hemin-CDs and FB1, it is necessary to saturate the concentration of F10-com in the system without the target FB1, so that hemin-CDs can exert their maximum catalytic ability. The F10-com-hemin-CDs conjugate preparation was added to each well on a bio-F10 coated enzyme label plate. The amounts of F10-com-hemin-CDs conjugates added were 0, 5, 10, 15, 20, 25, 30, 35, 40, 45, and 50 μL, respectively, within which the concentrations of F10-com were 0, 9.23, 18.46, 27.69, 36.92, 46.15, 55.38, 64.62, 73.85, 83.08, and 92.31 × 10⁻³ nM, respectively. These were supplemented to 100 μL with PBS and incubated at 37 °C 60 rpm for 1 h. The microplates were then washed with PBST buffer 3X. A volume of 100 μL of TMB substrate solution was added to each well and incubated in the dark at room temperature for 30 min. Then, 100 μL of 10% sulfuric acid solution was added to each well to terminate the reaction and the absorbance values of all groups were measured within 10 min at 450 nm. As shown in Figure 3B, with the increase of F10-com-hemin-CDs, the measured OD450 value increased gradually, and the color of the solution became darker, as assessed by the naked eye. Therefore, the F10 concentration of 64.62 × 10⁻³ nM was chosen as the best concentration.

3.4. Specificity Verification

To verify the selectivity of the method using the above-optimized conditions for each factor, the blank group, AFB1, AFG1, AFG2, ZEN, OTA, FB1, and toxin mixture were detected at the same time. Figure 4 displays the results measured when the concentration of toxin was 100 ng/mL. Compared with the blank control group, there was no obvious change in the measured results of AFB1, AFG1, AFG2, ZEN, and OTA groups. The OD450 of the FB1 group and toxin mixture group decreased significantly, and the color of the FB1 group and toxin mixture group was darker. This demonstrated that the method possessed high specificity.

3.5. Sensitivity of ELONA for FB1 Detection and Detection Range

Under the optimized conditions, the established detection method was used to detect the FB1 standard solution. The tested gradient concentrations of FB1 were 0, 200, 400, 600, 800, and 1000 ng/mL. The test result is shown in Figure 5A. When the concentration of FB1 was in the range of 0 ng/mL to 100 ng/mL, the absorbance value showed a good linear relationship with the concentration of FB1 and a linear relationship curve of y = −0.001482 × x + 0.3463 and R2 = 0.9918 was obtained. OD450 decreased gradually with the increase of the concentration of FB1, indicating that the catalytic ability of hemin-CDs decreased due to competition. Simultaneously, the color of the solution gradually became lighter, as observed by the naked eye. The calculation formula of the LOD was 3.3 × σ/S, where σ was the standard deviation of the test value of the blank group and S was the slope of the standard curve. Similarly, we used the equation 10 × σ/S to calculate the LOQ. Under the optimized conditions, the LOD value of the method was 4.30 ng/mL and the LOQ value was 13.03 ng/mL. FB1 and F10-com-Hemin-CDs were added to the enzyme plate precoated with F10, so the detection time of the method was 1 h.
By inferring from the standard curve, the maximum concentration of FB1 that can be detected by this method is 235.97 ng/mL. Through the detection of FB1 with different concentrations, when the concentration of FB1 was in the range of 0–200 ng/mL, there was still a good linear relationship between the FB1 concentration and OD450 (Figure 5B). However, when the concentration of FB1 exceeded 200 ng/mL, the value of OD450 plateaued. Therefore, the concentration range of FB1 detected by this method was 0–200 ng/mL. The detection range of the method in this study is 0–200 ng/mL, which has the advantage of being a wide detection range. If the concentration of FB1 in the food to be tested is high, the detection range of the method is small and false negatives may occur.
The detection process of the method in this study requires at least 1 h, which is relatively long compared with that of the electrochemical biosensor [29]. Therefore, more sensitive materials coupled with aptamers can be selected to establish a more rapid and sensitive detection method in future studies. In addition, electrochemical methods can be combined with competitive immunoreactivity and aptamer-based assays where different particles (e.g., AuNPs, magnetic nanoparticles, microplates) are functionalized with aptamers for fast detection, high specificity, and low LOD [30,31]. The improved ELONA method established in this study can be used for the subsequent development of commercial kits to detect FB1 in food and feed, like conventional ELISA kits after pre-treatment of enzyme-labeled plates with aptamer F10 and validation of its timeliness. The main problems of using current ELISA kits include high cost and narrow detection range, while the method established in this study can effectively circumvent these drawbacks.
FB1 is one of the more common mycotoxins in daily life, and mycotoxins usually do not appear alone, but usually there are multiple mycotoxins in moldy foods, and they are all very harmful to humans. Therefore, it is very important to establish a test method to detect multiple mycotoxins at the same time. Currently available methods that can simultaneously perform multiple toxin detections include immunochromatographic and electrochemical methods. Huang et al. established an immunochromatographic test strip based on gold nanoparticles (AuNPs), which can be applied to the simultaneous detection of FB1 and deoxynivalenol (DON) in traditional Chinese medicine with the detection limits of 20 ng/mL and 5.0 ng/mL for FB1 and DON, respectively [32]. Jiang et al. established a magnetron aptamer sensor for the simultaneous detection of OTA and FB1 using quantum dots (QDs)-coated silica as markers and complementary DNA-functionalized magnetic beads as capture probes, with detection limits of 0.10 ng/mL and 0.30 ng/mL for OTA and FB1, respectively [33].

3.6. Detection of FB1 in Corn Flour Samples

In order to verify the practicality of the method in real samples, different concentrations of FB1 were added to the pretreated samples. The standard addition and recovery experiments were carried out with the ELONA and ELISA kits constructed in this study, and the test results were compared. According to Table 1, the recovery rate of ‘corn flour sample 1′ measured by the method proposed by this study was 97.5–99.23%, and the recovery rate detected by the ELISA kit was 98.75–99.87%. The recovery of ‘corn flour sample 2′ by the method proposed by this study was 94.54–99.25%, and the recovery rate was 99.38–99.84% by the ELISA kit. Detection by the ELISA kit confirmed that the detection results of the method proposed by this study were accurate and sensitive and hence it can be used for the accurate monitoring of FB1 in food samples. The economic advantage of using aptamers in place of antibodies cannot be ignored, and the cost of using our method is significantly lower than that of the ELISA. Since the actual sample was tested with 1 g of corn sample dissolved in 5 mL of solution, the limit values of FB1 in corn flour of 800 μg/kg and 200 μg/kg [3] could be converted. With 200 μg/kg as the calibration value, 1 kg of corn flour was dissolved in 5 L solution, the upper limit of FB1 was converted to 40 ng/mL, and the LOD of this method was 4.30 ng/mL. Therefore, this method meets the detection requirements of the standard. The ELONA method pre-treatment is simple: ddH2O is used to dissolve the sample and extract FB1, and only simple weighing, dissolving, centrifuging, and filtering of the sample is required for the assay. LC-MS, on the other hand, requires more cumbersome sample handling methods [34].

4. Conclusions

To summarize, we successfully developed a method for the detection of FB1 by ELONA based on aptamer complementary chains and fluorescent carbon dot couples, using fluorescent carbon dots as catalysts for TMB color development. Under optimal conditions, the OD450 decreased linearly as the concentration of FB1 increased from 0 to 50 ng/mL, with an LOD of 13.03 ng/mL and a detection range of 0–200 ng/mL. The assay was highly specific for FB1 and did not detect other toxins with similar structures including AFB1, AFG1, AFG2, ZEN and OTA, and confirmed the feasibility of the method for use on maize flour samples. The recoveries of FB1 in the two spiked corn flour samples ranged from 97.5% to 99.23% and 94.54% to 99.25%, respectively. This method has the advantages of simple steps and low LOD, in comparison with the traditional ELISA, and also has the advantage of low cost, providomg an ideal means for rapid on-site detection of FB1 in samples.

Supplementary Materials

The following supporting information can be downloaded at: https://www.mdpi.com/article/10.3390/s22176714/s1, F10 encapsulated on enzyme labeling plate in the supplementary material.

Author Contributions

Conceptualization, Q.H.; methodology, Q.H.; validation, Q.H., X.Z. and J.G.; formal analysis, Q.H., X.Z. and J.G.; investigation, Q.H.; Q.H., Y.S. and J.Z.; data curation, Q.H.; writing—original draft preparation, X.Z. and J.G.; writing—review and editing, Q.H. and J.G.; visualization, X.Z. and J.G.; supervision, Q.H.; project administration, Q.H.; funding acquisition, Q.H. All authors have read and agreed to the published version of the manuscript.

Funding

This research was funded by National Natural Science Foundation of China (NSFC Grant No. 32160601) and Basic research projects of Yunnan Province (No. 202001AT070033).

Conflicts of Interest

The authors declare no conflict of interest.

References

  1. Wang, X.; Wu, Q.; Wan, D.; Liu, Q.; Chen, D.; Liu, Z.; Martínez-Larrañaga, M.R.; Martínez, M.A.; Anadón, A.; Yuan, Z. Fumonisins: Oxidative stress-mediated toxicity and metabolism in vivo and in vitro. Arch. Toxicol. 2016, 90, 81–101. [Google Scholar] [CrossRef] [PubMed]
  2. Acuña-Gutiérrez, C.; Schock, S.; Jiménez, V.M.; Müller, J.J.F.C. Detecting fumonisin B1 in black beans (Phaseolus vulgaris L.) by near-infrared spectroscopy (NIRS). Food Control 2021, 130, 108335. [Google Scholar] [CrossRef]
  3. Kamle, M.; Mahato, D.K.; Devi, S.; Lee, K.E.; Kang, S.G.; Kumar, P. Fumonisins: Impact on Agriculture, Food, and Human Health and their Management Strategies. Toxins 2019, 11, 328. [Google Scholar] [CrossRef] [PubMed]
  4. Munawar, H.; Smolinska-Kempisty, K.; Cruz, A.G.; Canfarotta, F.; Piletska, E.; Karim, K.; Piletsky, S.A. Molecularly imprinted polymer nanoparticle-based assay (MINA): Application for fumonisin B1 determination. Analyst 2018, 143, 3481–3488. [Google Scholar] [CrossRef]
  5. Yu, S.; Jia, B.; Liu, N.; Yu, D.; Zhang, S.; Wu, A. Fumonisin B1 triggers carcinogenesis via HDAC/PI3K/Akt signalling pathway in human esophageal epithelial cells. Sci. Total Environ. 2021, 787, 147405. [Google Scholar] [CrossRef]
  6. Marasas, W.F.; Kellerman, T.S.; Pienaar, J.G.; Naudé, T.W. Leukoencephalomalacia: A mycotoxicosis of Equidae caused by Fusarium moniliforme Sheldon. Onderstepoort J. Vet. Res. 1976, 43, 113–122. [Google Scholar] [PubMed]
  7. Kriek, N.P.; Kellerman, T.S.; Marasas, W.F. A comparative study of the toxicity of Fusarium verticillioides (= F. moniliforme) to horses, primates, pigs, sheep and rats. Onderstepoort J. Vet. Res. 1981, 48, 129–131. [Google Scholar]
  8. Gelderblom, W.C.; Snyman, S.D. Mutagenicity of potentially carcinogenic mycotoxins produced byFusarium moniliforme. Mycotoxin Res. 1991, 7, 46–52. [Google Scholar] [CrossRef]
  9. Edrington, T.S.; Kamps-Holtzapple, C.A.; Harvey, R.B.; Kubena, L.F.; Elissalde, M.H.; Rottinghaus, G.E. Acute hepatic and renal toxicity in lambs dosed with fumonisin-containing culture material. J. Anim. Sci. 1995, 73, 508–515. [Google Scholar] [CrossRef]
  10. Marijanovic, D.R.; Holt, P.; Norred, W.P.; Bacon, C.W.; Voss, K.A.; Stancel, P.C.; Ragland, W.L. Immunosuppressive effects of Fusarium moniliforme corn cultures in chickens. Poult. Sci. 1991, 70, 1895–1901. [Google Scholar] [CrossRef]
  11. Espada, Y.; Ruiz de Gopegui, R.; Cuadradas, C.; Cabañes, F.J. Fumonisin mycotoxicosis in broilers: Plasma proteins and coagulation modifications. Avian Dis. 1997, 41, 73–79. [Google Scholar] [CrossRef]
  12. Javed, T.; Bennett, G.A.; Richard, J.L.; Dombrink-Kurtzman, M.A.; Côté, L.M.; Buck, W.B. Mortality in broiler chicks on feed amended with Fusarium proliferatum culture material or with purified fumonisin B1 and moniliformin. Mycopathologia 1993, 123, 171–184. [Google Scholar] [CrossRef]
  13. Qian, M.R.; Wu, L.Q.; Hu, Z.; Fei, L.; Rui, L.; Chen, Z.M.; Fang, L.Z. Determination of Fumonisins B-1, B-2 and Their Hydrolysed Metabolites in Bovine Milk by Liquid Chromatography-Tandem Mass Spectrometry. Food Control 2012, 40, 757–761. [Google Scholar]
  14. Zheng, Y.; Shi, Z.; Wu, W.; He, C.; Zhang, H.J. Label-Free DNA Electrochemical Aptasensor for Fumonisin B1 Detection in Maize Based on Graphene and Gold Nanocomposite. J. Anal. Chem. 2021, 76, 252–257. [Google Scholar] [CrossRef]
  15. Ren, W.; Xu, Y.; Huang, Z.; Li, Y.; Tu, Z.; Zou, L.; He, Q.; Fu, J.; Liu, S.; Hammock, B.D. Single-chain variable fragment antibody-based immunochromatographic strip for rapid detection of fumonisin B(1) in maize samples. Food Chem. 2020, 319, 126546. [Google Scholar] [CrossRef]
  16. Song, S.-H.; Gao, Z.-F.; Guo, X.; Chen, G.-H. Aptamer-Based Detection Methodology Studies in Food Safety. Food Anal. Methods 2019, 12, 966–990. [Google Scholar] [CrossRef]
  17. Li, F.; Zhang, H.; Wang, Z.; Newbigging, A.M.; Reid, M.S.; Li, X.-F.; Le, X.C. Aptamers Facilitating Amplified Detection of Biomolecules. Anal. Chem. 2015, 87, 274–292. [Google Scholar] [CrossRef]
  18. Yüce, M.; Ullah, N.; Budak, H. Trends in aptamer selection methods and applications. Analyst 2015, 140, 5379–5399. [Google Scholar] [CrossRef]
  19. Evtugyn, G.; Hianik, T. Chapter 3–Aptamer-based biosensors for mycotoxin detection. In Nanomycotoxicology; Rai, M., Abd-Elsalam, K.A., Eds.; Academic Press: Cambridge, MA, USA, 2020; pp. 35–70. [Google Scholar]
  20. Tian, F.; Zhou, J.; Fu, R.; Cui, Y.; Zhao, Q.; Jiao, B.; He, Y. Multicolor colorimetric detection of ochratoxin A via structure-switching aptamer and enzyme-induced metallization of gold nanorods. Food Chem. 2020, 320, 126607. [Google Scholar] [CrossRef]
  21. Qiao, Q.; Guo, X.; Wen, F.; Chen, L.; Xu, Q.; Zheng, N.; Cheng, J.; Xue, X.; Wang, J. Aptamer-Based Fluorescence Quenching Approach for Detection of Aflatoxin M(1) in Milk. Front. Chem. 2021, 9, 653869. [Google Scholar] [CrossRef]
  22. Huang, Y.; Chen, X.; Duan, N.J.M.A.A.I.J.; Analysis, C.M. Selection and characterization of single stranded DNA aptamers recognizing funionism B1. Microchim. Acta 2014, 181, 1317–1324. [Google Scholar]
  23. Xu, X.; Ray, R.; Gu, Y.; Ploehn, H.J.; Gearheart, L.; Raker, K.; Scrivens, W.A. Electrophoretic analysis and purification of fluorescent single-walled carbon nanotube fragments. J. Am. Chem. Soc. 2004, 126, 12736–12737. [Google Scholar] [CrossRef] [PubMed]
  24. Sarkar, S.; Banerjee, D.; Ghorai, U.K.; Das, N.S.; Chattopadhyay, K.K.J.J. Size dependent photoluminescence property of hydrothermally synthesized crystalline carbon quantum dots. J. Lumin. 2016, 178, 314–323. [Google Scholar] [CrossRef]
  25. Bianco, A.; Chen, Y.; Frackowiak, E.; Holzinger, M.; Terrones, M.J.C. Carbon Science Perspective in 2020: Current Research and Future Challenges. Carbon 2020, 161. [Google Scholar] [CrossRef]
  26. Huang, Q.; Li, N.; Zhang, H.; Che, C.; Sun, F.; Xiong, Y.; Canady, T.D.; Cunningham, B.T. Critical Review: Digital resolution biomolecular sensing for diagnostics and life science research. Lab Chip 2020, 20, 2816–2840. [Google Scholar] [CrossRef]
  27. Feng, S.; Gao, Z.; Liu, H.; Huang, J.; Li, X.; Yang, Y. Feasibility of detection valence speciation of Cr(III) and Cr(VI) in environmental samples by spectrofluorimetric method with fluorescent carbon quantum dots. Spectrochim. Acta Part A Mol. Biomol. Spectrosc. 2019, 212, 286–292. [Google Scholar] [CrossRef]
  28. Gao, J.; Liu, N.; Zhang, X.; Yang, E.; Song, Y.; Zhang, J.; Han, Q. Utilizing the DNA Aptamer to Determine Lethal α-Amanitin in Mushroom Samples and Urine by Magnetic Bead-ELISA (MELISA). Molecules 2022, 27, 538. [Google Scholar] [CrossRef]
  29. Kaminiaris, M.; Mavrikou, S.; Georgiadou, M.; Paiv, G.; Tsitsigiannis, D.; Kintzios, S. An Impedance Based Electrochemical Immunosensor for Aflatoxin B1 Monitoring in Pistachio Matrices. Chemosensors 2020, 8, 121. [Google Scholar] [CrossRef]
  30. Castillo, G.; Spinella, K.; Poturnayová, A.; Šnejdárková, M.; Mosiello, L.; Hianik, T. Detection of aflatoxin B1 by aptamer-based biosensor using PAMAM dendrimers as immobilization platform. Food Control 2015, 52, 9–18. [Google Scholar] [CrossRef]
  31. Lin, Y.; Zhou, Q.; Lin, Y.; Tang, D.; Niessner, R.; Knopp, D. Enzymatic hydrolysate-induced displacement reaction with multifunctional silica beads doped with horseradish peroxidase-thionine conjugate for ultrasensitive electrochemical immunoassay. Anal. Chem. 2015, 87, 8531–8540. [Google Scholar] [CrossRef]
  32. Huang, X.; Huang, X.; Xie, J.; Li, X.; Huang, Z. Rapid simultaneous detection of fumonisin B(1) and deoxynivalenol in grain by immunochromatographic test strip. Anal. Biochem. 2020, 606, 113878. [Google Scholar] [CrossRef]
  33. Jiang, D.; Huang, C.; Shao, L.; Wang, X.; Jiao, Y.; Li, W.; Chen, J.; Xu, X. Magneto-controlled aptasensor for simultaneous detection of ochratoxin A and fumonisin B1 using inductively coupled plasma mass spectrometry with multiple metal nanoparticles as element labels. Anal. Chim. Acta 2020, 1127, 182–189. [Google Scholar] [CrossRef]
  34. Salim, S.A.; Sukor, R.; Ismail, M.N.; Selamat, J. Dispersive Liquid-Liquid Microextraction (DLLME) and LC-MS/MS Analysis for Multi-Mycotoxin in Rice Bran: Method Development, Optimization and Validation. Toxins 2021, 13, 280. [Google Scholar] [CrossRef]
Scheme 1. Schematic diagram of the ELONA method based on aptamer complementary chains and CDs conjugates.
Sensors 22 06714 sch001
Figure 1. Characterization of hemin-CDs. (A) TEM of hemin-CDs conjugates. (B) The size of hemin-CDs.
Sensors 22 06714 g001
Figure 2. F10-com-hemin-CDs conjugate. (A) The successful coupling of F10-com and hemin-CDs was verified by the fluorescence shift method. (B) 1H NMR spectra of F10-com-hemin-CDs coupling and uncoupling. a. F10-com and hemin-CDs mixture. b. F10-com-hemin-CDs conjugate.
Sensors 22 06714 g002
Figure 3. Optimization of experimental conditions. (A) Optimization of F10-com concentration. (B) Optimization of the addition volume of F10-com-hemin-CDs conjugates.
Sensors 22 06714 g003
Figure 4. Specific detection. (Toxin mixture include AFB1, AFG1, ZEN, OTA and FB1, *** p < 0.005).
Sensors 22 06714 g004
Figure 5. Sensitivity of ELONA for FB1 detection and detection range. (A) Standard curve of FB1 as detected by ELONA. (B) The concentration range of FB1 can be detected by ELONA.
Sensors 22 06714 g005
Table 1. Comparison of the detection results of FB1 in corn samples between the method proposed by this study and the ELISA kit.
SampleAddition Amount (ng/mL)Detection Value (ng/mL)Recovery (%)Detection Value (ELISA) (ng/mL)Recovery (%)
Sample 12019.50 ± 0.3497.519.74 ± 0.0998.75
8079.39 ± 0.3499.2379.90 ± 0.0899.87
200195.81 ± 0.6597.91197.41 ± 0.0998.75
Sample 22018.91 ± 0.6194.5419.55 ± 0.4499.38
8075.75 ± 2.9894.6879.53 ± 0.3999.84
200198.50 ± 0.5599.25195.46 ± 0.4499.38
Publisher’s Note: MDPI stays neutral with regard to jurisdictional claims in published maps and institutional affiliations.

