
Characteristic Analysis of a Chipless RFID Sensor Based on Multi-Parameter Sensing and an Intelligent Detection Method


Abstract
:1. Introduction
2. Design of Chipless Sensor Based on Microstrip Coupling Resonance
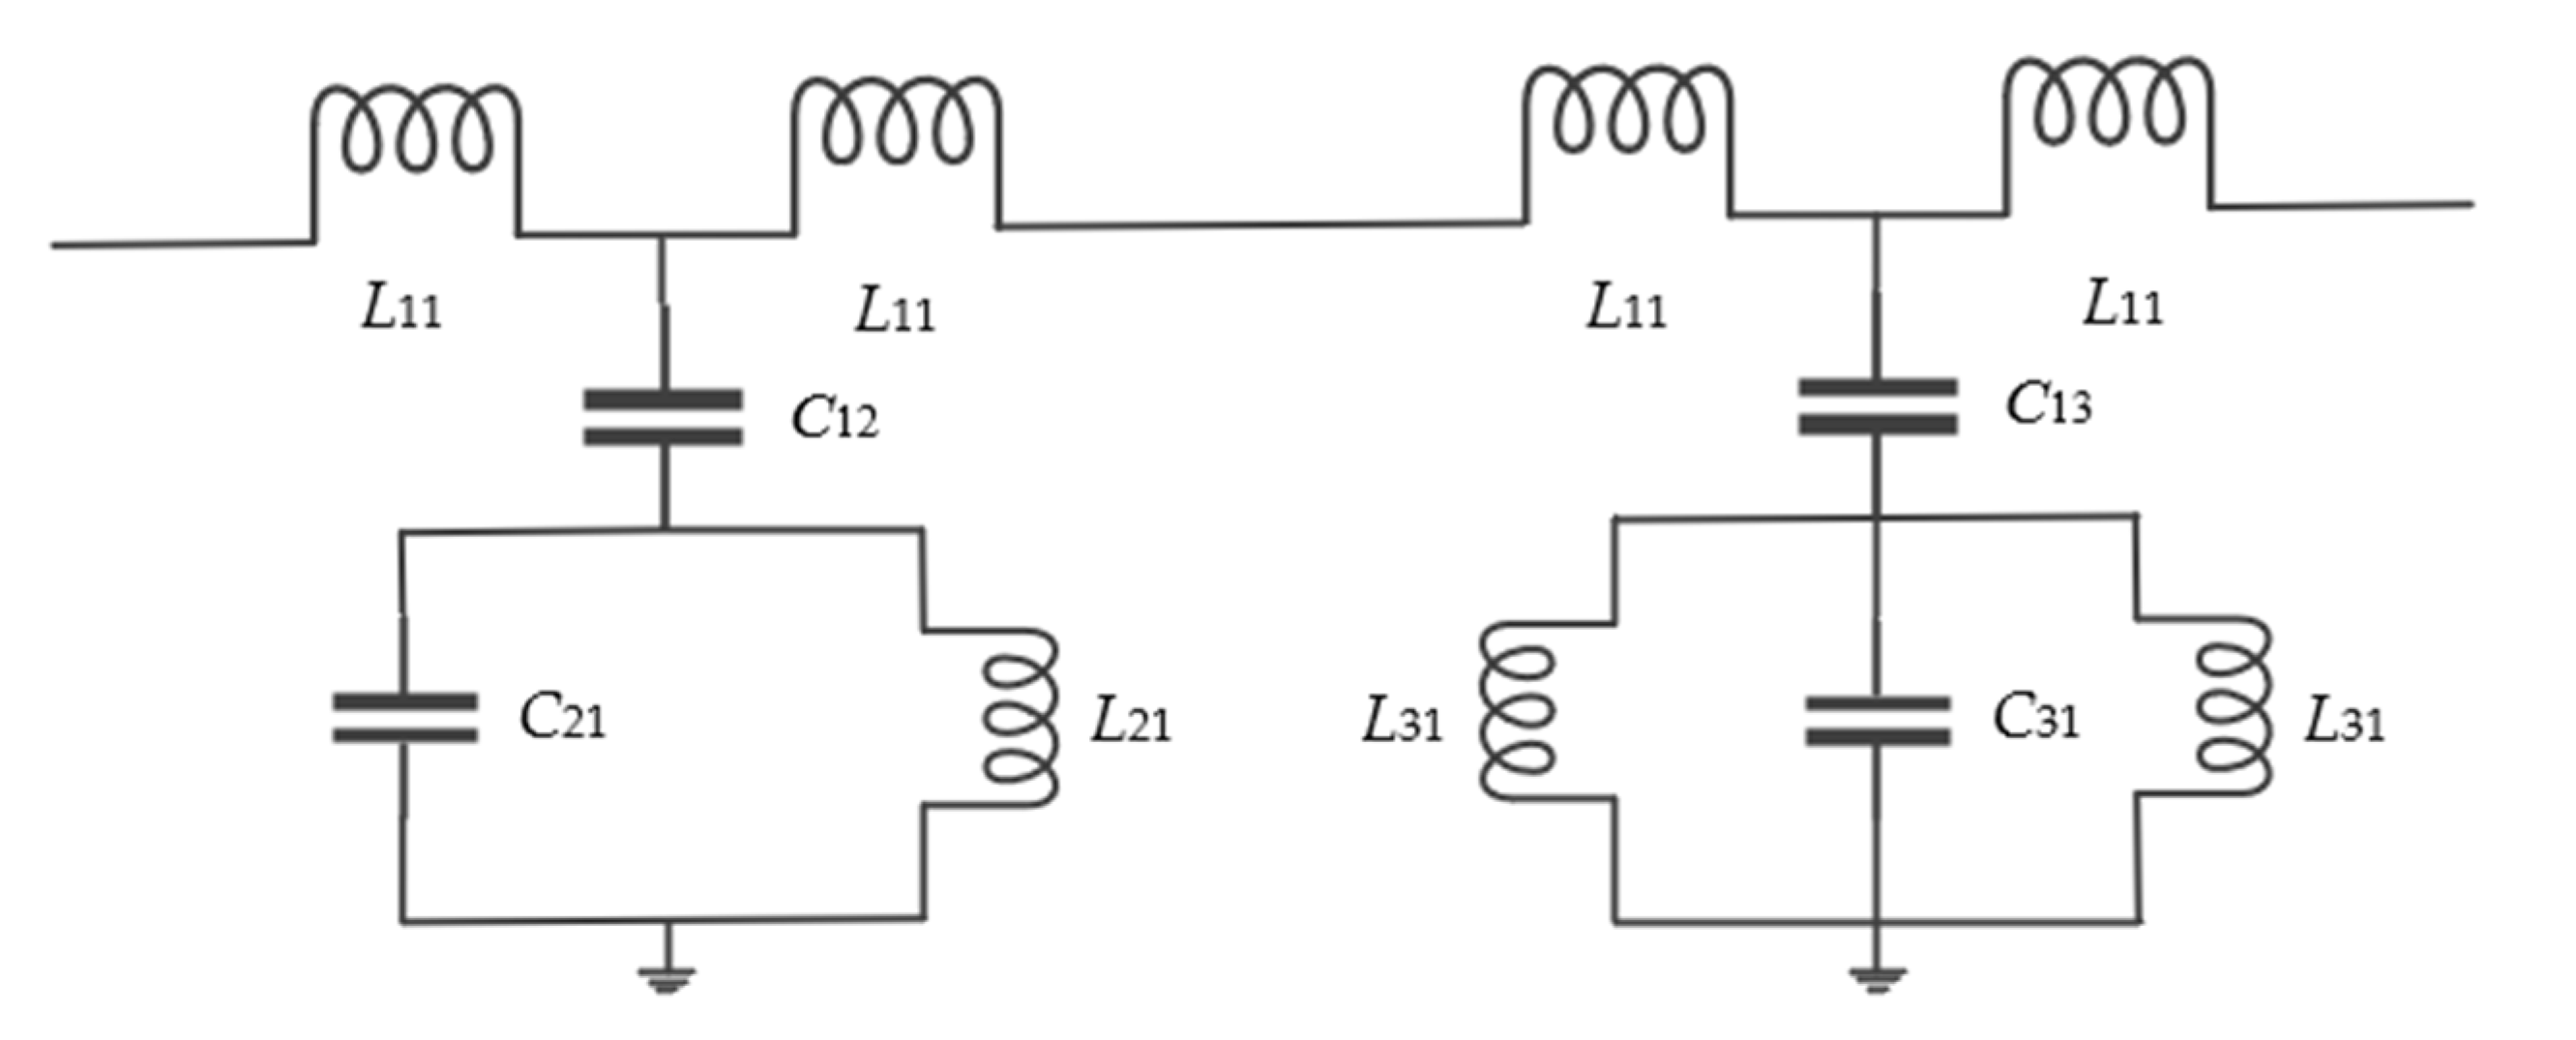
2.1. Theory of Designing Microstrip Resonators
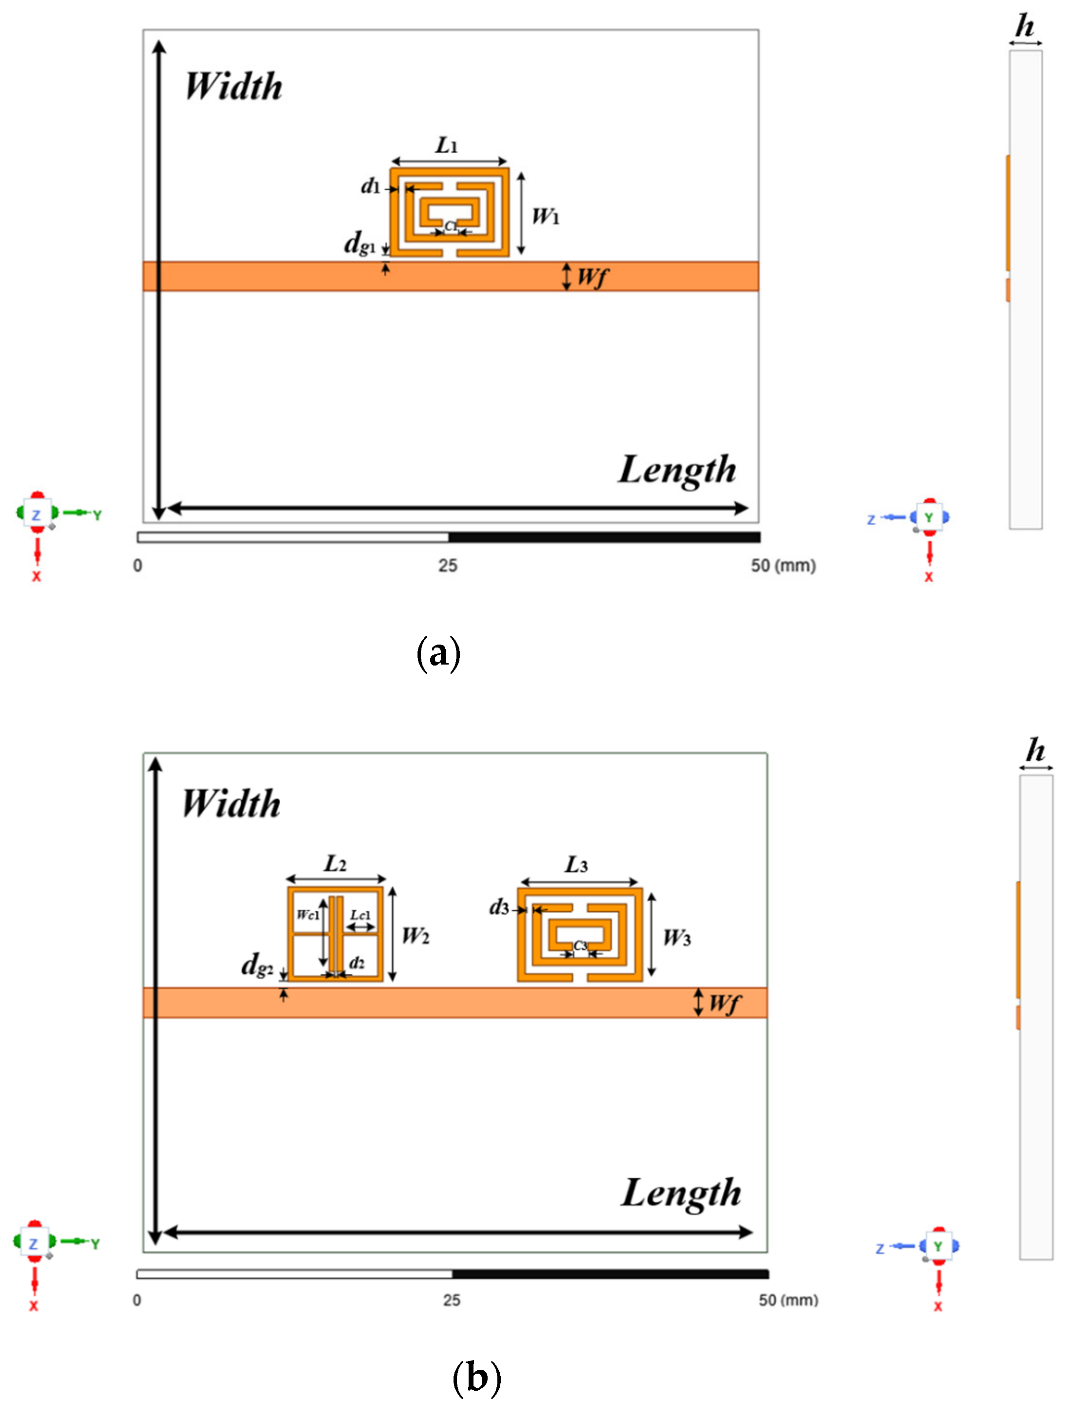
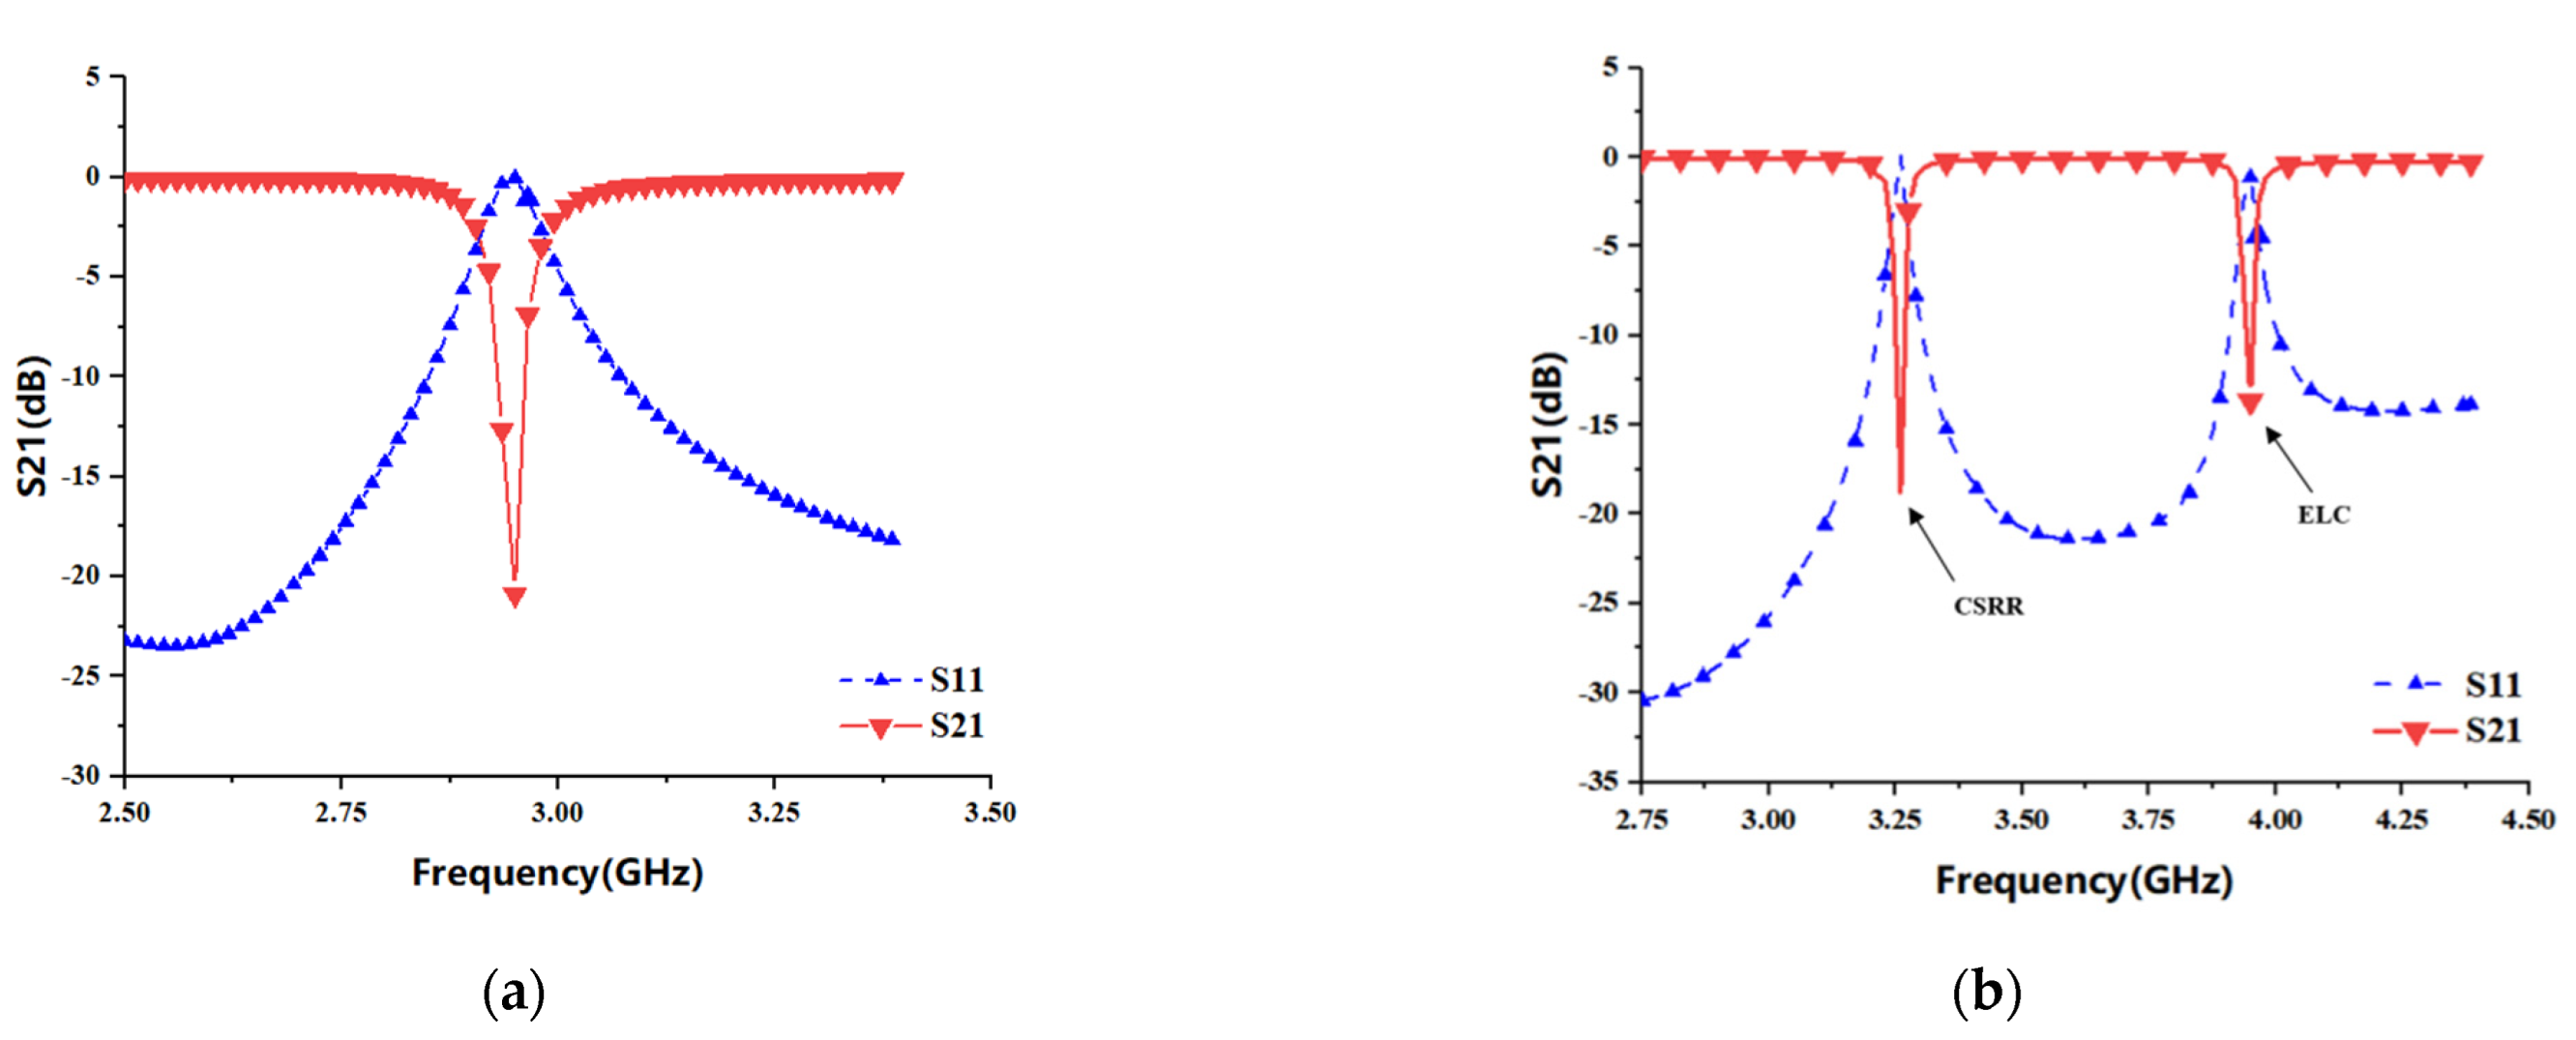
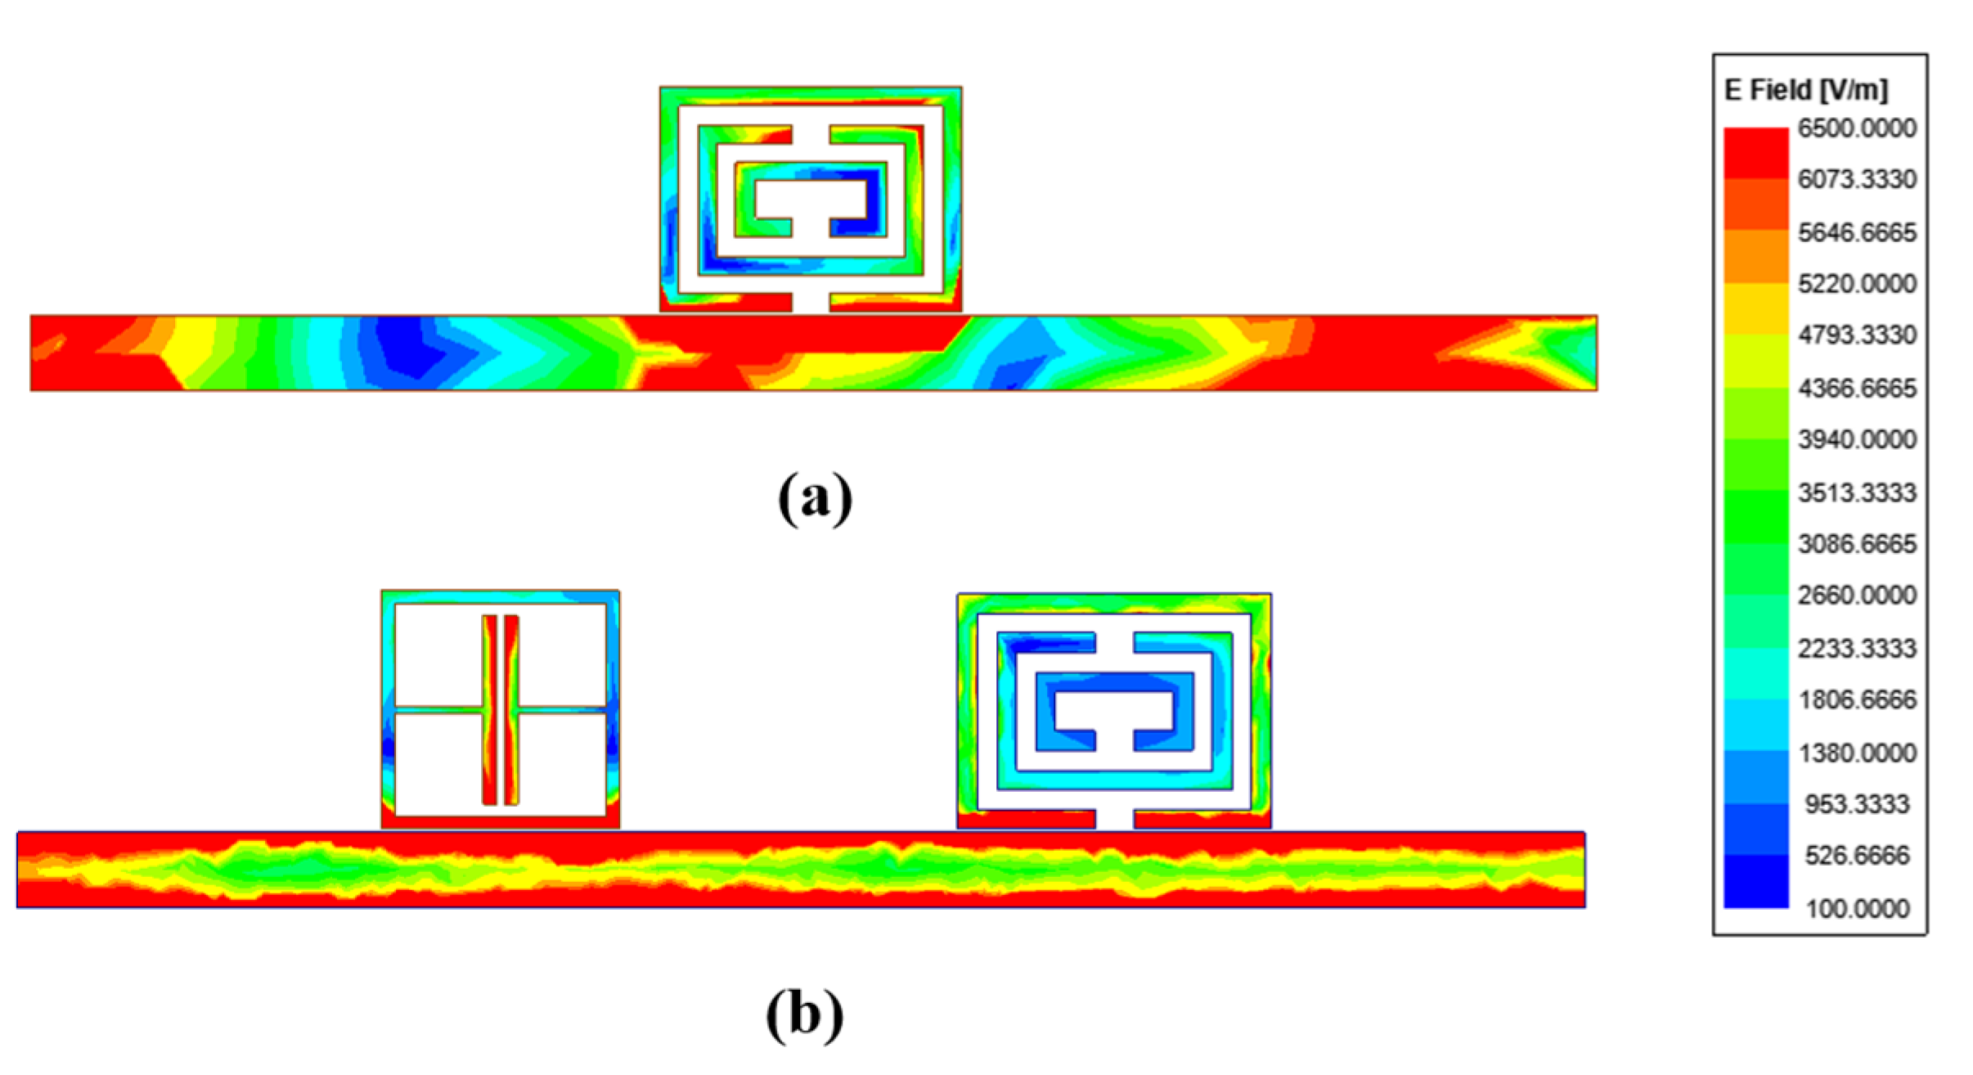
2.2. Design of CSRR and ELC Resonators Based on Microstrip Coupling
2.3. 6-Bit Chipless RFID Tag Design
3. Experimental Testing and Analysis of Sensor Behavior
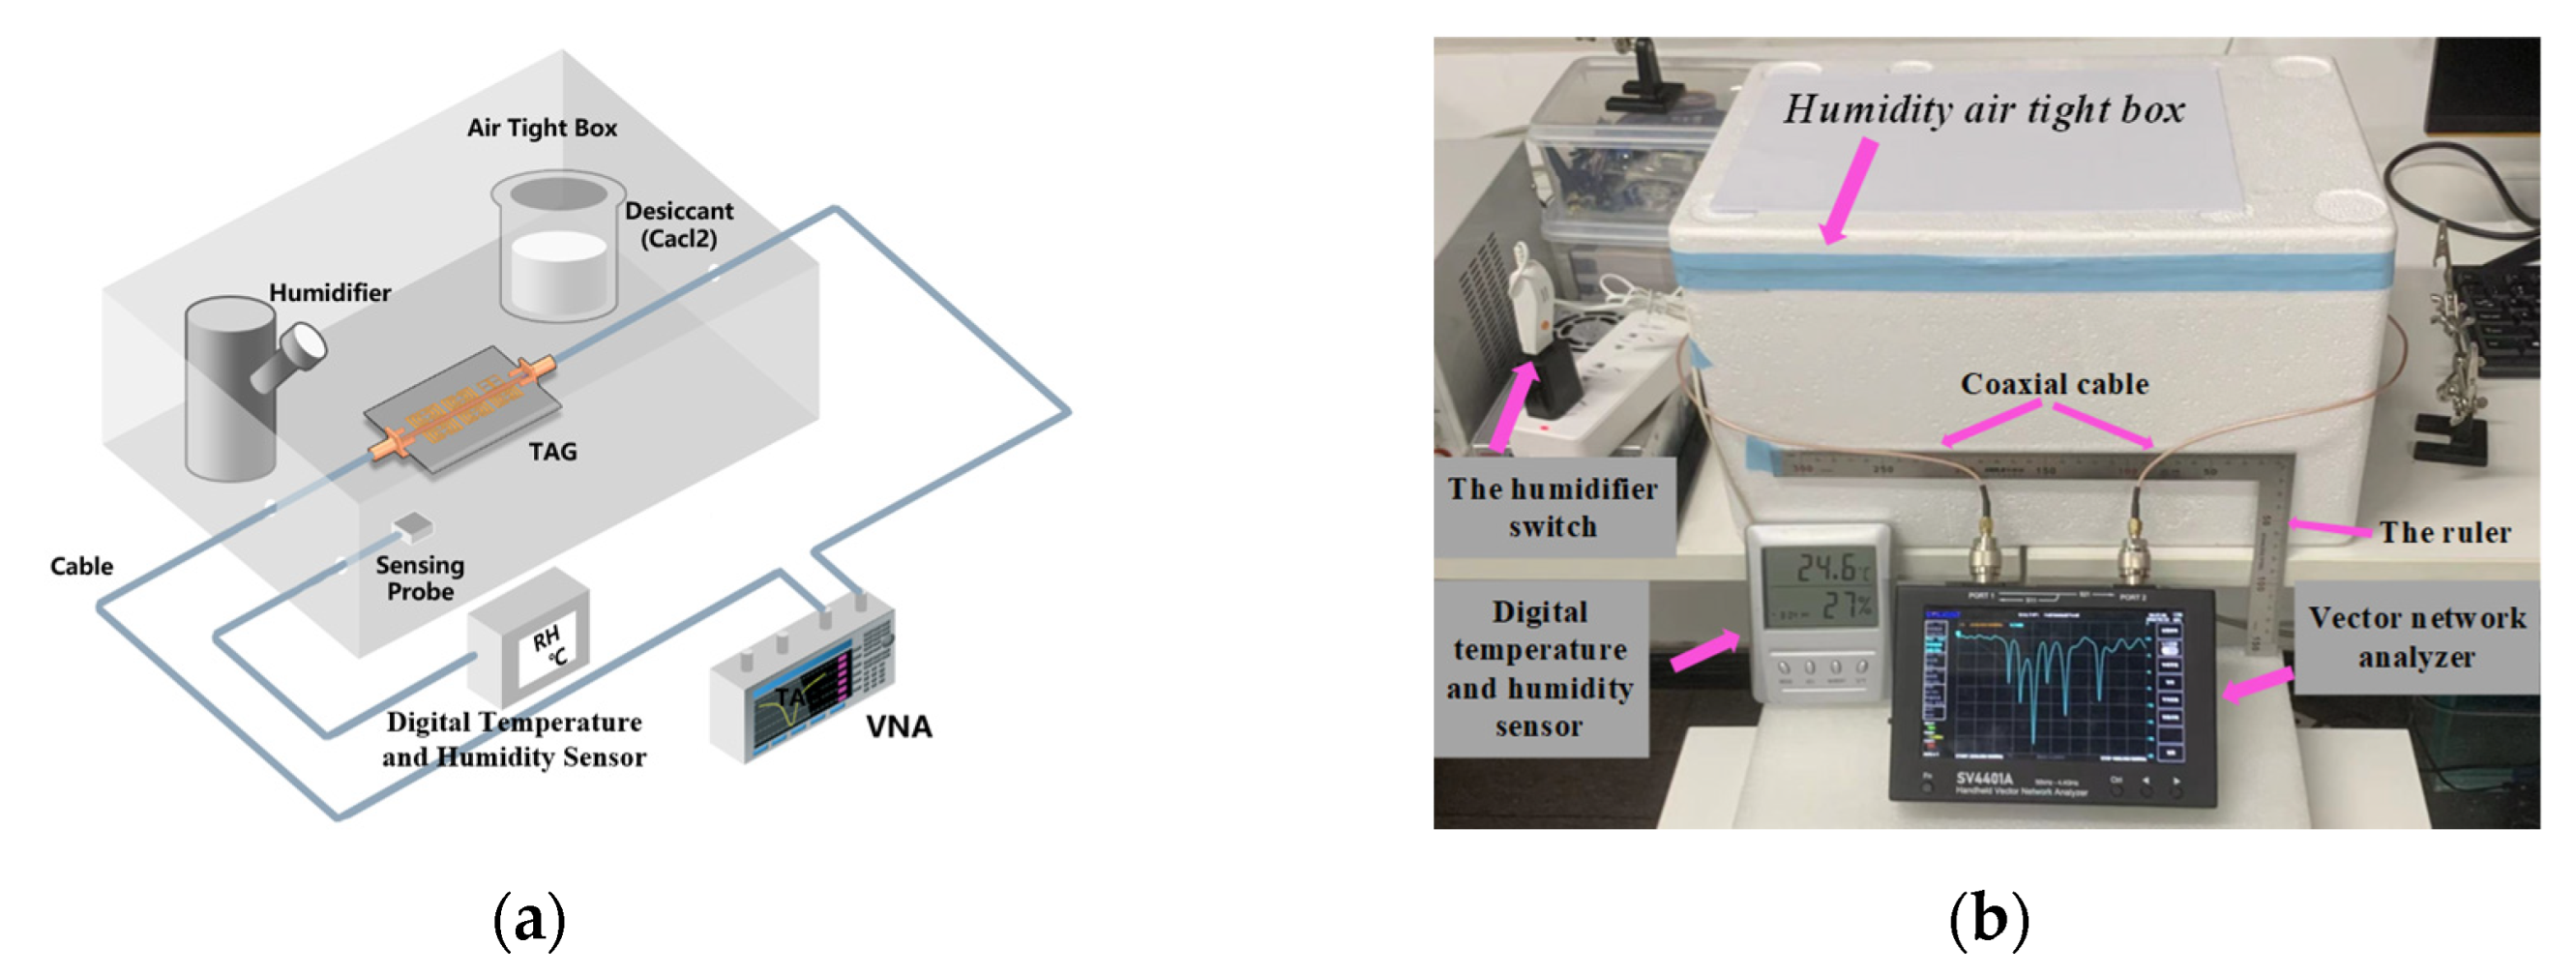
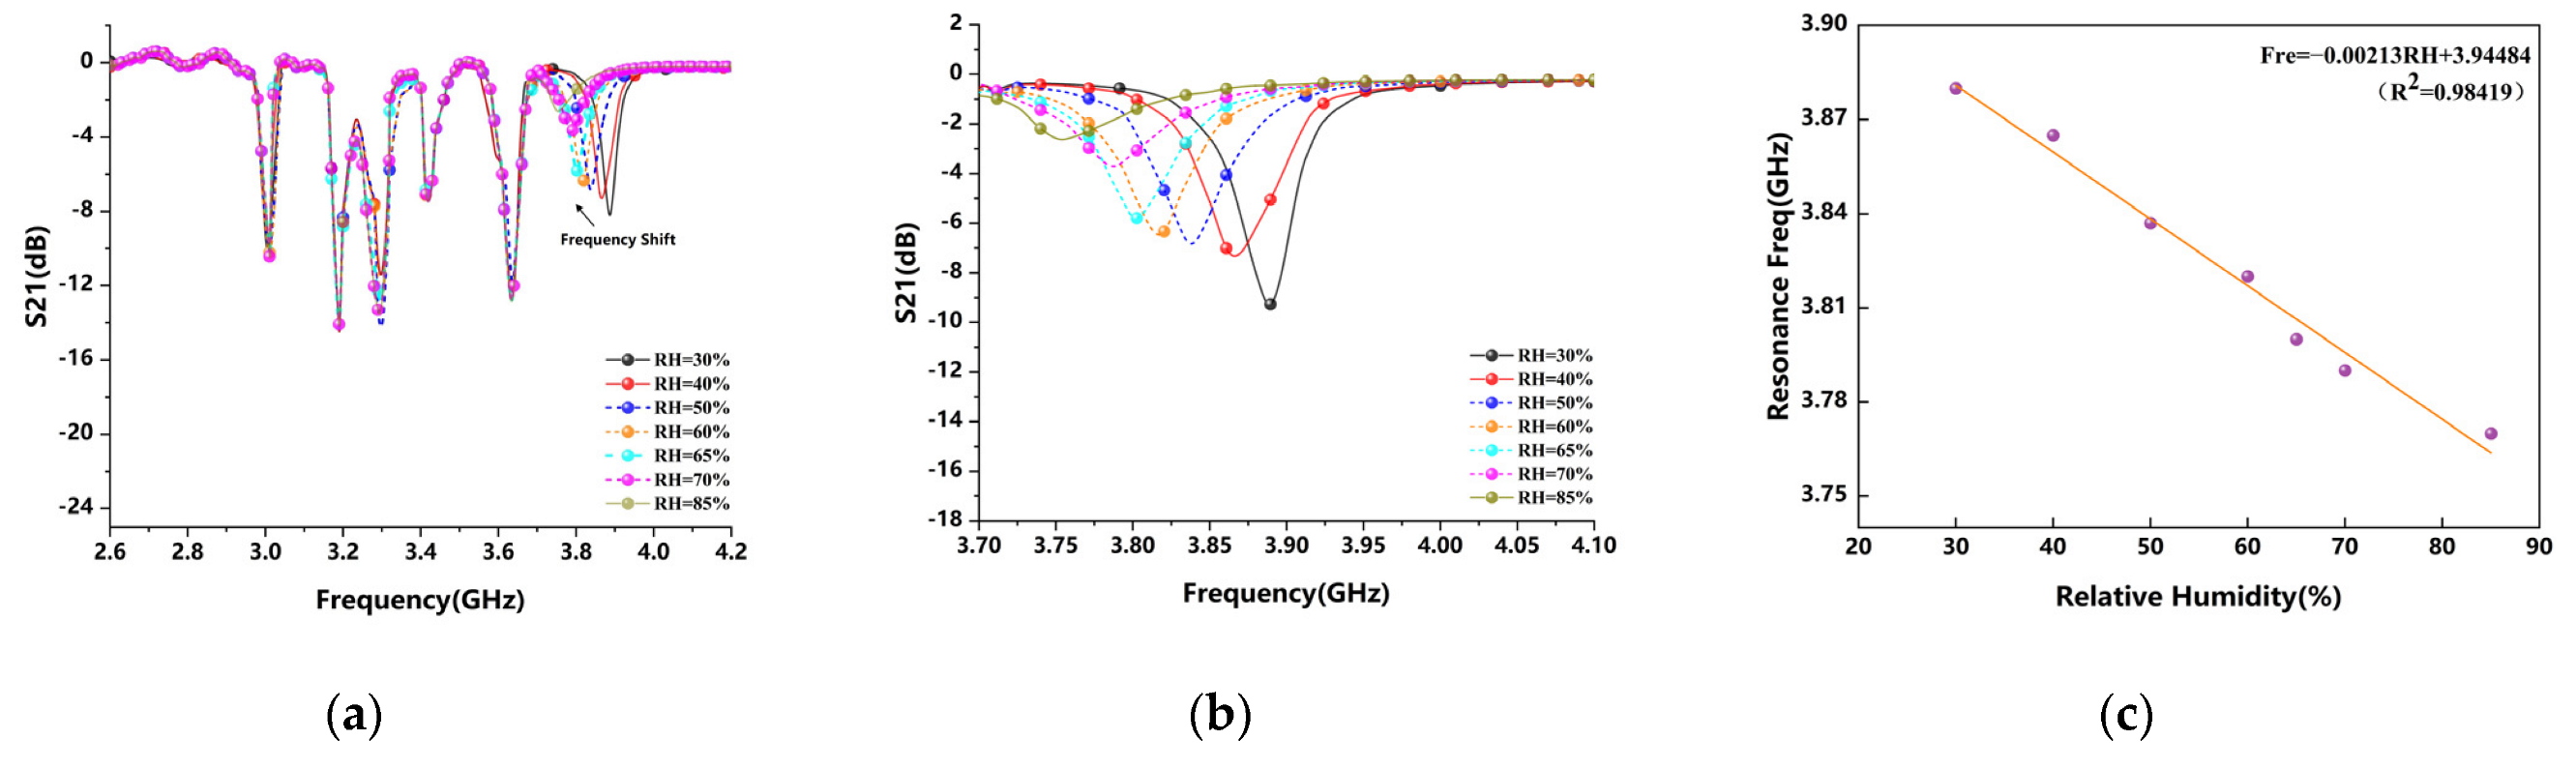
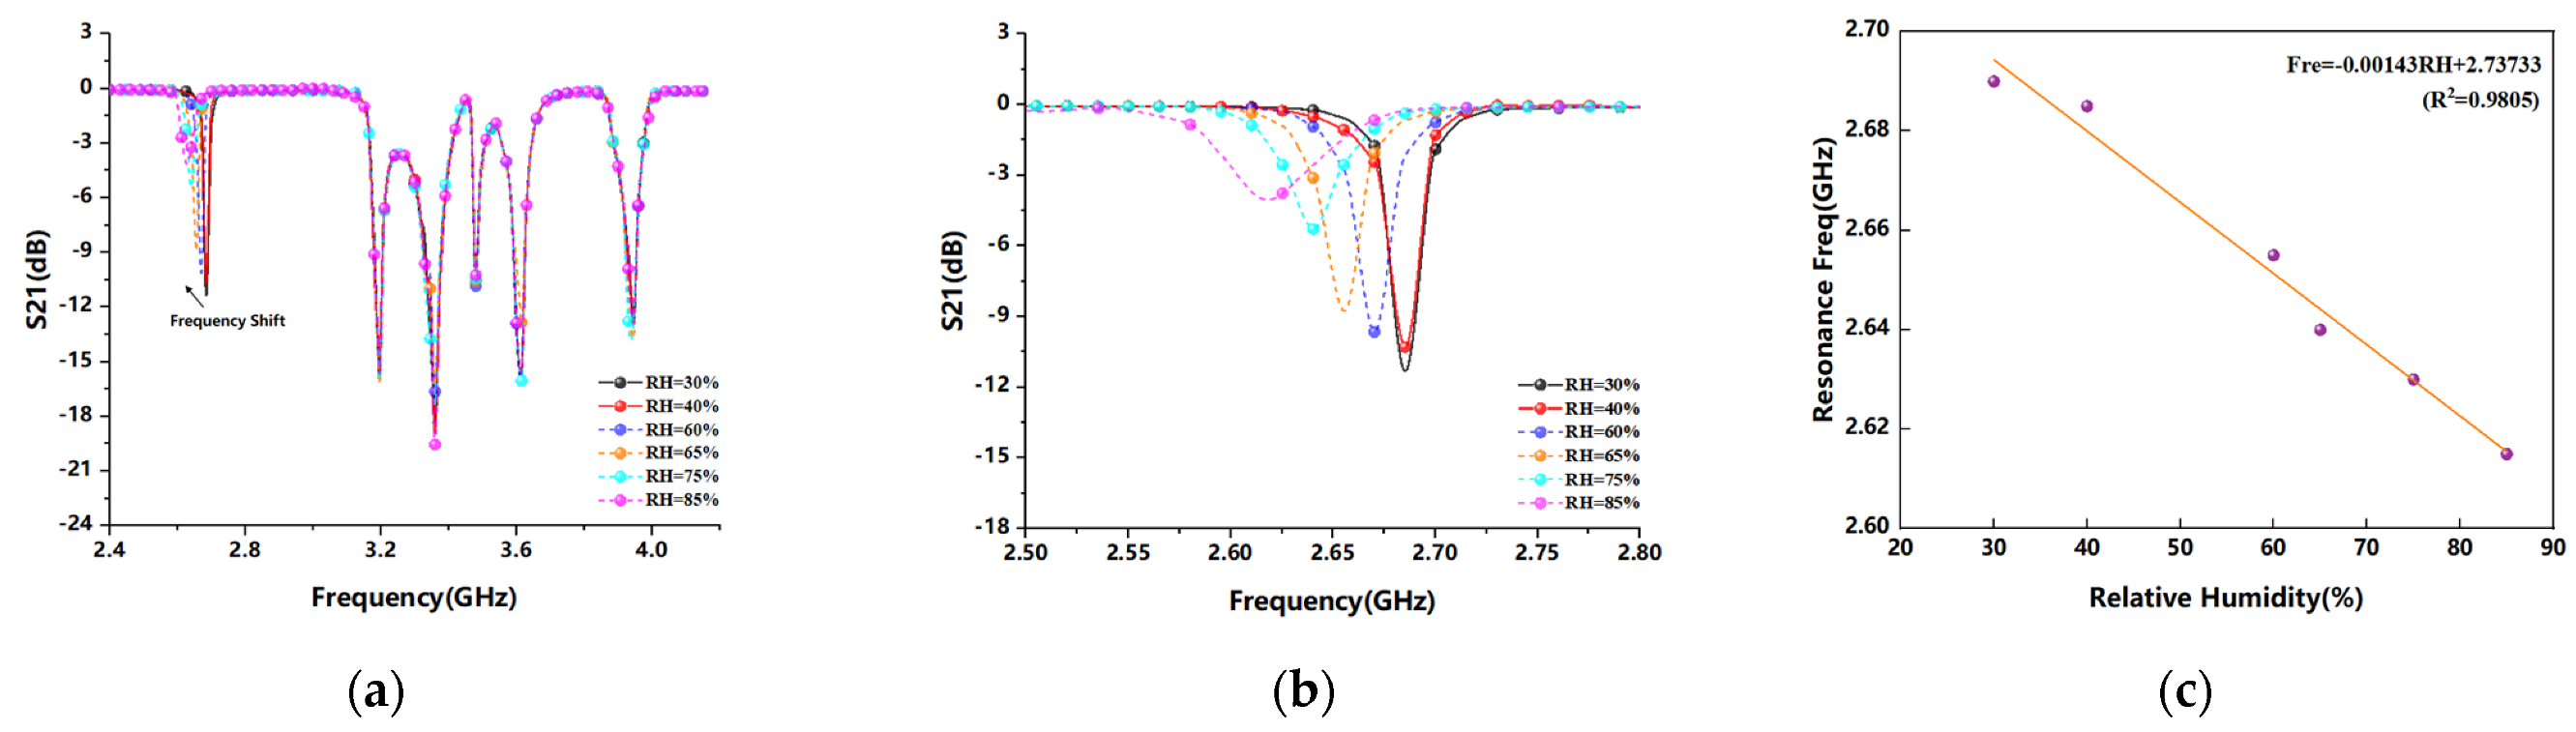
3.1. Relative Humidity Experiment
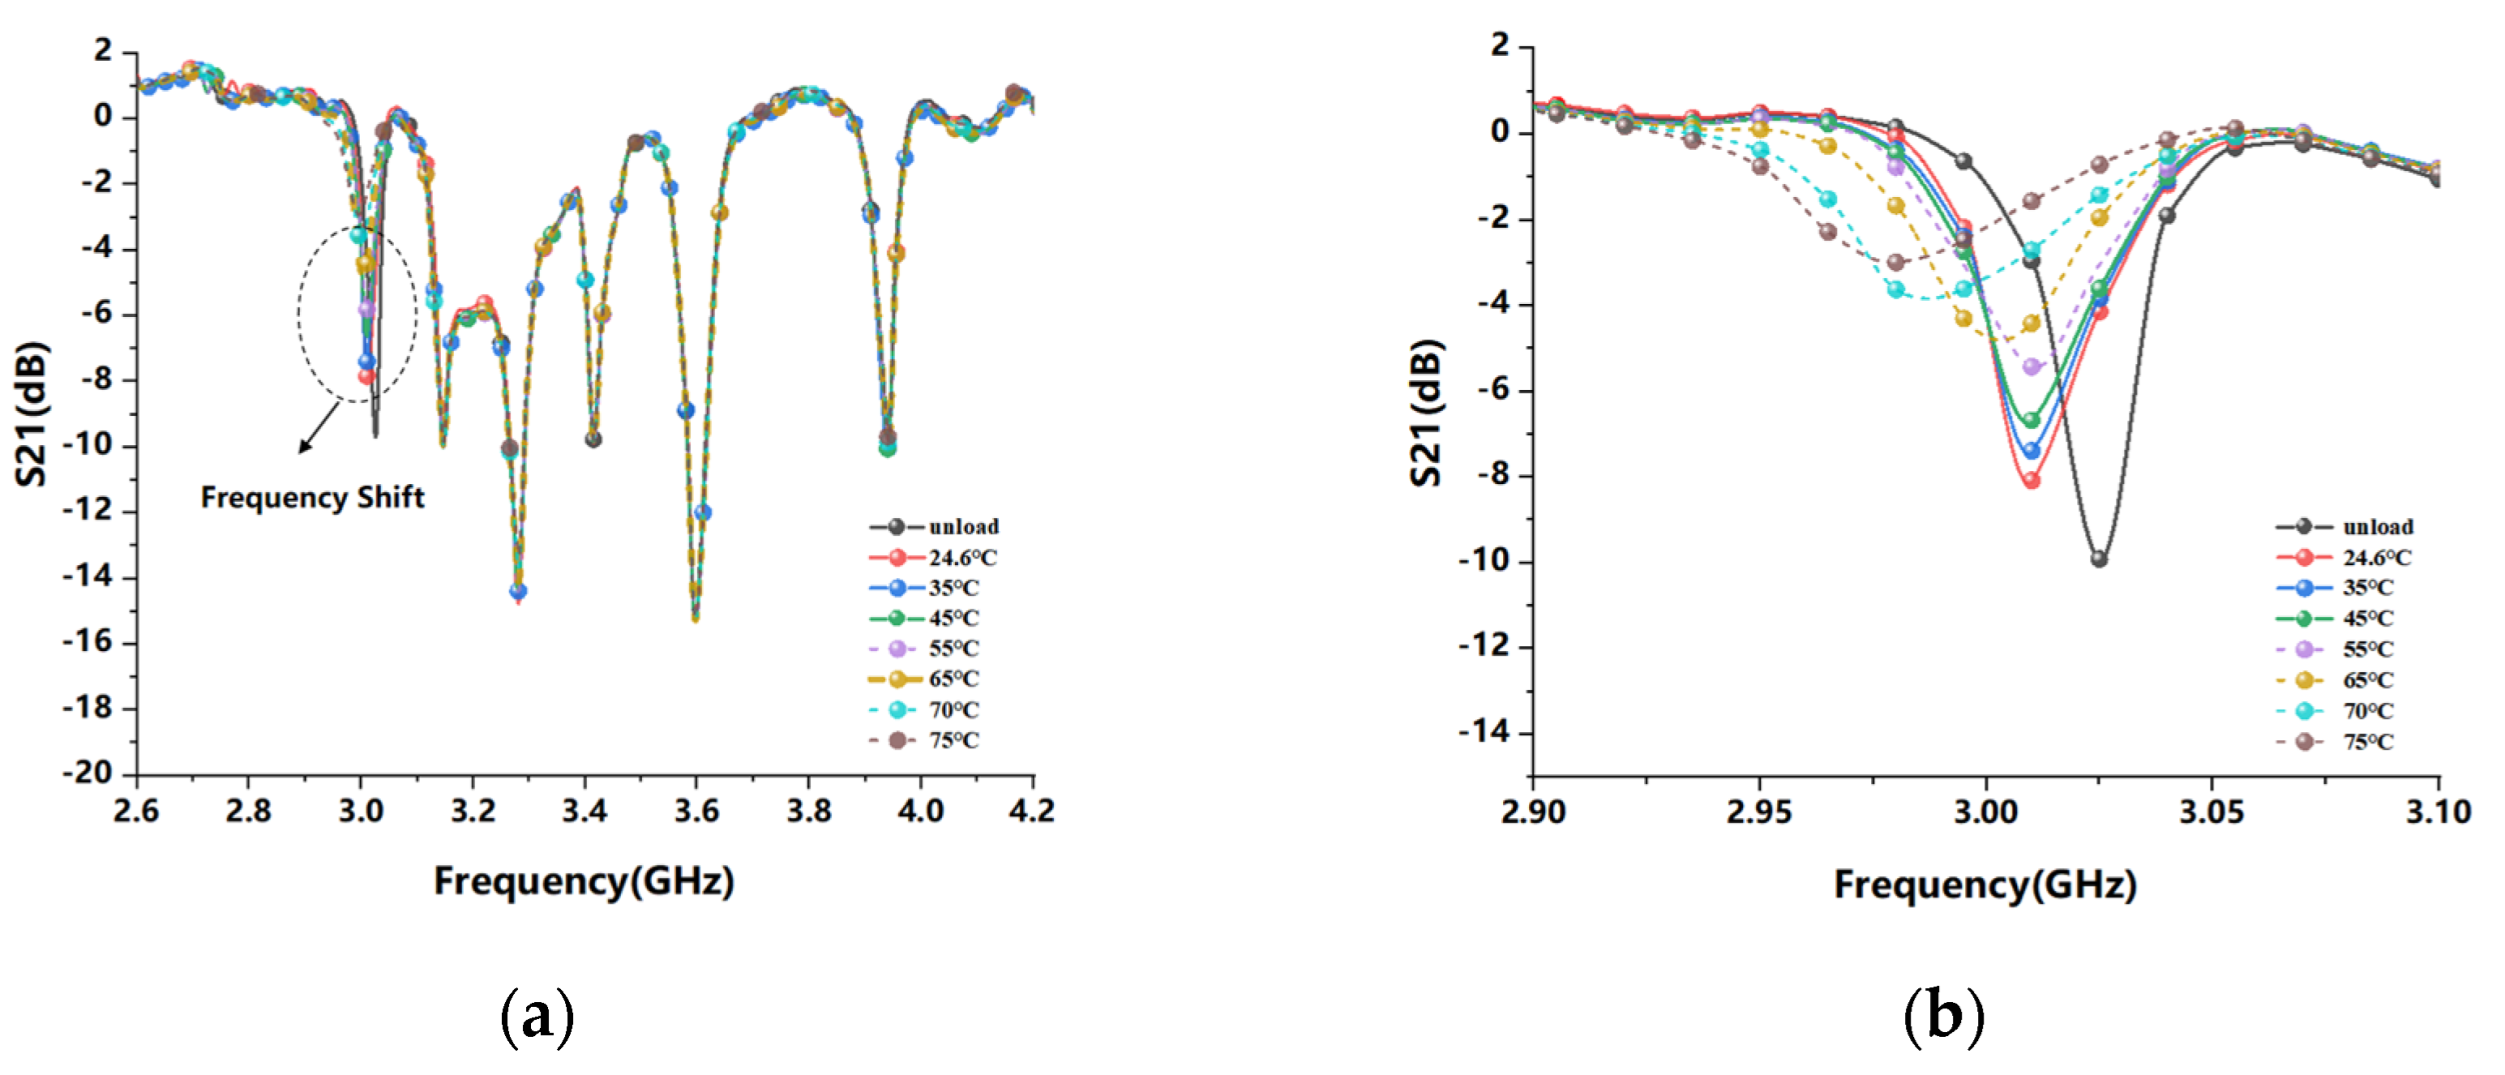
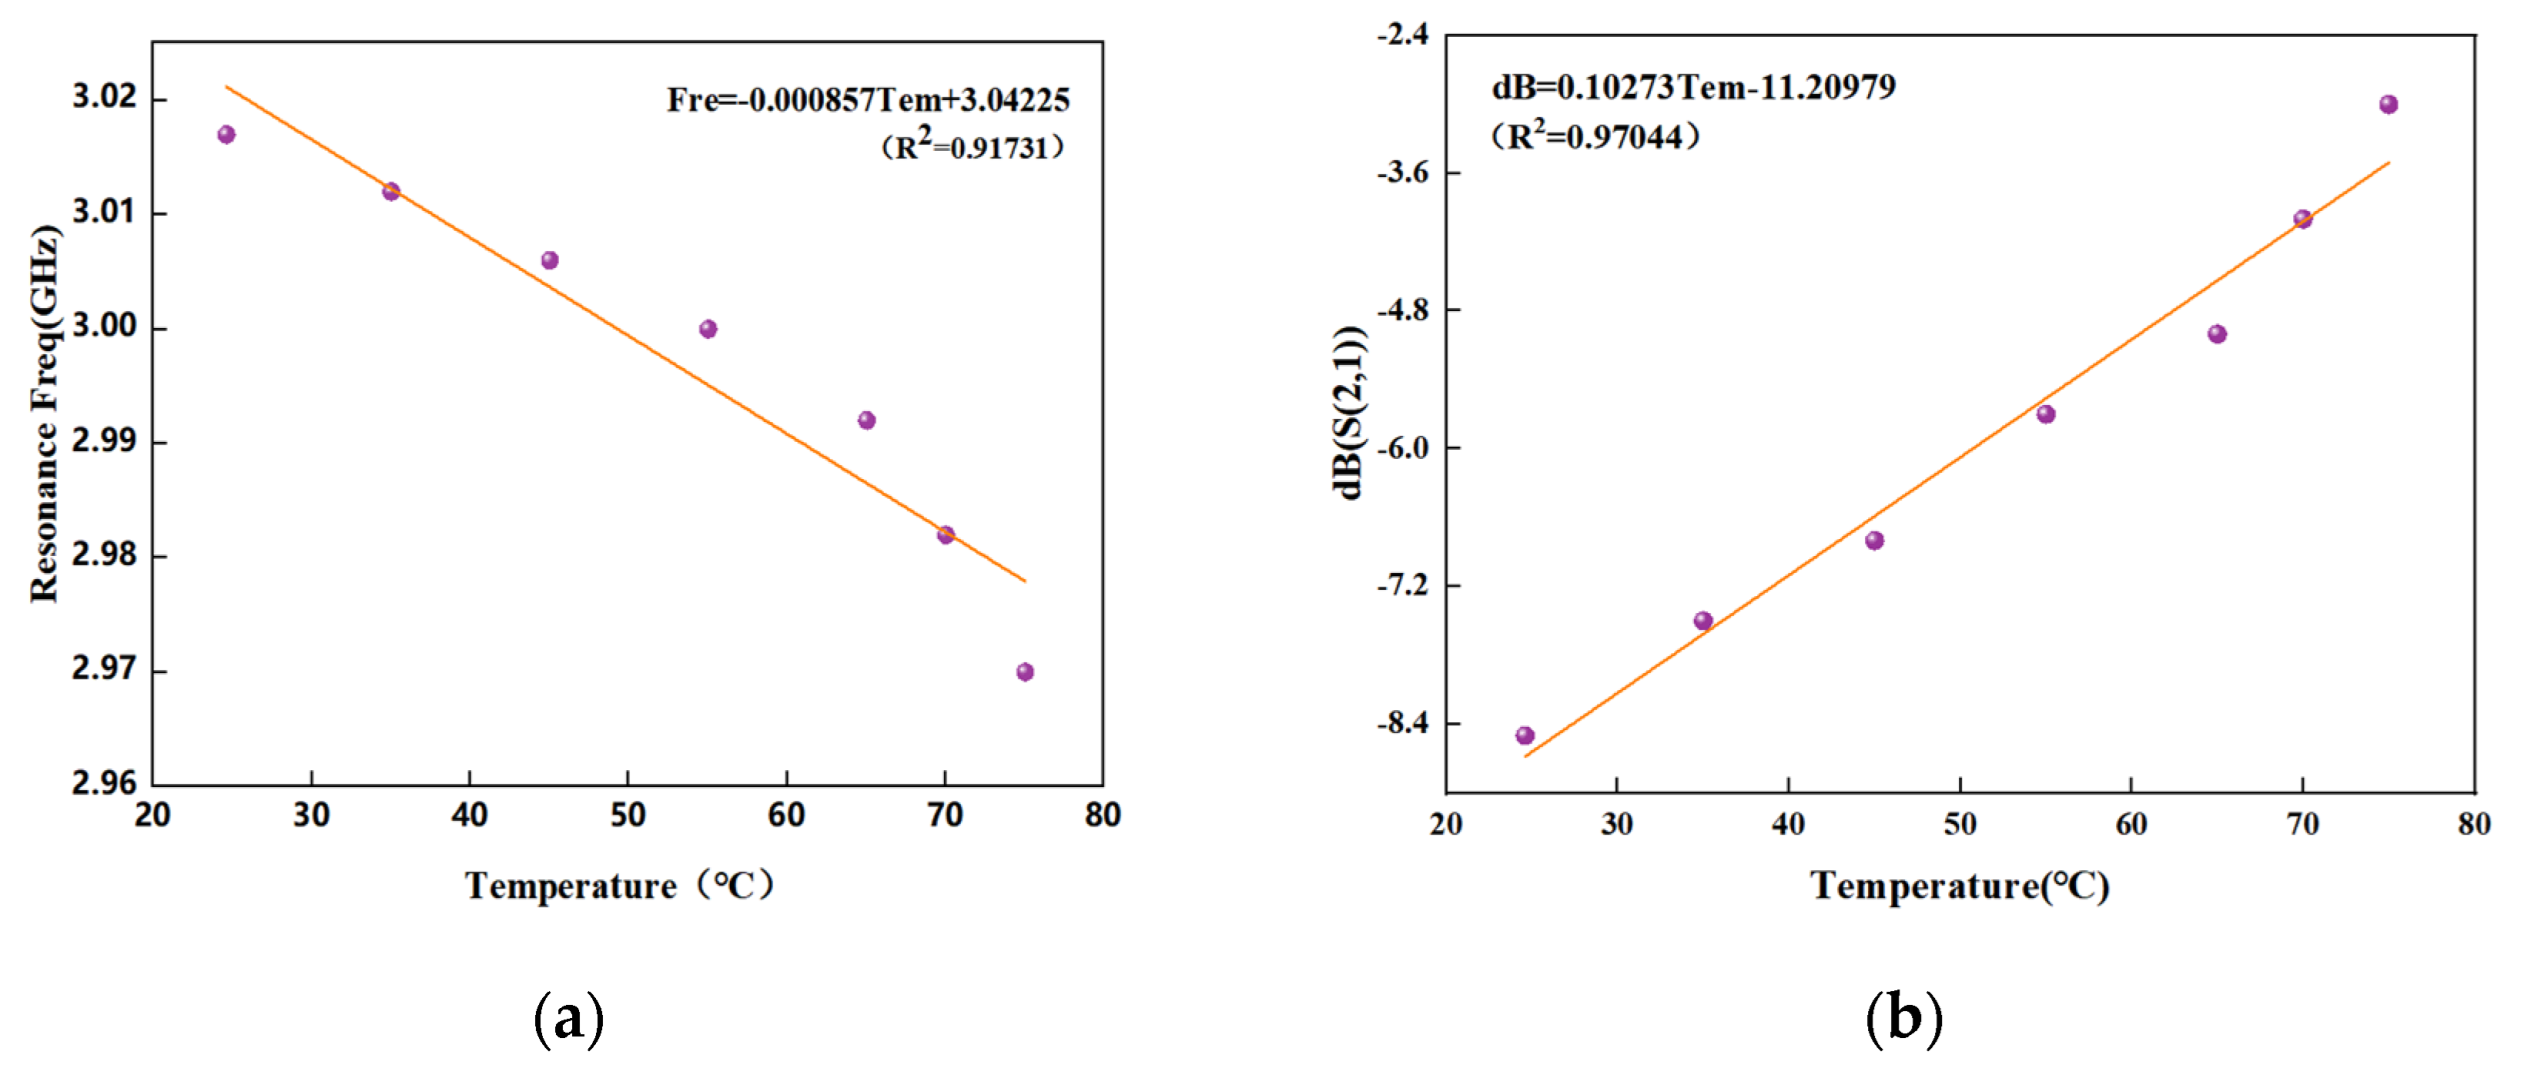
3.2. Temperature Experiment
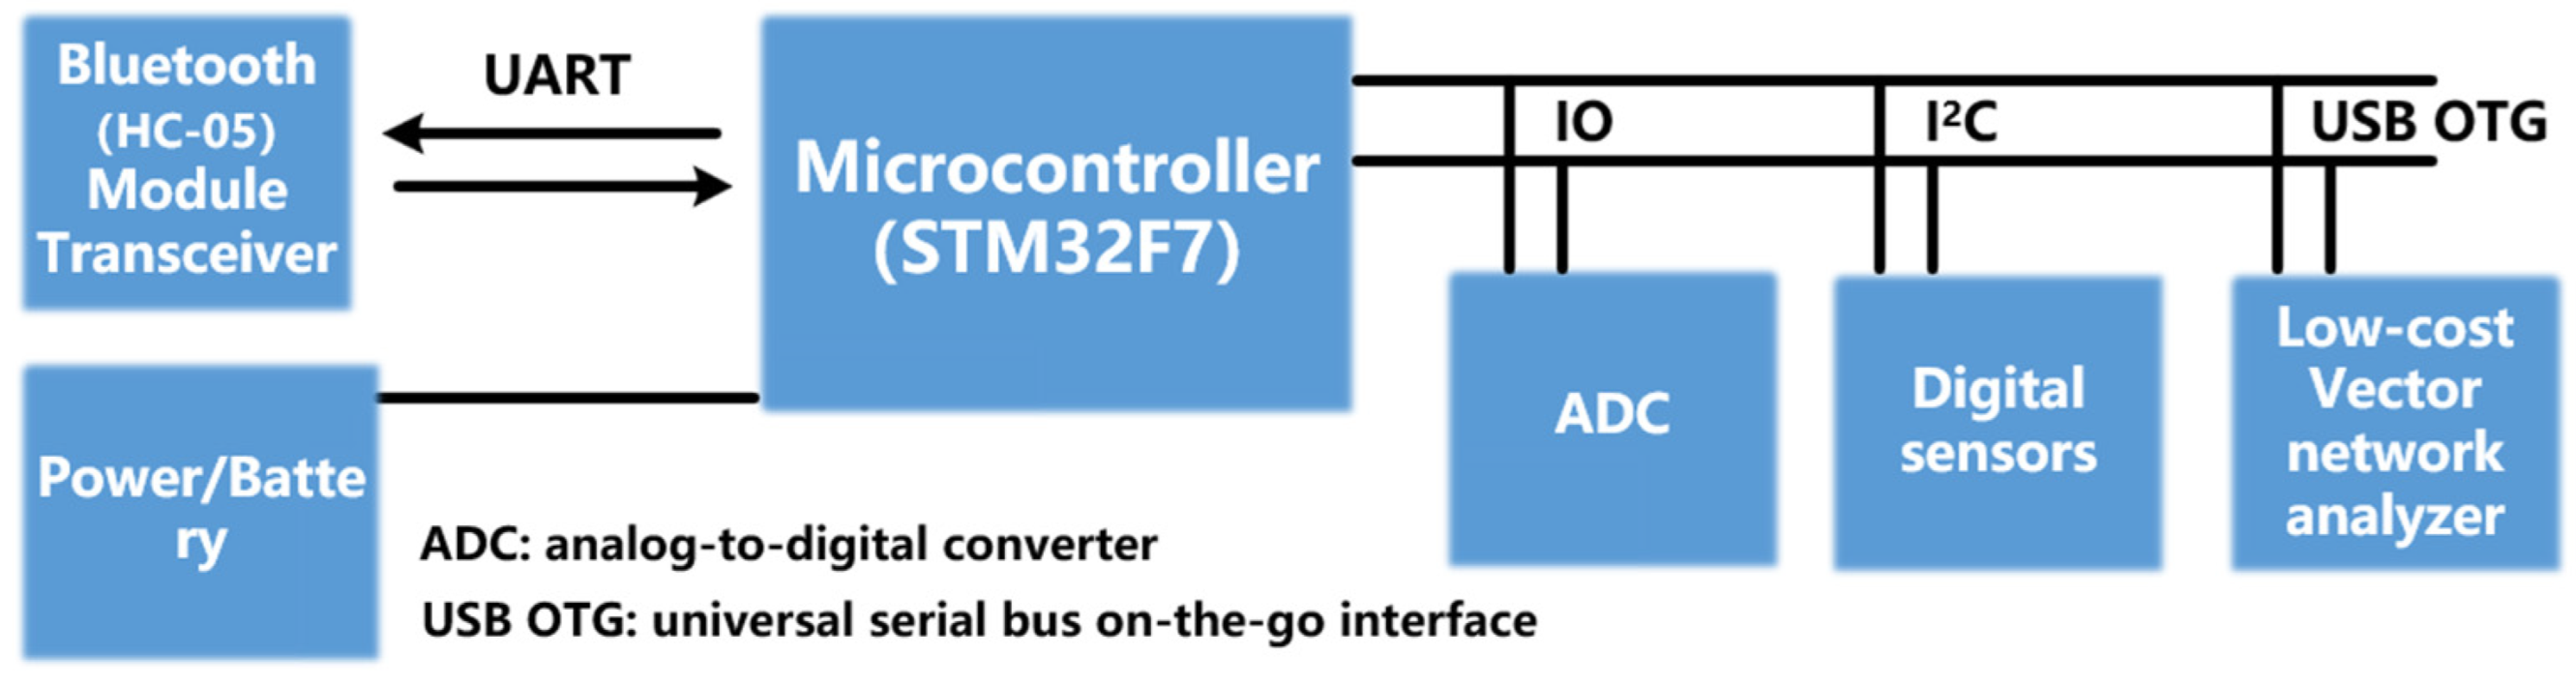
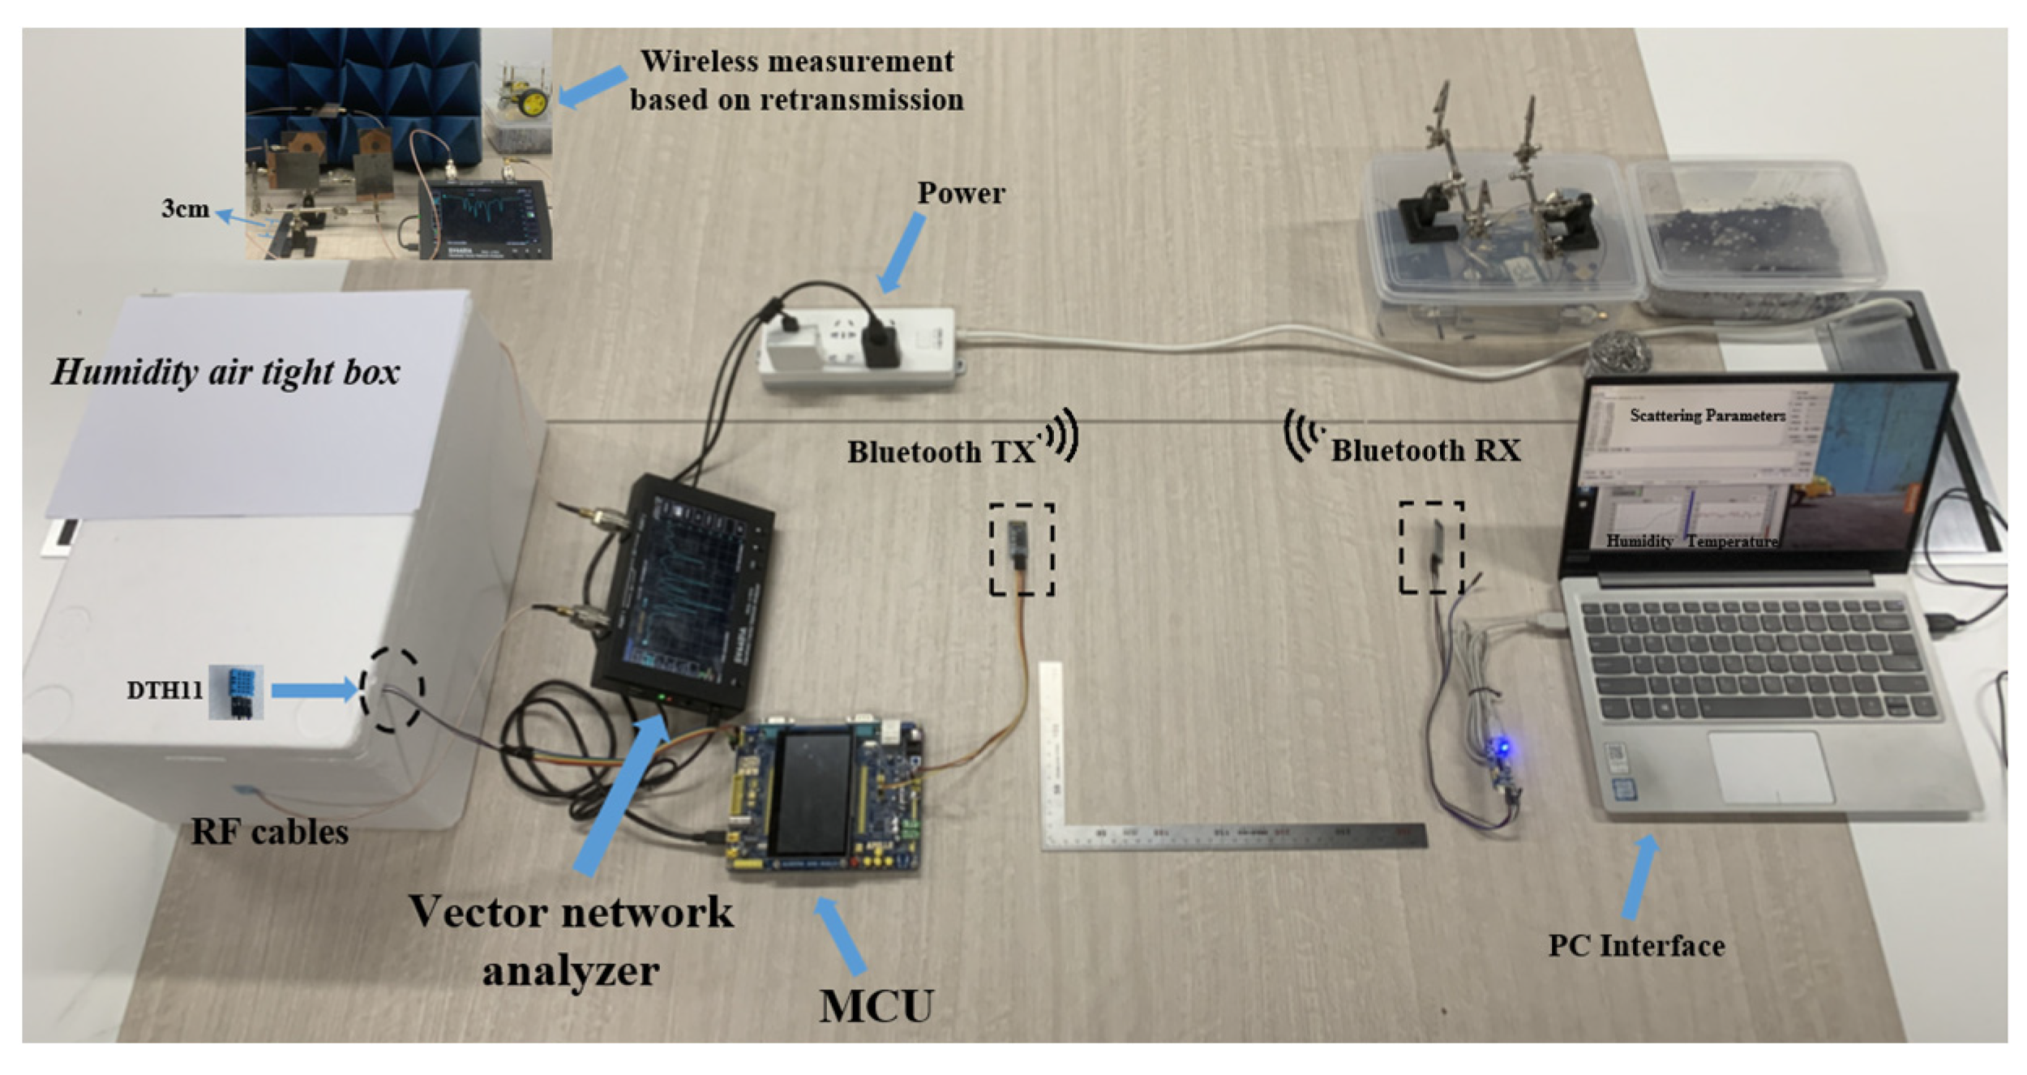
3.3. Real-Time Monitoring and Wireless Transmission of Sensing Data
4. Conclusions
Author Contributions
Funding
Informed Consent Statement
Acknowledgments
Conflicts of Interest
References
- Dey, S.; Bhattacharyya, R.; Sarma, S.E.; Karmakar, N.C. A Novel “Smart Skin” Sensor for Chipless RFID-Based Structural Health Monitoring Applications. IEEE Internet Things J. 2021, 8, 3955–3971. [Google Scholar] [CrossRef]
- Wan, G.C.; Li, M.M.; Yang, Y.L.; Xie, L.; Chen, L. Patch-Antenna-Based Structural Strain Measurement Using Optimized Energy Detection Algorithm Applied on USRP. IEEE Internet Things J. 2020, 8, 7476–7484. [Google Scholar] [CrossRef]
- Wan, G.; Li, M.; Zhang, M.; Kang, L.; Xie, L. A Novel Information Fusion Method of RFID Strain Sensor Based on Microstrip Notch Circuit. IEEE Trans. Instrum. Meas. 2022, 71, 1–10. [Google Scholar] [CrossRef]
- Yeo, J.; Lee, J.-I.; Kwon, Y. Humidity-Sensing Chipless RFID Tag with Enhanced Sensitivity Using an Interdigital Capacitor Structure. Sensors 2021, 21, 6550. [Google Scholar] [CrossRef] [PubMed]
- Tedjini, S.; Karmakar, N.; Perret, E.; Vena, A.; Koswatta, R.; Rubayet, E. Hold the Chips: Chipless Technology, an Alternative Technique for RFID. IEEE Microw. Mag. 2013, 14, 56–65. [Google Scholar] [CrossRef]
- Sharif, A.; Ouyang, J.; Yang, F.; Chattha, H.T.; Imran, M.A.; Alomainy, A.; Abbasi, Q.H. Low-Cost Inkjet-Printed UHF RFID Tag-Based System for Internet of Things Applications Using Characteristic Modes. IEEE Internet Things J. 2019, 6, 3962–3975. [Google Scholar] [CrossRef]
- Davaji, B.; Cho, H.D.; Malakoutian, M.; Lee, J.-K.; Panin, G.; Kang, T.W.; Lee, C.H. A patterned single layer graphene resistance temperature sensor. Sci. Rep. 2017, 7, 8811. [Google Scholar] [CrossRef]
- Amin, E.M.; Bhuiyan, S.M.; Karmakar, N.C.; Winther-Jensen, B. Development of a Low Cost Printable Chipless RFID Humidity Sensor. IEEE Sens. J. 2013, 14, 140–149. [Google Scholar] [CrossRef]
- Virtanen, J.; Ukkonen, L.; Bjorninen, T.; Elsherbeni, A.Z.; Sydänheimo, L. Inkjet-Printed Humidity Sensor for Passive UHF RFID Systems. IEEE Trans. Instrum. Meas. 2011, 60, 2768–2777. [Google Scholar] [CrossRef]
- Borgese, M.; Dicandia, F.A.; Costa, F.; Genovesi, S.; Manara, G. Exploitation of chipless RFID technology for humidity monitoring. In Proceedings of the 32nd General Assembly and Scientific Symposium of the International Union of Radio Science (URSI GASS), Montreal, QC, Canada, 19–26 August 2017; pp. 1–4. [Google Scholar] [CrossRef]
- Javed, N.; Azam, M.A.; Qazi, I.; Amin, Y.; Tenhunen, H. A novel multi-parameter chipless RFID sensor for green networks. AEU-Int. J. Electron. Commun. 2020, 128, 153512. [Google Scholar] [CrossRef]
- Marchi, G.; Mulloni, V.; Ali, O.H.; Lorenzelli, L.; Donelli, M. Improving the Sensitivity of Chipless RFID Sensors: The Case of a Low-Humidity Sensor. Electronics 2021, 10, 2861. [Google Scholar] [CrossRef]
- Fathi, P.; Bhattacharya, S.; Karmakar, N.C. Dual-Polarized Keratin-Based UWB Chipless RFID Relative Humidity Sensor. IEEE Sens. J. 2022, 22, 1924–1932. [Google Scholar] [CrossRef]
- Bergo, P.V.A.; Moraes, I.; Sobral, P.J.D.A. Effects of Different Moisture Contents on Physical Properties of PVA-Gelatin Films. Food Biophys. 2012, 7, 354–361. [Google Scholar] [CrossRef]
- Ozek, E.A.; Tanyeli, S.; Yapici, M.K. Flexible Graphene Textile Temperature Sensing RFID Coils Based on Spray Printing. IEEE Sens. J. 2021, 21, 26382–26388. [Google Scholar] [CrossRef]
- Amin, E.M.; Karmakar, N.C.; Jensen, B.W. Fully printable chipless RFID multi-parameter sensor. Sens. Actuators A Phys. 2016, 248, 223–232. [Google Scholar] [CrossRef]
- Pendry, J.B.; Holden, A.J.; Robbins, D.J.; Stewart, W.J. Magnetism from conductors and enhanced nonlinear phenomena. IEEE Trans. Microw. Theory Tech. 1999, 47, 2075–2084. [Google Scholar] [CrossRef]
- Pan, K.; Teng, L.; Ting, L.; Zhou, X.; Stokes, A.A.; Hu, Z. Soft Wireless Battery-Free UHF RFID Stretchable Sensor Based on Microfluidic Technology. IEEE J. Radio Freq. Identif. 2019, 3, 252–258. [Google Scholar] [CrossRef]
- Kou, H.; Tan, Q.; Wang, Y.; Zhang, G.; Su, S.; Xiong, J. A wireless slot-antenna integrated temperature-pressure-humidity sensor loaded with CSRR for harsh-environment applications. Sens. Actuators B Chem. 2020, 311, 127907. [Google Scholar] [CrossRef]
- Romero, R.; Feitoza, R.; Rambo, C.; Sousa, F. A low-cost passive wireless capacitive sensing tag based on split-ring resonator. In Proceedings of the EEE International Instrumentation and Measurement Technology Conference (I2MTC), Pisa, Italy, 11–14 May 2015; pp. 434–439. [Google Scholar] [CrossRef]
- Wan, G.; Kang, W.; Wang, C.; Li, W.; Li, M.; Xie, L.; Chen, L. Separating strain sensor based on dual-resonant circular patch antenna with chipless RFID tag. Smart Mater. Struct. 2021, 30, 15007. [Google Scholar] [CrossRef]
- Wan, G.; Zhang, M.; Li, W.; Chen, L. A Novel Detection Method Based on Maximum-Likelihood Estimation Decoding of a 6-Bit Chipless Radio Frequency Identification Coded Tag. IEEE Trans. Instrum. Meas. 2020, 70, 1–10. [Google Scholar] [CrossRef]
- Jilani, M.T.; Rehman, M.Z.U.; Khan, A.M.; Chughtai, O.; Abbas, M.A.; Khan, M.T. An implementation of IoT-based microwave sensing system for the evaluation of tissues moisture. Microelectron. J. 2019, 88, 117–127. [Google Scholar] [CrossRef]
- Athauda, T.; Karmakar, N.C. The Realization of Chipless RFID Resonator for Multiple Physical Parameter Sensing. IEEE Internet Things J. 2019, 6, 5387–5396. [Google Scholar] [CrossRef]
- Schurig, D.; Mock, J.J.; Smith, D.R. Electric-field-coupled resonators for negative permittivity metamaterials. Appl. Phys. Lett. 2006, 88, 41109. [Google Scholar] [CrossRef]
- Bilotti, F.; Toscano, A.; Vegni, L. Design of Spiral and Multiple Split-Ring Resonators for the Realization of Miniaturized Metamaterial Samples. IEEE Trans. Antennas Propag. 2007, 55, 2258–2267. [Google Scholar] [CrossRef]
- Ma, Z.-H.; Yang, J.-H.; Chen, C.-C.; Yang, C.-F. A re-transmitted chipless tag using CSRR coupled structure. Microsyst. Technol. 2018, 24, 4373–4382. [Google Scholar] [CrossRef]
- Amin, E.M.; Karmakar, N.C.; Winther-Jensen, B. Polyvinyl-Alcohol (PVA)-Based rf humidity sensor in microwave frequency. Prog. Electromagn. Res. 2013, 54, 149–166. [Google Scholar] [CrossRef]
- Marchi, G.; Mulloni, V.; Manekiya, M.; Donelli, M.; Lorenzelli, L. A Preliminary Microwave Frequency Characterization of a Nafion-Based Chipless Sensor for Humidity Monitoring. In Proceedings of the IEEE Sensors, Rotterdam, The Netherlands, 25–28 October 2020; pp. 1–4. [Google Scholar] [CrossRef]
- Kandhol, G.; Wadhwa, H.; Chand, S.; Mahendia, S.; Kumar, S. Study of dielectric relaxation behavior of composites of Poly (vinyl alchohol) (PVA) and Reduced graphene oxide (RGO). Vacuum 2019, 160, 384–393. [Google Scholar] [CrossRef]
- Vena, A.; Sydanheimo, L.; Tentzeris, M.M.; Ukkonen, L. A Fully Inkjet-Printed Wireless and Chipless Sensor for CO2 and Temperature Detection. IEEE Sens. J. 2015, 15, 89–99. [Google Scholar] [CrossRef]
- Javed, N.; Azam, M.A.; Amin, Y. Chipless RFID Multisensor for Temperature Sensing and Crack Monitoring in an IoT Environment. IEEE Sens. Lett. 2021, 5, 1–4. [Google Scholar] [CrossRef]
- Abdulkawi, W.M.; Sheta, A.-F.A. Two-Bit Chipless RFID for Temperature and Humidity Sensing. In Proceedings of the IEEE Asia-Pacific Microwave Conference (APMC), Singapore, 10–13 December 2019; pp. 1443–1445. [Google Scholar] [CrossRef]
- Zhang, L.; Yang, H.; Tan, Q.; Jing, L.; Zhang, W.; Xiong, J.; Chen, P.-Y. Wireless Detection of Biogenic Amines Using a Split-Ring Resonator with Silver Nanoparticles-Decorated Molybdenum Disulfide. Sens. Actuators B Chem. 2021, 343, 130155. [Google Scholar] [CrossRef]
- Paddison, S.J.; Reagor, D.W.; Zawodzinski, T.A. High frequency dielectric studies of hydrated Nafion®. J. Electroanal. Chem. 1998, 459, 91–97. [Google Scholar] [CrossRef]


| Parameter | L1 | L2 | L3 | W1 | W2 | W3 |
| Value | 9.6 | 7.5938 | 10 | 7.2 | 7.5938 | 7.5 |
| Parameter | d1 | d2 | d3 | C1 | C3 | Wc1 |
| Value | 0.6 | 0.255 | 0.625 | 1.2 | 1.25 | 2.826 |
| Parameter | Lc1 | dg1 | dg2 | Wf | Width | Length |
| Value | 6 | 0.1 | 0.1 | 2.4 | 40 | 50 |
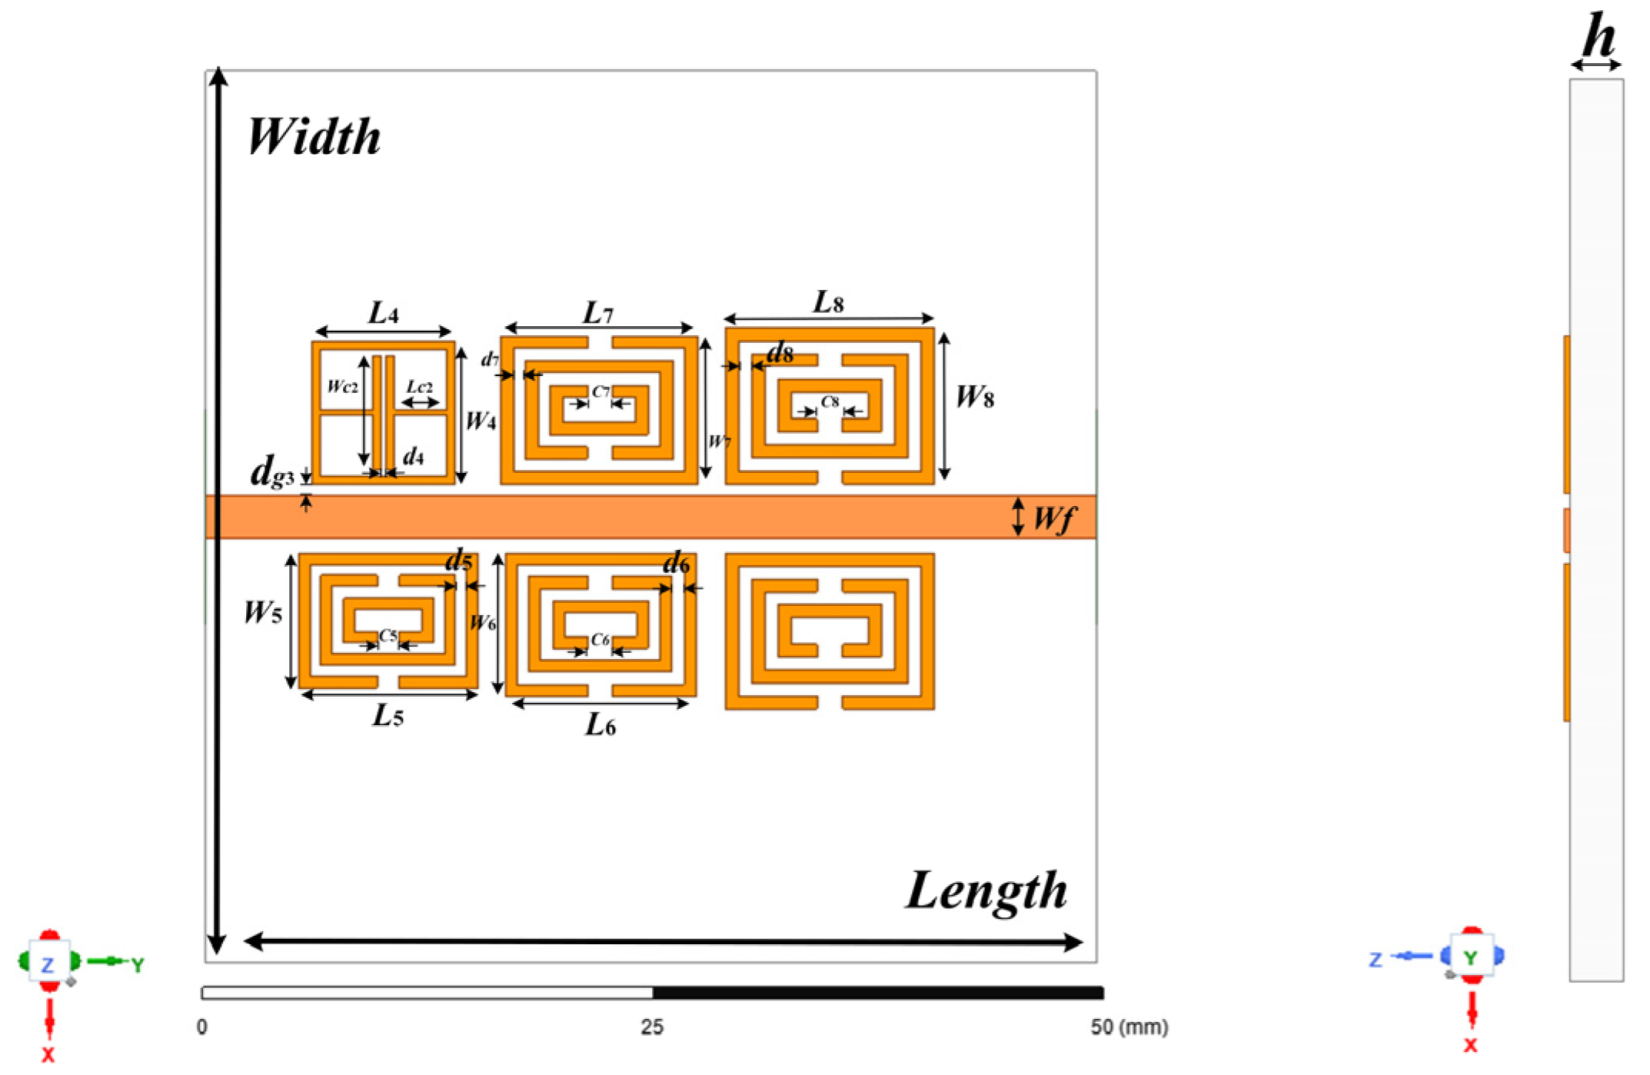
| Parameter | L4 | L5 | L6 | L7 | L8 | W4 | W5 | W6 | W7 |
| Value | 8.019 | 10.08 | 10.72 | 11.04 | 11.68 | 8.019 | 7.56 | 8.04 | 8.28 |
| Parameter | W8 | C5 | C6 | C7 | C8 | d4 | d5 | d6 | d7 |
| Value | 8.76 | 1.26 | 1.34 | 1.38 | 1.46 | 0.27 | 0.63 | 0.67 | 0.69 |
| Parameter | d8 | Lc2 | Wc2 | dg3 | h | Wf | Length | Width | |
| Value | 0.73 | 6.336 | 2.98 | 0.2 | 0.79 | 2.4 | 50 | 50 | |
| Resonator Type | Size (mm2) | Smart Materials | Sensing Parameter | Range | Sensitivity | Reference |
|---|---|---|---|---|---|---|
| Split box resonator | 14.38 × 156 | None | Crack and moisture | NA | NA | [1] |
| ELC and U-shaped slots resonators | 6.8 × 15 | PVA and Kapton | Humidity and encoding | 35–85%RH, 6-bit | NA | [8] |
| Etched circular slots resonator | 7.4 × 7.4 × π | MWCNT and Kapton® HN substrate | Humidity and gas | 40–70%RH | NA | [11] |
| ELC and U-shaped slots resonator | 8 × 25 | PVA and Phenanthrene | Humidity threshold temperature and encoding | 35–85% RH, 65–95 °C, 3-bit | NA | [16] |
| Complementary split ring resonator (CSRR) | 8 × 9 | GO@PI and HTCC substrate | Humidity, temperature and pressure | 20–90% RH, 25–300 °C, 10–300 kPa | 389 kHz/% RH, 1.52 MHz/% RH(60–90%RH), 133 kHz/°C, 107.78 kHz/kPa | [19] |
| Asymmetric circular four split ring resonator (ACiSRR) | 25 × 25 | GO, rGO and Chitosan | Humidity, temperature and pH | NA | NA | [24] |
| Split ring resonator (SRR) | 18.5 × 46 | SWCNT | Temperature and gas | 30–60 °C, 500–20,000 ppm | 36.9% (RCS) for 30 °C,12.2% (RCS) for 20,000 ppm | [31] |
| U-shaped resonator and L-shaped resonators | 15 × 35 | Rogers 6010.2LM substrate | Crack and temperature | 0.1–0.5 mm, 25–65 °C | NA | [32] |
| Multistate-coupled line resonators | NA | Stanyl and Kapton | Humidity and temperature | 35–85% RH | NA | [33] |
| Split ring resonator (SRR) | NA | Ag@MoS2 and polyimide (PI) substrate | Humidity and gas | 0–60% RH, 0–100 ppm | 0.097% ppm−1 | [34] |
| CSRR and ELC resonators | 50 × 50 | PVA and PVA-rGO | Humidity, temperature and encoding | 30–85% RH, 24.6–75 °C, 4-bit | 2.18 MHz/RH, 898.63 KHz/°C, 0.10273 dB/°C | This work |
Publisher’s Note: MDPI stays neutral with regard to jurisdictional claims in published maps and institutional affiliations. |
© 2022 by the authors. Licensee MDPI, Basel, Switzerland. This article is an open access article distributed under the terms and conditions of the Creative Commons Attribution (CC BY) license (https://creativecommons.org/licenses/by/4.0/).
Share and Cite
Liu, L.; Chen, L. Characteristic Analysis of a Chipless RFID Sensor Based on Multi-Parameter Sensing and an Intelligent Detection Method. Sensors 2022, 22, 6027. https://doi.org/10.3390/s22166027
Liu L, Chen L. Characteristic Analysis of a Chipless RFID Sensor Based on Multi-Parameter Sensing and an Intelligent Detection Method. Sensors. 2022; 22(16):6027. https://doi.org/10.3390/s22166027
Chicago/Turabian StyleLiu, Luyi, and Lan Chen. 2022. "Characteristic Analysis of a Chipless RFID Sensor Based on Multi-Parameter Sensing and an Intelligent Detection Method" Sensors 22, no. 16: 6027. https://doi.org/10.3390/s22166027