
Pendulum-Based River Current Energy Converter for Hydrometric Monitoring Systems

 , , ,
, , ,
Abstract
:1. Introduction
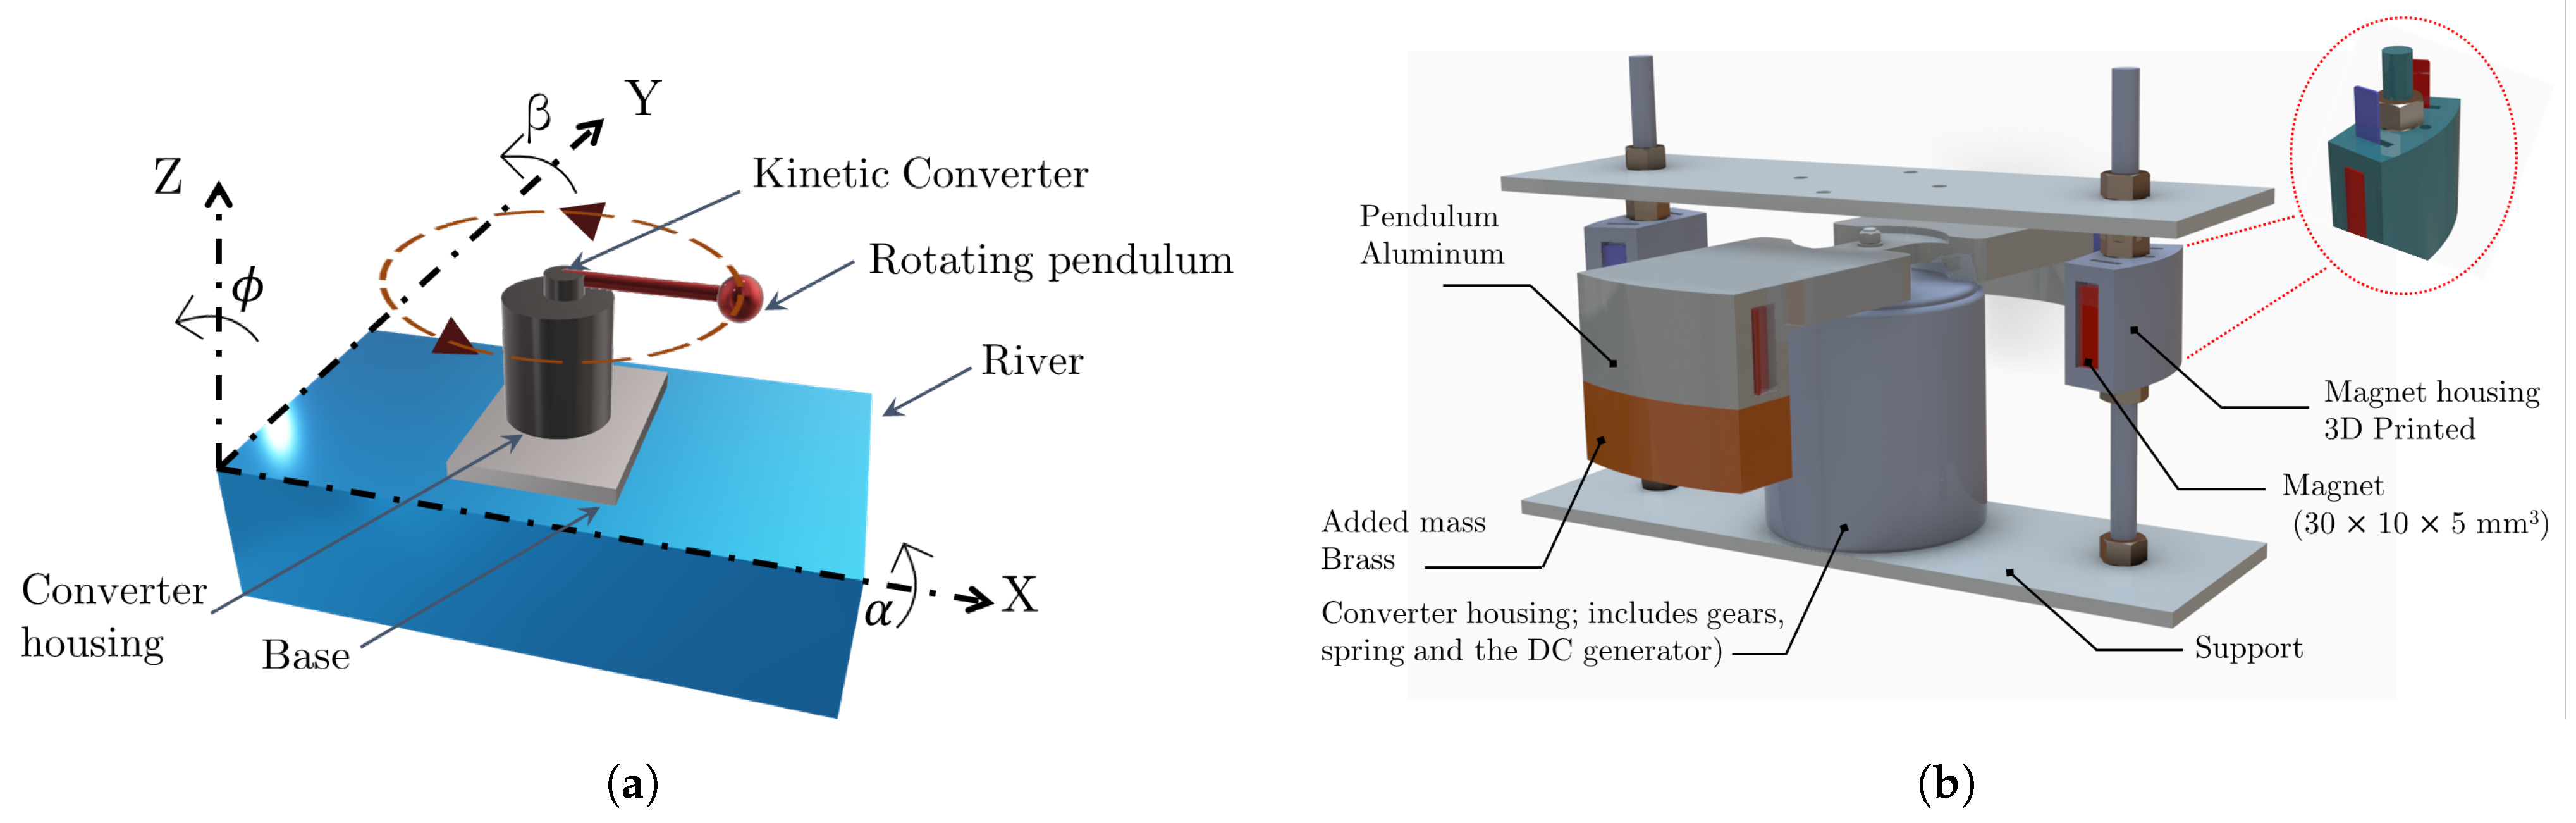
2. Device Configuration
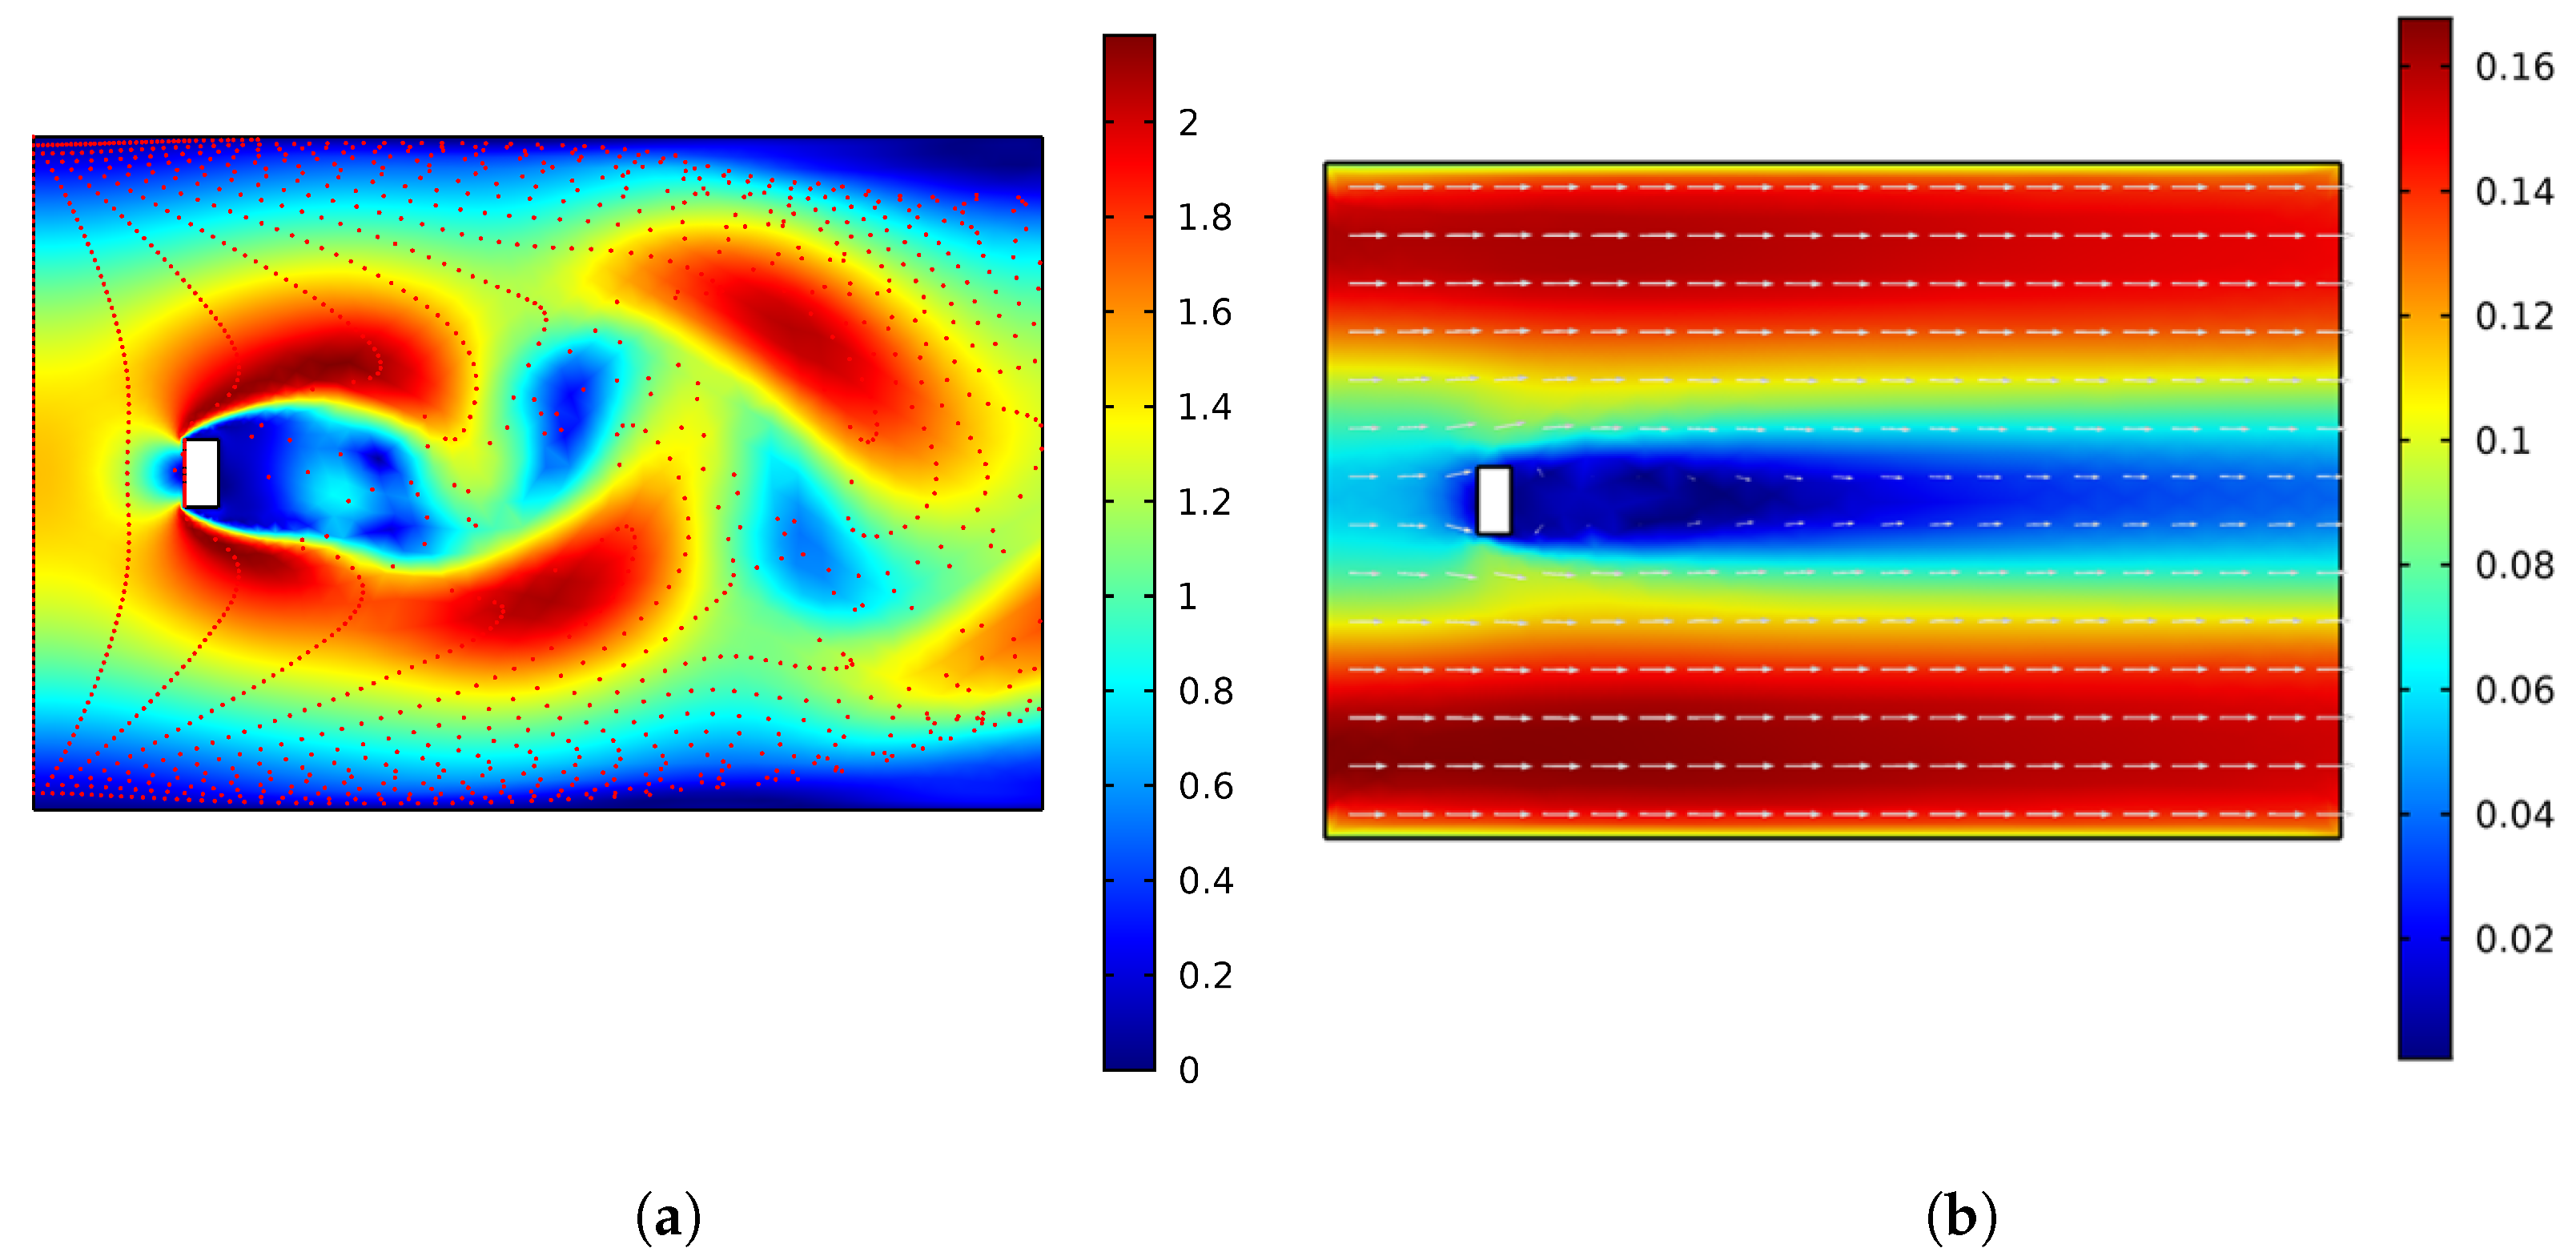
2.1. River Flow Analysis
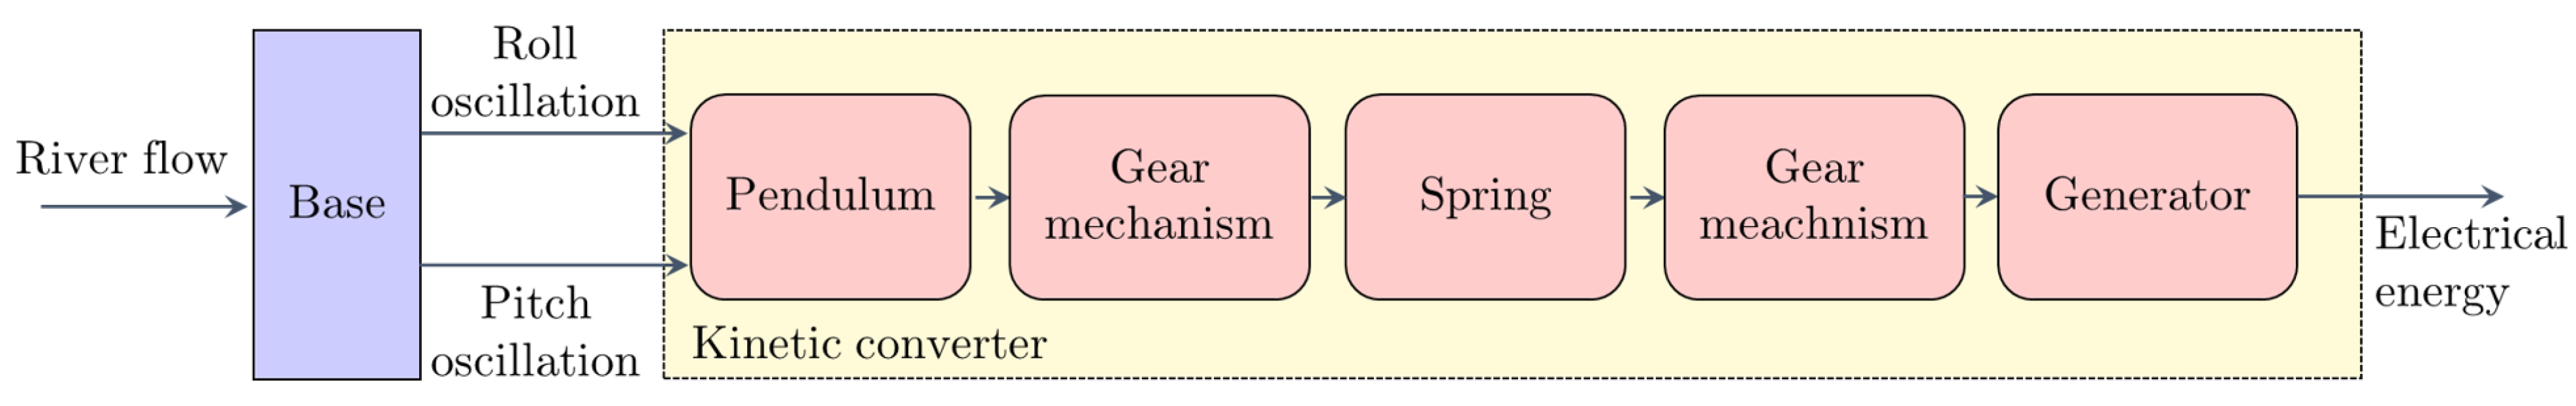
2.2. Working Principle of the Kinetic Converter
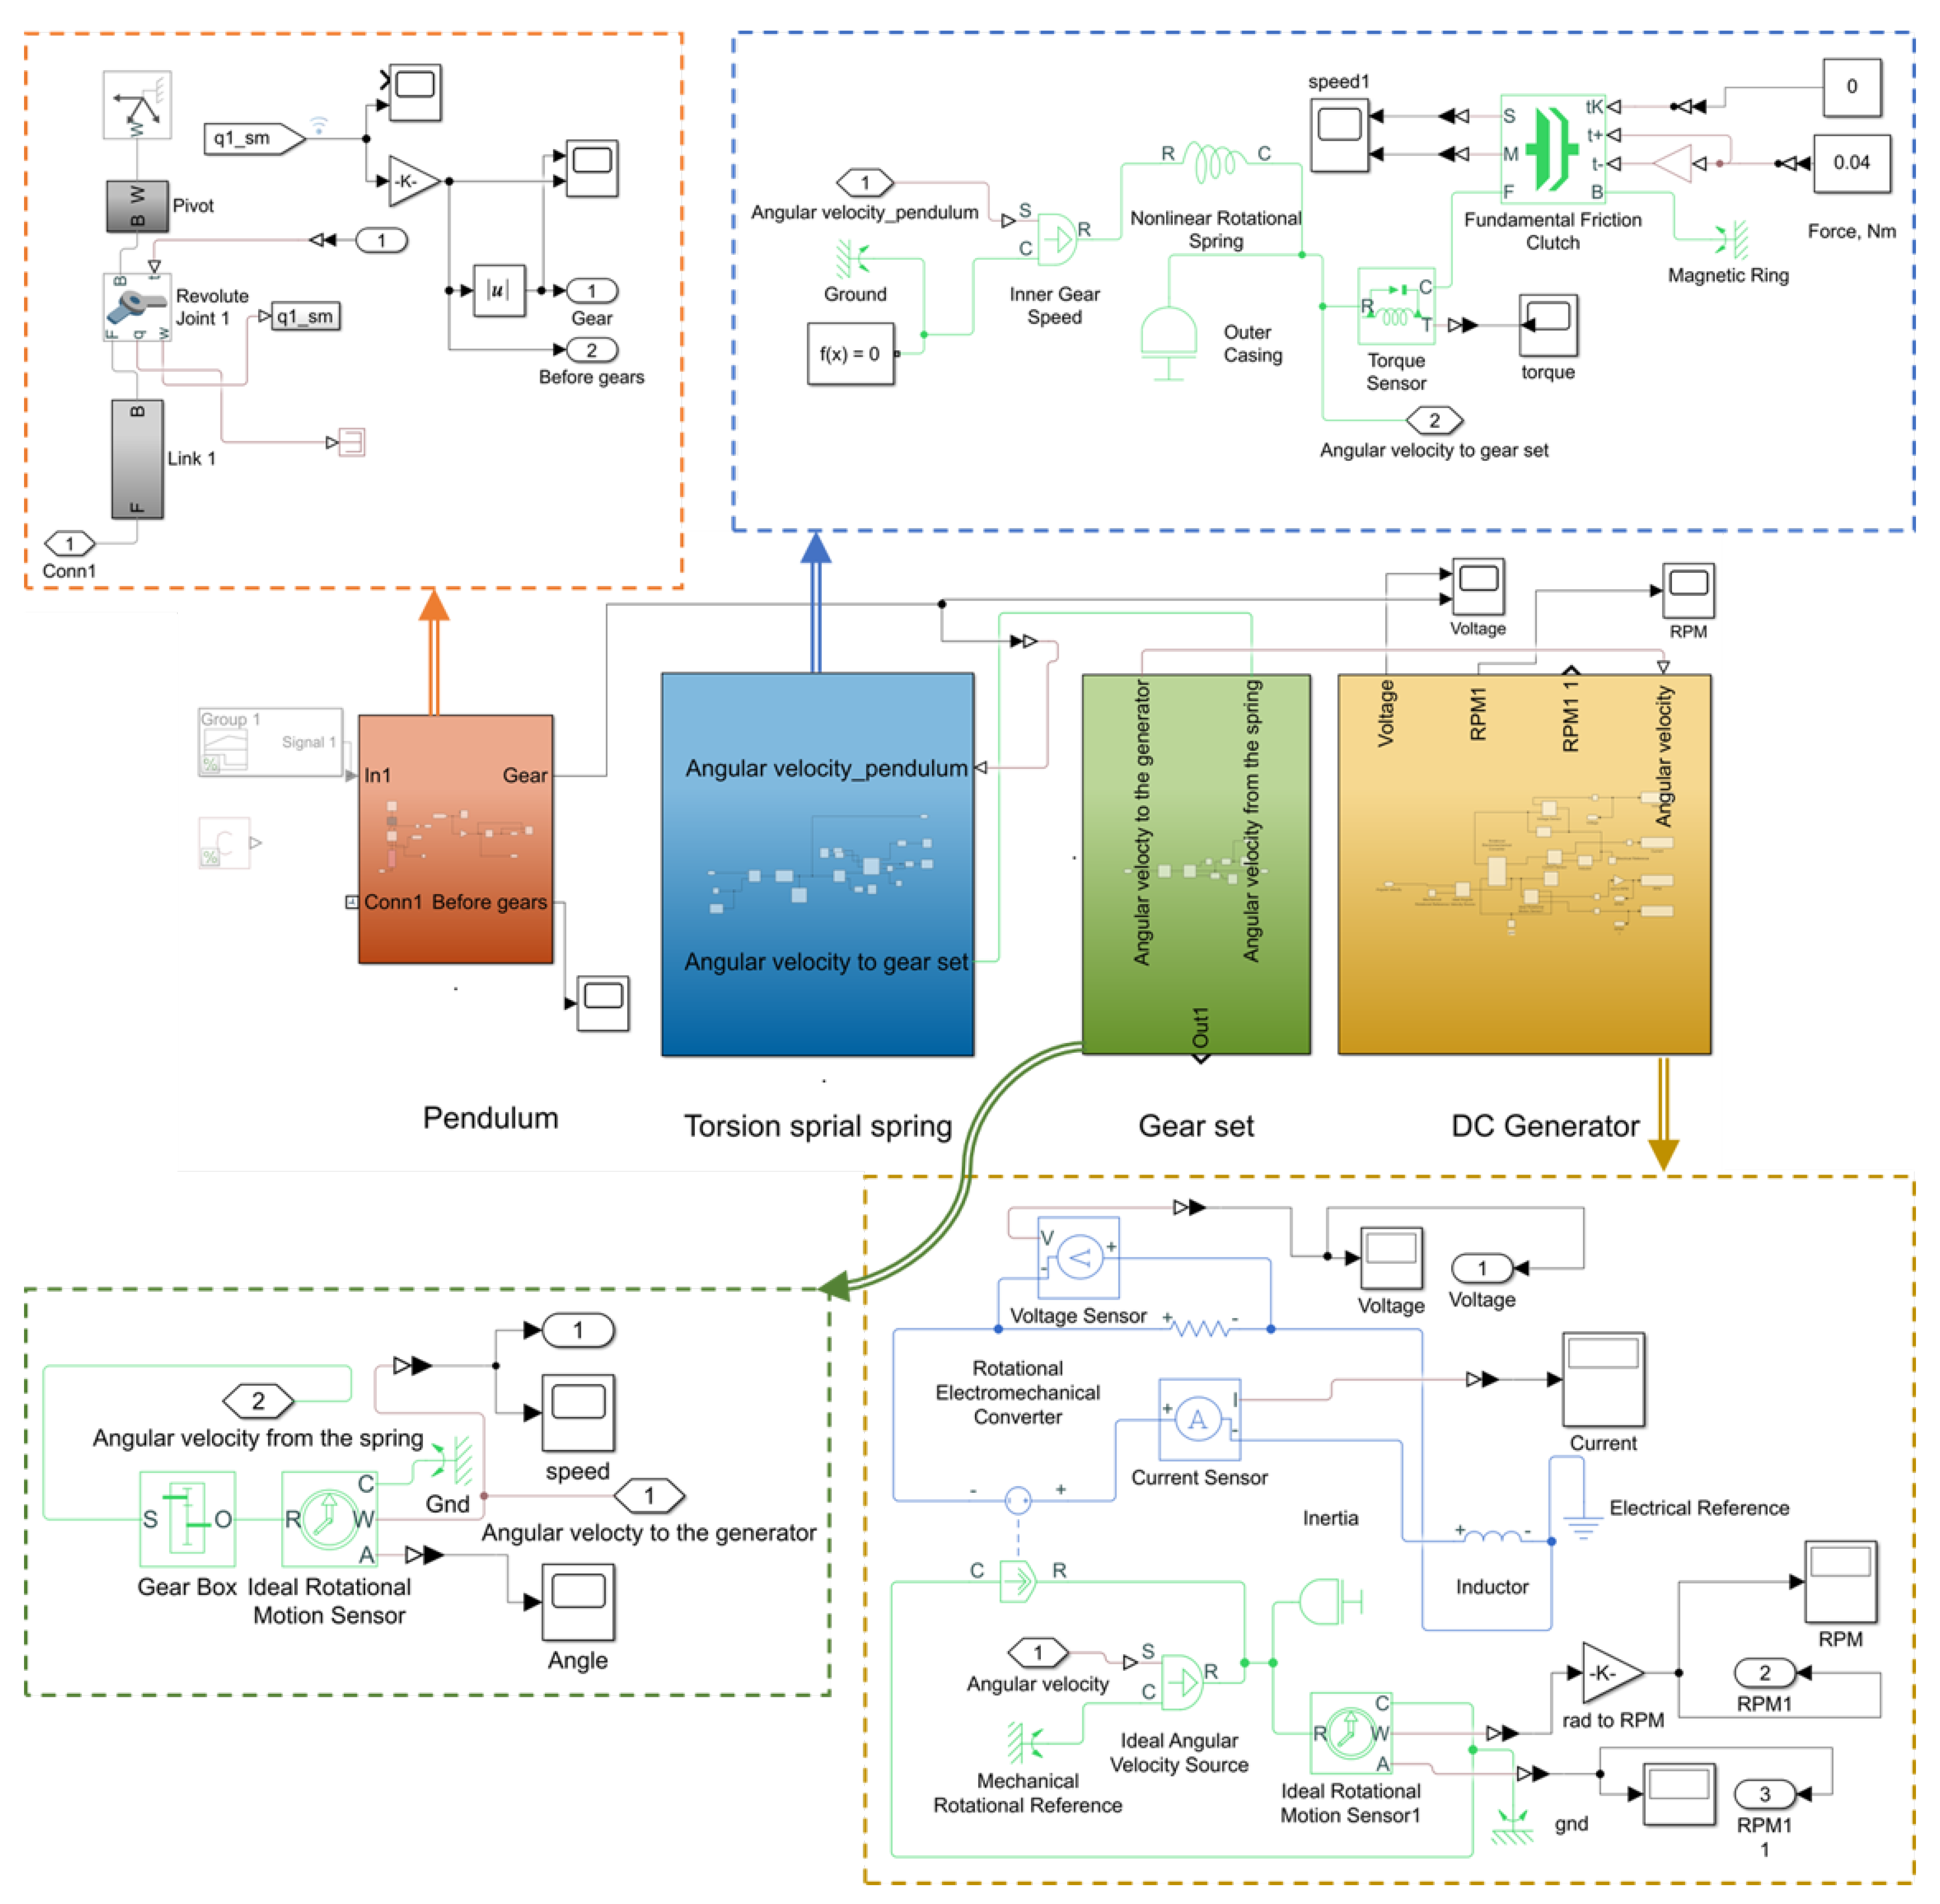
2.3. Physical Modelling
- (a)
- Pendulum:The input of the pendulum model is the acceleration in m/s; the output is the angular velocity in rad/s. The pendulum design can be developed directly in the model or imported as a CAD file. In the model under consideration, the pendulum is represented by a rigid body formed by a string and a bob block. The bi-directional mechanism is included in the pendulum model. A graphical representation of the resulting pendulum rotation is included in order to count the number of pendulum turns as a function of the applied acceleration. In this case, the number of pendulum turns refers to a 360-degree rotation of the pendulum without considering the magnetic solution presented in Figure 1b.
- (b)
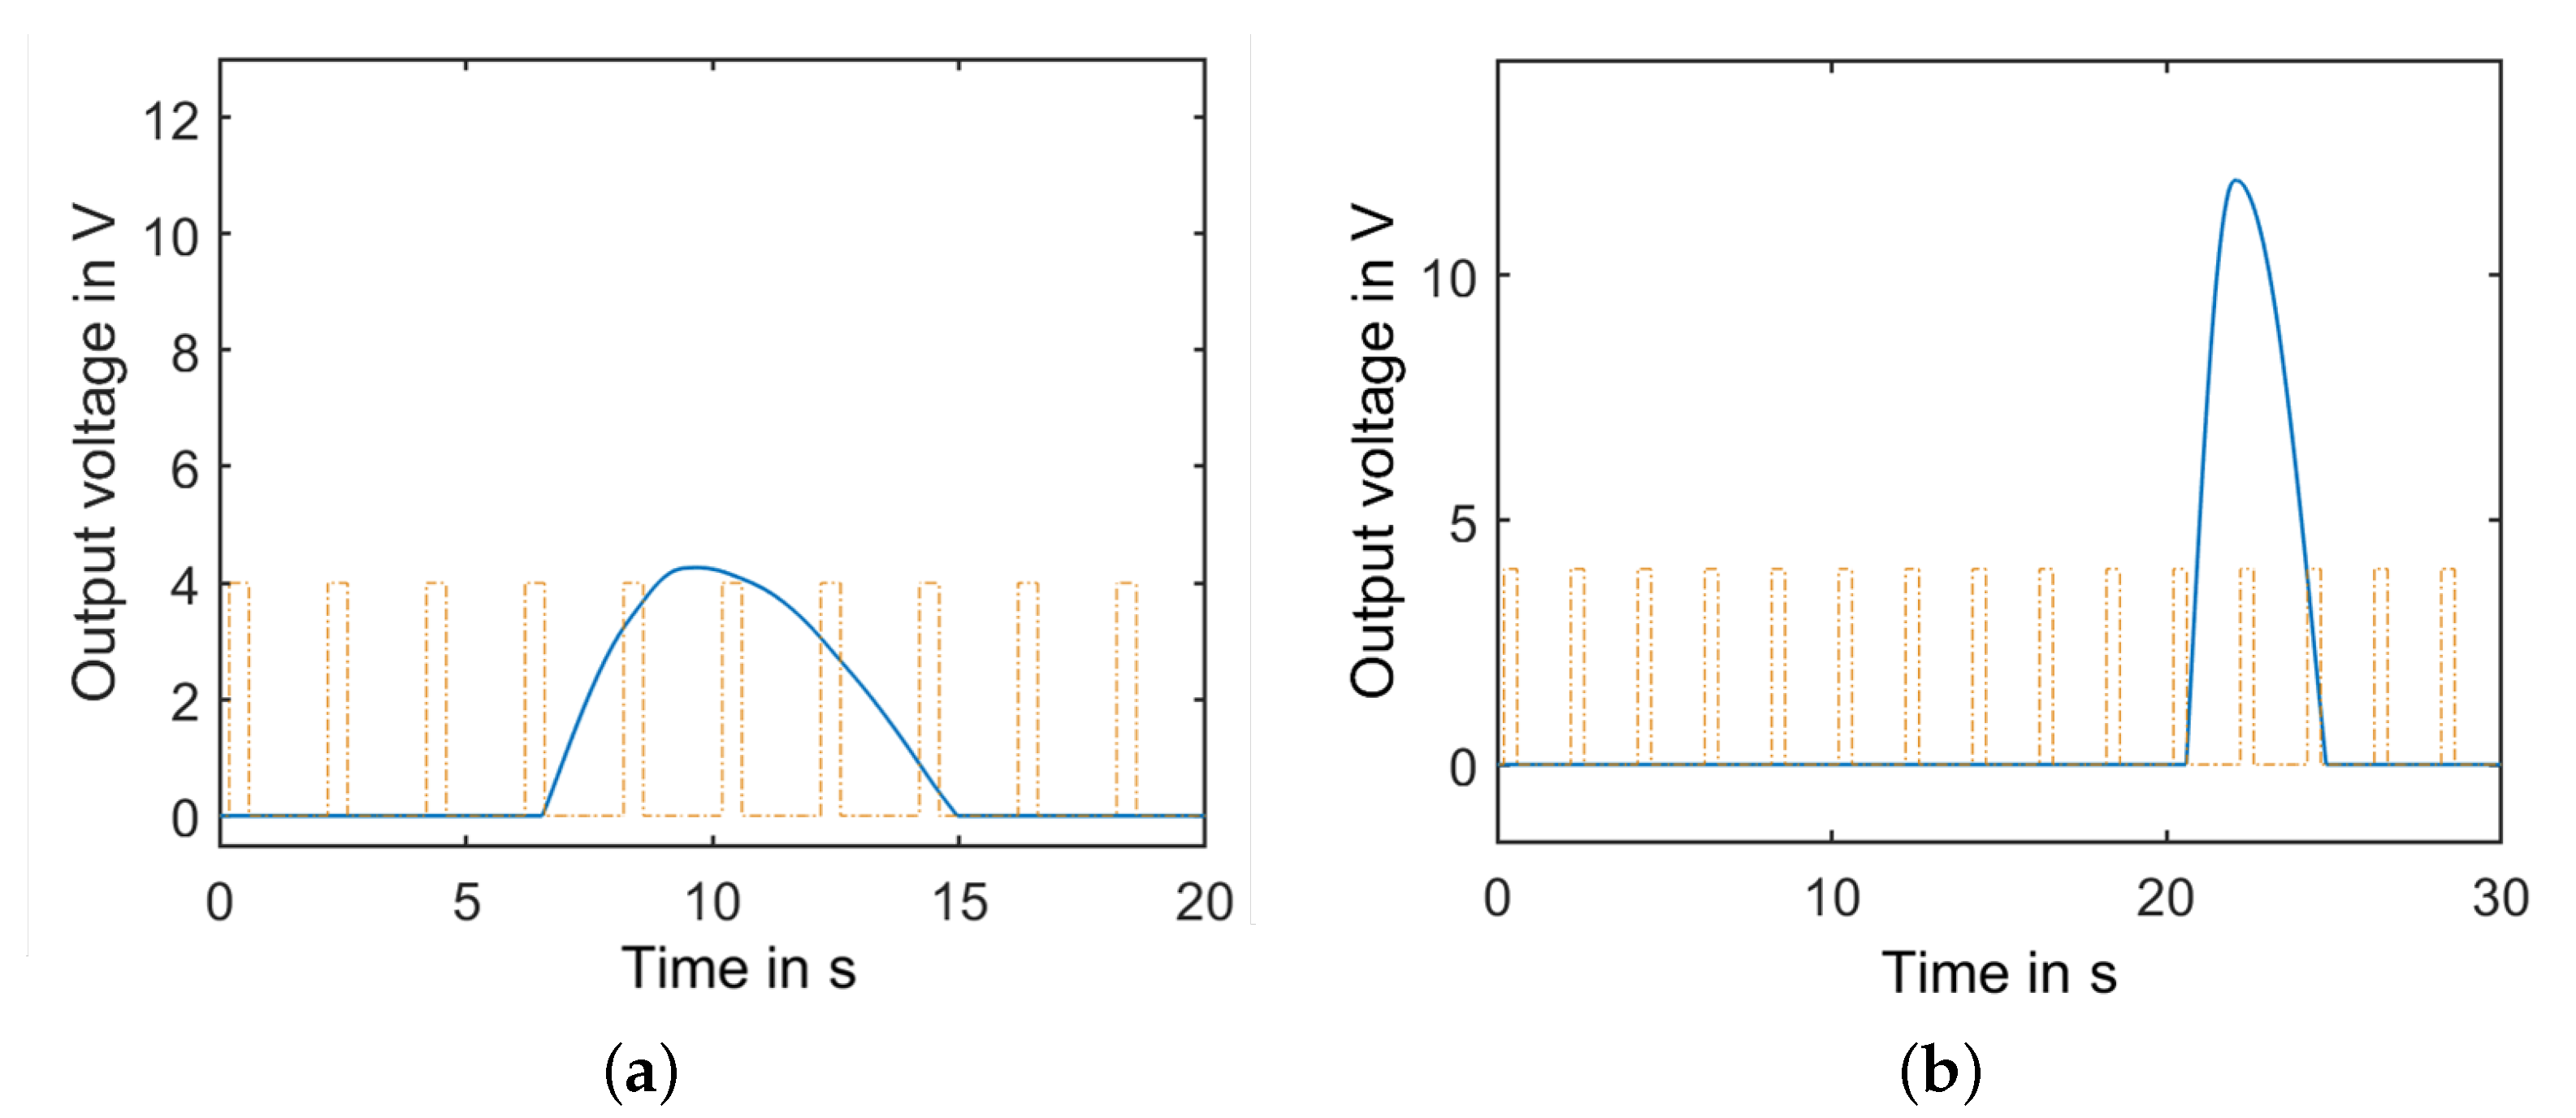
- Torsion spiral spring:A nonlinear spiral torsion spring is configured by setting the parameters of the spring constant. For the nonlinear torsion spring, the deformation vector and the torque vector are configured depending on the properties of the spring. The selected spring is made of rectangular section austenitic stainless steel, number 1.4310 grade X10CrNi18-8, having 0.2 mm thickness and 10 mm width. The inner and outer diameters of the wound spring are, respectively, 20 mm and 48 mm. To reproduce the behavior of the magnetic force and the kinetic friction between the spring and the magnet housing, a fundamental friction clutch coupling is employed. Inputs and outputs of this block are coupled with kinetic and static force values. The clutch remains locked unless the torque transmitted through the clutch falls outside the static friction limits, which are determined as a function of the DC generator holding torque, which in turn depends on the coupled resistance load value. As soon as the spring winding torque overcomes the static friction of the clutch, it begins to unwind.
- (c)
- Gear set:The model of the engaged gear is based on the transmission ratio. In the considered model, it is equal to 0.0211.
- (c)
- DC generator:A DC machine block is selected to model the DC generator. Several parameters such as the coil resistance, inductance, and torque constant are included to build the model of the DC generator. In addition, the load characteristics of the DC generator and their impacts on other parameters were examined. The DC generator used in this work is a commercially available DC motor model FF-130 SH-11340 having an operating range between 3 to 12 V. At no load, the motor has a speed of 6100 r/min and a current of approximately 0.033 A.
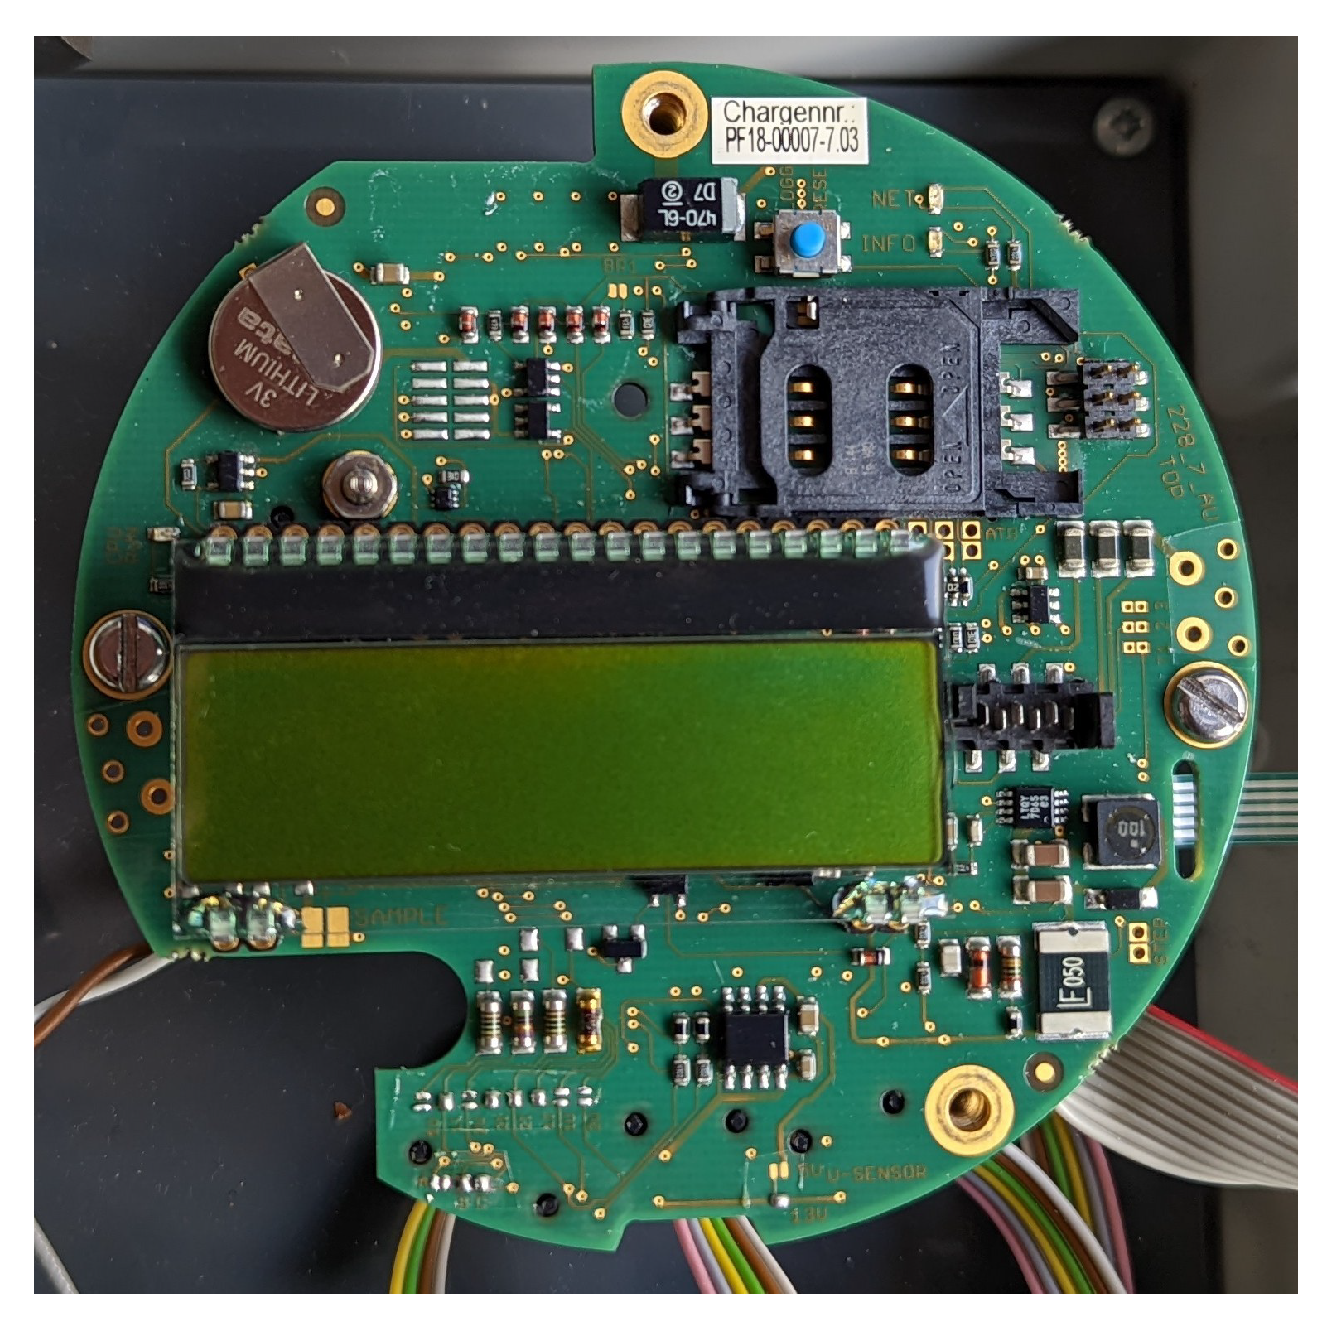
3. Hydrometric Monitoring System
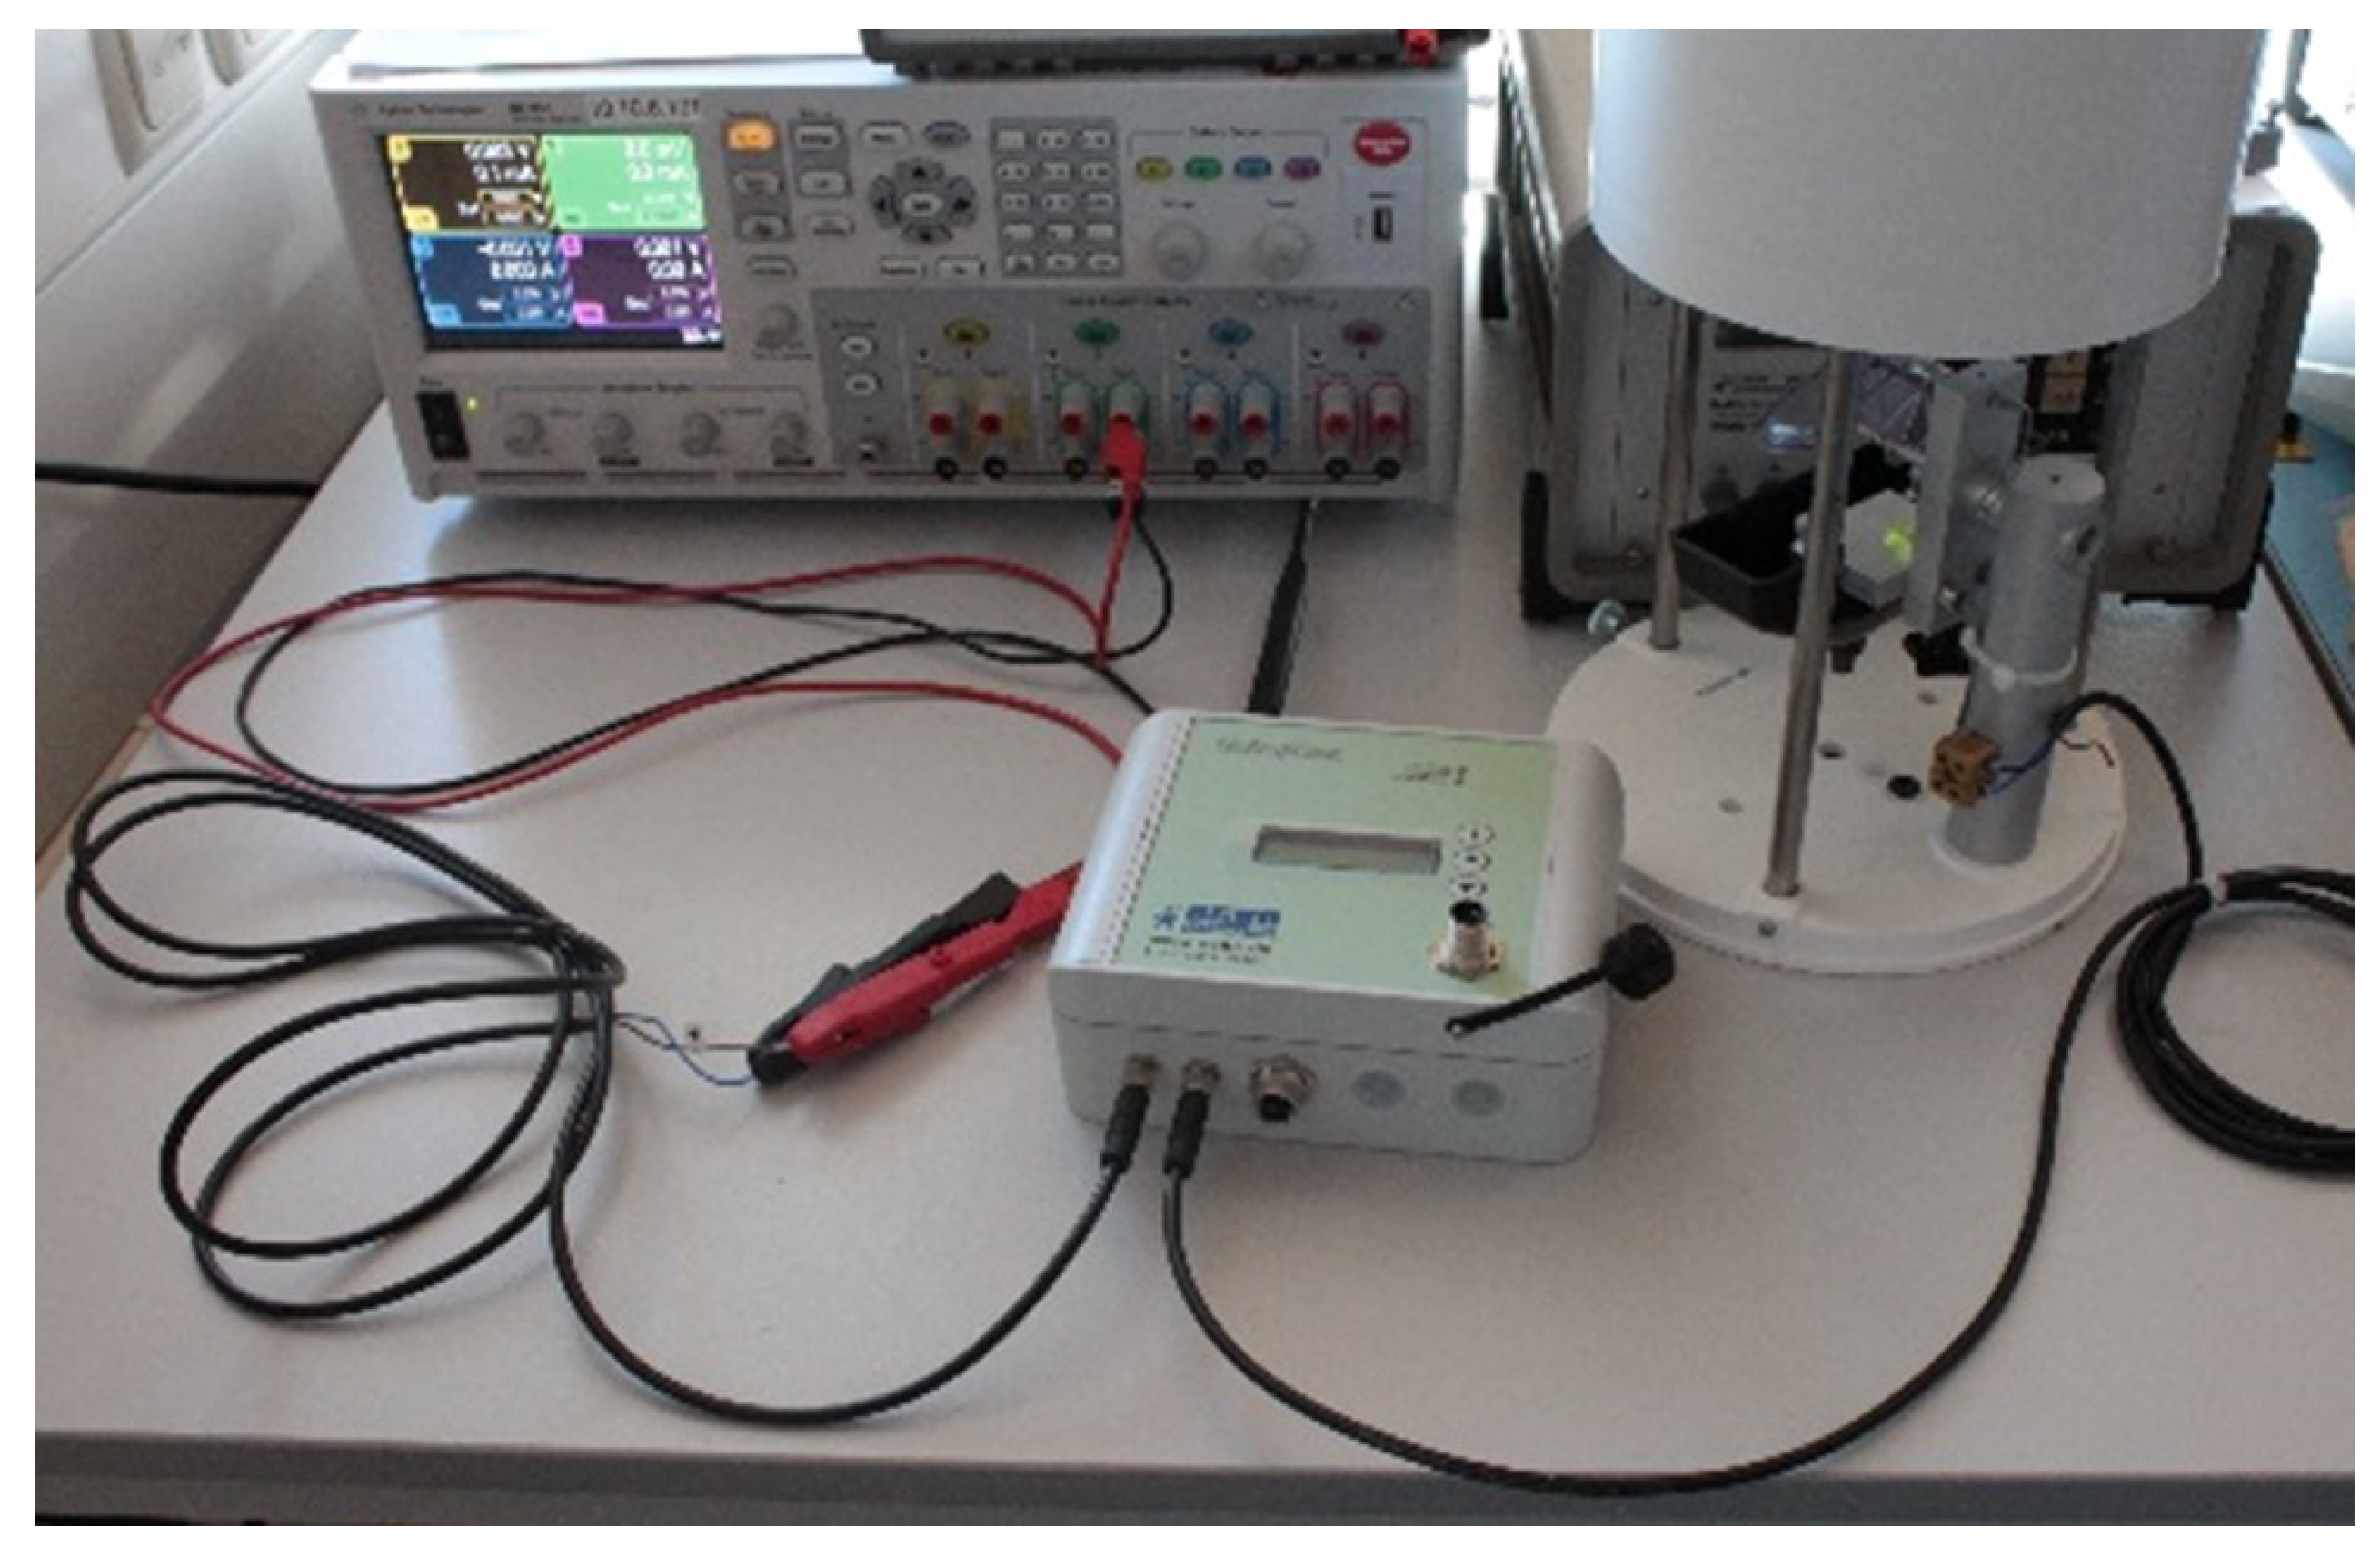
3.1. System Design and Power Consumption
- Rain pulse measurement (RG50);
- Connection setup with RS232 interface;
- FTP push remote data transfer;
- 8-min data retrieval from modem.
- (a)
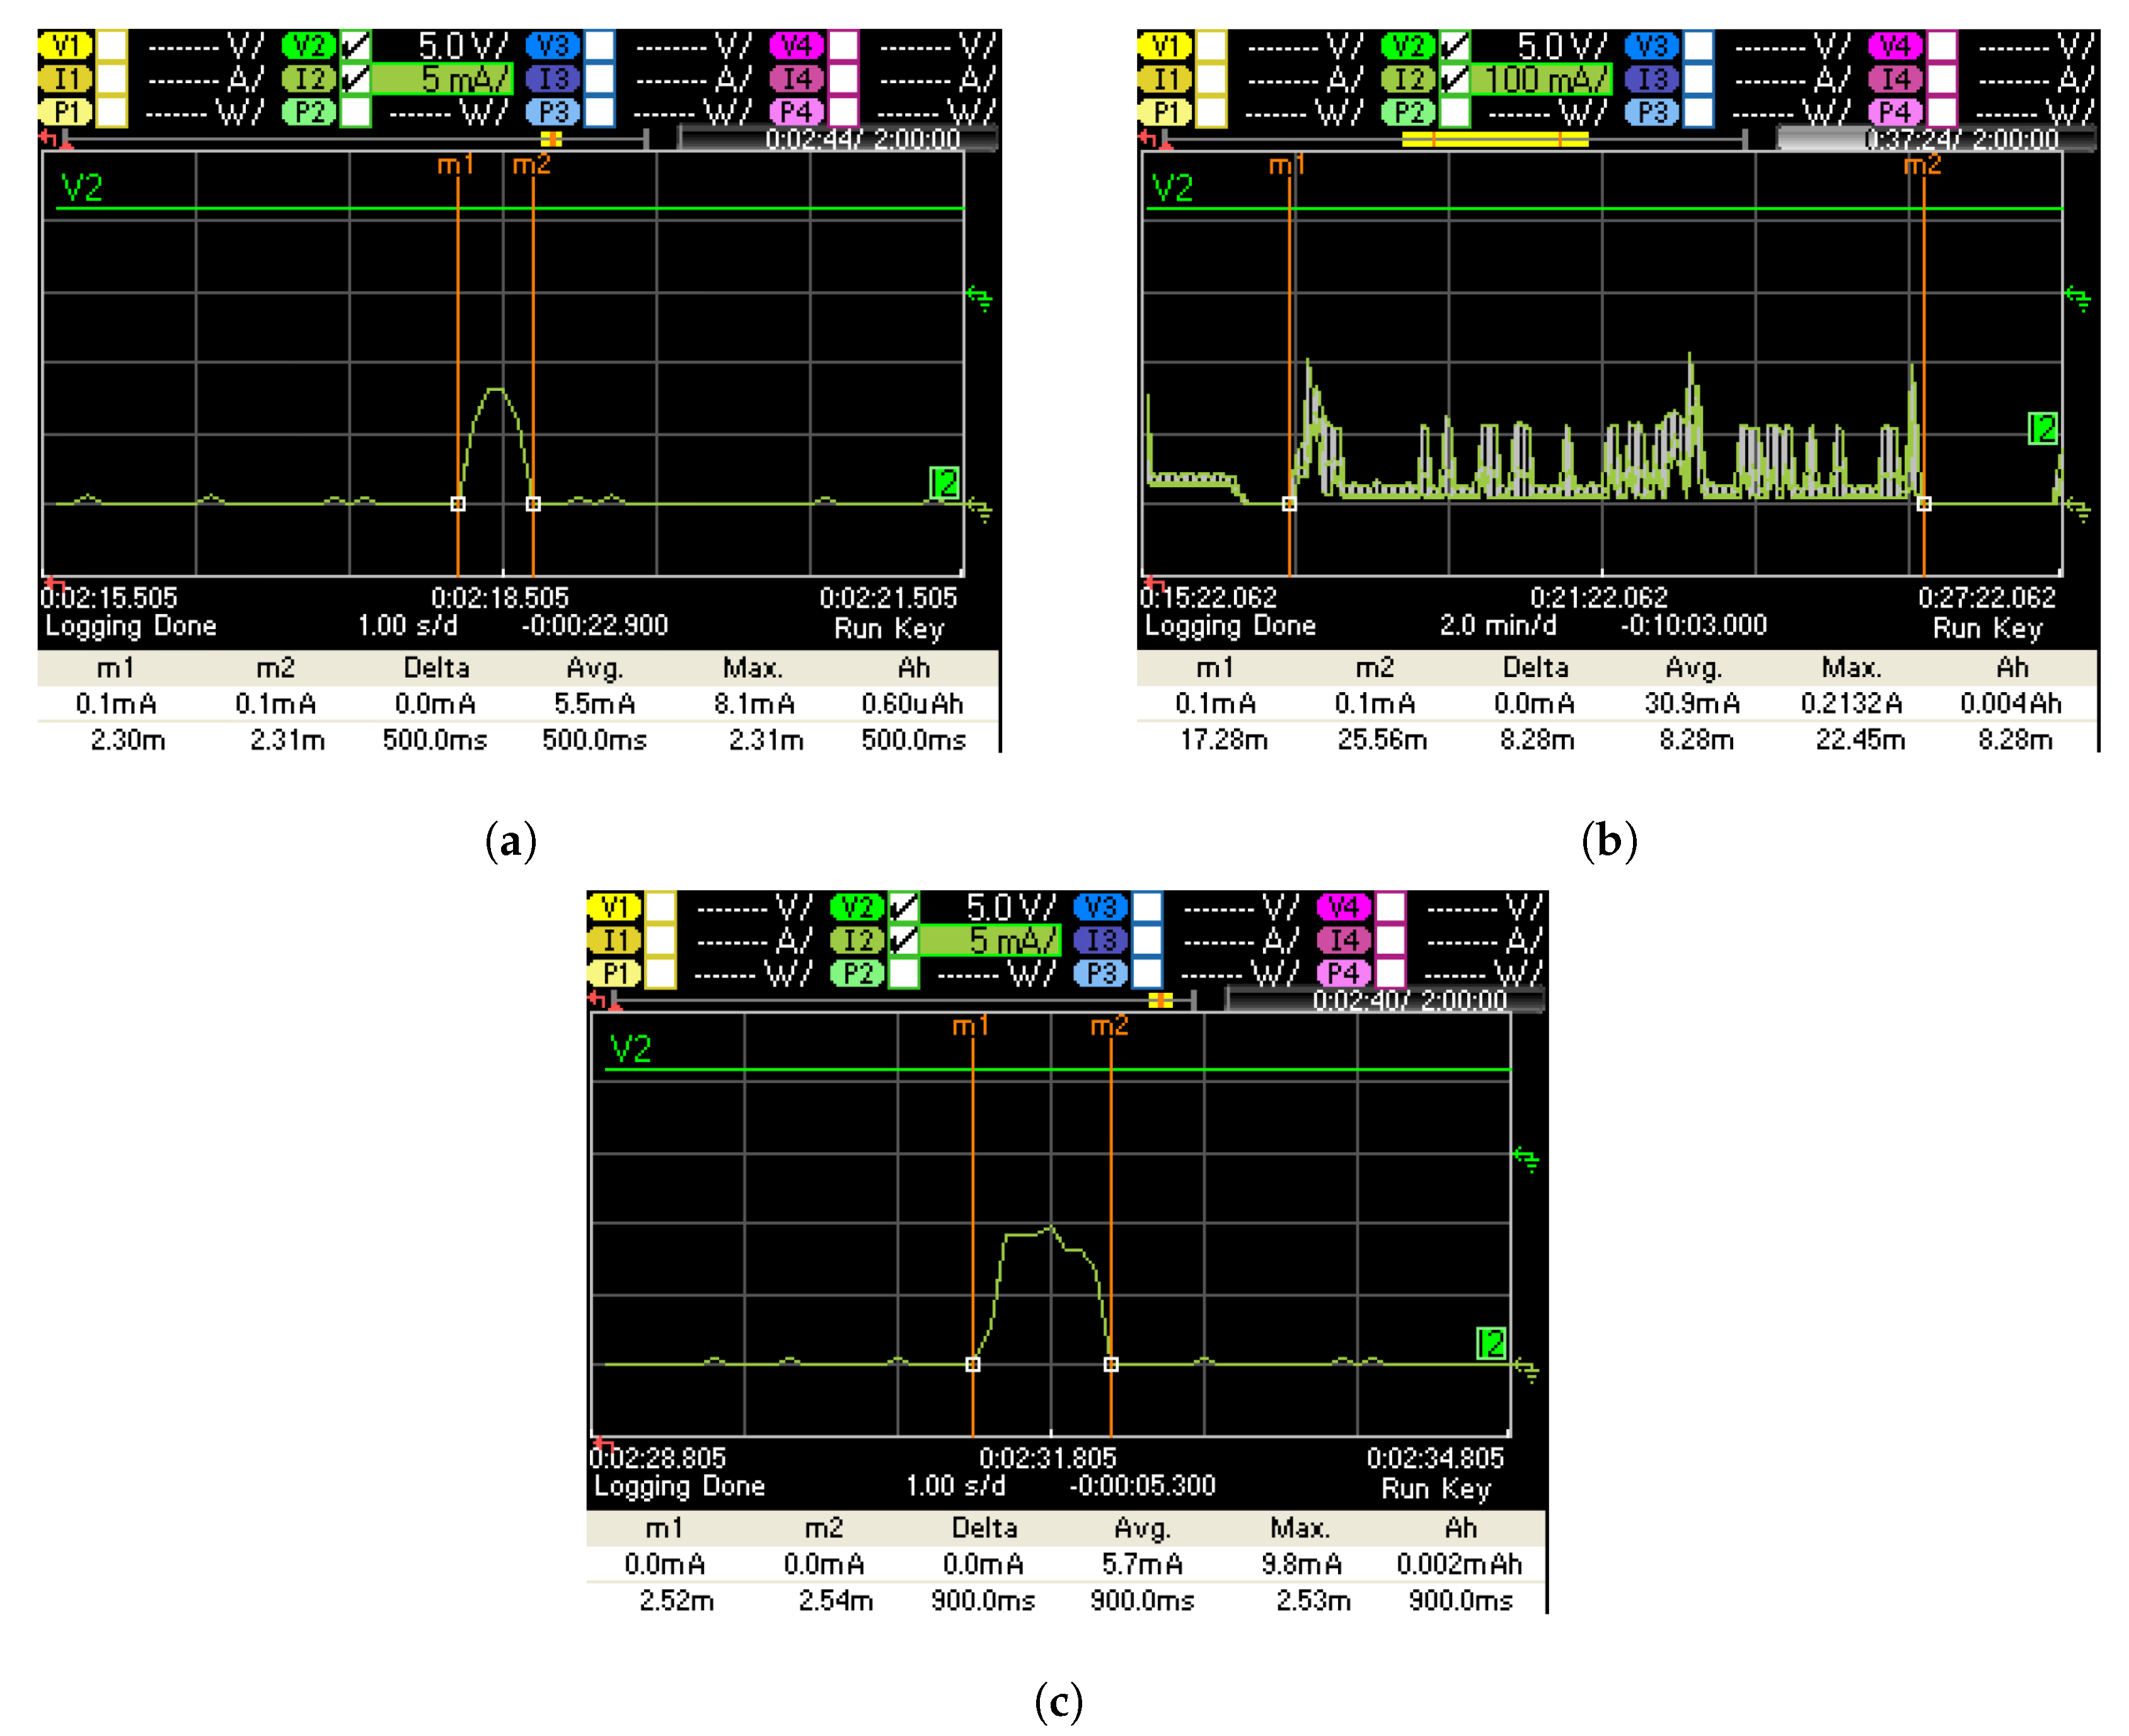
- Current consumption measurement rain pulse (RG50):The UniLogCom was supplied with 6 V/12 V and the modem functions were deactivated. The rain rocker was pressed once to record the current pulse. Measured signal at 6 V is shown in Figure 9a.
- (b)
- Power consumption measurement 8 minutes modem data retrieval:The UniLogCom was supplied with 6 V/12 V and the time slot for data retrieval was activated. During the active 8 minute time slot, a manual data retrieval was triggered. (CH01, CH2, and CH3 data size < 1 kB). Measured signal at 6V is shown in Figure 9b.
- (c)
- Power consumption test logging interval:The UniLogCom was supplied with 6 V/12 V and the modem functions were deactivated. The logging interval, which is to be expected daily at 00:00, was mapped below. During the measurement CH03—rain sum and CH32—supply are recorded. Measured signal at 6 V is shown in Figure 9c.
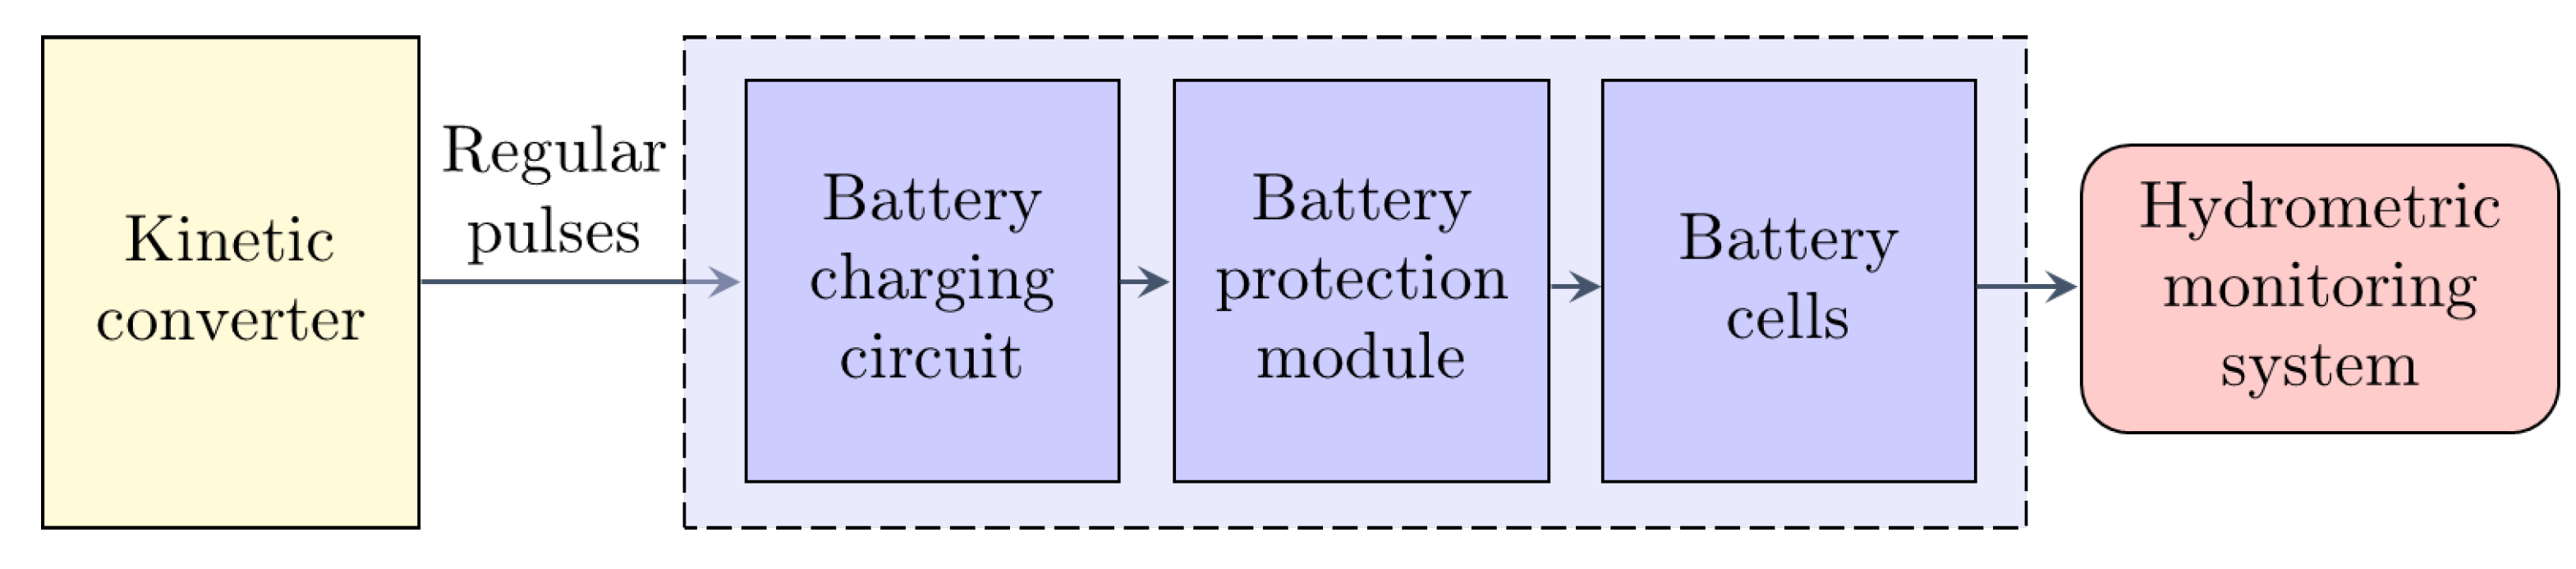
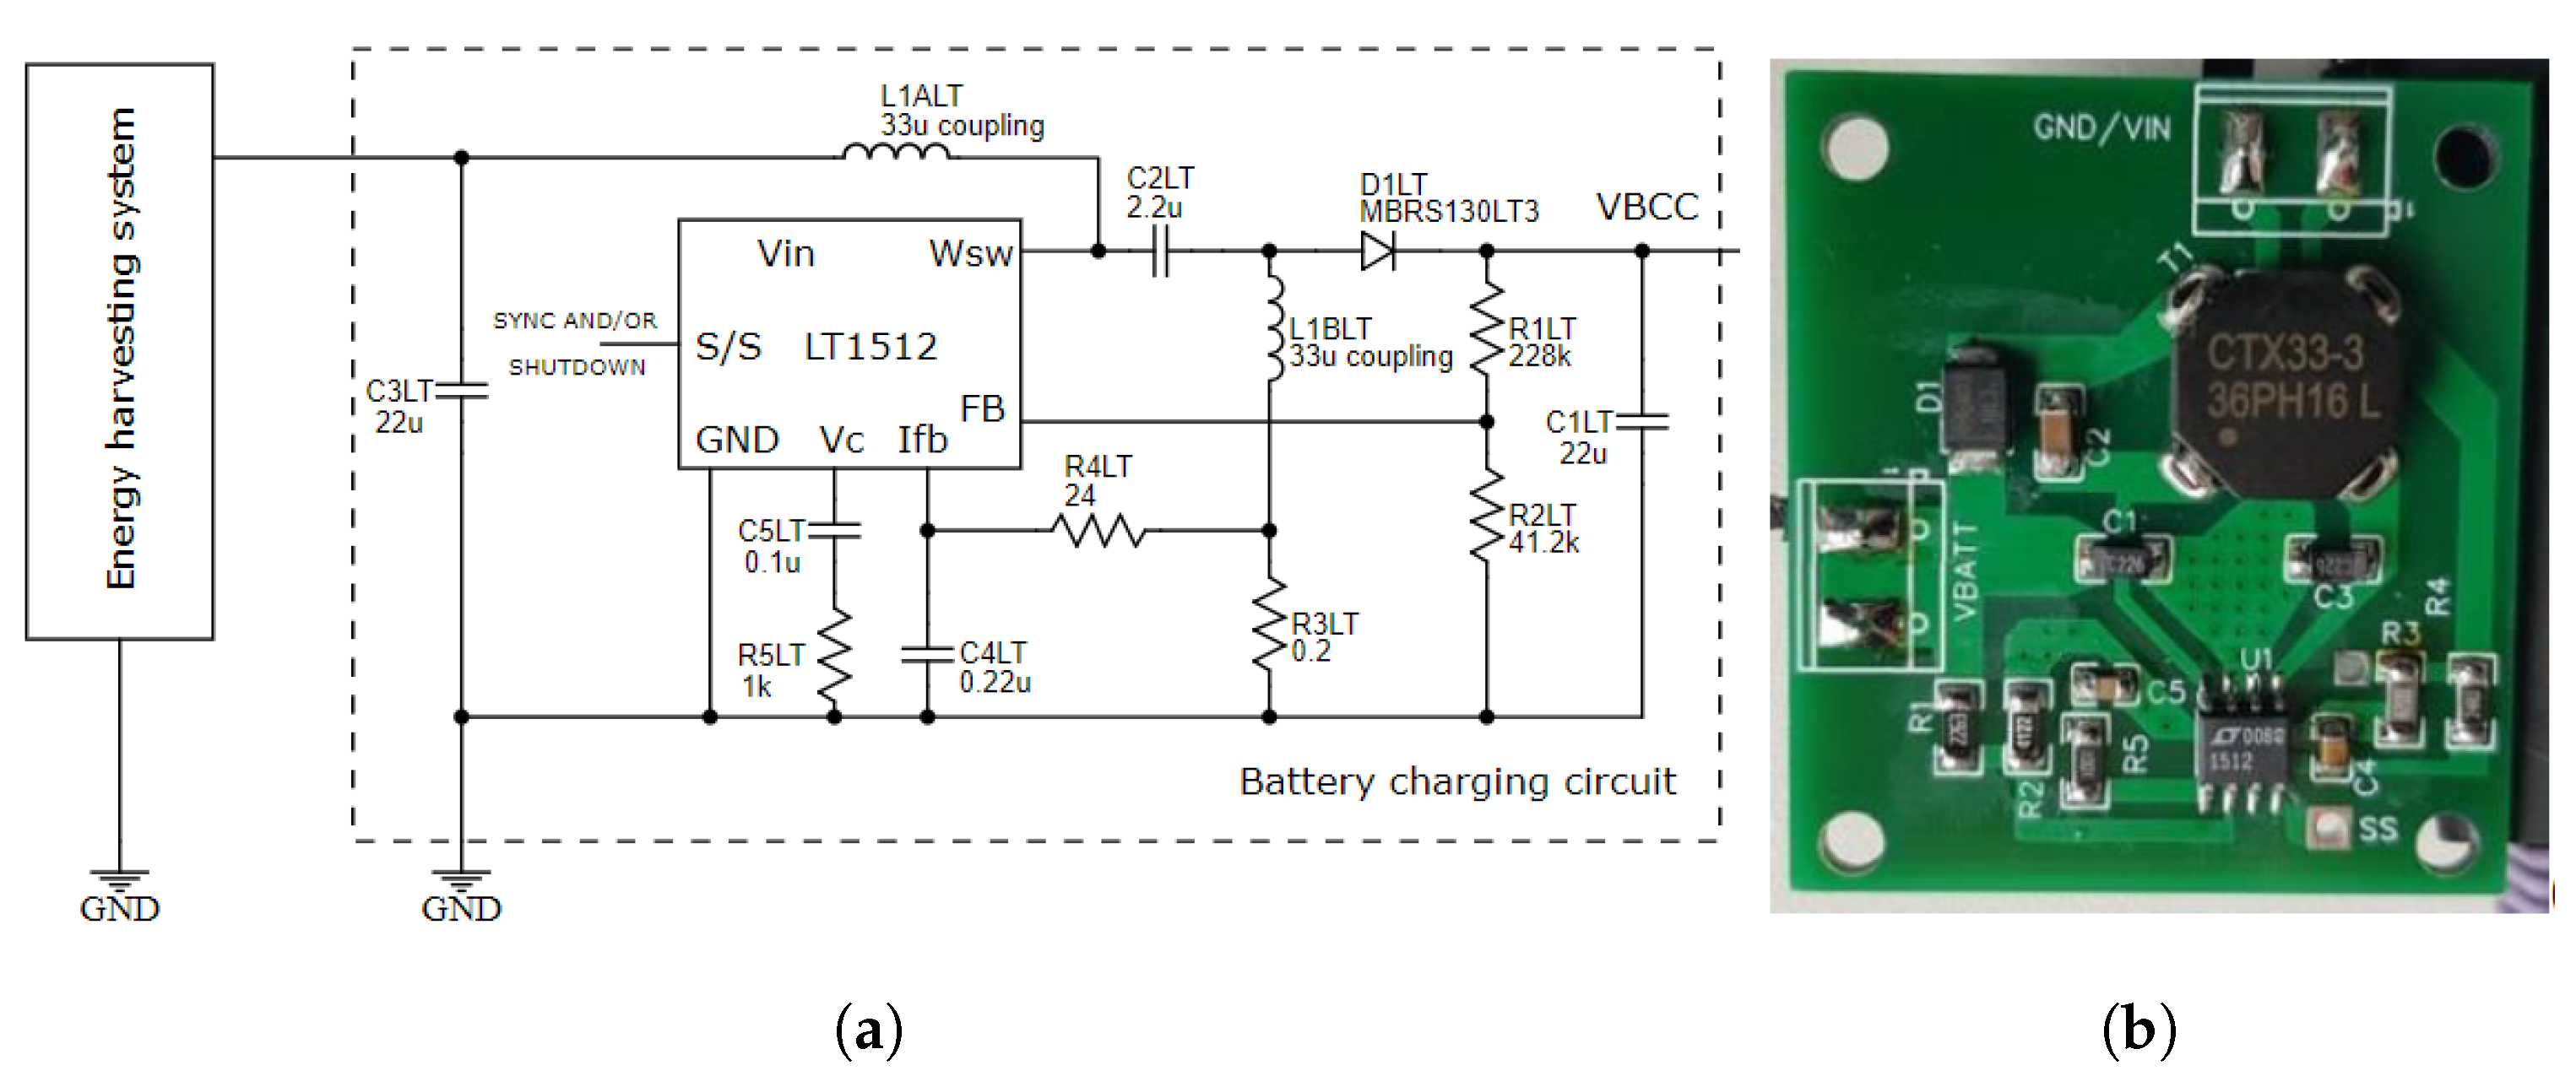
3.2. Energy Management and Battery Charging Circuits
4. Experimental Validation
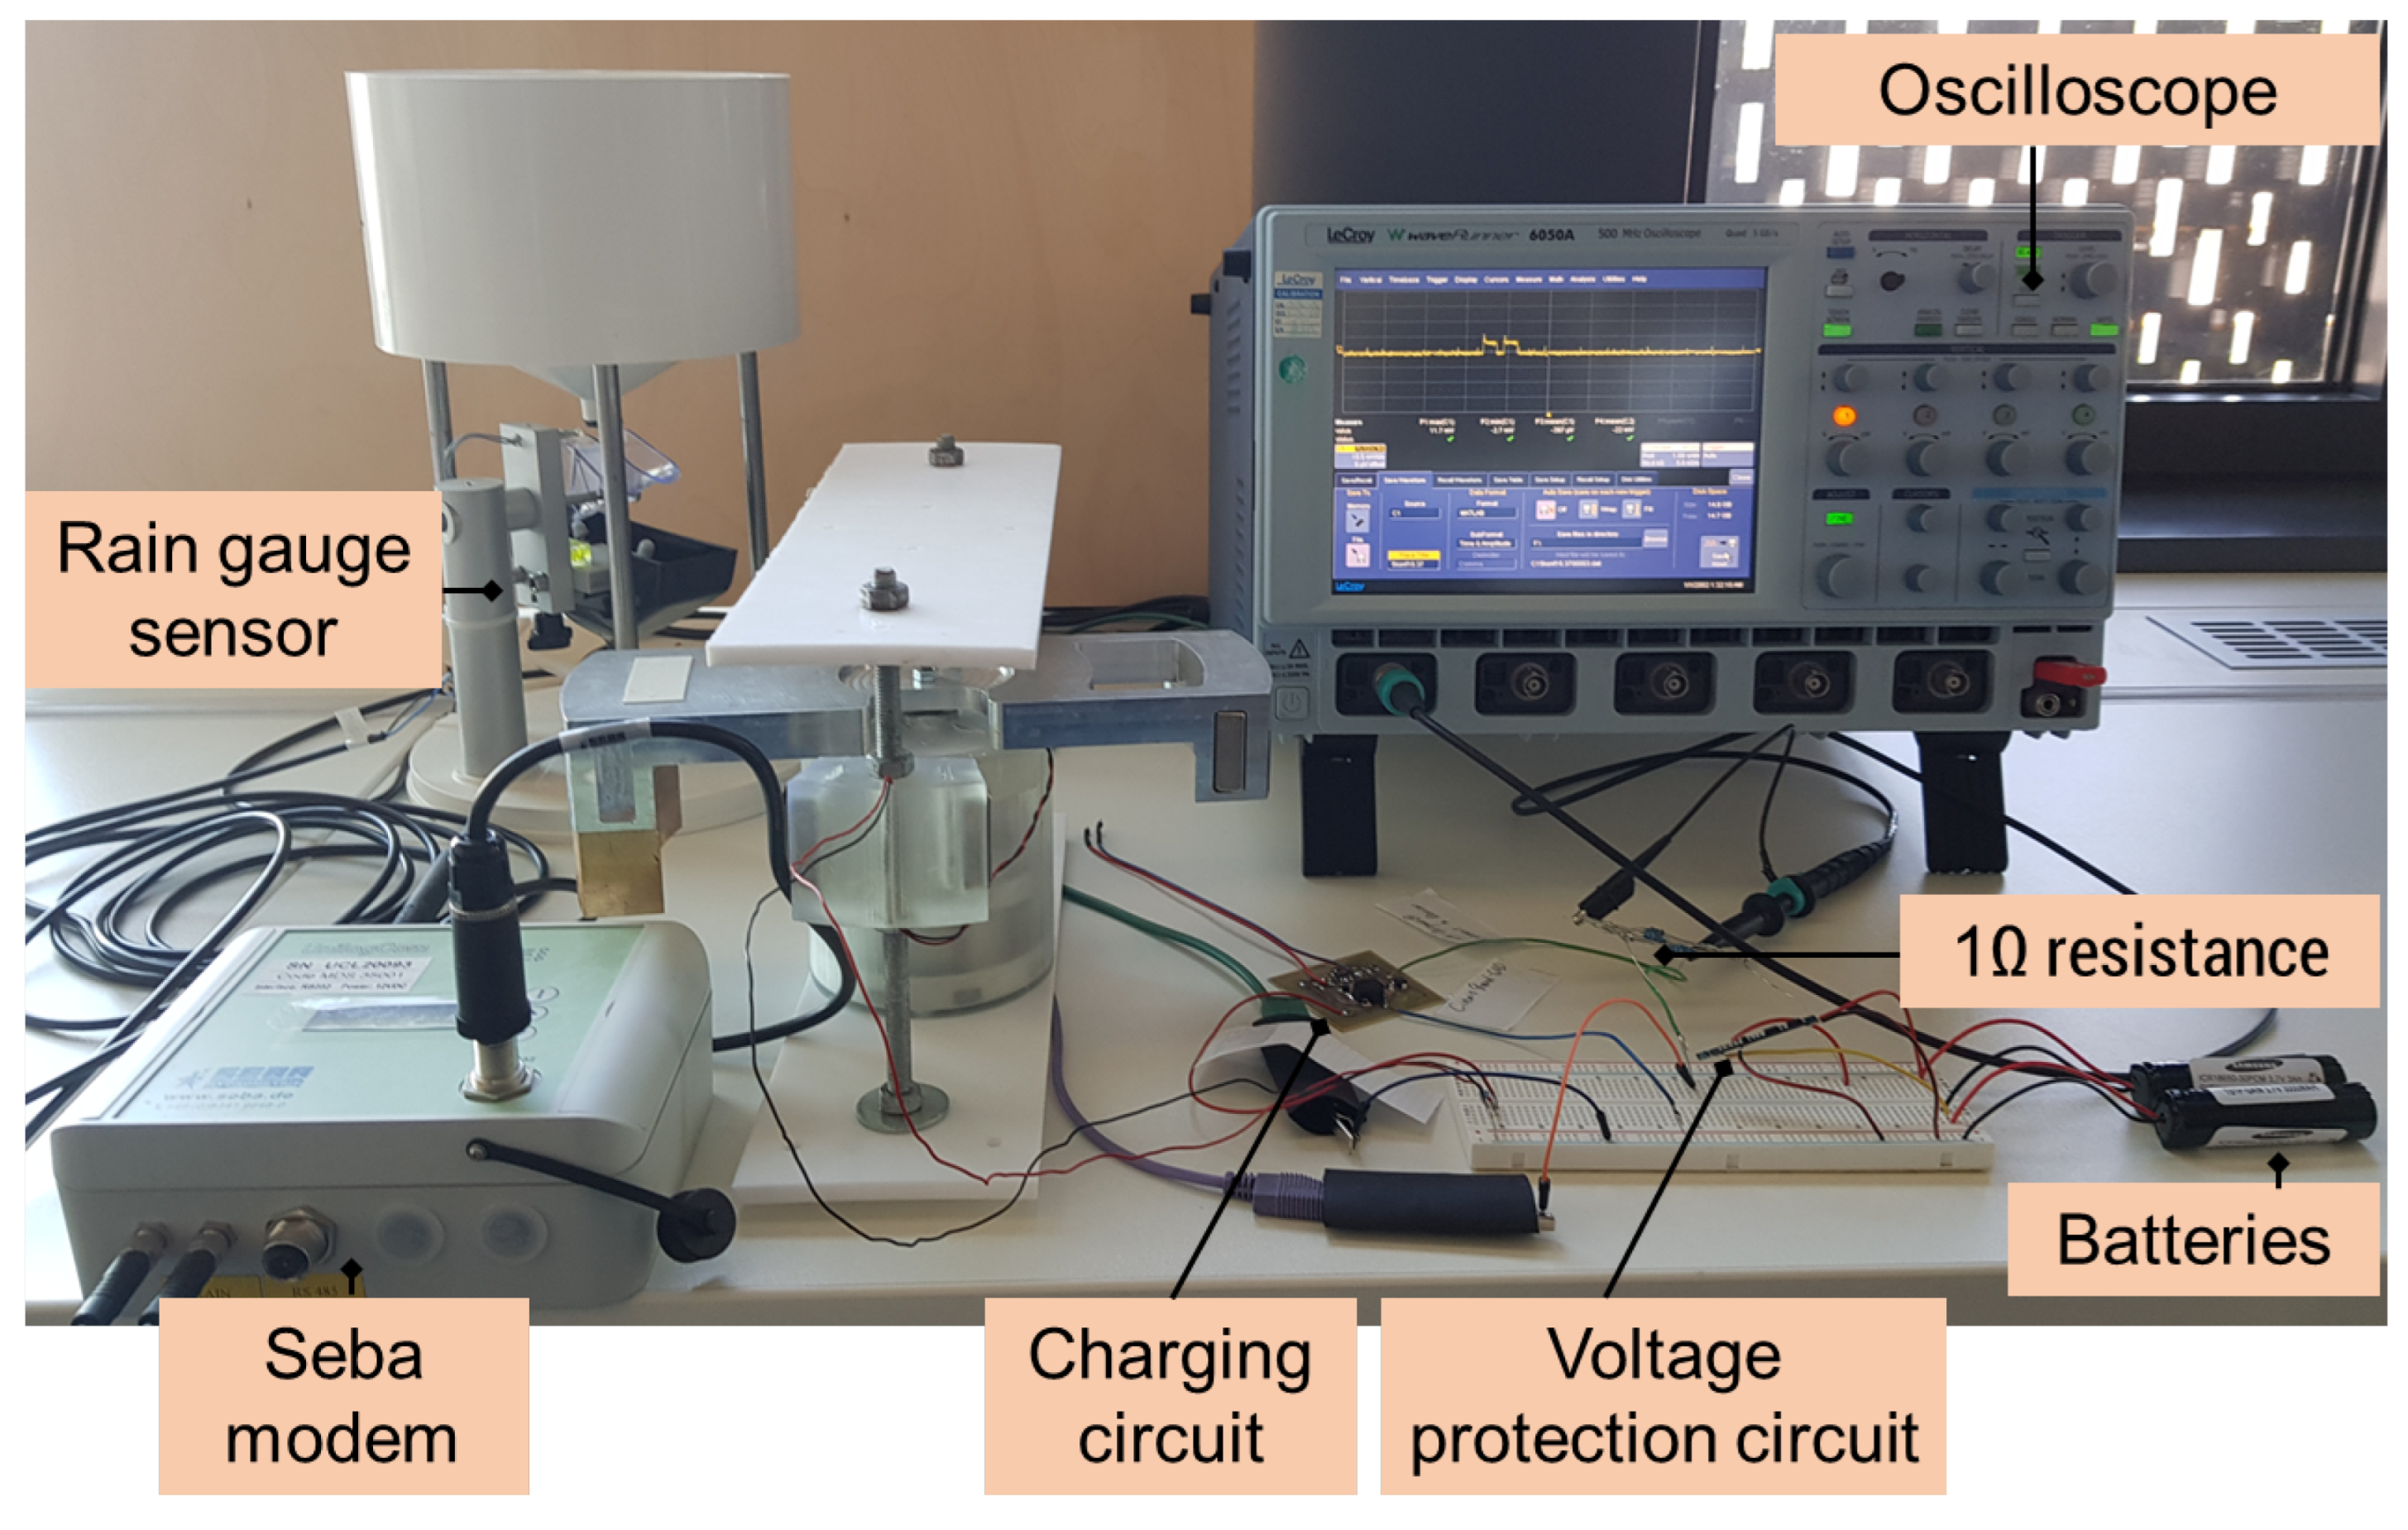
4.1. Laboratory Characterization
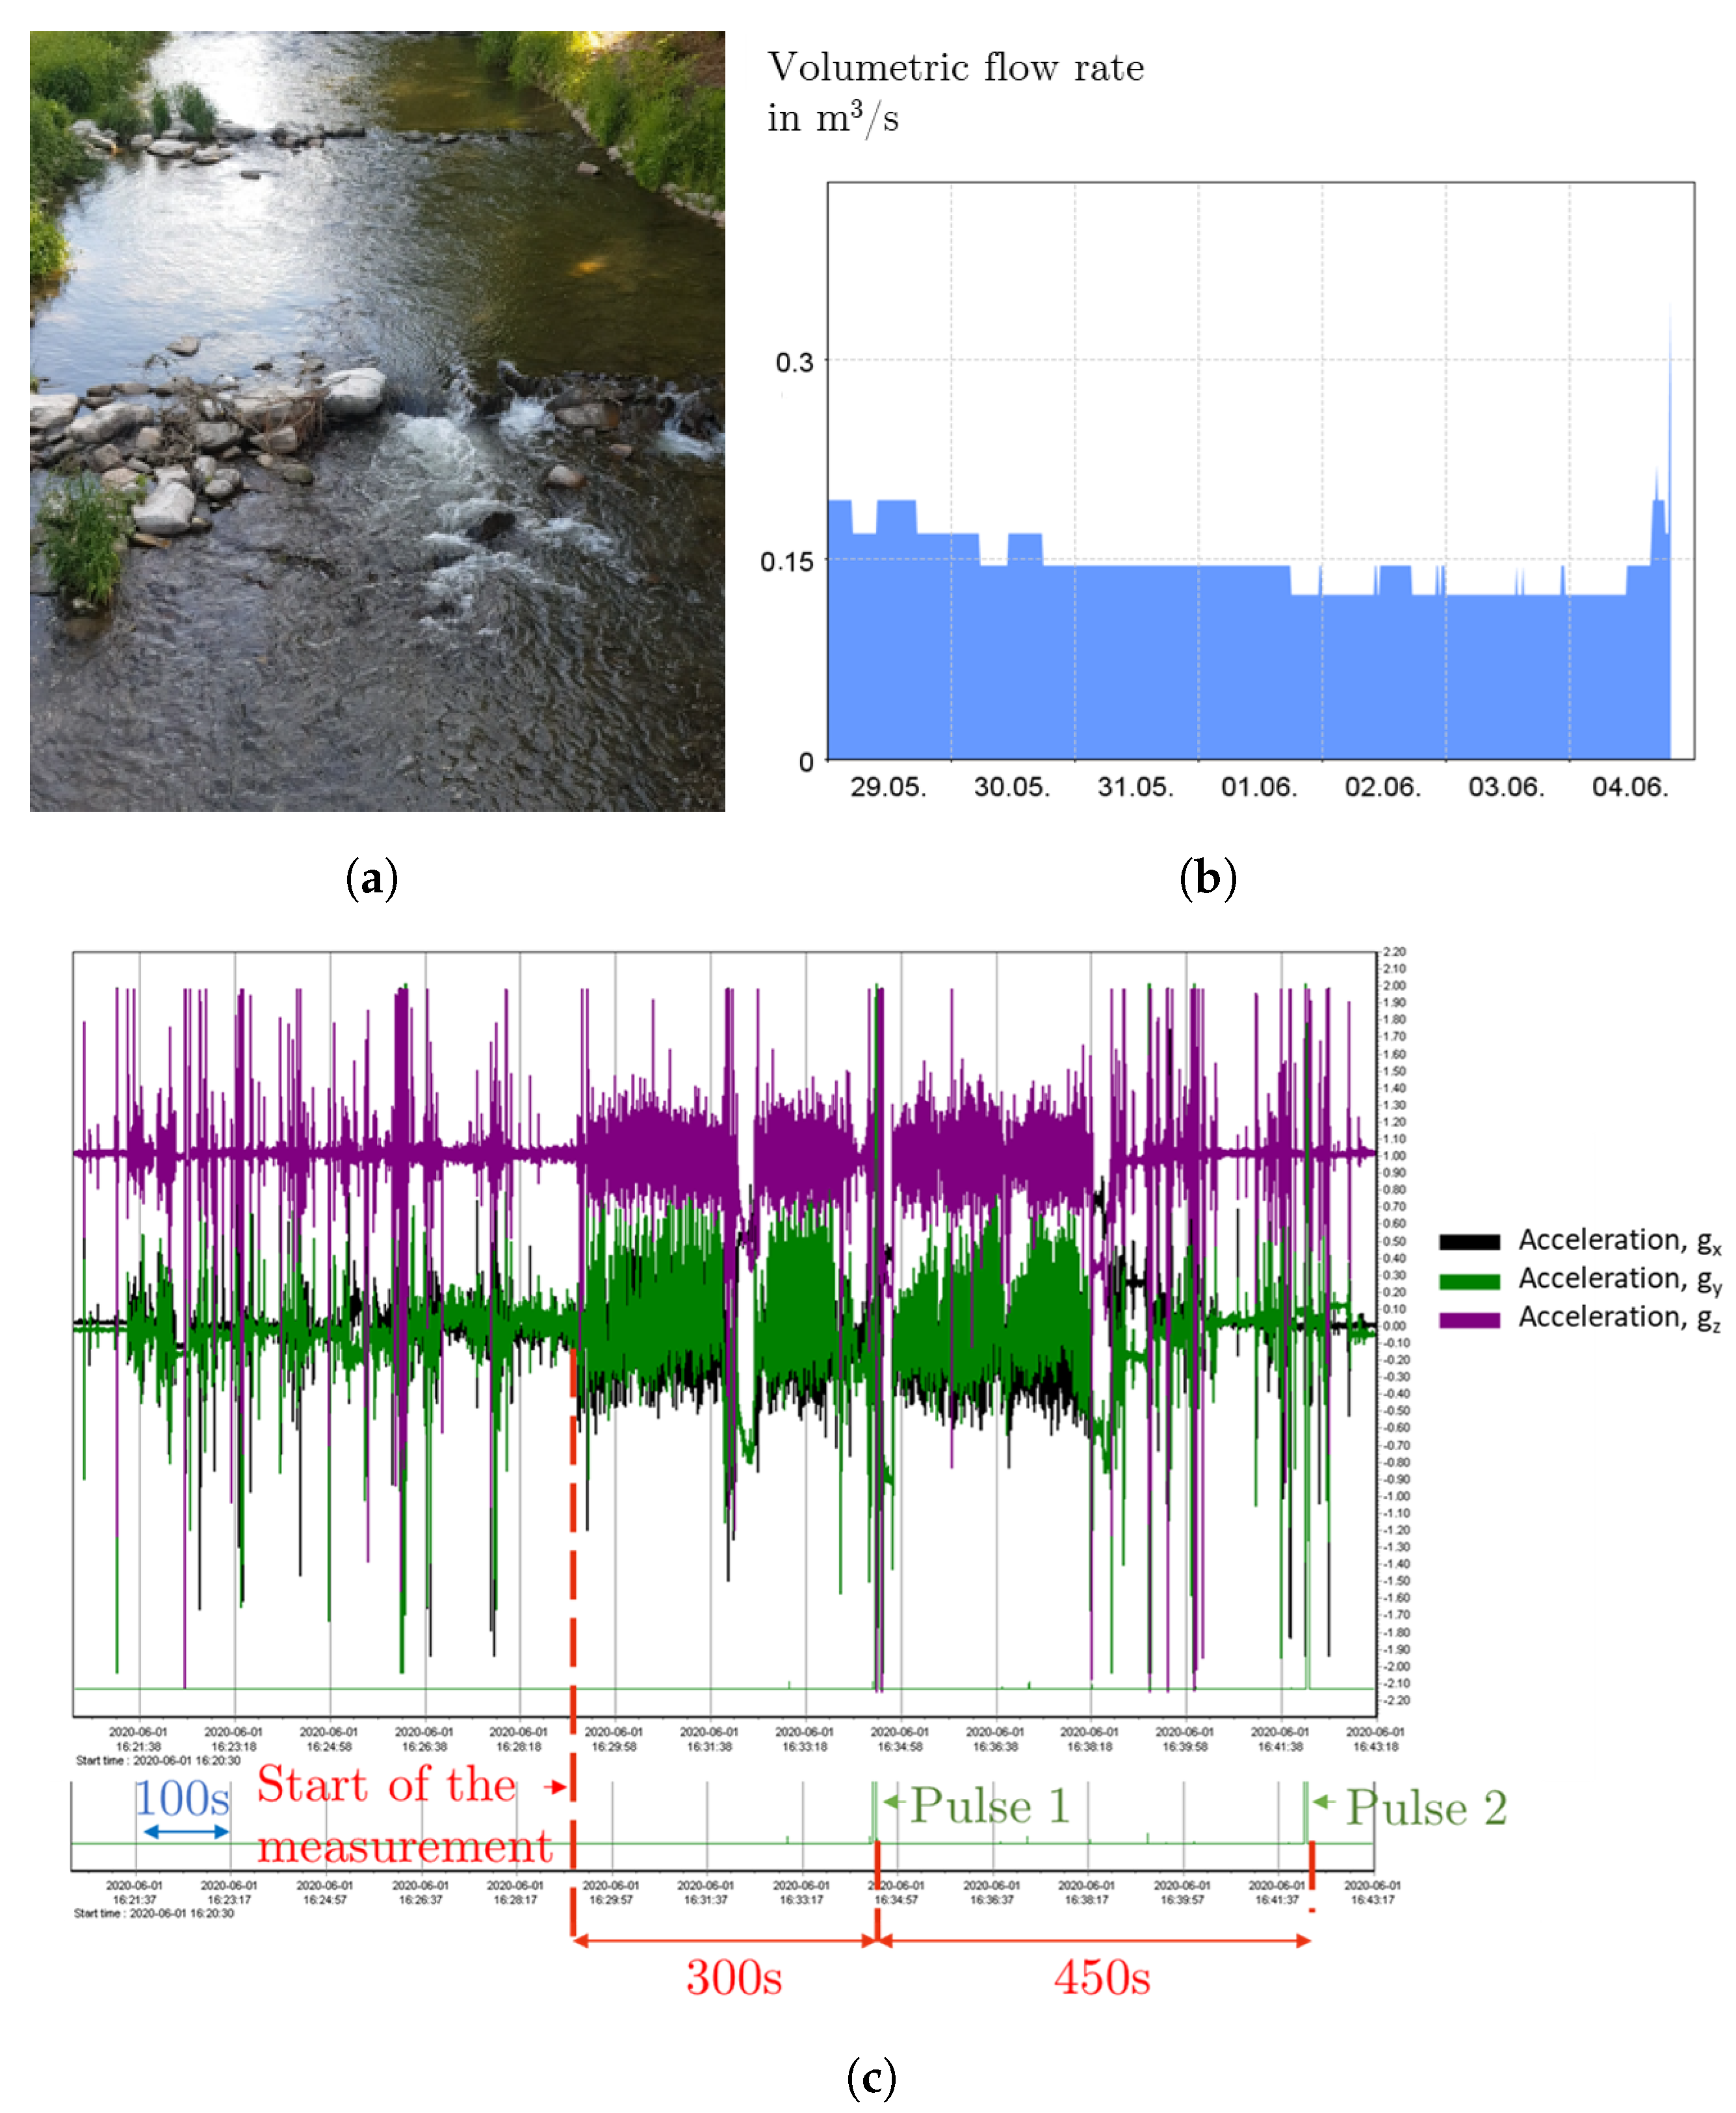
4.2. Field Measurement
5. Discussion
6. Conclusions
7. Patents
Author Contributions
Funding
Conflicts of Interest
Nomenclature
| Symbol/Abbreviation | Description/Meaning |
| Roll angle [°] | |
| Pitch angle [°] | |
| Yaw angle [°] | |
| Reynolds number | |
| Q | Volume flow rate [m/s] |
| l | Length of the river [m] |
| Kinematic viscosity [m/s] | |
| k | Turbulent kinetic energy [J/kg] = [ms] |
| Rate of dissipation of the turbulent kinetic energy [m/s] | |
| CAD | Computer-Aided Design |
| CFD | Computational Fluid Dynamics |
| DC | Direct Current |
| DPEH | Downstream Piezoelectric Energy Harvester |
| FTP | File Transfer Protocol |
| MFC | Micro Fiber Composite |
| PEH | Piezoelectric Energy Harvester |
| PVC | Polyvinyl Chloride |
| RANS | Reynolds-Averaged Navier–Stokes |
| RG50 | Precipitation Sensor |
| SEPIC | Single-Ended Primary Inductance Converter |
| UPEH | Upstream Piezoelectric Energy Harvester |
References
- Rahimzadeh, M.; Samadi, H.; Mohammadi, N. Analysis of Energy Harvesting Enhancement in Piezoelectric Unimorph Cantilevers. Sensors 2021, 21, 8463. [Google Scholar] [CrossRef] [PubMed]
- Kargar, S.; Hao, G. An Atlas of Piezoelectric Energy Harvesters in Oceanic Applications. Sensors 2022, 22, 1949. [Google Scholar] [CrossRef] [PubMed]
- Bradai, S.; Naifar, S.; Kanoun, O. Development of a hybrid vibration converter for real vibration source/Entwicklung eines Hybrid-Vibrationswandlers für eine echte Schwingungsquelle. Tech. Mess. 2019, 86, 57–61. [Google Scholar] [CrossRef]
- Bradai, S.; Naifar, S.; Trigona, C.; Baglio, S.; Kanoun, O. An electromagnetic/magnetoelectric transducer based on nonlinear RMSHI circuit for energy harvesting and sensing. Measurement 2021, 177, 109307. [Google Scholar] [CrossRef]
- Communication from the Commission and Communication from the Commission. In Energy for the Future: Renewable Sources of Energy. White Paper for a Community Strategy and Action Plan; European Union: Maastricht, The Netherlands, 1997; p. 599.
- Pop-Vadean, A.; Pop, P.; Latinovic, T.; Barz, C.; Lung, C. Harvesting energy an sustainable power source, replace batteries for powering WSN and devices on the IoT. IOP Conf. Ser. Mater. Sci. Eng. 2017, 200, 012043. [Google Scholar] [CrossRef] [Green Version]
- Satharasinghe, A.; Hughes-Riley, T.; Dias, T. A Review of Solar Energy Harvesting Electronic Textiles. Sensors 2020, 20, 5938. [Google Scholar] [CrossRef] [PubMed]
- Kishore, R.; Priya, S. A Review on Low-Grade Thermal Energy Harvesting: Materials, Methods and Devices. Materials 2018, 1, 1433. [Google Scholar] [CrossRef] [PubMed] [Green Version]
- Naifar, S.; Bradai, S.; Viehweger, C.; Kanoun, O. Survey of electromagnetic and magnetoelectric vibration energy harvesters for low frequency excitation. Measurement 2017, 106, 251–263. [Google Scholar] [CrossRef]
- Song, R.; Hou, C.; Yang, C.; Yang, X.; Guo, Q.; Shan, X. Modeling, Validation, and Performance of Two Tandem Cylinder Piezoelectric Energy Harvesters in Water Flow. Micromachines 2021, 12, 872. [Google Scholar] [CrossRef] [PubMed]
- Kong, H.; Roussinova, V.; Stoilov, V. Renewable energy harvesting from water flow. Int. J. Environ. Stud. 2018, 76, 84–101. [Google Scholar] [CrossRef]
- Shaikh, F.; Zeadally, S. Energy harvesting in wireless sensor networks: A comprehensive review. Renew. Sustain. Energy Rev. 2016, 55, 1041–1054. [Google Scholar] [CrossRef]
- Raja Singh, R.; Raj Chelliah, T.; Agarwal, P. Power electronics in hydro electric energy systems—A review. Renew. Sustain. Energy Rev. 2014, 32, 944–959. [Google Scholar] [CrossRef]
- Ferrarese, G.; Malavasi, S. Energy Harvesting: Technology, Methods and Applications, 3rd ed.; Williams, R., Ed.; Nova Science Pub Inc.: New York, NY, USA, 2015. [Google Scholar]
- Azevedo, J.; Lopes, J. Energy harvesting from hydroelectric systems for remote sensors. AIMS Energy 2016, 4, 876–893. [Google Scholar] [CrossRef] [Green Version]
- Morais, R.; Matos, S.; Fernandes, M.; Valente, A.; Soares, S.; Ferreira, P.; Reis, M. Sun, wind and water flow as energy supply for small stationary data acquisition platforms. Comput. Electron. Agric. 2008, 64, 120–132. [Google Scholar] [CrossRef]
- Taylor, G.; Burns, J.; Kammann, S.; Powers, W.; Welsh, T. The Energy Harvesting Eel: A small subsurface ocean/river power generator. IEEE J. Ocean. Eng. 2001, 26, 539–547. [Google Scholar] [CrossRef] [Green Version]
- Kamenar, E.; Zelenika, S.; Blazevic, D.; Samanic, I. River flow energy harvesting by employing piezoelectric eels. In Proceedings of the 14th EUSPEN International Conference, Dubrovnik, Croatia, 2–6 June 2014; Volume 1, pp. 63–66. [Google Scholar]
- Shan, X.; Song, R.; Liu, B.; Xie, T. Novel energy harvesting: A macro fiber composite piezoelectric energy harvester in the water vortex. Ceram. Int. 2015, 41, S763–S767. [Google Scholar] [CrossRef]
- Song, R.; Shan, X.; Lv, F.; Xie, T. A study of vortex-induced energy harvesting from water using PZT piezoelectric cantilever with cylindrical extension. Ceram. Int. 2015, 41, S768–S773. [Google Scholar] [CrossRef]
- HY2120 Data Sheet 2-Cell Lithium-ion/ Polymer Battery Packs Protection ICs. Available online: https://www.hycontek.com/wp-content/uploads/DS-HY2120_EN.pdf (accessed on 22 May 2022).


| Component | Parameter | Value |
|---|---|---|
| Pendulum | Weight | 850 g |
| Diameter | 25 cm | |
| Weight of the added mass | 490 g | |
| Gears | Transmission ratio spring-generator | 0.0211 |
| Transmission ratio pendulum-spring | 1 | |
| Spring | Material | X10CrNi18-8 |
| Spring rate | 0–3.5 N·m | |
| Plate thickness | 0.2 mm | |
| Plate width | 10 mm | |
| Outer diameter | 48 mm | |
| Inner diameter | 20 mm | |
| DC generator | Rotor Inertia | 1.68 × 10 kg·m |
| Armature resistance | 13 | |
| Armature inductance | 0.009 H | |
| Torque constant | 0.00963 N·m/A |
| Type of Load | Number of Events | Current Consumption per Event in mAh | Total Current Consumption in mAh |
|---|---|---|---|
| FTP push | 1 | 1.28330 | 1.28330 |
| Logging | 2 | 0.00143 | 0.00285 |
| Time slot | 0.143 | 4.79140 | 0.68517 |
| Rain pulses | 100.000 | 0.00069 | 0.06900 |
| Quiescent current | - | - | 2.16000 |
| Daily current consumption | - | - | 4.200 |
| Type of Load | Number of Events | Current Consumption per Event in mAh | Total Current Consumption in mAh |
|---|---|---|---|
| FTP push | 1 | 0.83140 | 0.83140 |
| Logging | 2 | 0.00085 | 0.00170 |
| Time slot | 0.143 | 2.20955 | 0.31597 |
| Rain pulses | 100.000 | 0.00034 | 0.03400 |
| Quiescent current | - | - | 2.04000 |
| Daily current consumption | - | - | 3.223 |
| Component | Number | Details |
|---|---|---|
| L-ion battery | 2 | 3.7 V 3000 mAh Samsung ICR18650-30B |
| Voltage protection module | 1 | Overcharge voltage: 4.25–4.35 V ± 0.05 V Over discharge voltage: 2.3–3.0 V ± 0.05 V Maximum continuous current: 3 A Maximum peak current: 5 A |
| Constant-current/ constant-voltage battery charger | 1 | Based on LT1512 Output voltage: 8.4 V Minimum input voltage: 2 V |
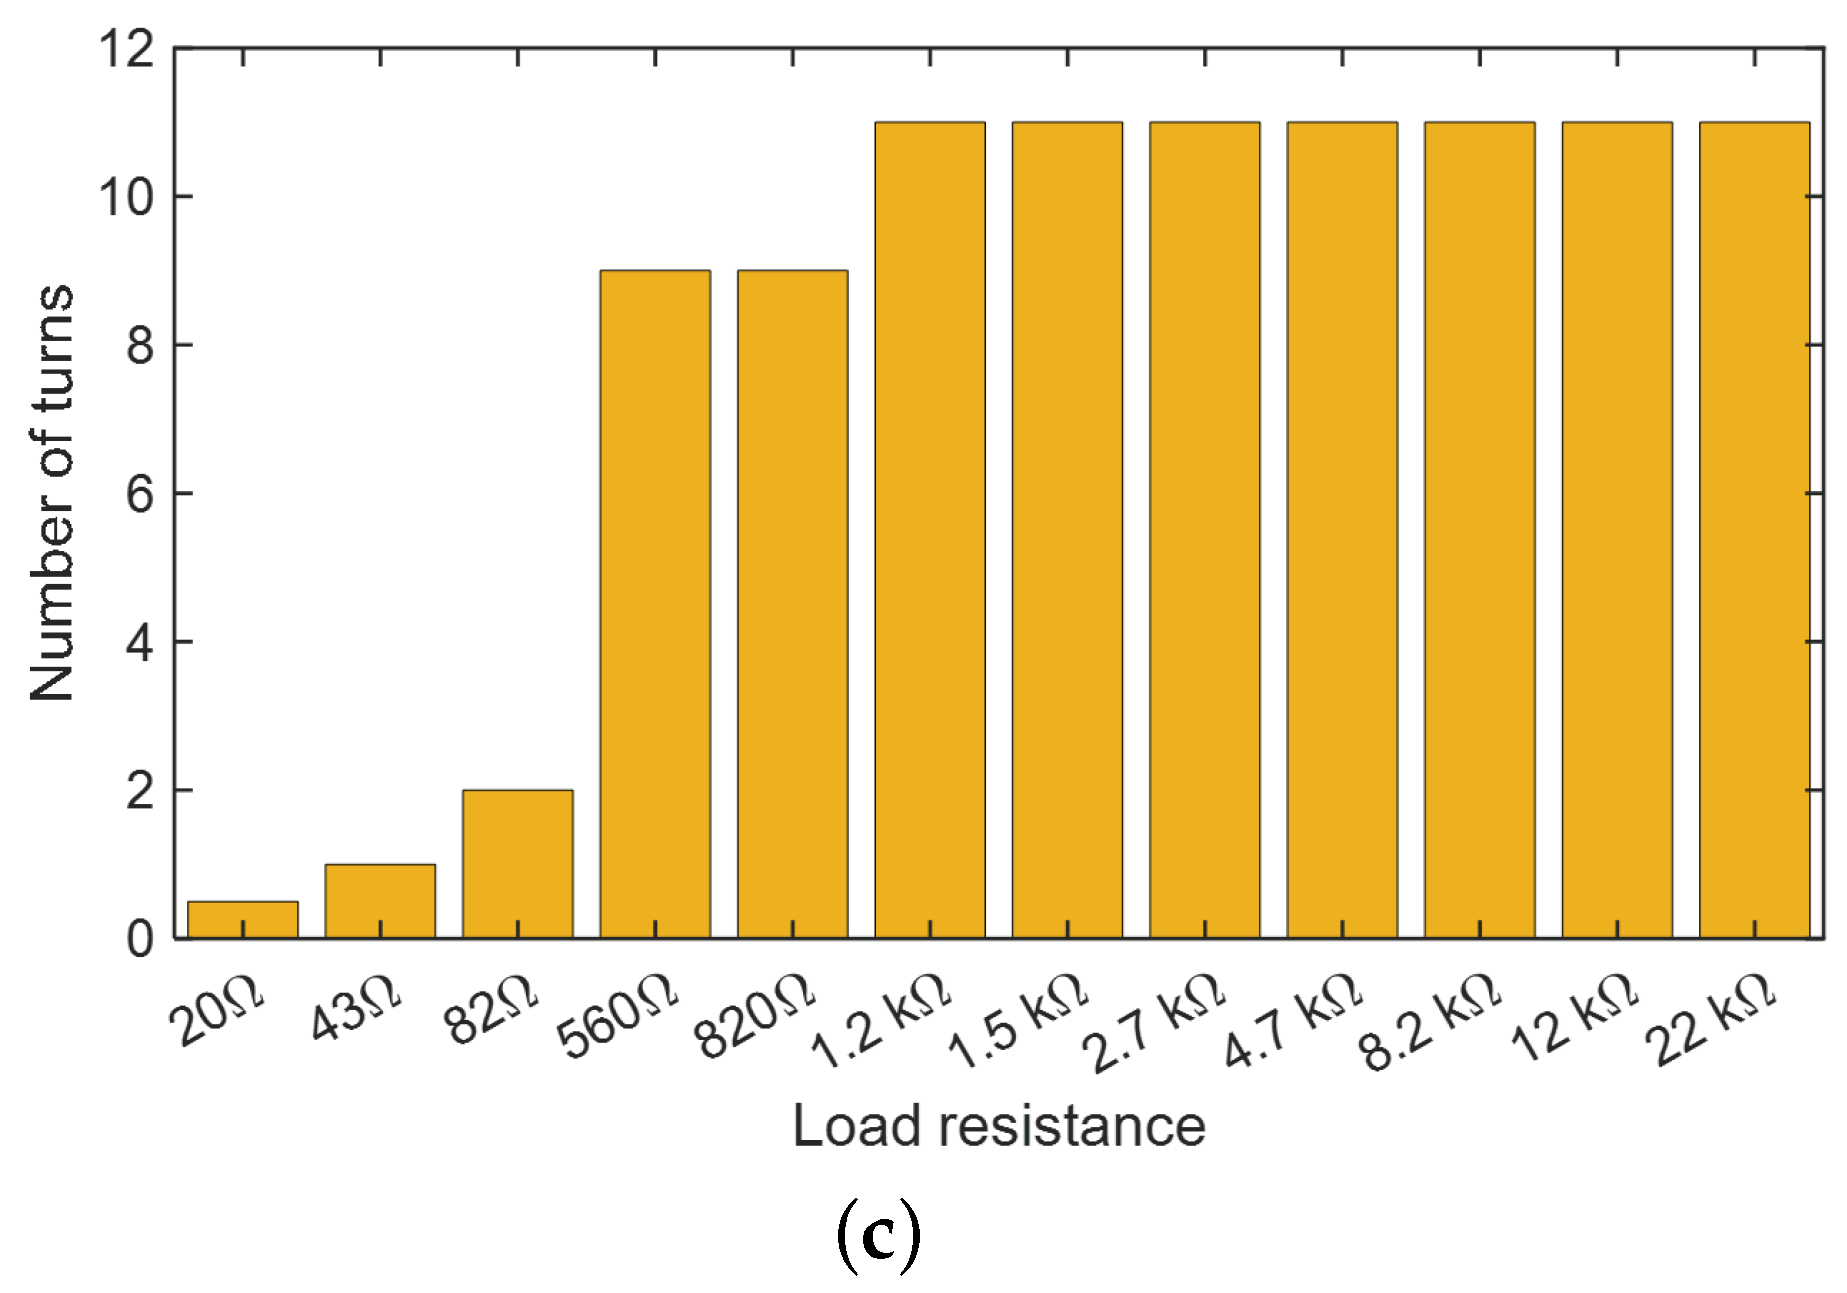
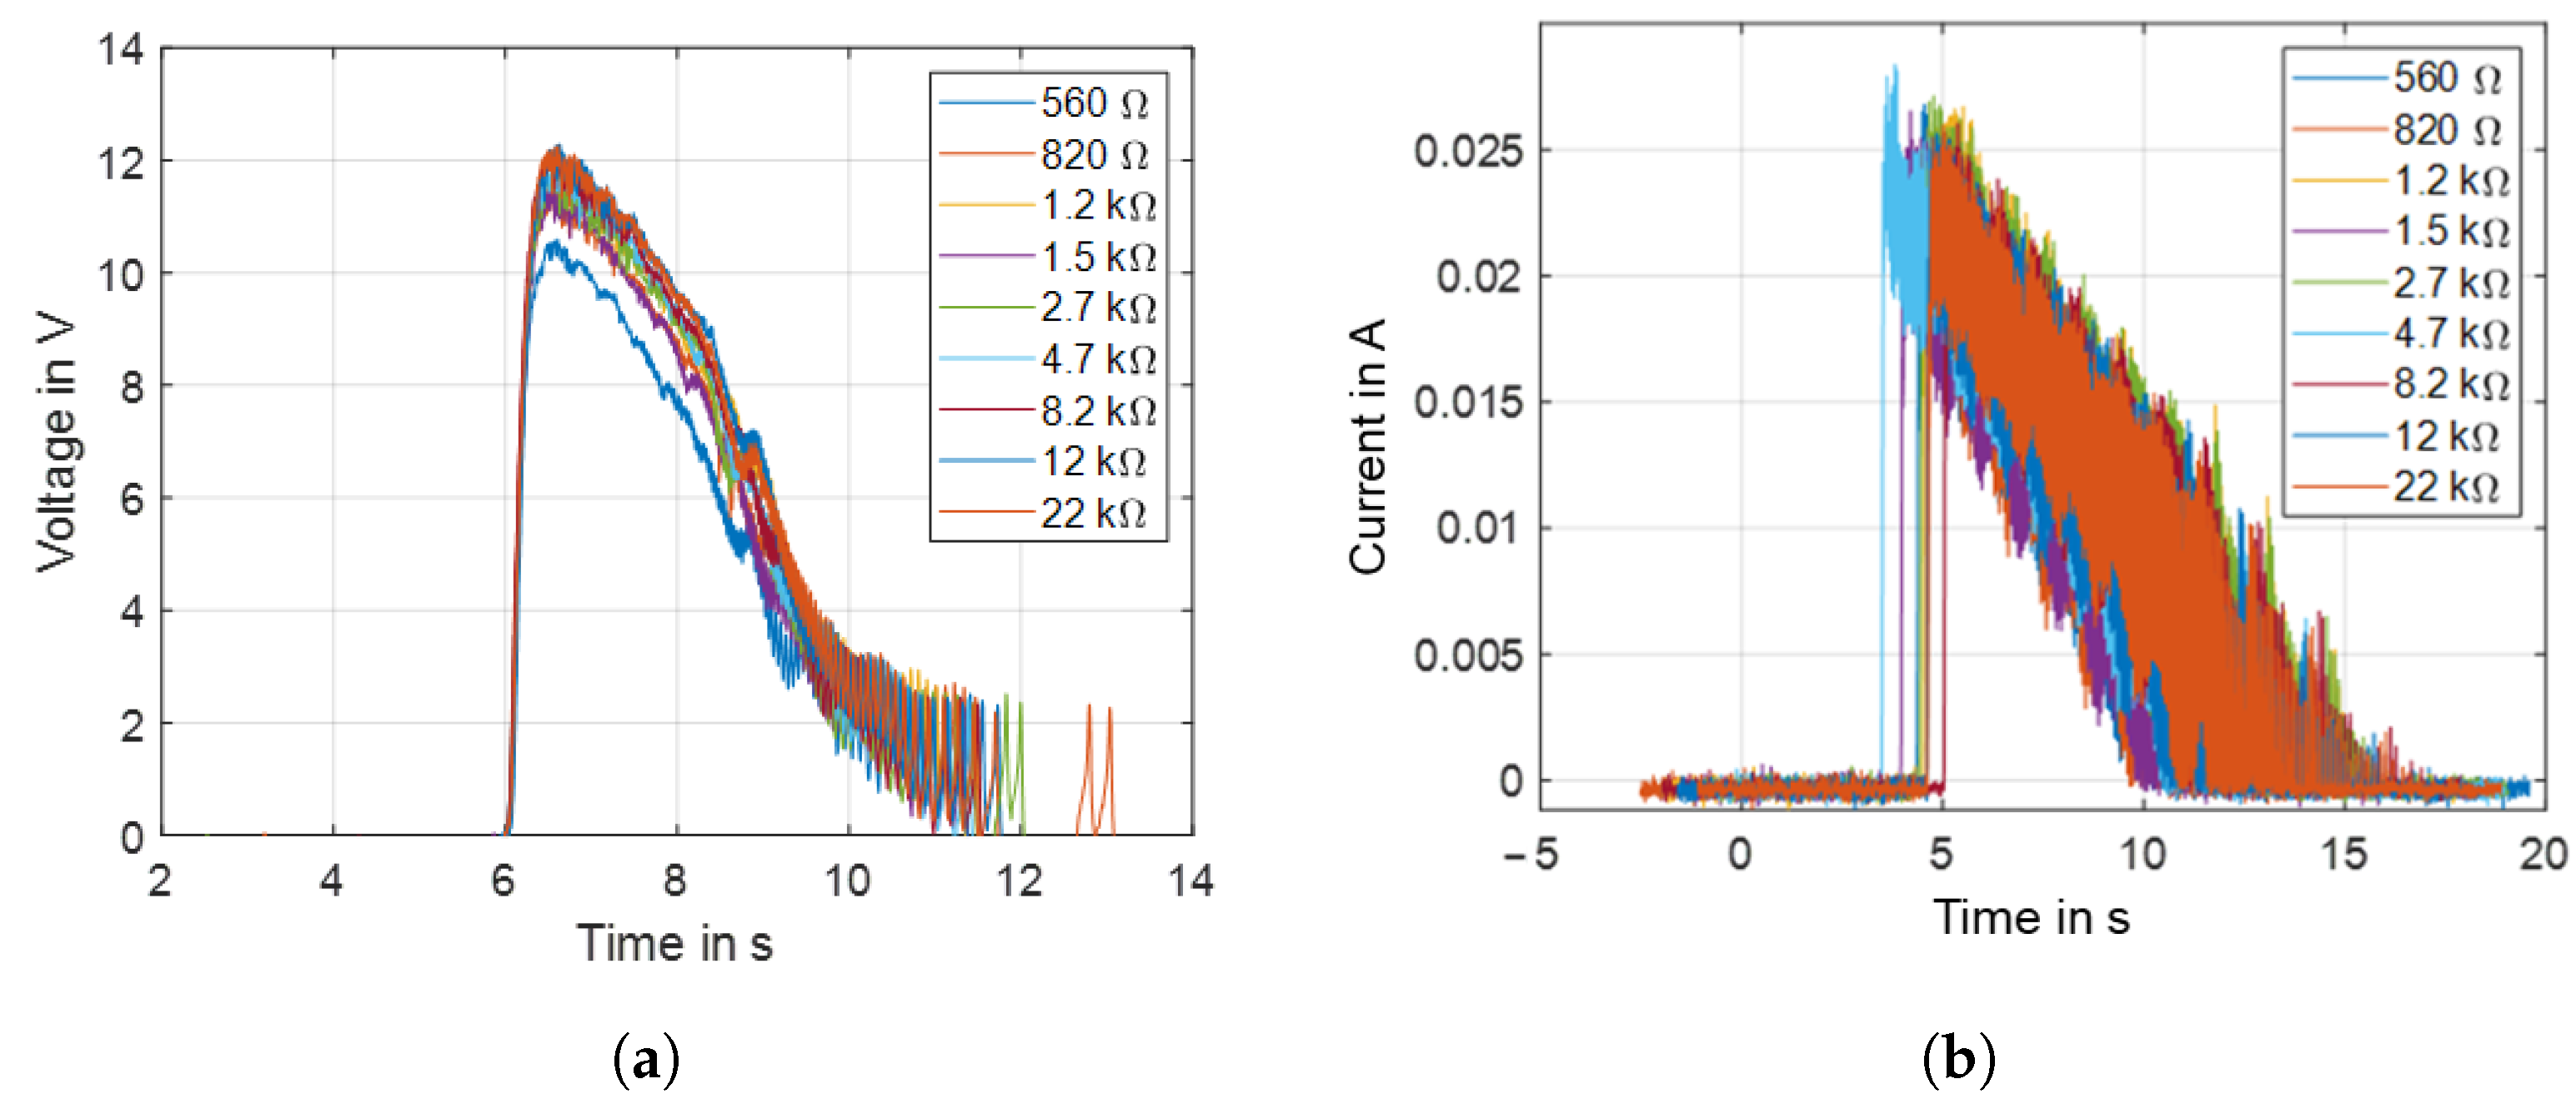
| Load Resistance | Required Turns of the Pendulum before Release | Harvested Power per Pulse at 8.4 V in mAh | Harvested Power per Pendulum Turn at 8.4 V in mAh |
|---|---|---|---|
| 20 | not working | 0 | 0 |
| 43 | working continuously | 0.0012 | 0 |
| 82 | 1 | 0.0058 | 0.0058 |
| 560 | 9 | 0.0228 | 0.0025 |
| 820 | 9 | 0.0206 | 0.0023 |
| 1.2 k | 11 | 0.0287 | 0.0026 |
| 1.5 k | 11 | 0.0241 | 0.0021 |
| 2.7 k | 11 | 0.0294 | 0.0026 |
| 4.7 k | 11 | 0.0303 | 0.0027 |
| 8.2 k | 11 | 0.0250 | 0.0022 |
| 12 k | 11 | 0.0249 | 0.0022 |
| 22 k | 11 | 0.0265 | 0.0024 |
| Time between Pulses in Minutes | Harvested Electric Charge at 7 V in mAh in Year | Estimated System Lifetime in Year |
|---|---|---|
| 5 | 3153 | unlimited |
| 6 | 2628 | unlimited |
| 7 | 2253 | unlimited |
| 8 | 1971 | unlimited |
| 9 | 1752 | unlimited |
| 10 | 1576 | unlimited |
| 20 | 788 | 6.5 |
| 30 | 525 | 4.7 |
| 0 | 0 | 3.14 |
Publisher’s Note: MDPI stays neutral with regard to jurisdictional claims in published maps and institutional affiliations. |
© 2022 by the authors. Licensee MDPI, Basel, Switzerland. This article is an open access article distributed under the terms and conditions of the Creative Commons Attribution (CC BY) license (https://creativecommons.org/licenses/by/4.0/).
Share and Cite
Naifar, S.; Grimmeisen, F.; Viehweger, C.; Hu, Z.; Bauer, A.; Hörschelmann, P.; Kanoun, O. Pendulum-Based River Current Energy Converter for Hydrometric Monitoring Systems. Sensors 2022, 22, 4246. https://doi.org/10.3390/s22114246
Naifar S, Grimmeisen F, Viehweger C, Hu Z, Bauer A, Hörschelmann P, Kanoun O. Pendulum-Based River Current Energy Converter for Hydrometric Monitoring Systems. Sensors. 2022; 22(11):4246. https://doi.org/10.3390/s22114246
Chicago/Turabian StyleNaifar, Slim, Felix Grimmeisen, Christian Viehweger, Zheng Hu, Arthur Bauer, Peter Hörschelmann, and Olfa Kanoun. 2022. "Pendulum-Based River Current Energy Converter for Hydrometric Monitoring Systems" Sensors 22, no. 11: 4246. https://doi.org/10.3390/s22114246