Author Contributions
Conceptualization, H.Y. and Y.W.; data curation, Z.Y.; formal analysis, H.Y.; funding acquisition, L.W.; methodology, H.Y. and W.Z.; writing—original draft, H.Y. and Y.A.; writing—review and editing, Y.W. and L.W. All authors have read and agreed to the published version of the manuscript.
Figure 1.
PEH road. (a) Schematic of PEH road; (b) schematic of internal force of the PEH.
Figure 1.
PEH road. (a) Schematic of PEH road; (b) schematic of internal force of the PEH.
Figure 2.
The PEH designed for road energy harvesting.
Figure 2.
The PEH designed for road energy harvesting.
Figure 3.
Connection mode of multilayer stacked piezoelectric ceramics. (a) Series connection mode; (b) parallel connection mode.
Figure 3.
Connection mode of multilayer stacked piezoelectric ceramics. (a) Series connection mode; (b) parallel connection mode.
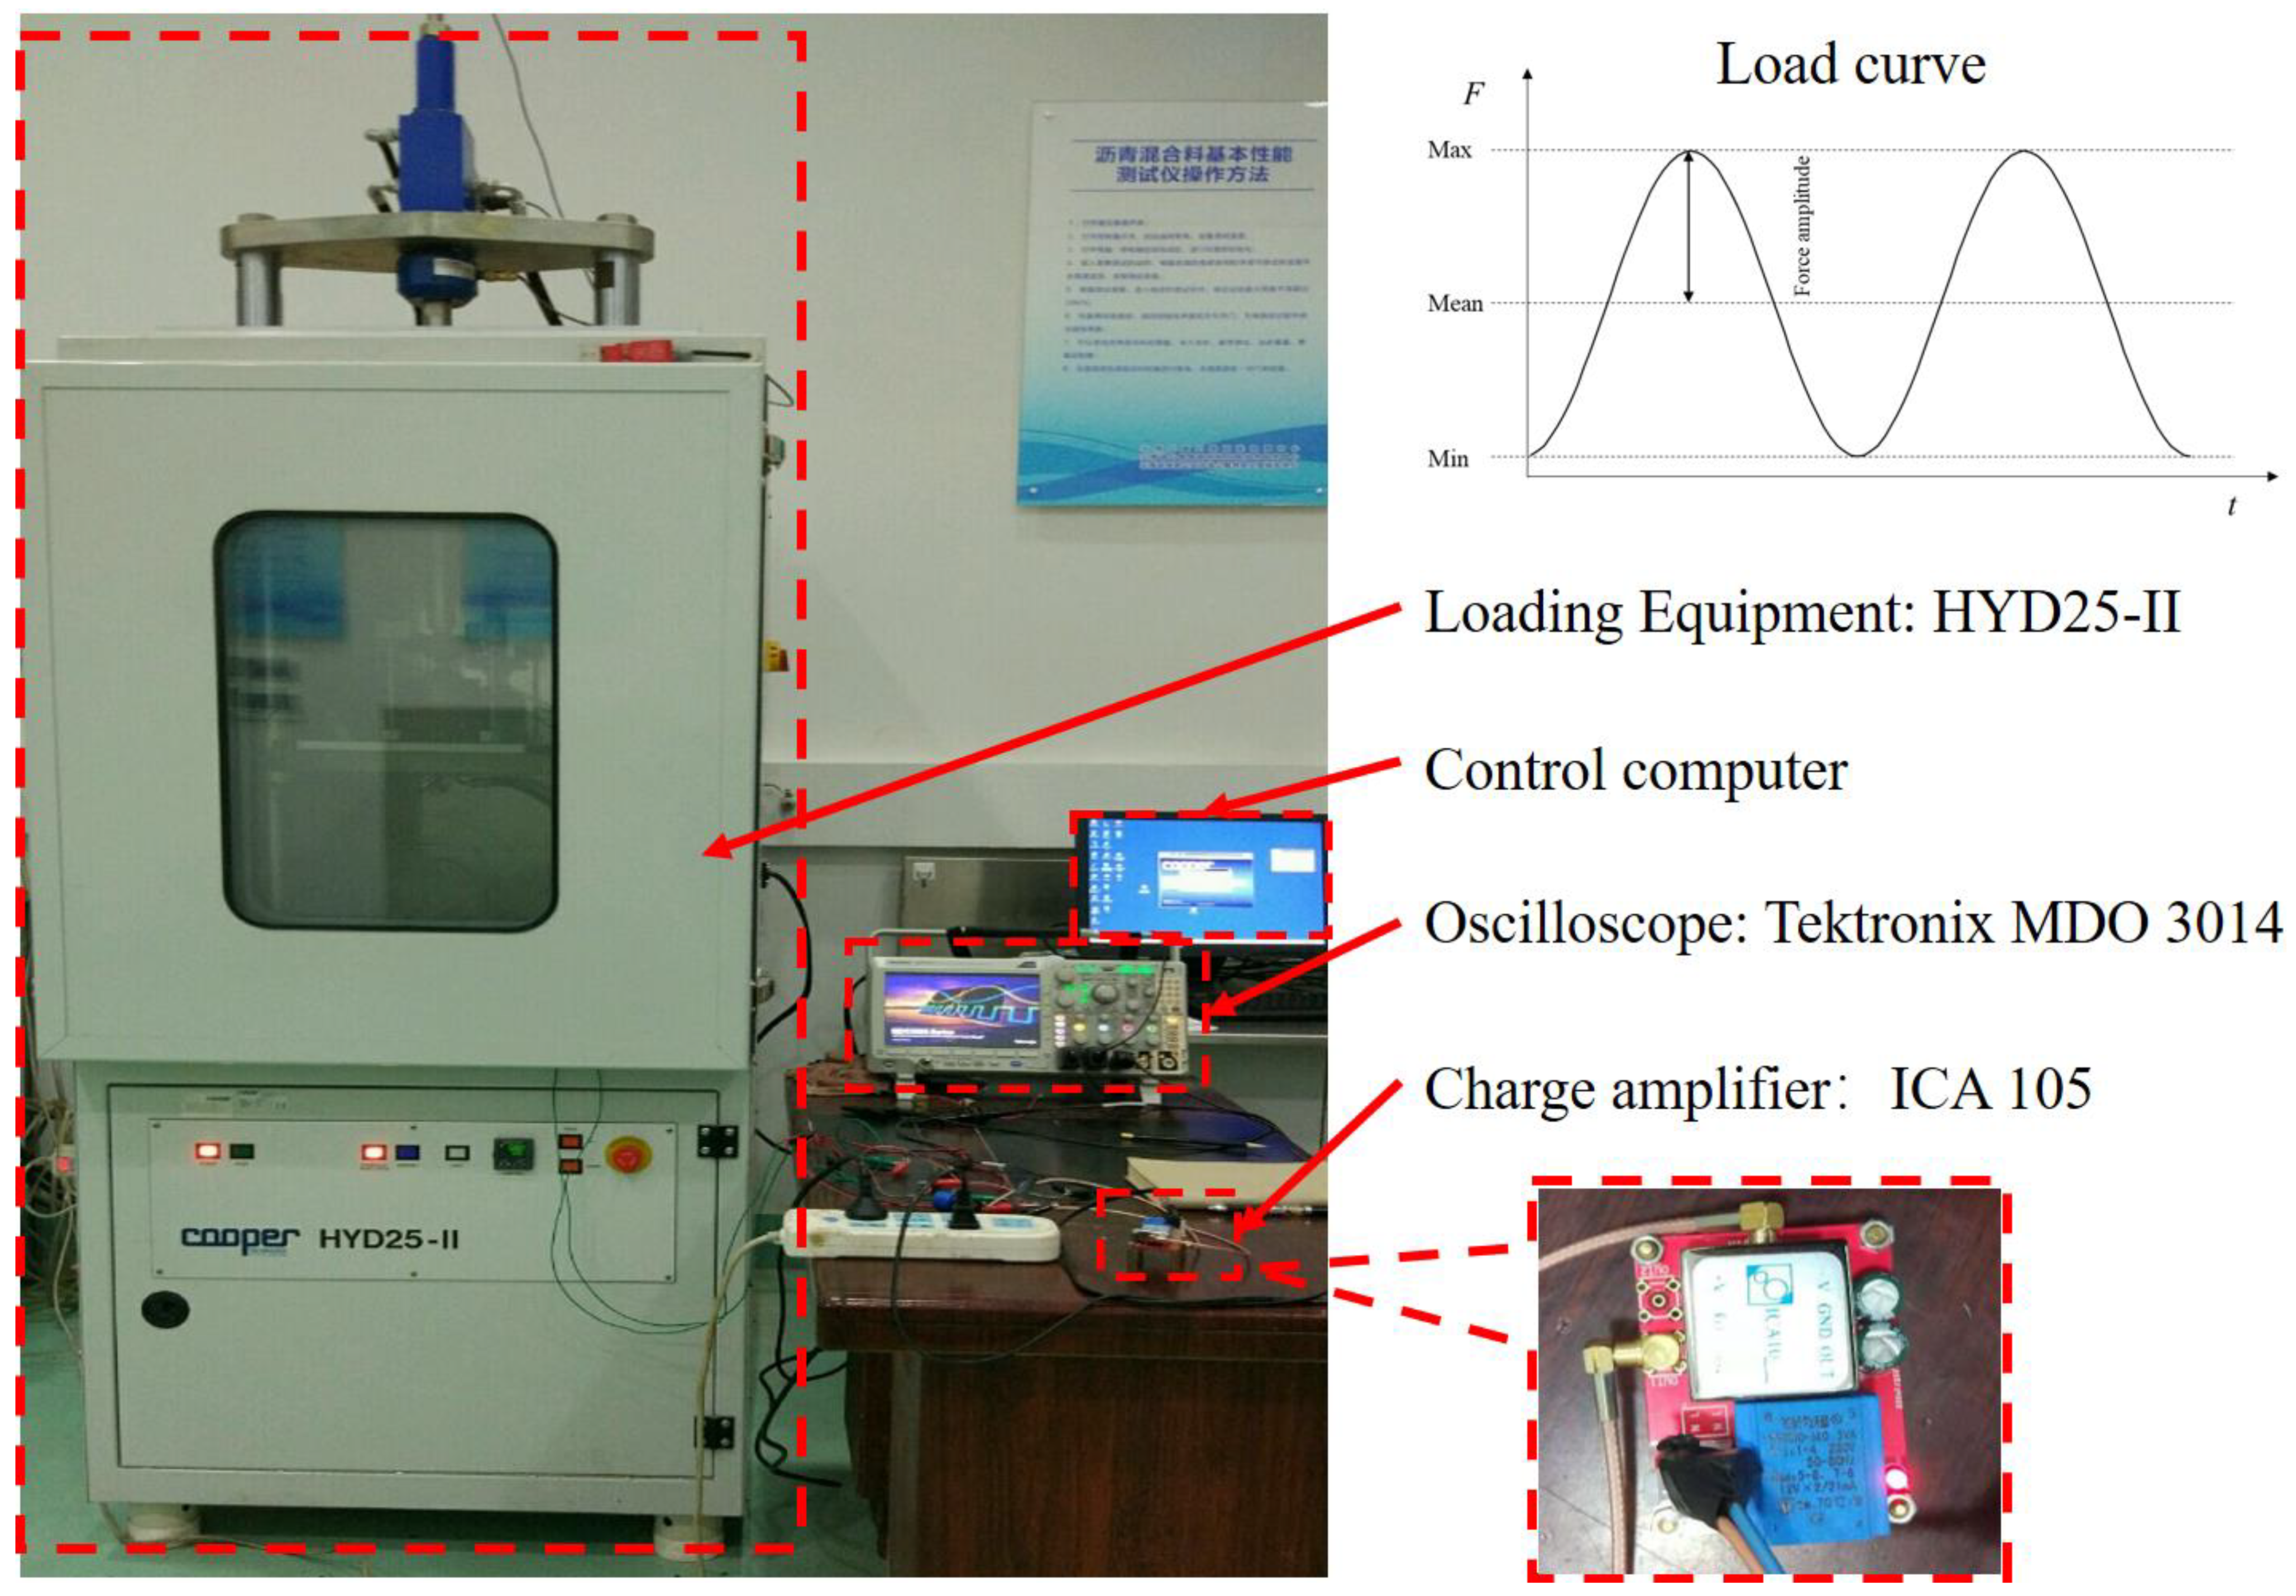
Figure 4.
The test system.
Figure 4.
The test system.
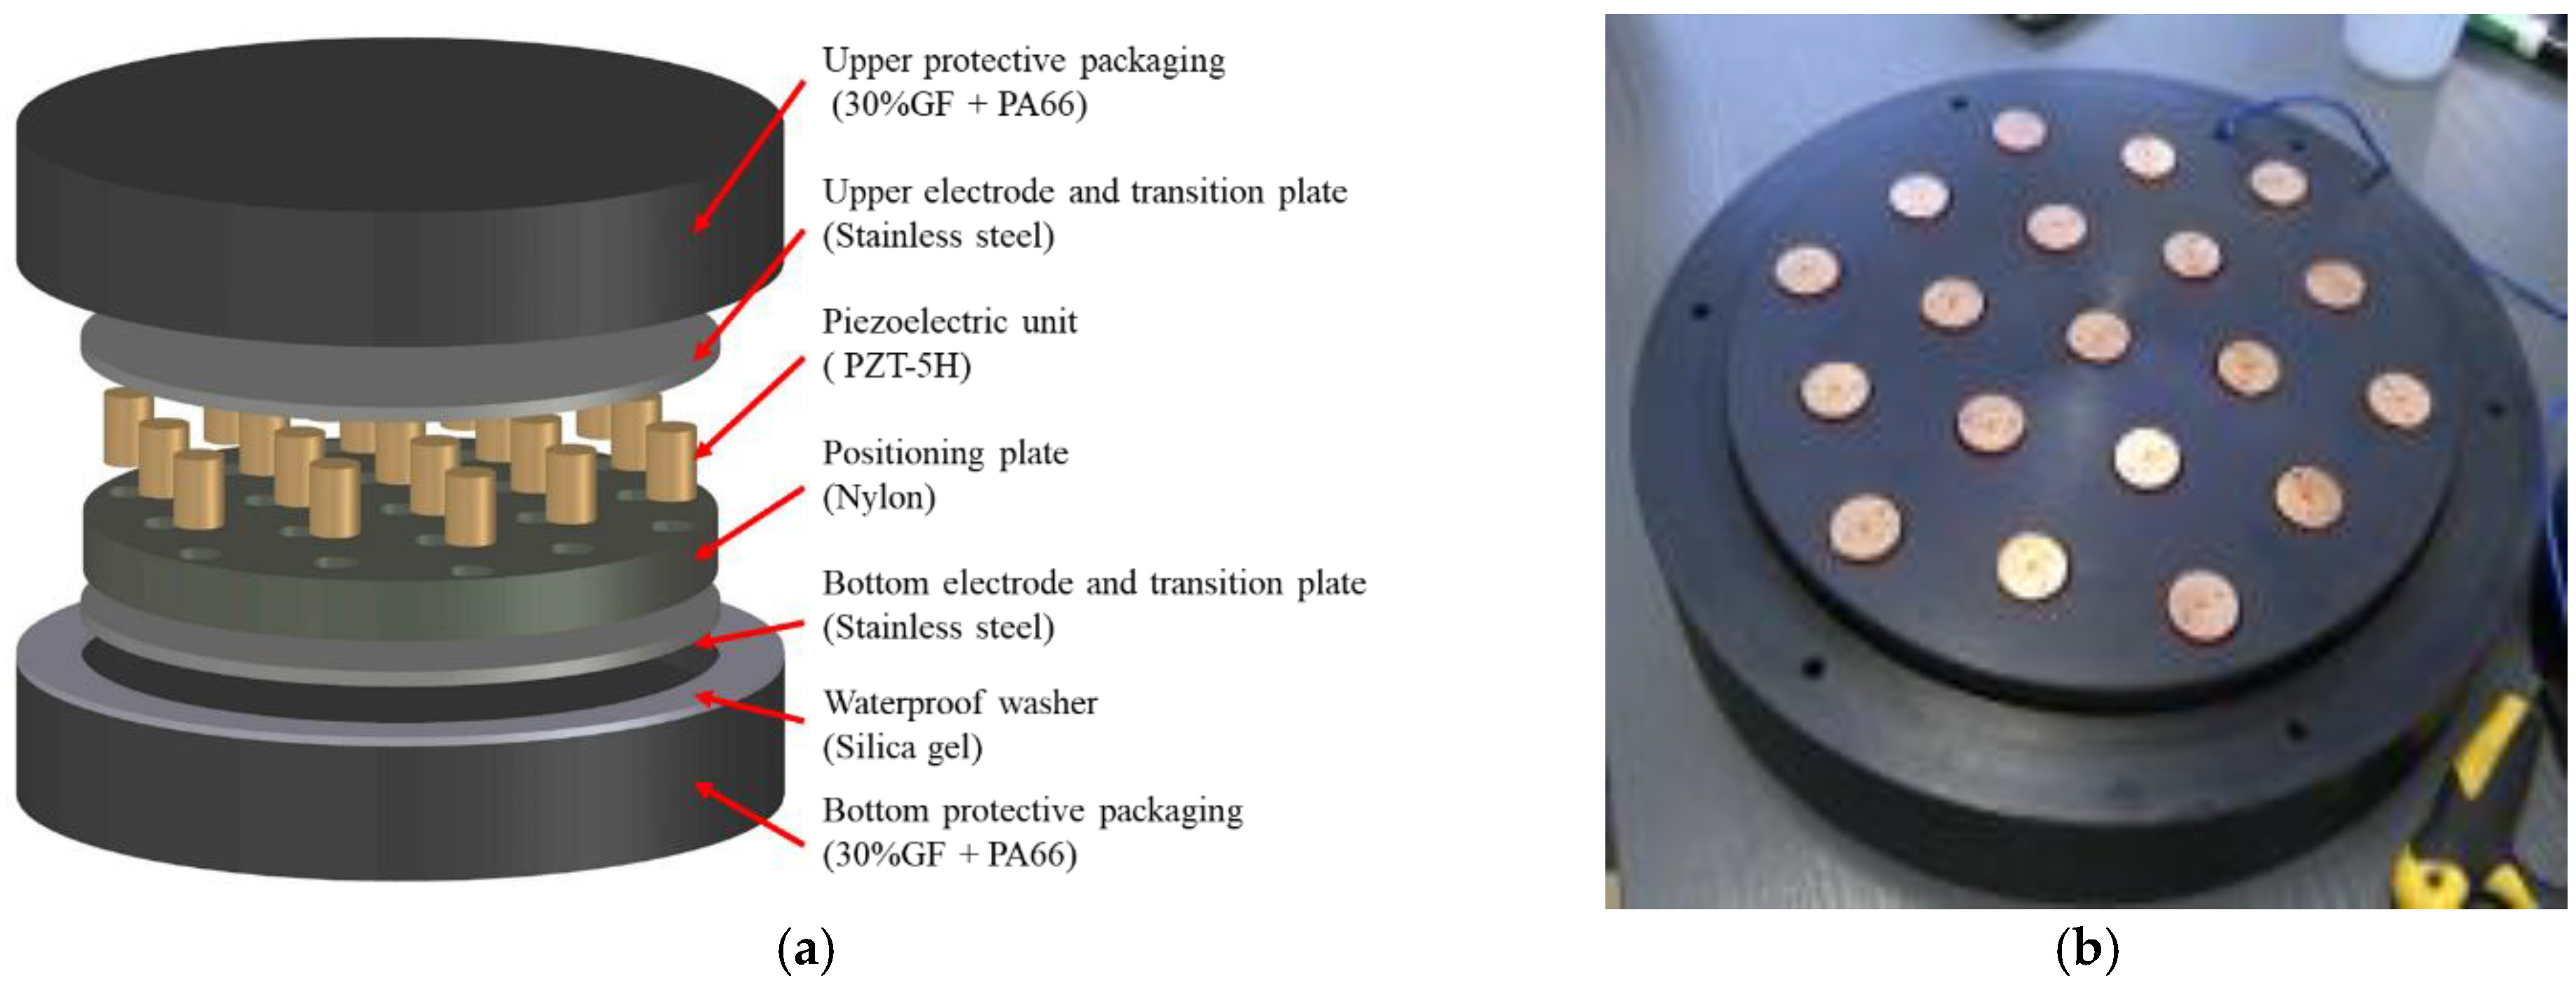
Figure 5.
Structure of the PEH. (a) Diagram of the PEH. (b) Arrangement of piezoelectric units in the PEH.
Figure 5.
Structure of the PEH. (a) Diagram of the PEH. (b) Arrangement of piezoelectric units in the PEH.
Figure 6.
Diagram of the laboratory pavement loading test.
Figure 6.
Diagram of the laboratory pavement loading test.
Figure 7.
Piezoelectric energy collection circuit. (a) Schematic of the circuit. (b) The PCB of the circuit.
Figure 7.
Piezoelectric energy collection circuit. (a) Schematic of the circuit. (b) The PCB of the circuit.
Figure 8.
The specimens of Test A.
Figure 8.
The specimens of Test A.
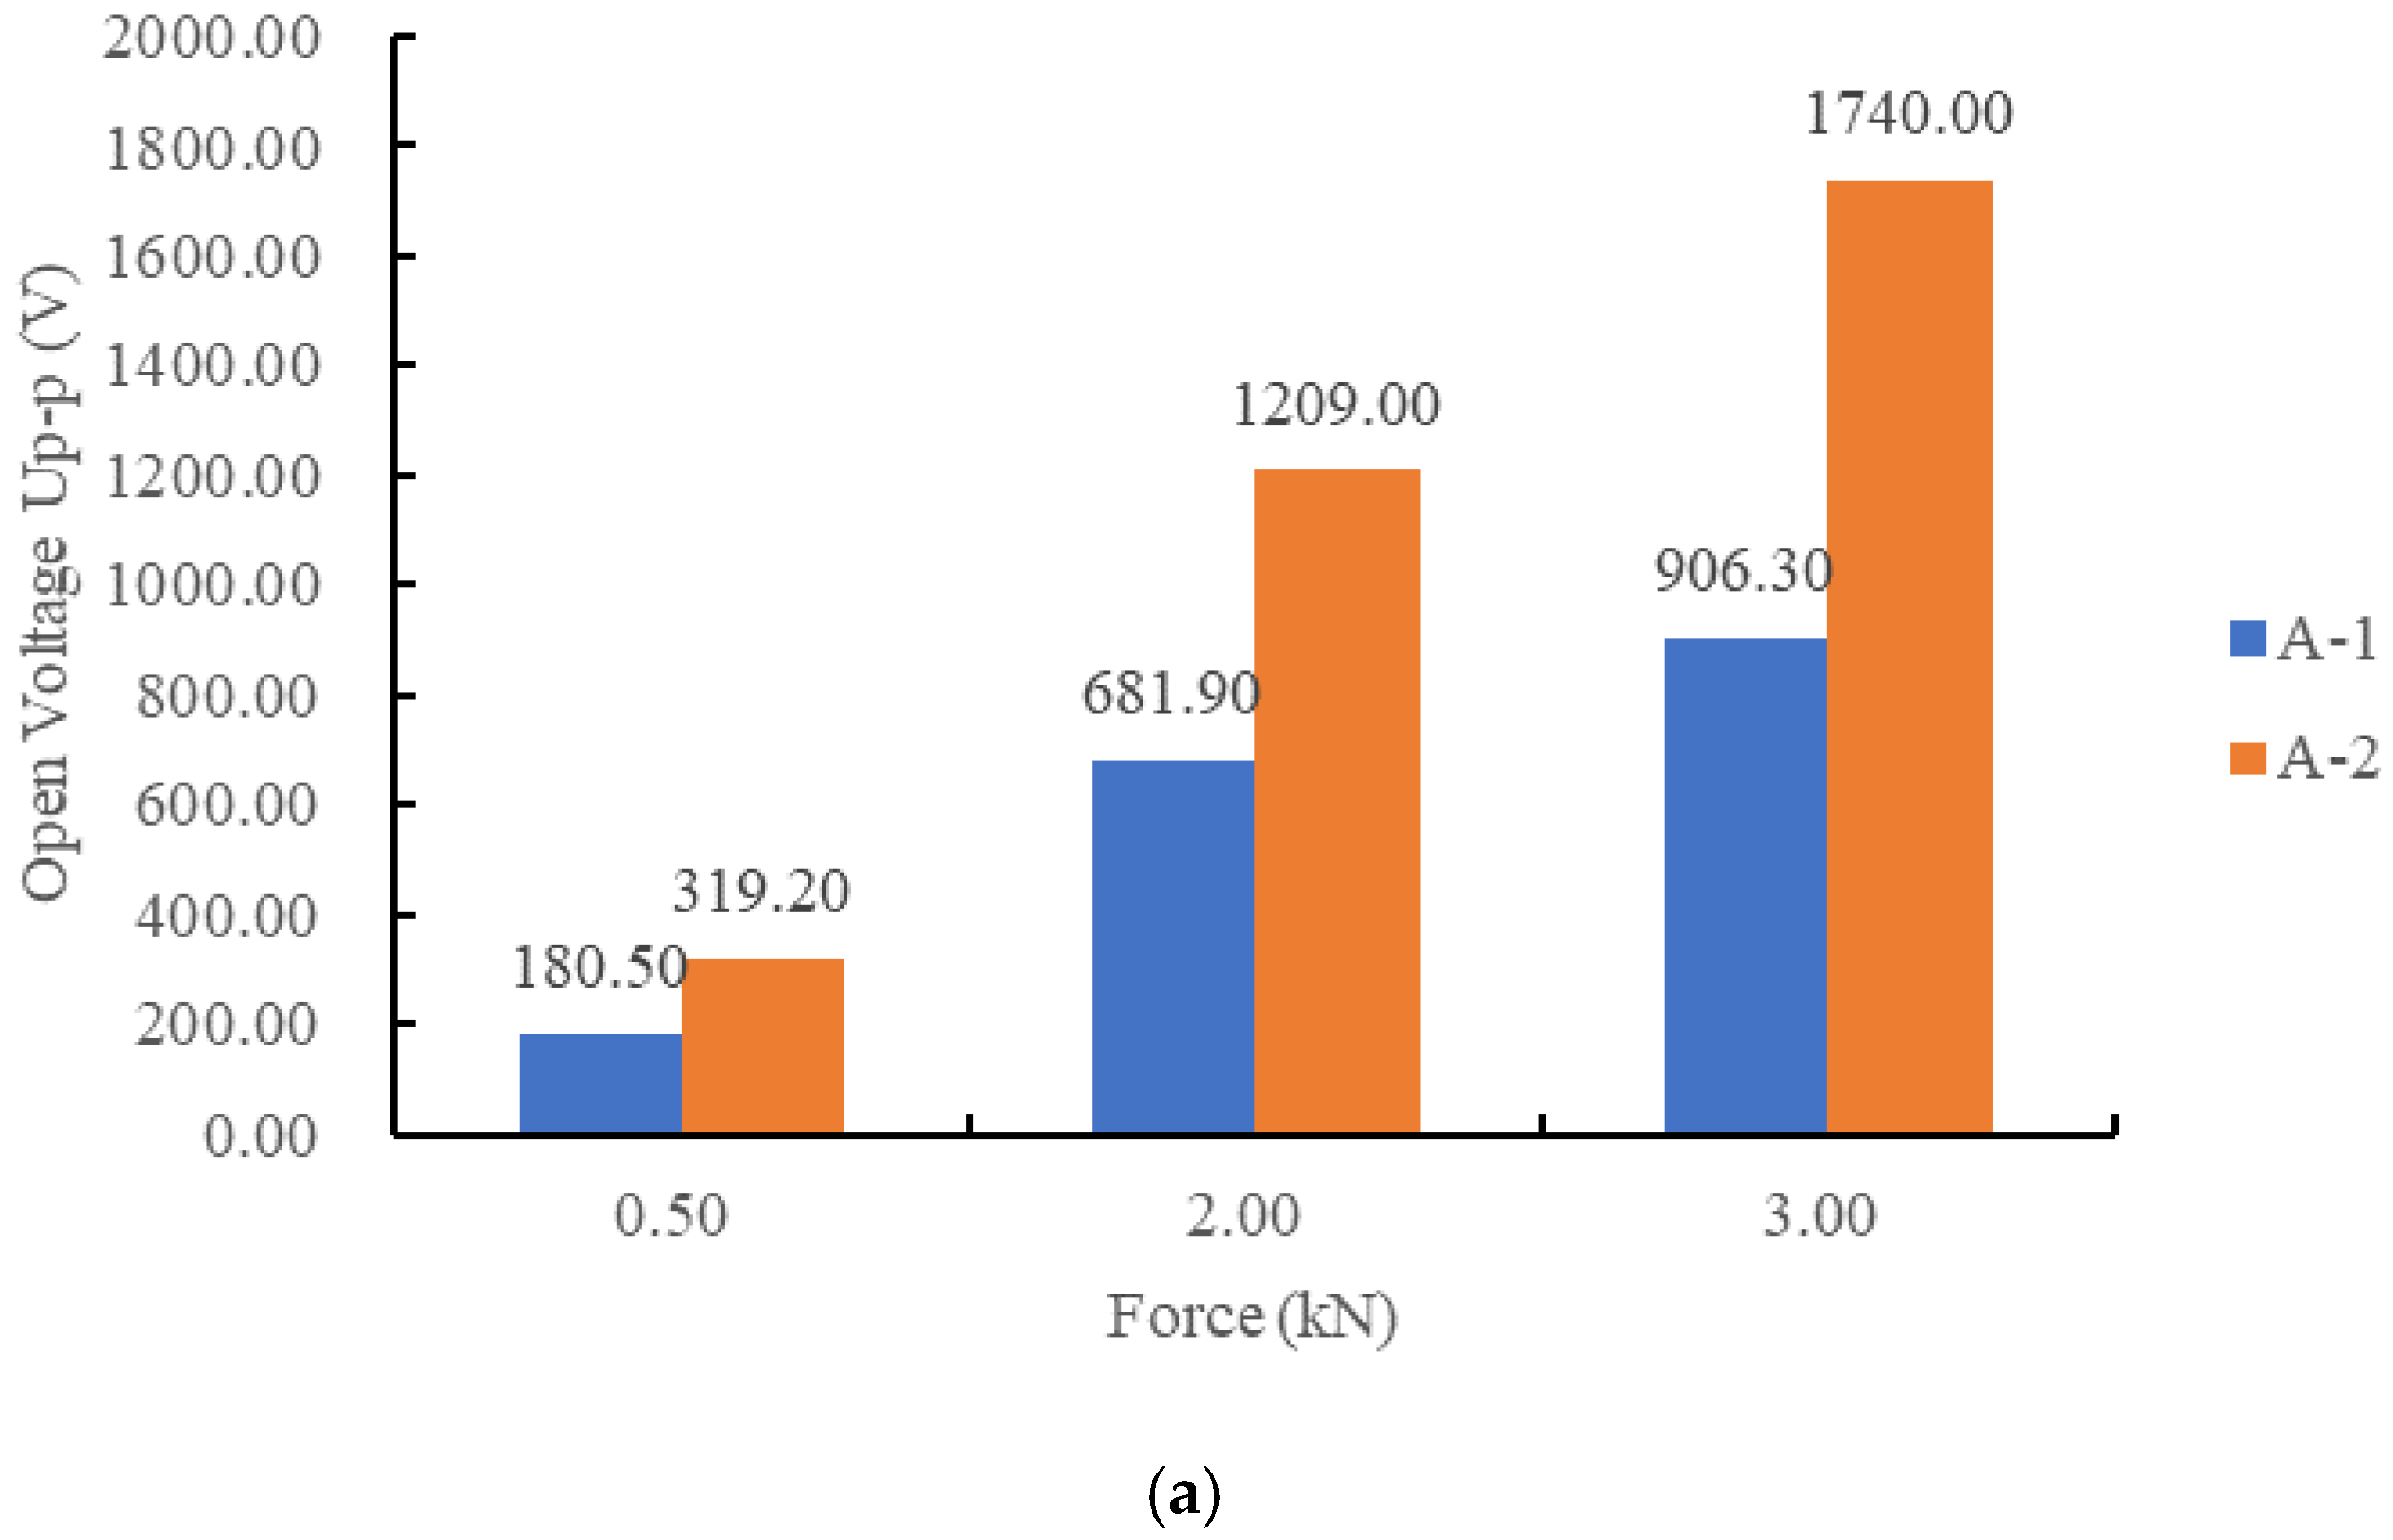
Figure 9.
Comparison of electrical properties of different connection modes: (a) open peak–peak voltages of A-1 and A-2; (b) charge variations of A-1 and A-2; (c) generated electrical energy of A-1 and A-2.
Figure 9.
Comparison of electrical properties of different connection modes: (a) open peak–peak voltages of A-1 and A-2; (b) charge variations of A-1 and A-2; (c) generated electrical energy of A-1 and A-2.
Figure 10.
The specimens of Test B.
Figure 10.
The specimens of Test B.
Figure 11.
Comparison of electrical properties of stack piezoelectric units with different layers: (a) the open peak–peak voltage of B-1, B-2 and B-3; (b) charge variation of B-1, B-2 and B-3; (c) generated electric energy of B-1, B-2 and B-3.
Figure 11.
Comparison of electrical properties of stack piezoelectric units with different layers: (a) the open peak–peak voltage of B-1, B-2 and B-3; (b) charge variation of B-1, B-2 and B-3; (c) generated electric energy of B-1, B-2 and B-3.
Figure 12.
The specimens of test C.
Figure 12.
The specimens of test C.
Figure 13.
Comparison of electrical properties of stack piezoelectric unites with the same volume and different height to cross section ratio: (a) the open peak–peak voltage of C-1, C-2 and C-3; (b) charge variation of C-1, C-2 and C-3; (c) generated electrical energy of C-1, C-2 and C-3.
Figure 13.
Comparison of electrical properties of stack piezoelectric unites with the same volume and different height to cross section ratio: (a) the open peak–peak voltage of C-1, C-2 and C-3; (b) charge variation of C-1, C-2 and C-3; (c) generated electrical energy of C-1, C-2 and C-3.
Figure 14.
The number of piezoelectric units from 8 to 15.
Figure 14.
The number of piezoelectric units from 8 to 15.
Figure 15.
The electric energy signal of the PEH with different numbers of units.
Figure 15.
The electric energy signal of the PEH with different numbers of units.
Figure 16.
The laboratory pavement loading test of the PEH road. (a) The accelerated pavement testing device. (b) The laboratory test road. (c) Monitor system of the voltage. (d) Voltage waveform of the energy storage capacitor.
Figure 16.
The laboratory pavement loading test of the PEH road. (a) The accelerated pavement testing device. (b) The laboratory test road. (c) Monitor system of the voltage. (d) Voltage waveform of the energy storage capacitor.
Figure 17.
The voltage of the supercapacitor.
Figure 17.
The voltage of the supercapacitor.
Table 1.
Typical material properties of PZT-5H.
Table 1.
Typical material properties of PZT-5H.
| Parameter | Symbol | Unit | Typical Value |
|---|
| Density | ρ | 103 kg/m3 | 7.45 |
| Curie temperature | Tc | °C | 200 |
| Quality factor | Qm | / | 70 |
| Relative permittivity | | / | 4500 |
| Electro-mechanical coupling factor | k33 | / | 0.65 |
| Piezoelectric constant | d33 | 10−12 C/N | 670 |
Table 2.
The size parameters of the specimens in Test A.
Table 2.
The size parameters of the specimens in Test A.
| Test | Sample No. | Single Size (mm) | Number of Layers | Total Size (mm) | Connection Mode |
|---|
| A | A-1 | Φ20.00 × 7.50 | 3 | Φ20.00 × 22.50 | Parallel |
| A-2 | Φ20.00 × 7.50 | 3 | Φ20.00 × 22.50 | Series |
Table 3.
Loading scheme of Test A.
Table 3.
Loading scheme of Test A.
| Test | Sample No. | Loading Model | Load Amplitude (kN) | Mean Load (kN) | Frequency (Hz) | Applied Force (Kn) | Preload (kN) |
|---|
| A | A-1, A-2 | Sinusoidal load | 0.25 | 0.75 | 10 | 0.5 | 0.5 |
| 1.00 | 1.50 | 10 | 2.0 | 0.5 |
| 1.50 | 2.00 | 10 | 3.0 | 0.5 |
Table 4.
Size parameters of the specimens in Test B.
Table 4.
Size parameters of the specimens in Test B.
| Test | Sample No. | Single Size (mm) | Number of Layers | Total Size (mm) | Connection Mode |
|---|
| B | B-1 | Φ20.00 × 7.5 | 3 | Φ20.00 × 22.50 | parallel |
| B-2 | Φ20.00 × 5.625 | 4 | Φ20.00 × 22.50 | parallel |
| B-3 | Φ20.00 × 4.50 | 5 | Φ20.00 × 22.50 | parallel |
Table 5.
Loading scheme of Test B.
Table 5.
Loading scheme of Test B.
| Test | Sample No. | Loading Model | Load Amplitude (kN) | Mean Load (kN) | Frequency (Hz) | Applied Force (kN) | Preload (kN) |
|---|
| B | B-1, B-2, B-3 | Sinusoidal load | 0.25 | 0.75 | 10 | 0.5 | 0.5 |
| 1.00 | 1.50 | 10 | 2.0 | 0.5 |
| 1.50 | 2.00 | 10 | 3.0 | 0.5 |
Table 6.
The proportions of the values of the generated charge and voltage in Test B.
Table 6.
The proportions of the values of the generated charge and voltage in Test B.
| Force (kN) | Ratio of Open Circuit Voltage | Ratio of Charge |
|---|
| UB-1:UB-2:UB-3 | QB-1:QB-2:QB-3 |
|---|
| 0.50 | 1/3:1.12/4:1.08/5 | 3:4.10:5.10 |
| 2.00 | 1/3:1.13/4:1.07/5 | 3:4.15:5.08 |
| 3.00 | 1/3:1.18/4:1.19/5 | 3:4.05:5.30 |
Table 7.
Size parameters of the specimens in Test C.
Table 7.
Size parameters of the specimens in Test C.
| Test | Sample No. | Single Size (mm) | Number of Layers | Total Size (mm) | H/CSa Ratio * | Connection Mode |
|---|
| C | C-1 | Φ15.87 × 7.94 | 4 | Φ15.87 × 31.76 | 0.161 | series |
| C-2 | Φ20.00 × 5.00 | 4 | Φ20.00 × 20.00 | 0.064 | series |
| C-3 | Φ25.20 × 3.15 | 4 | Φ25.20 × 12.60 | 0.025 | series |
Table 8.
Loading scheme of Test C.
Table 8.
Loading scheme of Test C.
| Test | Sample No. | Loading Model | Load Amplitude (kN) | Mean Load (kN) | Frequency (Hz) | Applied Force (kN) | Preload (kN) |
|---|
| C | C-1, C-2, C-3 | Sinusoidal load | 0.25 | 0.75 | 10 | 0.5 | 0.5 |
| 0.5 | 1 | 10 | 1.0 | 0.5 |
| 0.75 | 1.25 | 10 | 1.5 | 0.5 |
| 1 | 1.5 | 10 | 2.0 | 0.5 |
Table 9.
The proportions of the voltage and the generated electrical energy in Test C.
Table 9.
The proportions of the voltage and the generated electrical energy in Test C.
| Force | Ratio of Open Circuit Voltage | Ratio of Generated Electrical Energy |
|---|
| (kN) | UC-1:UC-2:UC-3 | EC-1:EC-2:EC-3 |
|---|
| 0.50 | 4.51:2.39:1.00 | 4.08:2.50:1.00 |
| 1.00 | 4.40:2.37:1.00 | 4.10:2.55:1.00 |
| 1.50 | 4.36:2.32:1.00 | 4.03:2.50:1.00 |
| 2.00 | 4.28:2.29:1.00 | 3.84:2.50:1.00 |


