
Three-Dimensional Mapping of Shear Wave Velocity in Human Tendon: A Proof of Concept Study

 , and
, and 
Abstract
:1. Introduction
2. Materials and Methods
2.1. Free-Hand 3D Shear Wave Velocity Mapping
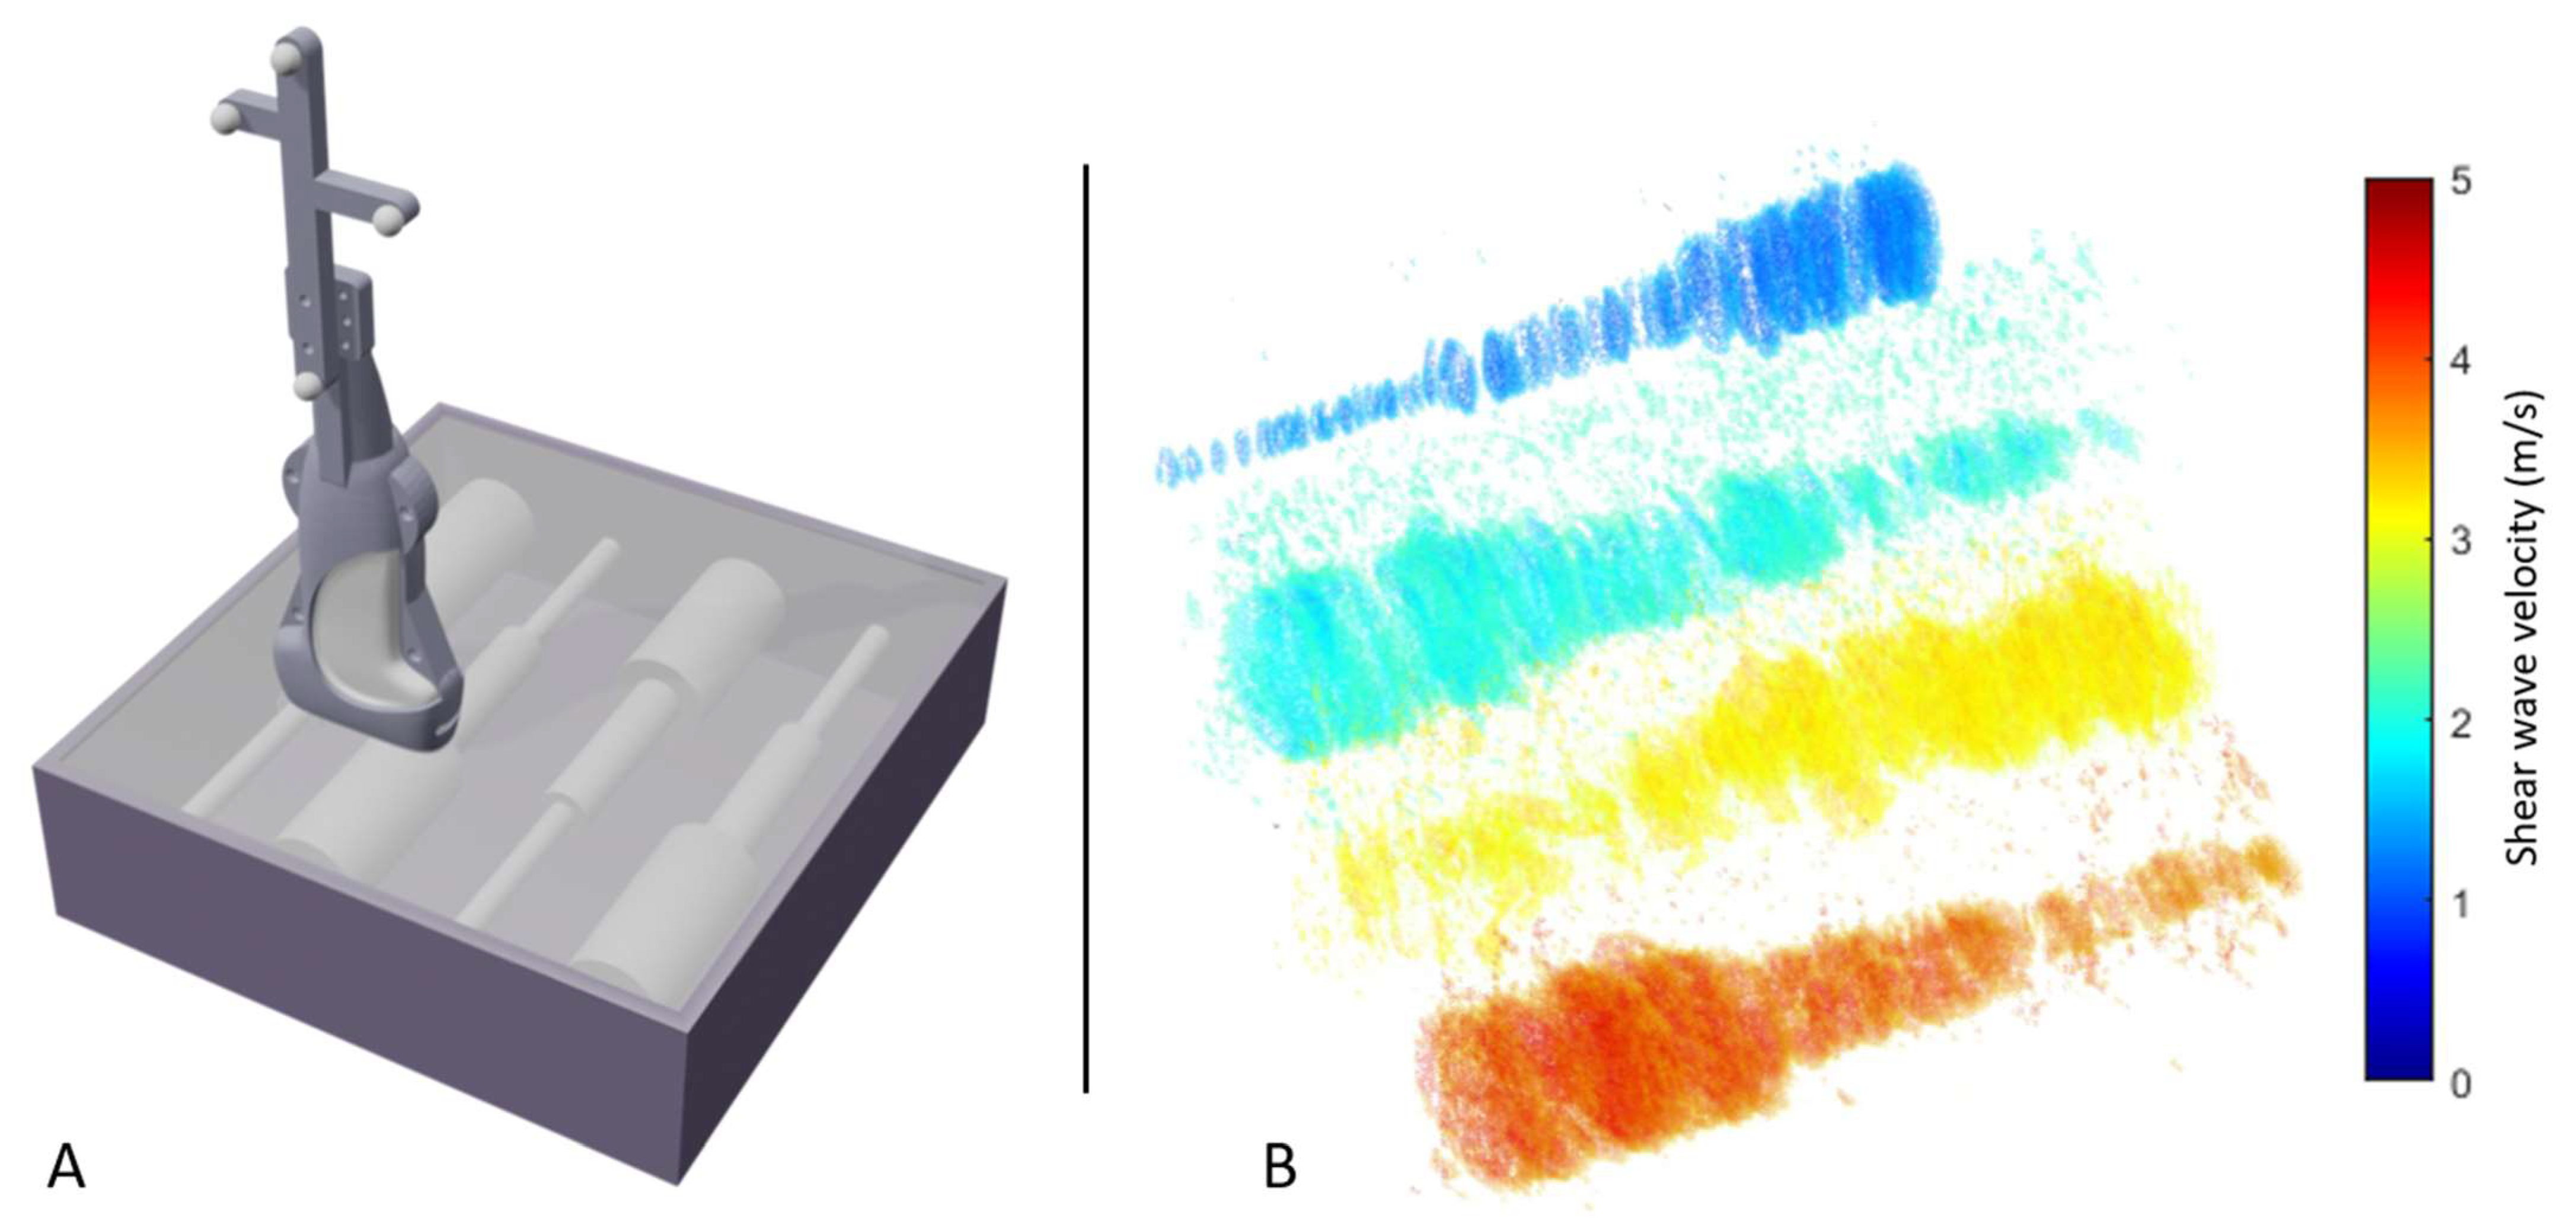
2.2. Phantom Experiments
2.3. In Vivo Reproducibility Experiments
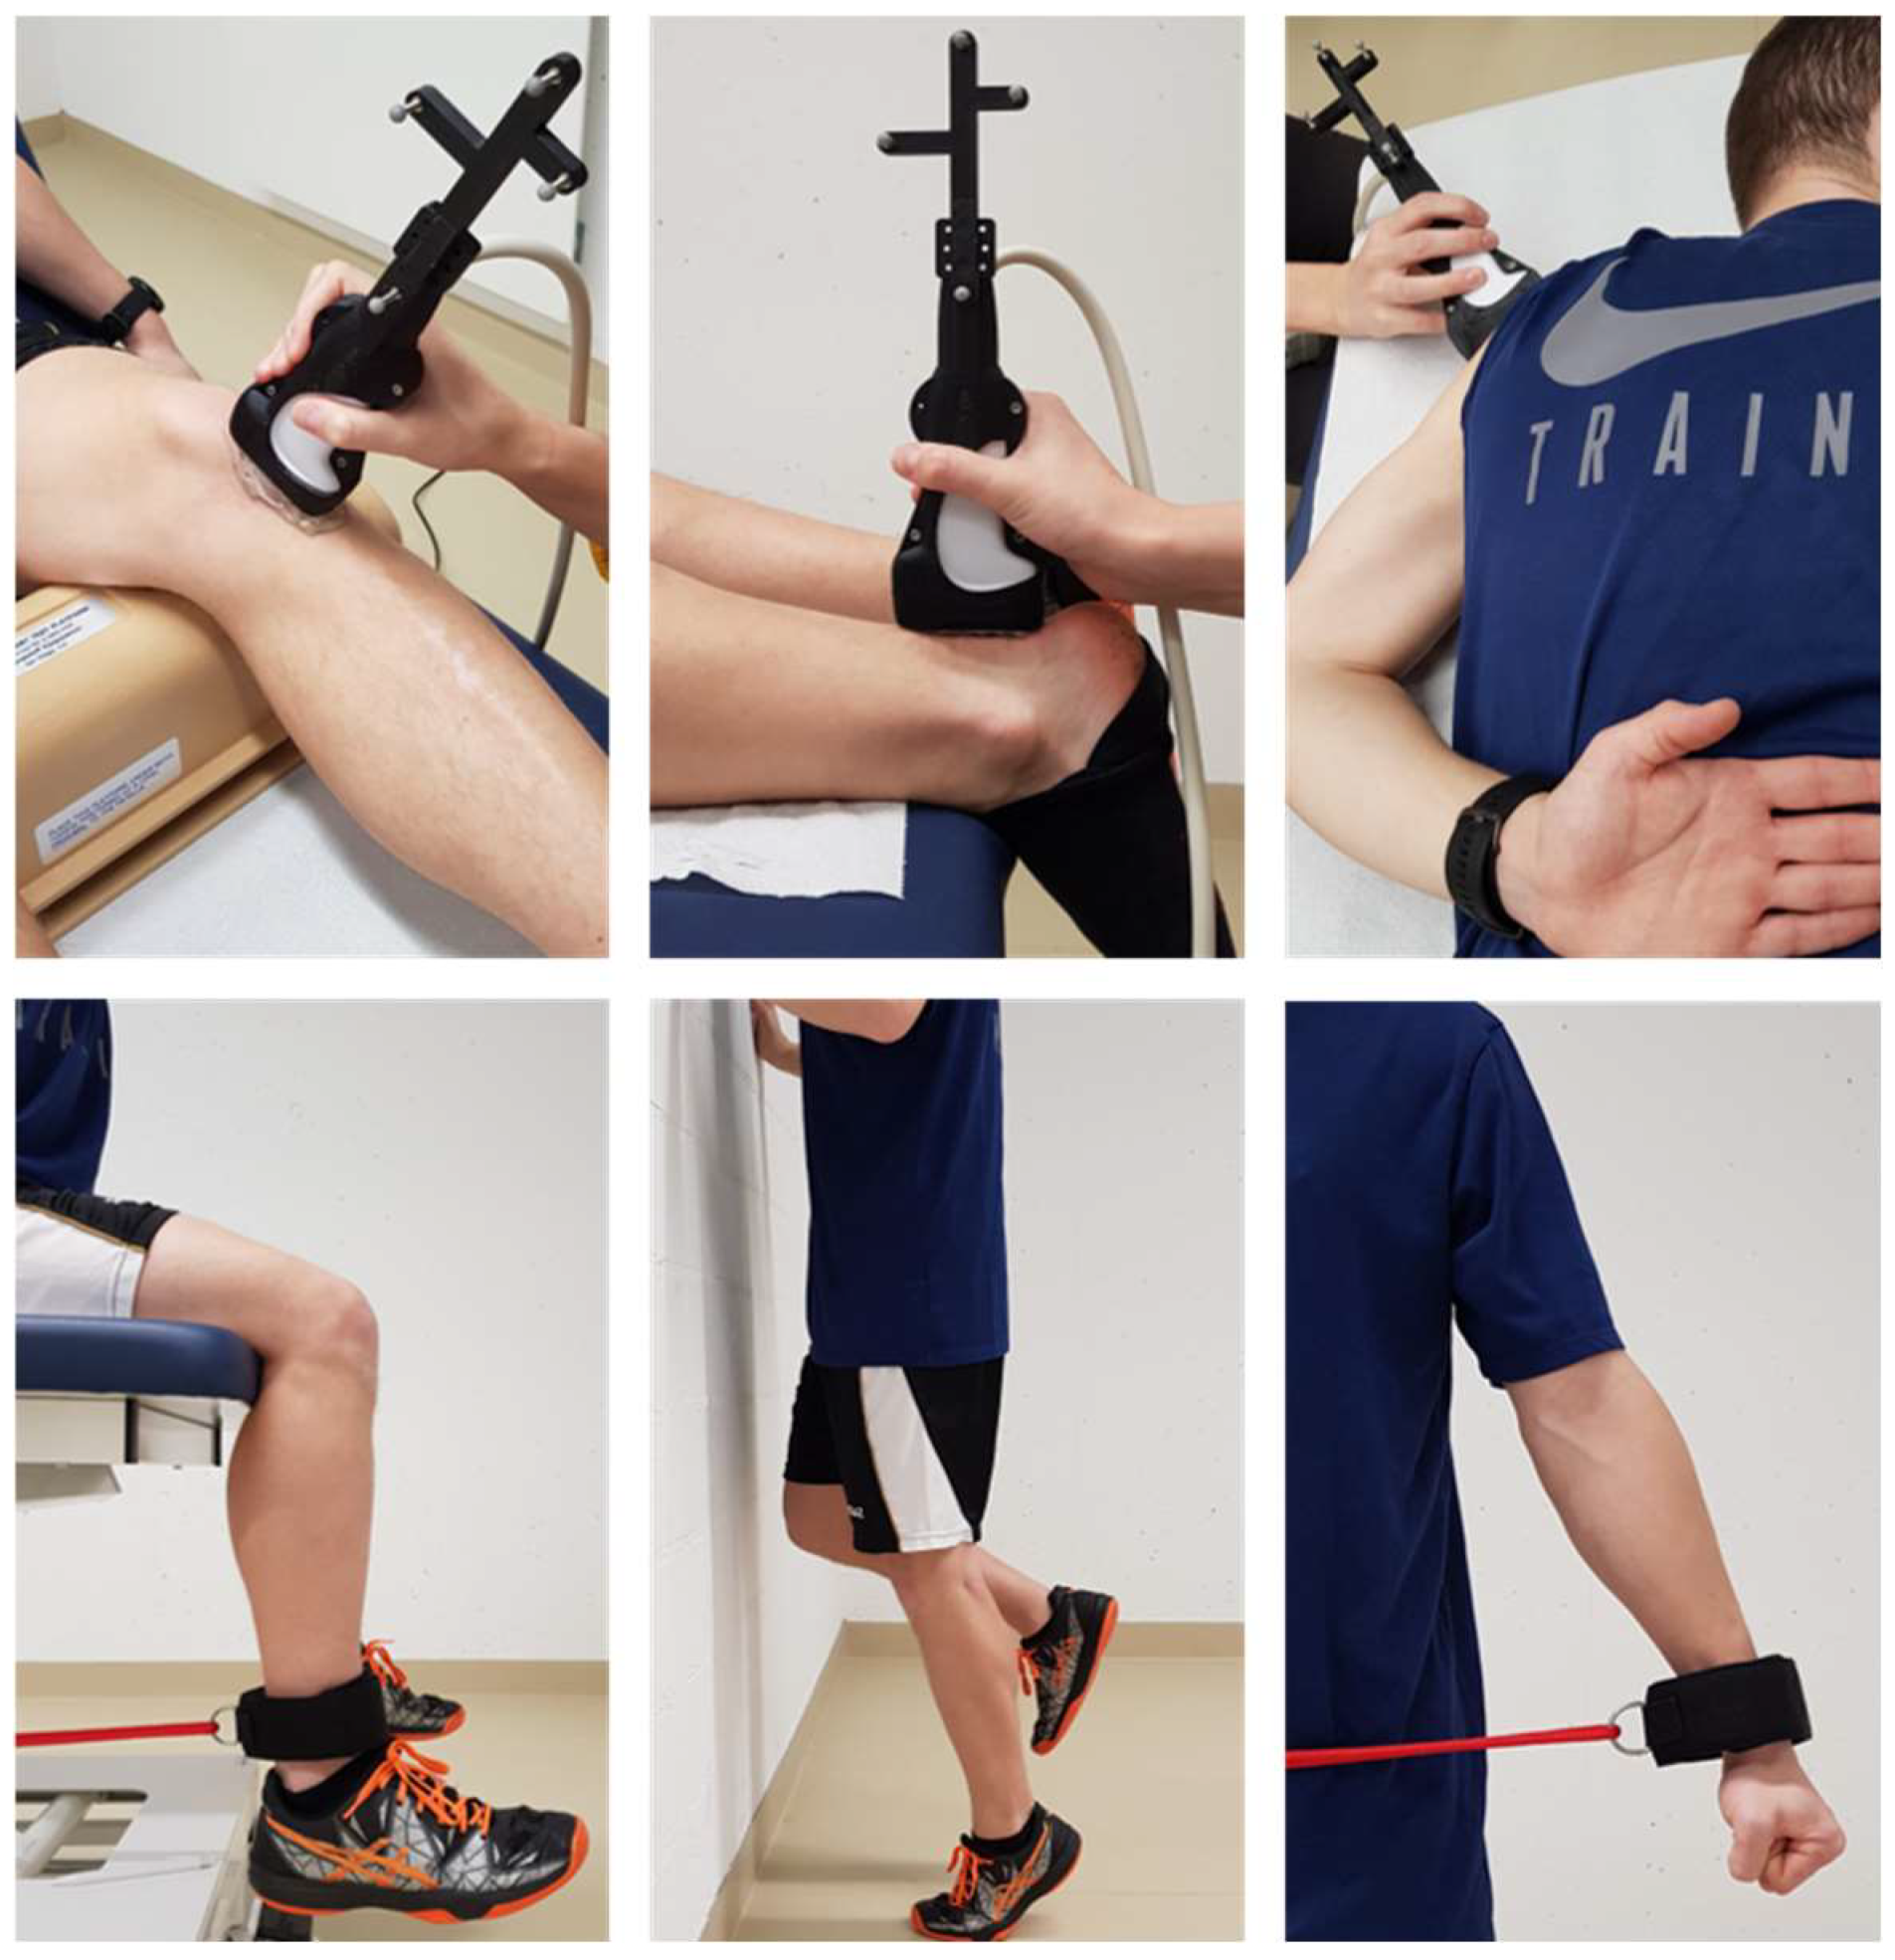
2.3.1. In Vivo 3D SWVM
2.3.2. In Vivo 2D SWVM
2.3.3. Tendon Response to Loading
2.4. Statistical Analysis
3. Results
3.1. Elastography Phantom
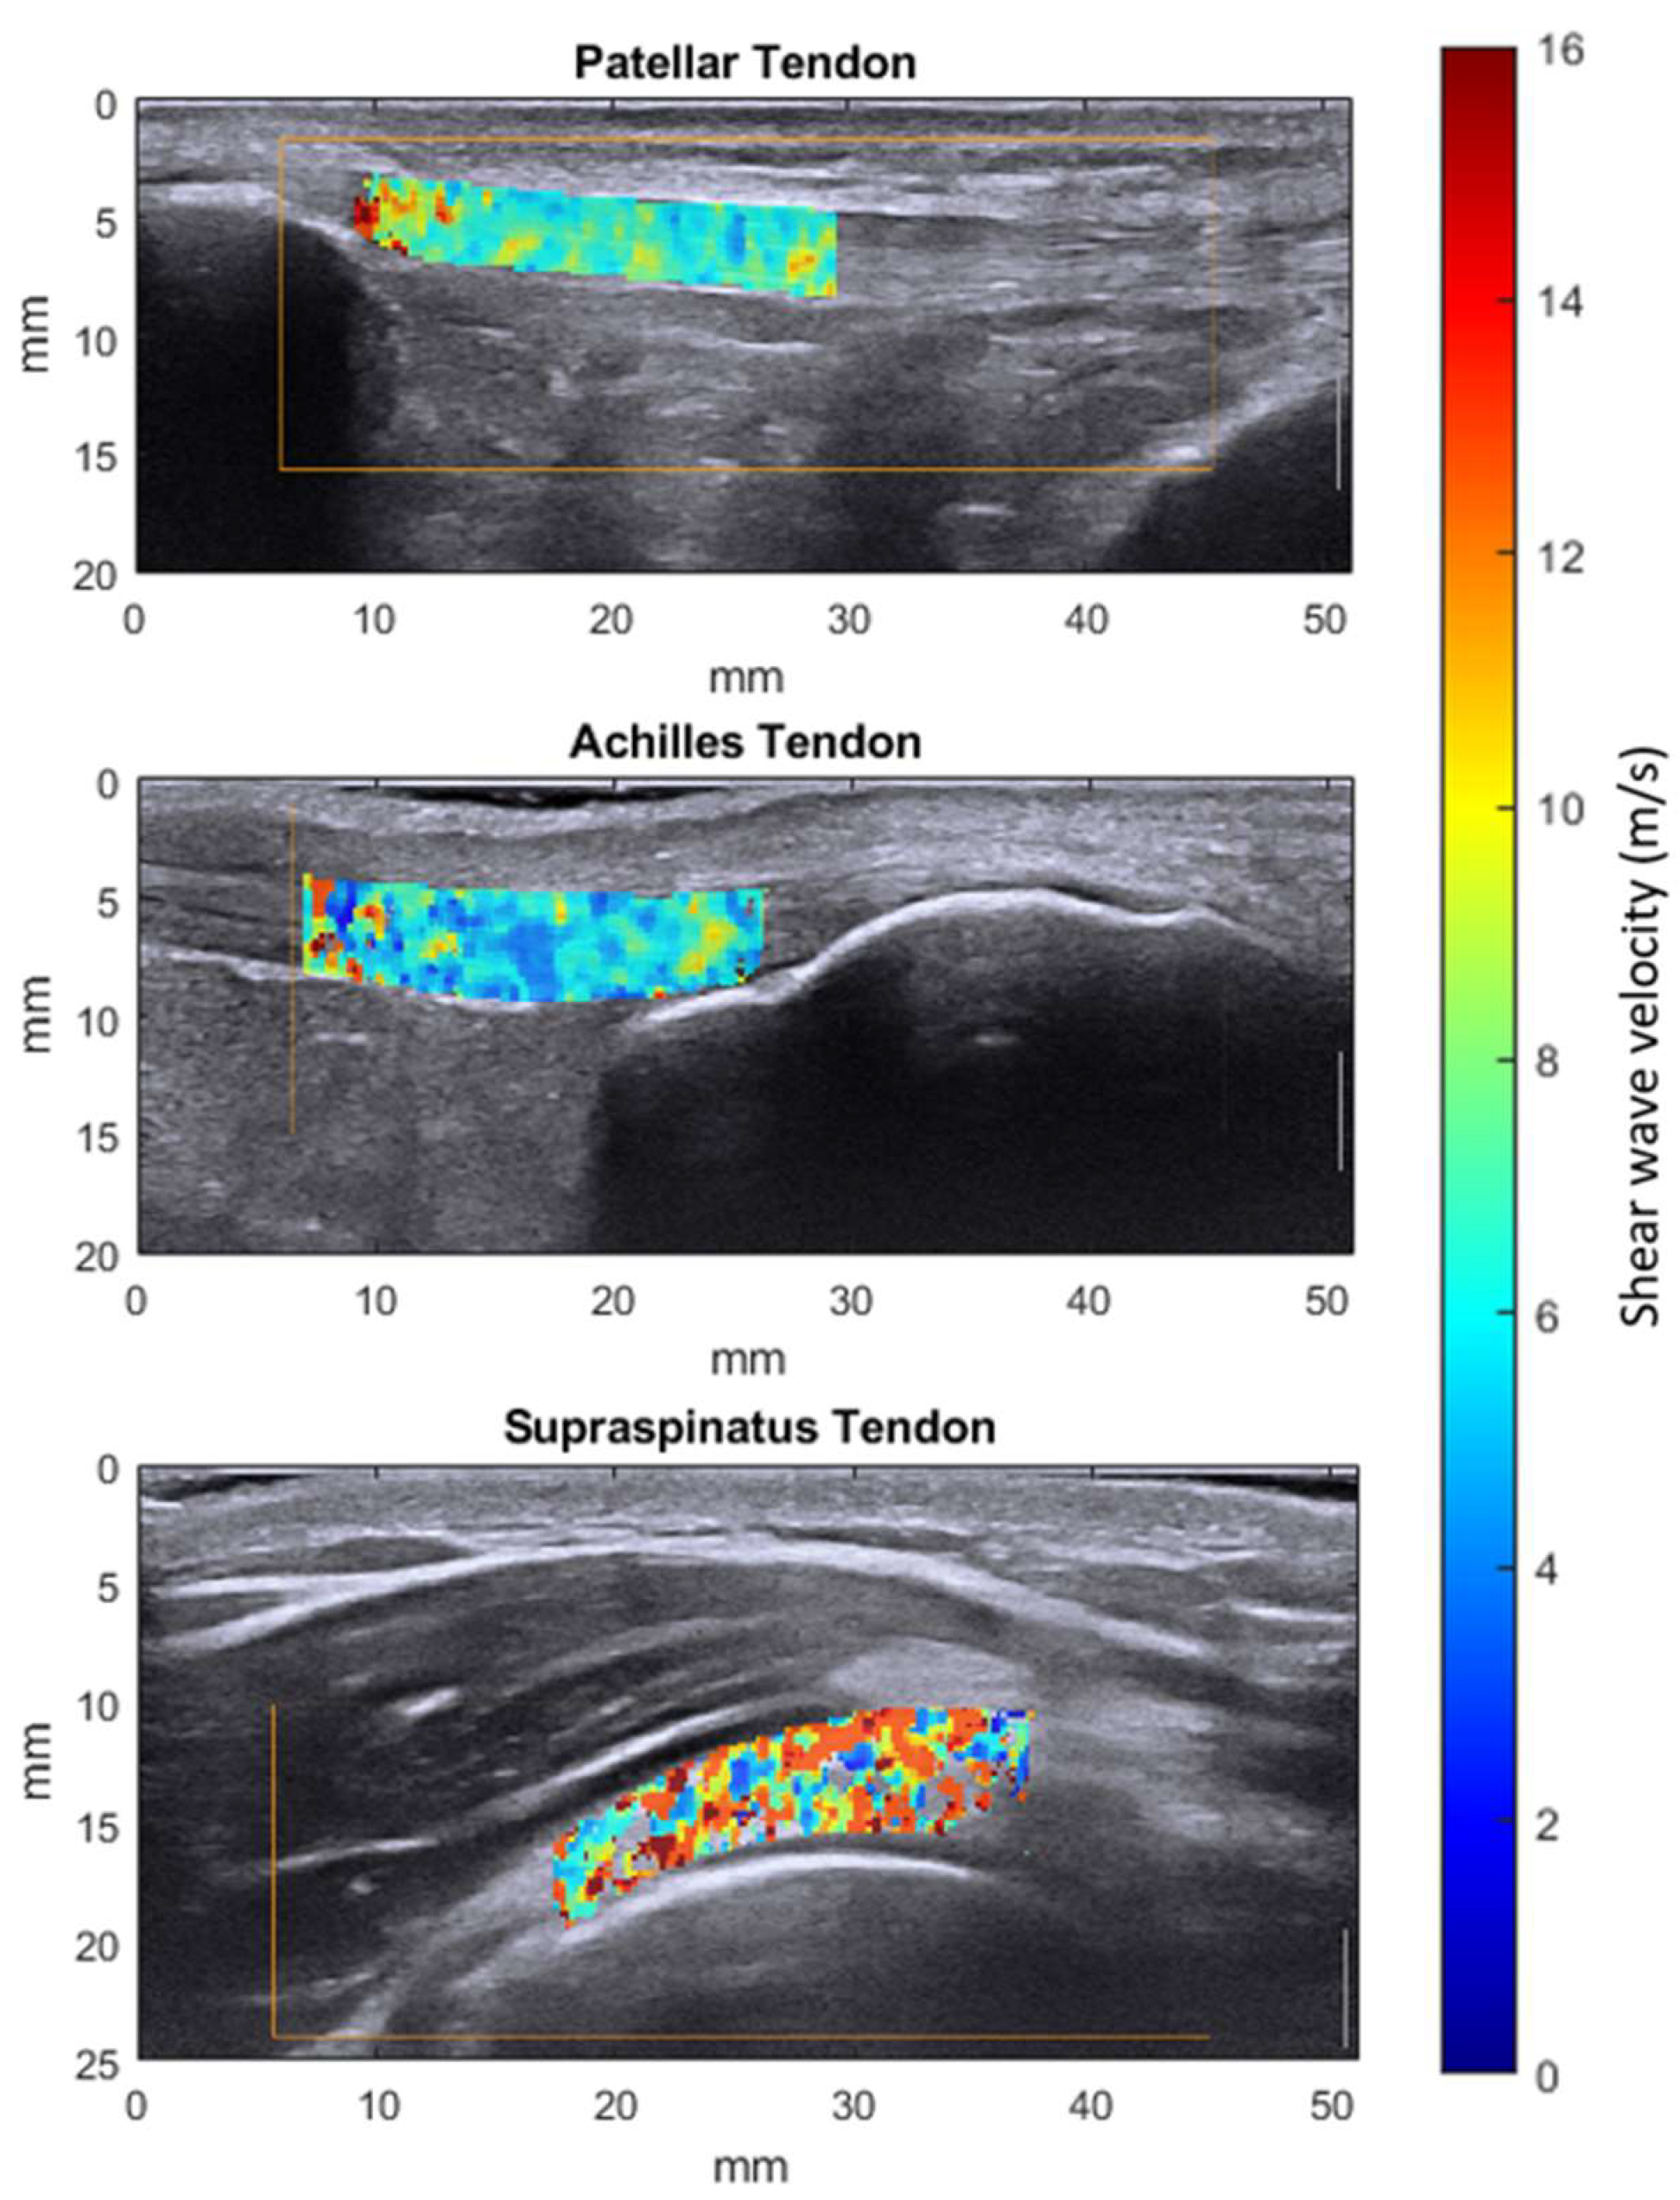
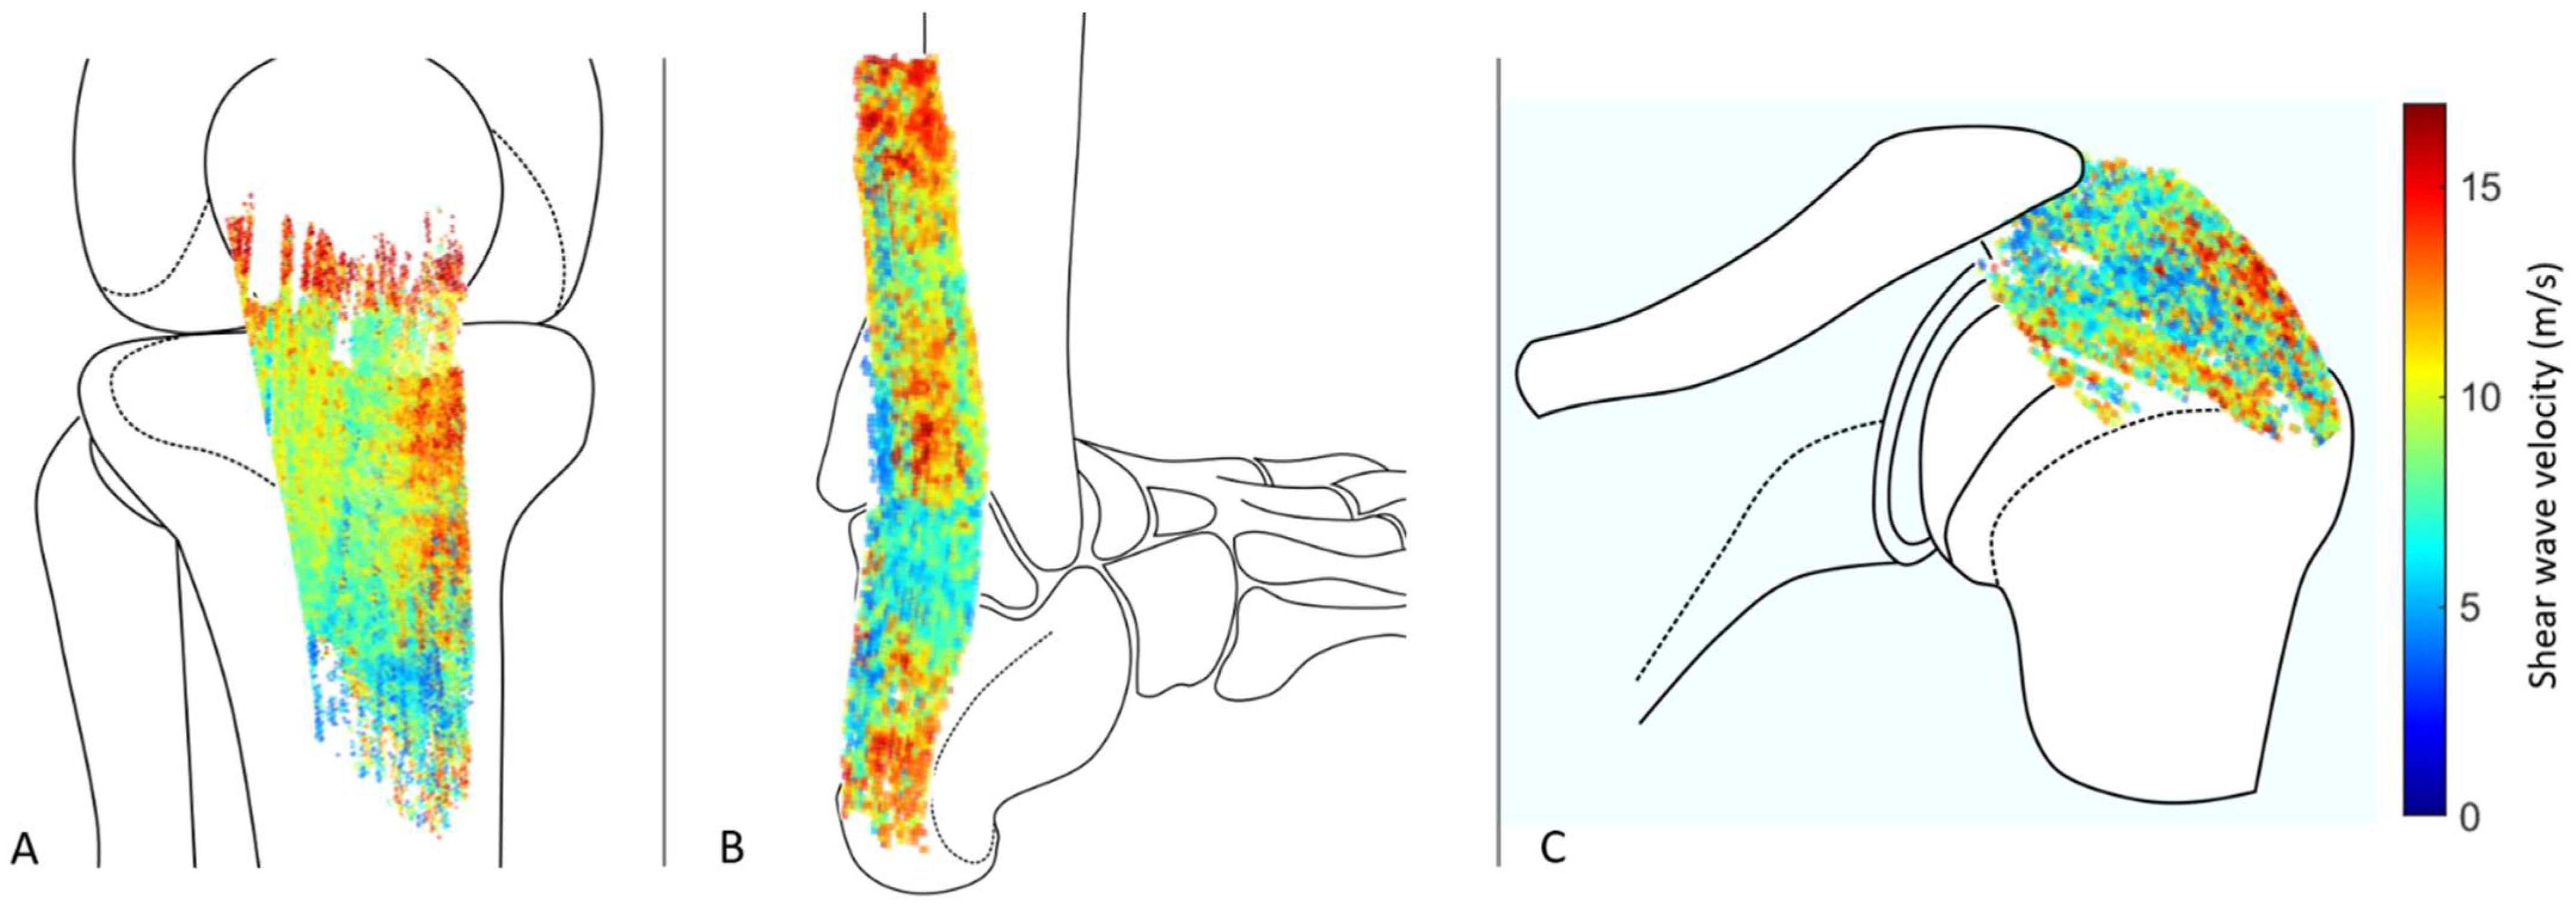
3.2. In Vivo Tendon Imaging
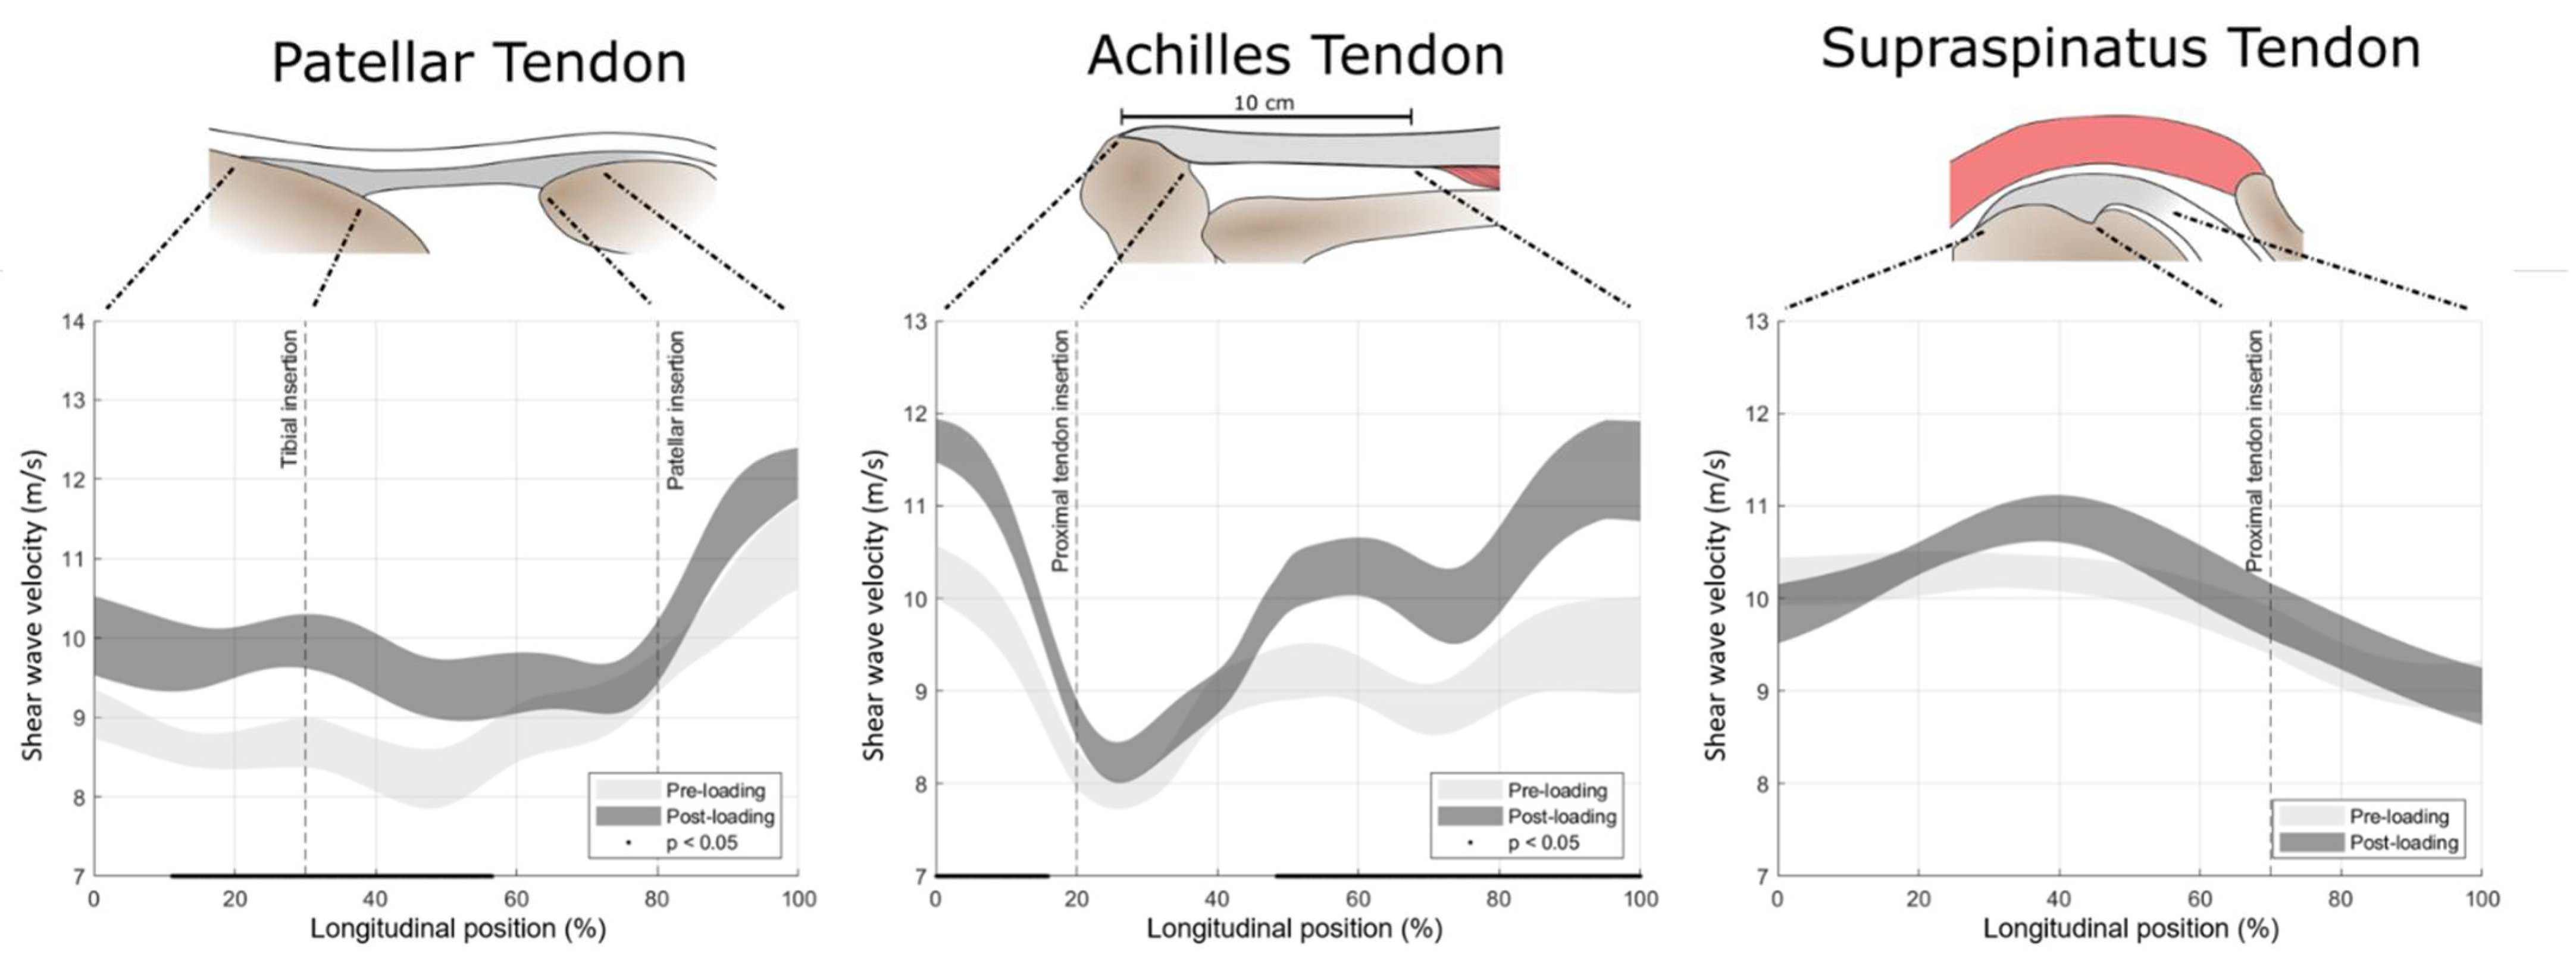
3.3. Tendon Response to Loading
4. Discussion
4.1. Three-Dimensional Mapping of Shear Wave Velocity in Human Tendon Is a Technically Feasible and Valid Approach
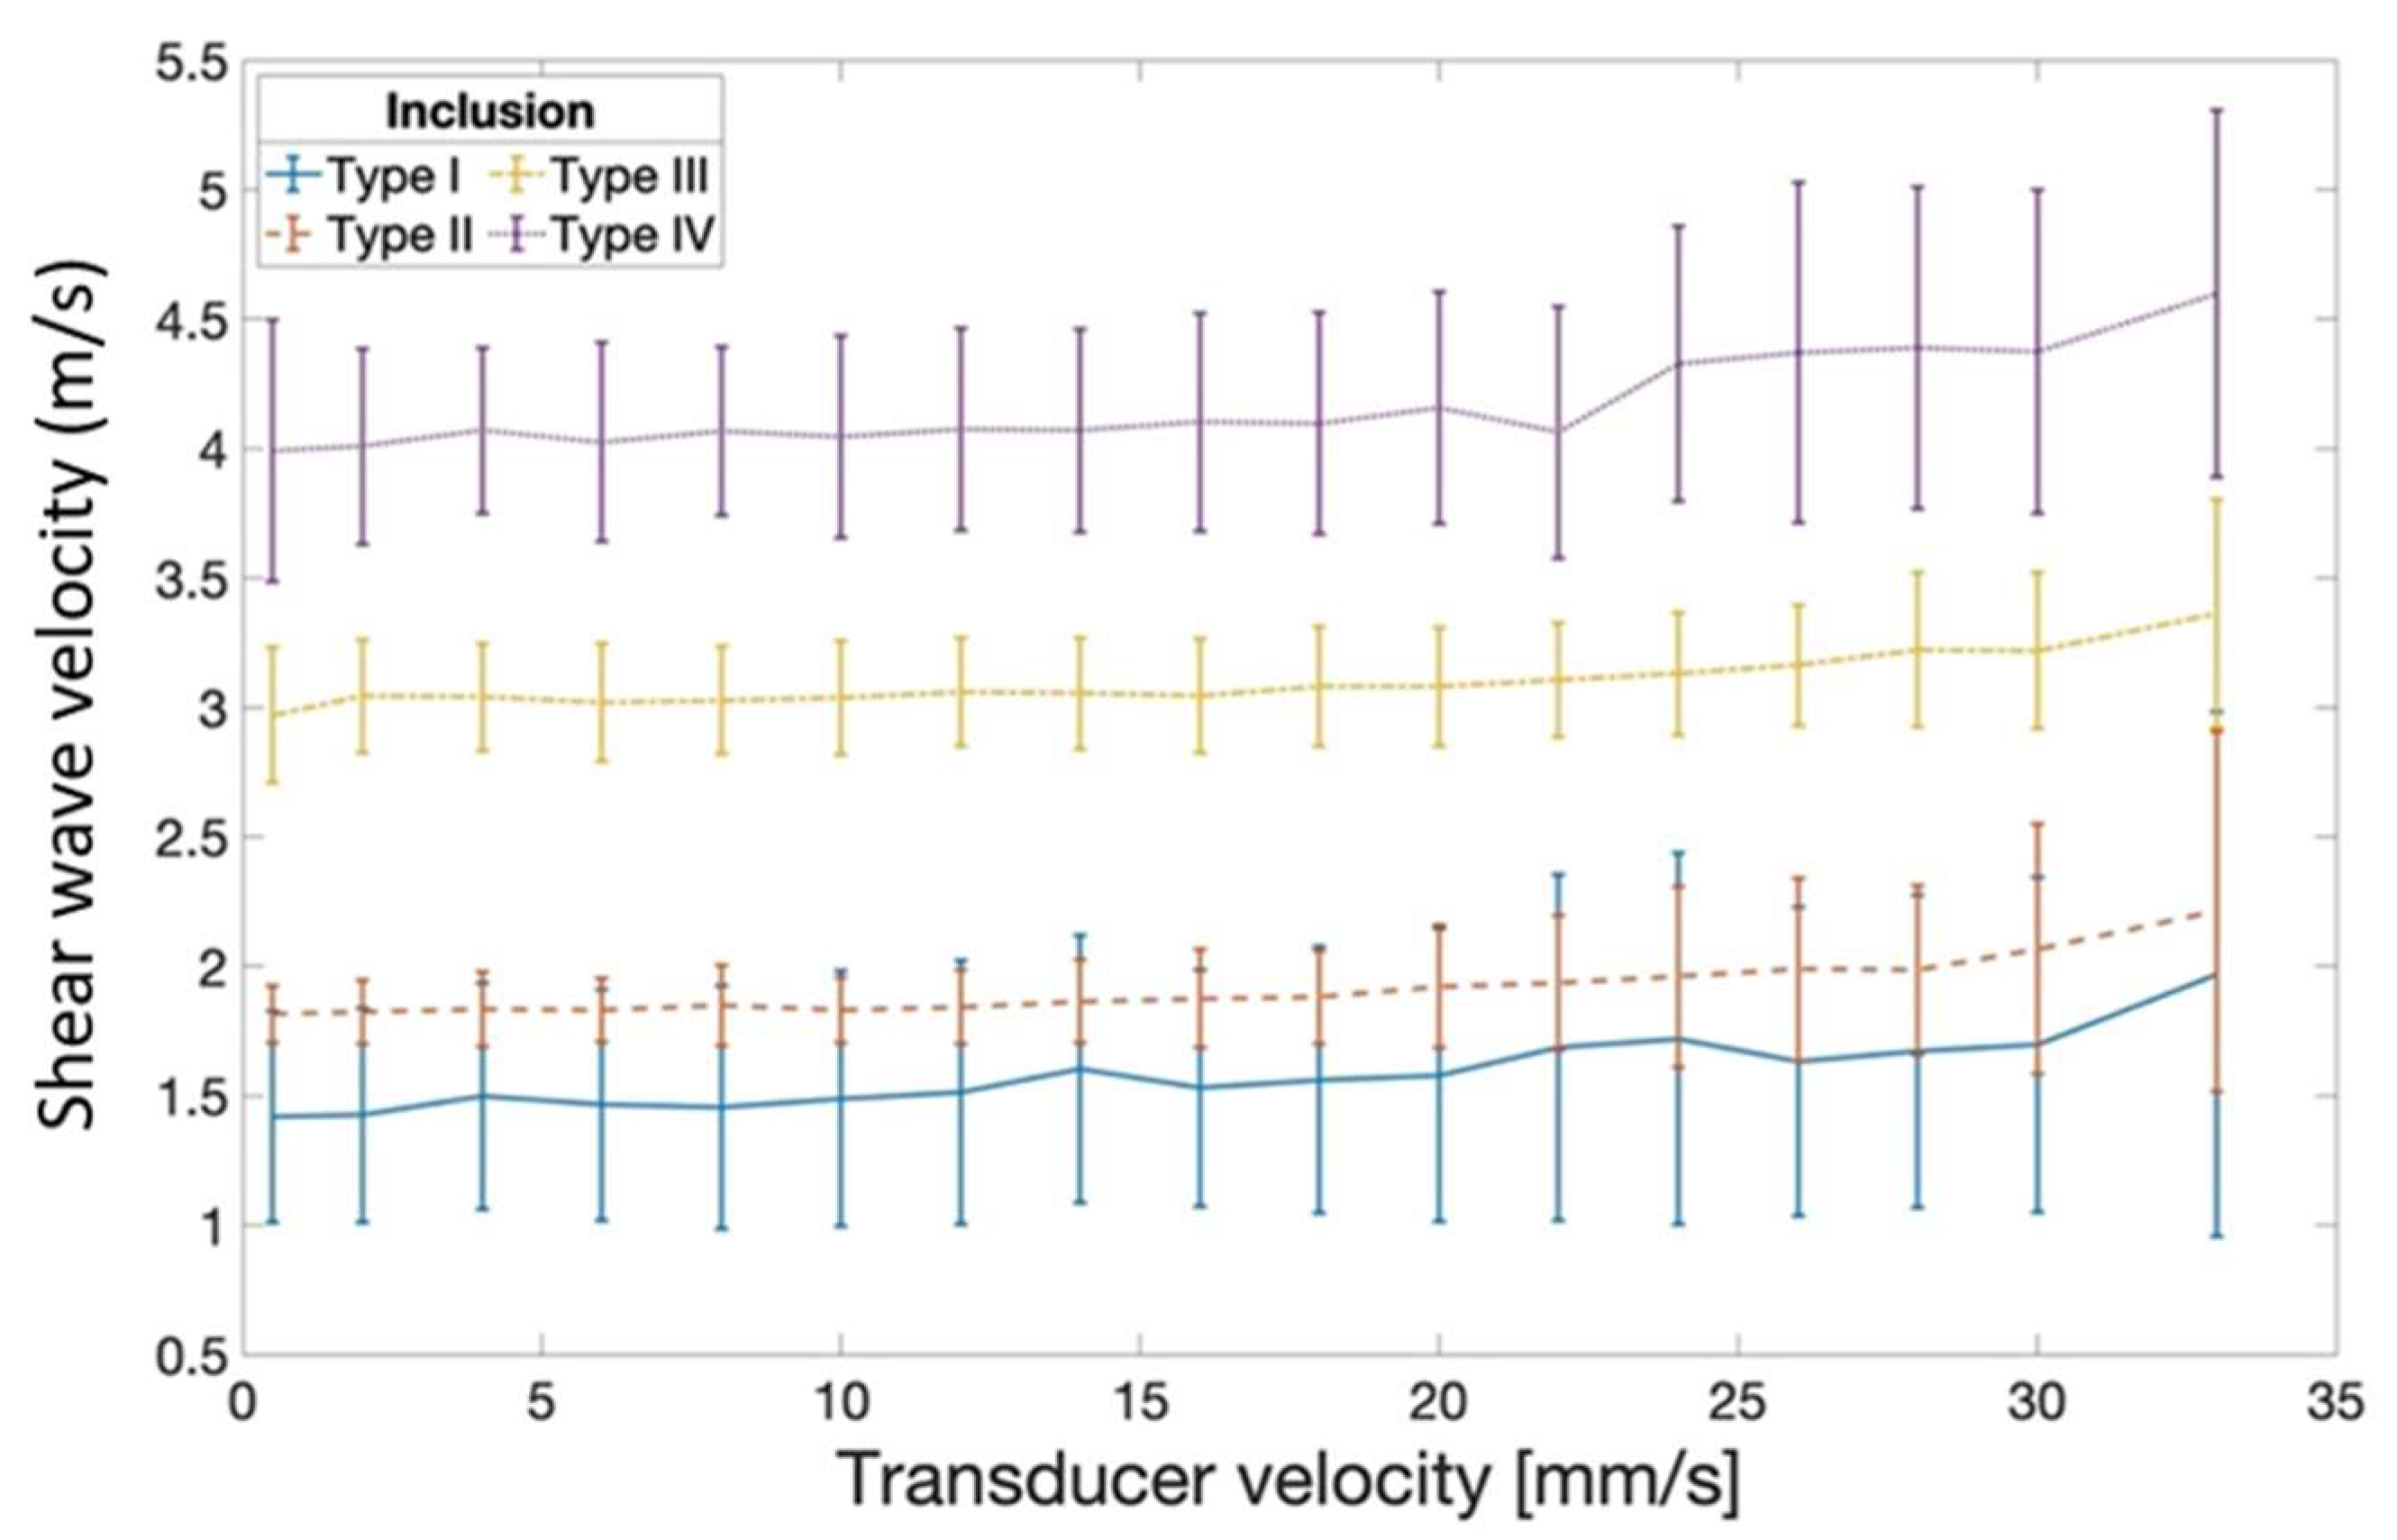
4.2. Potential Artefacts Caused by Out-of-Plane Transducer Motion during Image Acquisition at Varying Transducer Speeds
4.3. Inter-Operator and Inter-Day Reproducibility of 3D SWVM in Human Tendon
4.4. Local Tendon Shear Wave Velocity
4.5. Effect of Isometric Loading on Tendon Shear Wave Velocity in Healthy Adult Subjects
4.6. Methodological Considerations
5. Conclusions
Author Contributions
Funding
Institutional Review Board Statement
Informed Consent Statement
Data Availability Statement
Acknowledgments
Conflicts of Interest
References
- Hopkins, C.; Fu, S.C.; Chua, E.; Hu, X.; Rolf, C.; Mattila, V.M.; Qin, L.; Yung, P.S.H.; Chan, K.M. Critical review on the socio-economic impact of tendinopathy. Asia-Pac. J. Sport. Med. Arthrosc. Rehabil. Technol. 2016, 4, 9–20. [Google Scholar] [CrossRef] [Green Version]
- Maffulli, N.; Wong, J.; Almekinders, L.C. Types and epidemiology of tendinopathy. Clin. Sports Med. 2003, 22, 675–692. [Google Scholar] [CrossRef]
- Taljanovic, M.S.; Gimber, L.H.; Becker, G.W.; Latt, L.D.; Klauser, A.S.; Melville, D.M.; Gao, L.; Witte, R.S. Shear-wave elastography: Basic physics and musculoskeletal applications. Radiographics 2017, 37, 855–870. [Google Scholar] [CrossRef] [PubMed] [Green Version]
- Fredberg, U.; Stengaard-Pedersen, K. Chronic tendinopathy tissue pathology, pain mechanisms, and etiology with a special focus on inflammation. Scand. J. Med. Sci. Sports 2008, 18, 3–15. [Google Scholar] [CrossRef] [PubMed]
- Maffulli, N.; Ewen, S.W.B.; Waterston, S.W.; Reaper, J.; Barrass, V. Tenocytes from ruptured and tendinopathic achilles tendons produce greater quantities of type III collagen than tenocytes from normal achilles tendons: An in vitro model of human tendon healing. Am. J. Sports Med. 2000, 28, 499–505. [Google Scholar] [CrossRef] [PubMed]
- Snedeker, J.G.; Foolen, J. Tendon injury and repair—A perspective on the basic mechanisms of tendon disease and future clinical therapy. Acta Biomater. 2017, 63, 18–36. [Google Scholar] [CrossRef] [PubMed]
- Attia, M.; Scott, A.; Carpentier, G.; Lian, Ø.; Van Kuppevelt, T.; Gossard, C.; Papy-Garcia, D.; Tassoni, M.C.; Martelly, I. Greater glycosaminoglycan content in human patellar tendon biopsies is associated with more pain and a lower VISA score. Br. J. Sports Med. 2014, 48, 469–475. [Google Scholar] [CrossRef]
- Parkinson, J.; Samiric, T.; Ilic, M.Z.; Cook, J.; Handley, C.J. Involvement of proteoglycans in tendinopathy. J. Musculoskelet. Neuronal Interact. 2011, 11, 86–93. [Google Scholar] [PubMed]
- Fessel, G.; Snedeker, J.G. Evidence against proteoglycan mediated collagen fibril load transmission and dynamic viscoelasticity in tendon. Matrix Biol. 2009, 28, 503–510. [Google Scholar] [CrossRef] [Green Version]
- Ooi, C.C.; Richards, P.J.; Maffulli, N.; Ede, D.; Schneider, M.E.; Connell, D.; Morrissey, D.; Malliaras, P. A soft patellar tendon on ultrasound elastography is associated with pain and functional deficit in volleyball players. J. Sci. Med. Sport 2016, 19, 373–378. [Google Scholar] [CrossRef] [PubMed]
- Seo, J.B.; Yoo, J.S.; Ryu, J.W. Sonoelastography findings of supraspinatus tendon in rotator cuff tendinopathy without tear: Comparison with magnetic resonance images and conventional ultrasonography. J. Ultrasound 2014, 18, 143–149. [Google Scholar] [CrossRef] [Green Version]
- Finnamore, E.; Waugh, C.; Solomons, L.; Ryan, M.; West, C.; Scott, A. Transverse tendon stiffness is reduced in people with Achilles tendinopathy: A cross-sectional study. PLoS ONE 2019, 14, e0211863. [Google Scholar] [CrossRef] [Green Version]
- Yasui, Y.; Tonogai, I.; Rosenbaum, A.J.; Shimozono, Y.; Kawano, H.; Kennedy, J.G. The Risk of Achilles Tendon Rupture in the Patients with Achilles Tendinopathy: Healthcare Database Analysis in the United States. BioMed Res. Int. 2017, 2017, 1–4. [Google Scholar] [CrossRef]
- Cook, J.L.; Purdam, C.R. Is tendon pathology a continuum? A pathology model to explain the clinical presentation of load-induced tendinopathy. Br. J. Sports Med. 2009, 43, 409–416. [Google Scholar] [CrossRef] [Green Version]
- Hein, I.A.; Brien, W.D.O. Current Time-Domain Methods for Assessing Tissue Motion by Analysis from Reflected Ultrasound Echoes—A Review. IEEE Trans. Ultrason. Ferroelectr. Freq. Control 1993, 40, 84–102. [Google Scholar] [CrossRef] [PubMed]
- Nightingale, K. Acoustic Radiation Force Impulse (ARFI) Imaging: A Review. Curr. Med. Imaging Rev. 2012, 7, 328–339. [Google Scholar] [CrossRef] [PubMed]
- Aubry, S.; Nueffer, J.P.; Tanter, M.; Becce, F.; Vidal, C.; Michel, F. Viscoelasticity in achilles tendonopathy: Quantitative assessment by using real-time shear-wave elastography. Radiology 2015, 274, 821–829. [Google Scholar] [CrossRef] [PubMed]
- Wang, C.Z.; Zheng, J.; Huang, Z.P.; Xiao, Y.; Song, D.; Zeng, J.; Zheng, H.R.; Zheng, R.Q. Influence of Measurement Depth on the Stiffness Assessment ofHealthy Liver with Real-Time Shear Wave Elastography. Ultrasound Med. Biol. 2014, 40, 461–469. [Google Scholar] [CrossRef] [PubMed]
- Mozaffari, M.H.; Lee, W.S. Freehand 3-D Ultrasound Imaging: A Systematic Review. Ultrasound Med. Biol. 2017, 43, 2099–2124. [Google Scholar] [CrossRef] [Green Version]
- Jeevarathinam, A.S.; Pai, N.; Huang, K.; Hariri, A.; Wang, J.; Bai, Y.; Wang, L.; Hancock, T.; Keys, S.; Penny, W.; et al. A cellulose-based photoacoustic sensor to measure heparin concentration and activity in human blood samples. Biosens. Bioelectron. 2019, 126, 831–837. [Google Scholar] [CrossRef]
- Kikinis, R.; Pieper, S.D.; Vosburgh, K.G. 3D Slicer: A Platform for Subject-Specific Image Analysis, Visualization, and Clinical Support. In Intraoperative Imaging and Image-Guided Therapy; Springer: New York, NY, USA, 2014; pp. 277–289. [Google Scholar]
- Mulabecirovic, A.; Vesterhus, M.; Gilja, O.H.; Havre, R.F. In Vitro Comparison of Five Different Elastography Systems for Clinical Applications, Using Strain and Shear Wave Technology. Ultrasound Med. Biol. 2016, 42, 2572–2588. [Google Scholar] [CrossRef] [PubMed] [Green Version]
- Nowicki, A.; Dobruch-Sobczak, K. Introduction to ultrasound elastography. J. Ultrason. 2016, 16, 113–124. [Google Scholar] [CrossRef] [PubMed]
- Arifin, W.N. A Web-based Sample Size Calculator for Reliability Studies. Educ. Med. J. 2018, 10, 67–76. [Google Scholar] [CrossRef]
- Shrout, P.E.; Fleiss, J.L. Intraclass correlations: Uses in assessing rater reliability. Psychol. Bull. 1979, 86, 420–428. [Google Scholar] [CrossRef] [PubMed]
- De Vet, H.C.W.; Terwee, C.B.; Knol, D.L.; Bouter, L.M. When to use agreement versus reliability measures. J. Clin. Epidemiol. 2006, 59, 1033–1039. [Google Scholar] [CrossRef] [PubMed] [Green Version]
- Altman, D. Practical Statistics for Medical Research: Chapman & Hall; Chapman Hall: London, UK, 1991. [Google Scholar]
- Tozaki, M.; Saito, M.; Joo, C.; Yamaguchi, M.; Isobe, S.; Ogawa, Y.; Homma, K.; Fukuma, E. Ultrasonographic tissue quantification of the breast using acoustic radiation force impulse technology: Phantom study and clinical application. Jpn. J. Radiol. 2011, 29, 598–603. [Google Scholar] [CrossRef] [PubMed]
- Carlsen, J.F.; Pedersen, M.R.; Ewertsen, C.; Sãftoiu, A.; Lönn, L.; Rafaelsen, S.R.; Nielsen, M.B. A comparative study of strain and shear-wave elastography in an elasticity phantom. Am. J. Roentgenol. 2015, 204, W236–W242. [Google Scholar] [CrossRef] [PubMed]
- Gennisson, J.L.; Deffieux, T.; Macé, E.; Montaldo, G.; Fink, M.; Tanter, M. Viscoelastic and anisotropic mechanical properties of in vivo muscle tissue assessed by supersonic shear imaging. Ultrasound Med. Biol. 2010, 36, 789–801. [Google Scholar] [CrossRef] [PubMed]
- Pellot-Barakat, C.; Chami, L.; Correas, J.M.; Lefort, M.; Lucidarme, O. Does motion affect liver stiffness estimates in shear wave elastography? Phantom and clinical study. Eur. J. Radiol. 2016, 85, 1645–1650. [Google Scholar] [CrossRef] [PubMed] [Green Version]
- Slane, L.C.; Martin, J.; DeWall, R.; Thelen, D.; Lee, K. Quantitative ultrasound mapping of regional variations in shear wave speeds of the aging Achilles tendon. Eur. Radiol. 2017, 27, 474–482. [Google Scholar] [CrossRef] [PubMed]
- Hsiao, M.Y.; Chen, Y.C.; Lin, C.Y.; Chen, W.S.; Wang, T.G. Reduced patellar tendon elasticity with aging: In vivo assessment by shear wave elastography. Ultrasound Med. Biol. 2015, 41, 2899–2905. [Google Scholar] [CrossRef] [PubMed]
- Fu, S.; Cui, L.; He, X.; Sun, Y. Elastic characteristics of the normal achilles tendon assessed by virtual touch imaging quantification shear wave elastography. J. Ultrasound Med. 2016, 35, 1881–1887. [Google Scholar] [CrossRef] [Green Version]
- Coombes, B.K.; Tucker, K.; Vicenzino, B.; Vuvan, V.; Mellor, R.; Heales, L.; Nordez, A.; Hug, F. Achilles and patellar tendinopathy display opposite changes in elastic properties: A shear wave elastography study. Scand. J. Med. Sci. Sport. 2018, 28, 1201–1208. [Google Scholar] [CrossRef] [PubMed]
- Aubry, S.; Risson, J.R.; Kastler, A.; Barbier-Brion, B.; Siliman, G.; Runge, M.; Kastler, B. Biomechanical properties of the calcaneal tendon in vivo assessed by transient shear wave elastography. Skeletal Radiol. 2013, 42, 1143–1150. [Google Scholar] [CrossRef]
- Peltz, C.D.; Haladik, J.A.; Divine, G.; Siegal, D.; Van Holsbeeck, M.; Bey, M.J. ShearWave elastography: Repeatability for measurement of tendon stiffness. Skeletal Radiol. 2013, 42, 1151–1156. [Google Scholar] [CrossRef] [PubMed]
- DeWall, R.J.; Slane, L.C.; Lee, K.S.; Thelen, D.G. Spatial variations in Achilles tendon shear wave speed. J. Biomech. 2014, 47, 2685–2692. [Google Scholar] [CrossRef] [Green Version]
- Payne, C.; Watt, P.; Webborn, N. Shear wave elastography measures of the Achilles Tendon: Influence of time of day, leg dominance and the impact of an acute 30-minute bout of running. Appl. Sci. 2018, 8, 1170. [Google Scholar] [CrossRef] [Green Version]
- Masic, A.; Bertinetti, L.; Schuetz, R.; Chang, S.W.; Metzger, T.H.; Buehler, M.J.; Fratzl, P. Osmotic pressure induced tensile forces in tendon collagen. Nat. Commun. 2015, 6, 5942. [Google Scholar] [CrossRef] [PubMed] [Green Version]
- Yun, S.J.; Jin, W.; Cho, N.S.; Ryu, K.N.; Yoon, Y.C.; Cha, J.G.; Park, J.S.; Park, S.Y.; Choi, N.Y. Shear-wave and strain ultrasound elastography of the supraspinatus and infraspinatus tendons in patients with idiopathic adhesive capsulitis of the shoulder: A prospective case-control study. Korean J. Radiol. 2019, 20, 1176–1185. [Google Scholar] [CrossRef]
- Siu, W.L.; Chan, C.H.; Lam, C.H.; Lee, C.M.; Ying, M. Sonographic evaluation of the effect of long-term exercise on Achilles tendon stiffness using shear wave elastography. J. Sci. Med. Sport 2016, 19, 883–887. [Google Scholar] [CrossRef] [PubMed]
- Zardi, E.M.; Franceschetti, E.; Giorgi, C.; Palumbo, A.; Franceschi, F. Reliability of quantitative point shear-wave ultrasound elastography on vastus medialis muscle and quadriceps and patellar tendons. Med. Ultrason. 2019, 21, 50–55. [Google Scholar] [CrossRef] [PubMed] [Green Version]
- Leung, W.K.C.; Chu, K.L.; Lai, C. Sonographic evaluation of the immediate effects of eccentric heel drop exercise on Achilles tendon and gastrocnemius muscle stiffness using shear wave elastography. PeerJ 2017, 5, e3592. [Google Scholar] [CrossRef] [Green Version]
- Chiu, T.C.R.; Ngo, H.C.; Lau, L.W.; Leung, K.W.; Lo, M.H.; Yu, H.F.; Ying, M. An Investigation of the Immediate Effect of Static Stretching on the Morphology and Stiffness of Achilles Tendon in Dominant and Non-Dominant Legs. PLoS ONE 2016, 11, e0154443. [Google Scholar] [CrossRef] [Green Version]
- Zhang, Z.J.; Fu, S.N. Shear Elastic Modulus on Patellar Tendon Captured from Supersonic Shear Imaging: Correlation with Tangent Traction Modulus Computed from Material Testing System and Test-Retest Reliability. PLoS ONE 2013, 8, 1–9. [Google Scholar] [CrossRef] [PubMed] [Green Version]
- Brum, J.; Bernal, M.; Gennisson, J.L.; Tanter, M. In vivo evaluation of the elastic anisotropy of the human Achilles tendon using shear wave dispersion analysis. Phys. Med. Biol. 2014, 59, 505–523. [Google Scholar] [CrossRef]
- Baumer, T.G.; Davis, L.; Dischler, J.; Siegal, D.S.; van Holsbeeck, M.; Moutzouros, V.; Bey, M.J. Shear wave elastography of the supraspinatus muscle and tendon: Repeatability and preliminary findings. J. Biomech. 2017, 53, 201–204. [Google Scholar] [CrossRef]
- Gulledge, C.M.; Baumer, T.G.; Juliano, L.; Sweeney, M.; McGinnis, M.; Sherwood, A.; Moutzouros, V.; Bey, M.J. Shear wave elastography of the healing human patellar tendon following ACL reconstruction. Knee 2019, 26, 347–354. [Google Scholar] [CrossRef] [PubMed]
- Martin, J.A.; Brandon, S.C.E.; Keuler, E.M.; Hermus, J.R.; Ehlers, A.C.; Segalman, D.J.; Allen, M.S.; Thelen, D.G. Gauging force by tapping tendons. Nat. Commun. 2018, 9, 2–10. [Google Scholar] [CrossRef] [PubMed] [Green Version]
- Taş, S.; Onur, M.R.; Yılmaz, S.; Soylu, A.R.; Korkusuz, F. Shear Wave Elastography Is a Reliable and Repeatable Method for Measuring the Elastic Modulus of the Rectus Femoris Muscle and Patellar Tendon. J. Ultrasound Med. 2017, 36, 565–570. [Google Scholar] [CrossRef] [PubMed] [Green Version]
- Payne, C.; Watt, P.; Cercignani, M.; Webborn, N. Reproducibility of shear wave elastography measuresof the Achilles tendon. Skeletal Radiol. 2017, 47, 779–784. [Google Scholar] [CrossRef] [PubMed]
- Taş, S.; Yilmaz, S.; Onur, M.R.; Soylu, A.R.; Altuntaş, O.; Korkusuz, F. Patellar tendon mechanical properties change with gender, body mass index and quadriceps femoris muscle strength. Acta Orthop. Traumatol. Turc. 2017, 51, 54–59. [Google Scholar] [CrossRef]
- Rossetti, L.; Kuntz, L.A.; Kunold, E.; Schock, J.; Müller, K.W.; Grabmayr, H.; Stolberg-Stolberg, J.; Pfeiffer, F.; Sieber, S.A.; Burgkart, R.; et al. The microstructure and micromechanics of the tendon-bone insertion. Nat. Mater. 2017, 16, 664–670. [Google Scholar] [CrossRef]
- Trotter, J.A. Structure-function considerations of muscle-tendon junctions. Comp. Biochem. Physiol. A Mol. Integr. Physiol. 2002, 133, 1127–1133. [Google Scholar] [CrossRef]
- Kolz, C.W.; Suter, T.; Henninger, H.B. Regional mechanical properties of the long head of the biceps tendon. Clin. Biomech. 2015, 30, 940–945. [Google Scholar] [CrossRef] [PubMed]
- Tardioli, A.; Malliaras, P.; Maffulli, N. Immediate and short-term effects of exercise on tendon structure: Biochemical, biomechanical and imaging responses. Br. Med. Bull. 2012, 103, 169–202. [Google Scholar] [CrossRef] [PubMed] [Green Version]
- Kay, A.D.; Blazevich, A.J. Isometric contractions reduce plantar flexor moment, Achilles tendon stiffness, and neuromuscular activity but remove the subsequent effects of stretch. J. Appl. Physiol. 2009, 107, 1181–1189. [Google Scholar] [CrossRef] [PubMed]
- Kubo, K.; Kanehisa, H.; Kawakami, Y.; Fukunaga, T. Influence of static stretching on viscoelastic properties of human tendon structures in vivo. J. Appl. Physiol. 2001, 90, 520–527. [Google Scholar] [CrossRef] [PubMed] [Green Version]
- Yin, N.H.; Chen, W.S.; Wu, Y.T.; Shih, T.T.; Rolf, C.; Wang, H.K. Increased patellar tendon microcirculation and reduction of tendon stiffness following knee extension eccentric exercises. J. Orthop. Sports Phys. Ther. 2014, 44, 304–312. [Google Scholar] [CrossRef] [PubMed] [Green Version]
- Miller, K.S.; Edelstein, L.; Connizzo, B.K.; Soslowsky, L.J. Effect of preconditioning and stress relaxation on local collagen fiber re-alignment: Inhomogeneous properties of rat supraspinatus tendon. J. Biomech. Eng. 2012, 134, 1–6. [Google Scholar] [CrossRef] [PubMed]
- Miller, K.S.; Connizzo, B.K.; Feeney, E.; Soslowsky, L.J. Characterizing local collagen fiber re-alignment and crimp behavior throughout mechanical testing in a mature mouse supraspinatus tendon model. J. Biomech. 2012, 45, 2061–2065. [Google Scholar] [CrossRef] [PubMed] [Green Version]
- Kubo, K.; Kanehisa, H.; Fukunaga, T. Effect of stretching training on the viscoelastic properties of human tendon structures in vivo. J. Appl. Physiol. 2002, 92, 595–601. [Google Scholar] [CrossRef] [PubMed] [Green Version]


| Inclusion | 3D SWVM [m/s] | 2D SWVM [m/s] | Reference Values by Manufacturer [m/s] | ||
|---|---|---|---|---|---|
| Type I | 1.27 | (±0.05) | 1.32 | (±0.22) | 1.47 |
| Type II | 1.83 | (±0.04) | 1.79 | (±0.02) | 2.24 |
| Type III | 3.09 | (±0.00) | 3.13 | (±0.03) | 4.04 |
| Type IV | 4.12 | (±0.07) | 4.13 | (±0.03) | 5.42 |
| 3D SWVM | Inter-Operator | Inter-Day | ||
|---|---|---|---|---|
| ICC (95% CI) | SEm [m/s] | ICC (95% CI) | SEm [m/s] | |
| Patellar tendon | 0.736 (0.270; 0.926) | 0.440 | 0.904 (0.680; 0.975) | 0.303 |
| Achilles tendon | 0.436 (−0.195; 0.820) | 0.553 | 0.591 (−0.015; 0.878) | 0.505 |
| Supraspinatus tendon | 0.632 (0.079; 0.892) | 0.591 | 0.556 (−0.037; 0.866) | 0.501 |
| 2D SWVM | Inter-Operator | Inter-Day | ||
|---|---|---|---|---|
| ICC (95% CI) | SEm [m/s] | ICC (95% CI) | SEm [m/s] | |
| Patellar tendon | 0.495 (−0.122; 0.842) | 0.892 | 0.545 (−0.053; 0.862) | 0.901 |
| Achilles tendon | 0.455 (−0.172; 0.827) | 1.043 | 0.591 (0.014; 0.878) | 1.068 |
| Supraspinatus tendon | 0.350 (−0.291; 0.783) | 0.761 | 0.323 (−0.318; 0.772) | 0.516 |
Publisher’s Note: MDPI stays neutral with regard to jurisdictional claims in published maps and institutional affiliations. |
© 2021 by the authors. Licensee MDPI, Basel, Switzerland. This article is an open access article distributed under the terms and conditions of the Creative Commons Attribution (CC BY) license (http://creativecommons.org/licenses/by/4.0/).
Share and Cite
Götschi, T.; Schulz, N.; Snedeker, J.G.; Hanimann, J.; Franchi, M.V.; Spörri, J. Three-Dimensional Mapping of Shear Wave Velocity in Human Tendon: A Proof of Concept Study. Sensors 2021, 21, 1655. https://doi.org/10.3390/s21051655
Götschi T, Schulz N, Snedeker JG, Hanimann J, Franchi MV, Spörri J. Three-Dimensional Mapping of Shear Wave Velocity in Human Tendon: A Proof of Concept Study. Sensors. 2021; 21(5):1655. https://doi.org/10.3390/s21051655
Chicago/Turabian StyleGötschi, Tobias, Nicole Schulz, Jess G. Snedeker, Jonas Hanimann, Martino V. Franchi, and Jörg Spörri. 2021. "Three-Dimensional Mapping of Shear Wave Velocity in Human Tendon: A Proof of Concept Study" Sensors 21, no. 5: 1655. https://doi.org/10.3390/s21051655