
IoT-Based Research Equipment Sharing System for Remotely Controlled Two-Photon Laser Scanning Microscopy


Abstract
:1. Introduction
2. Materials and Methods
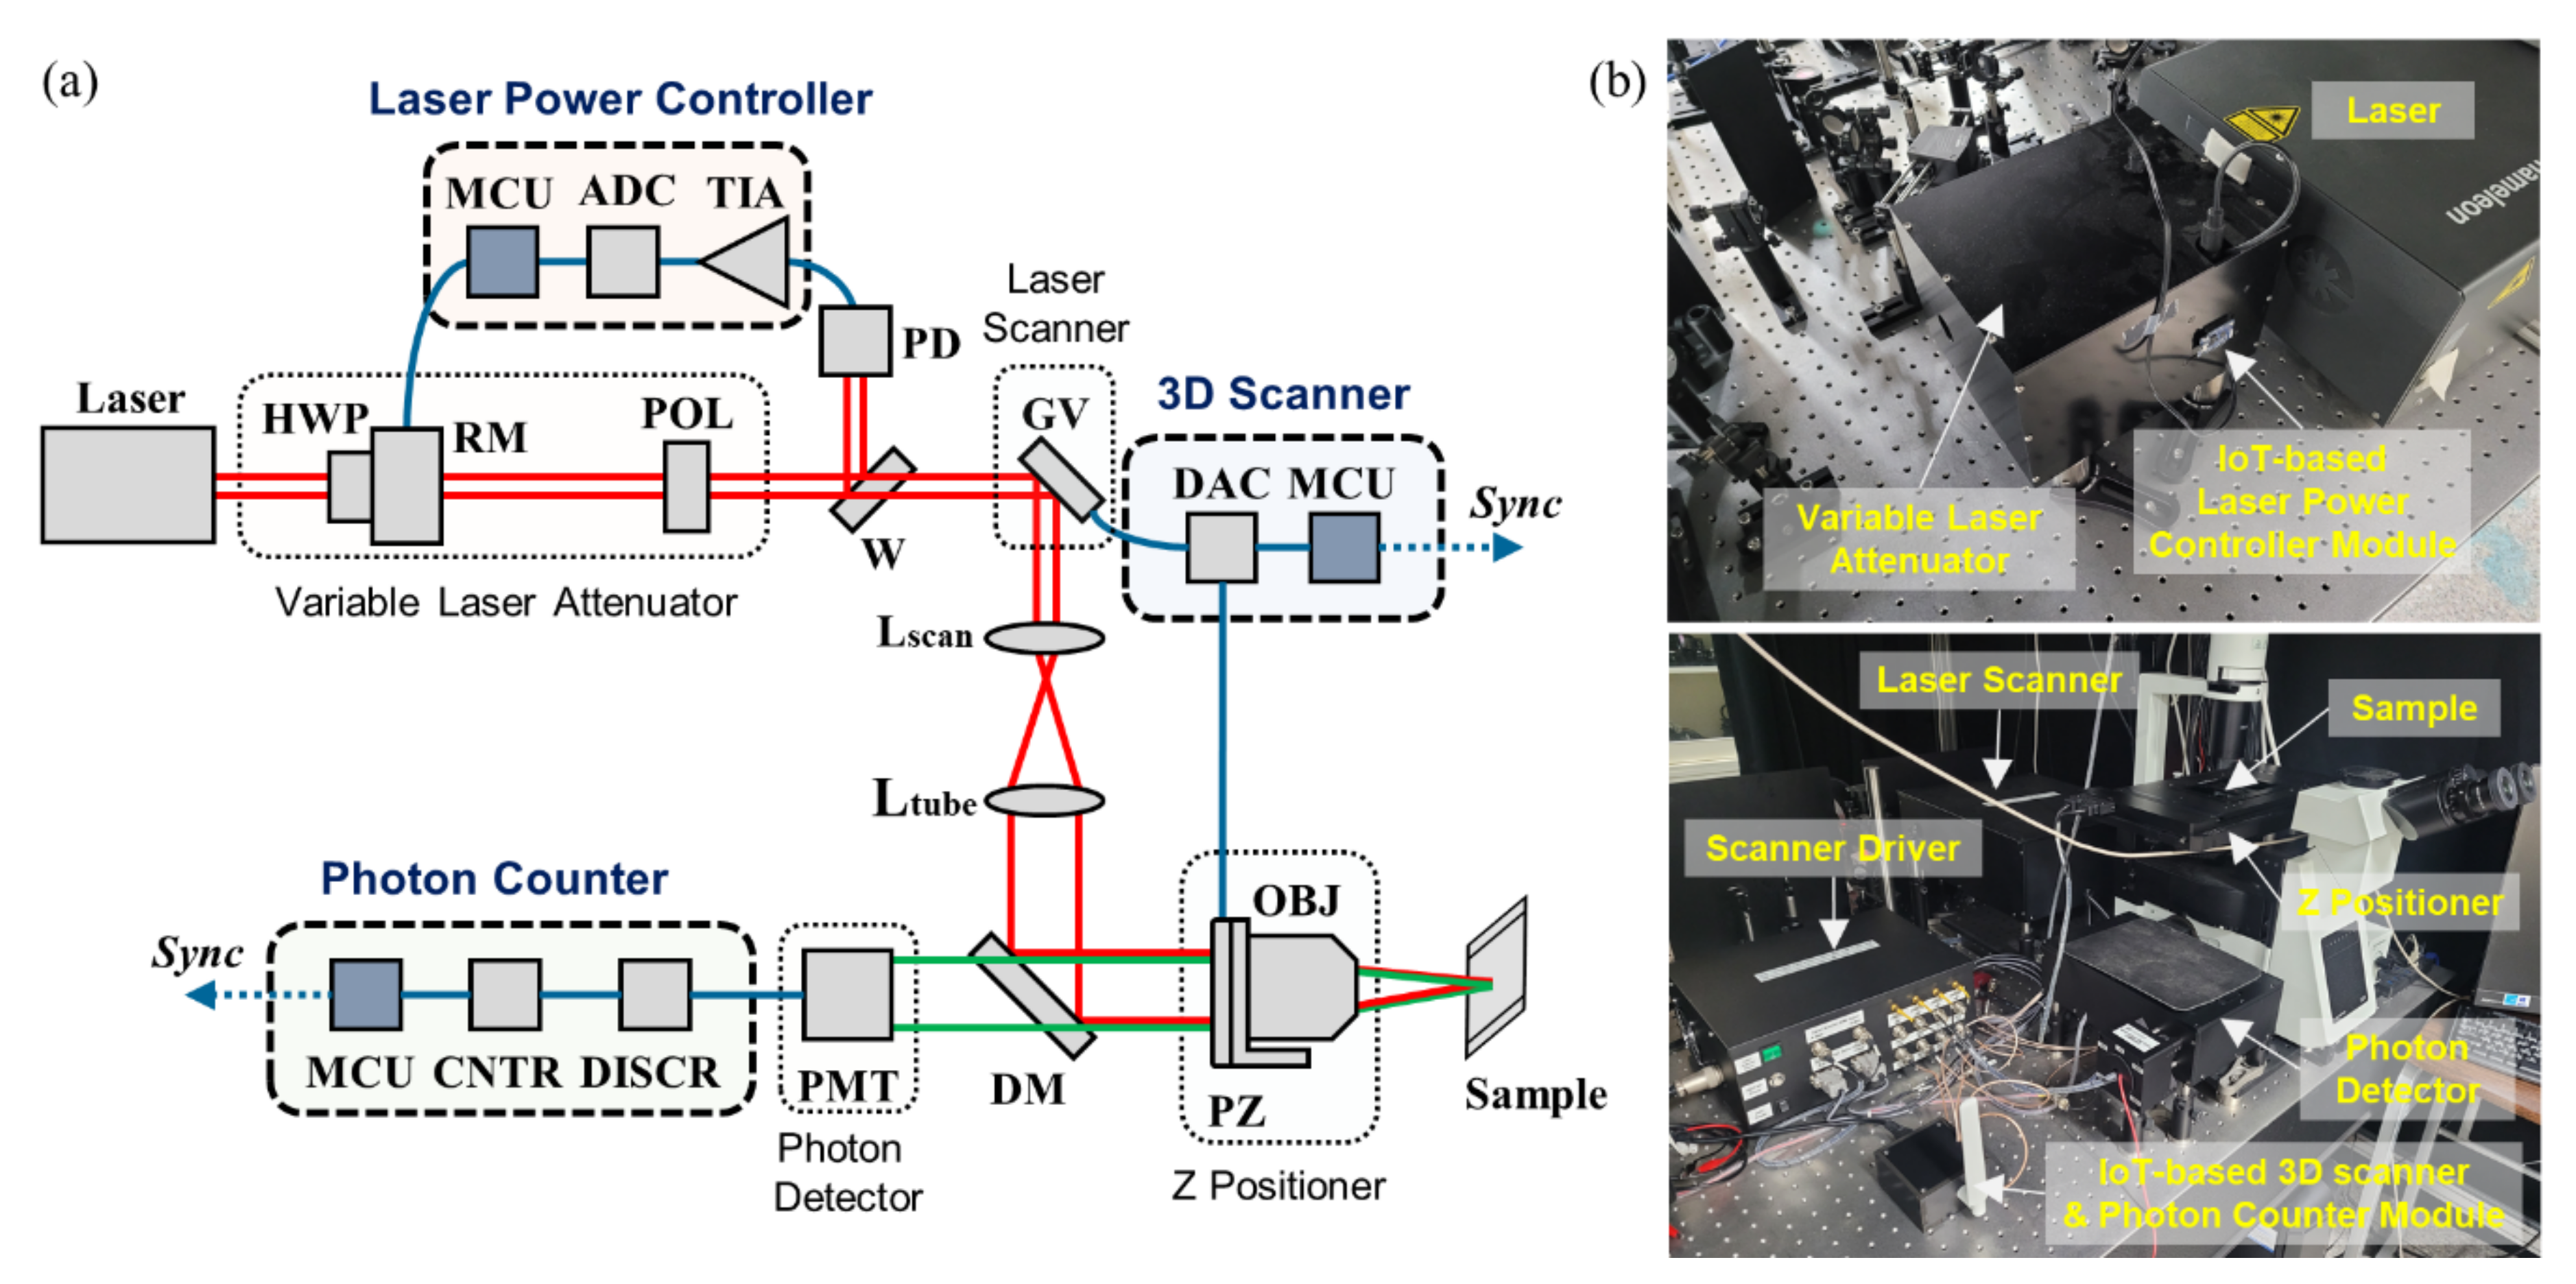
2.1. Hardware Design
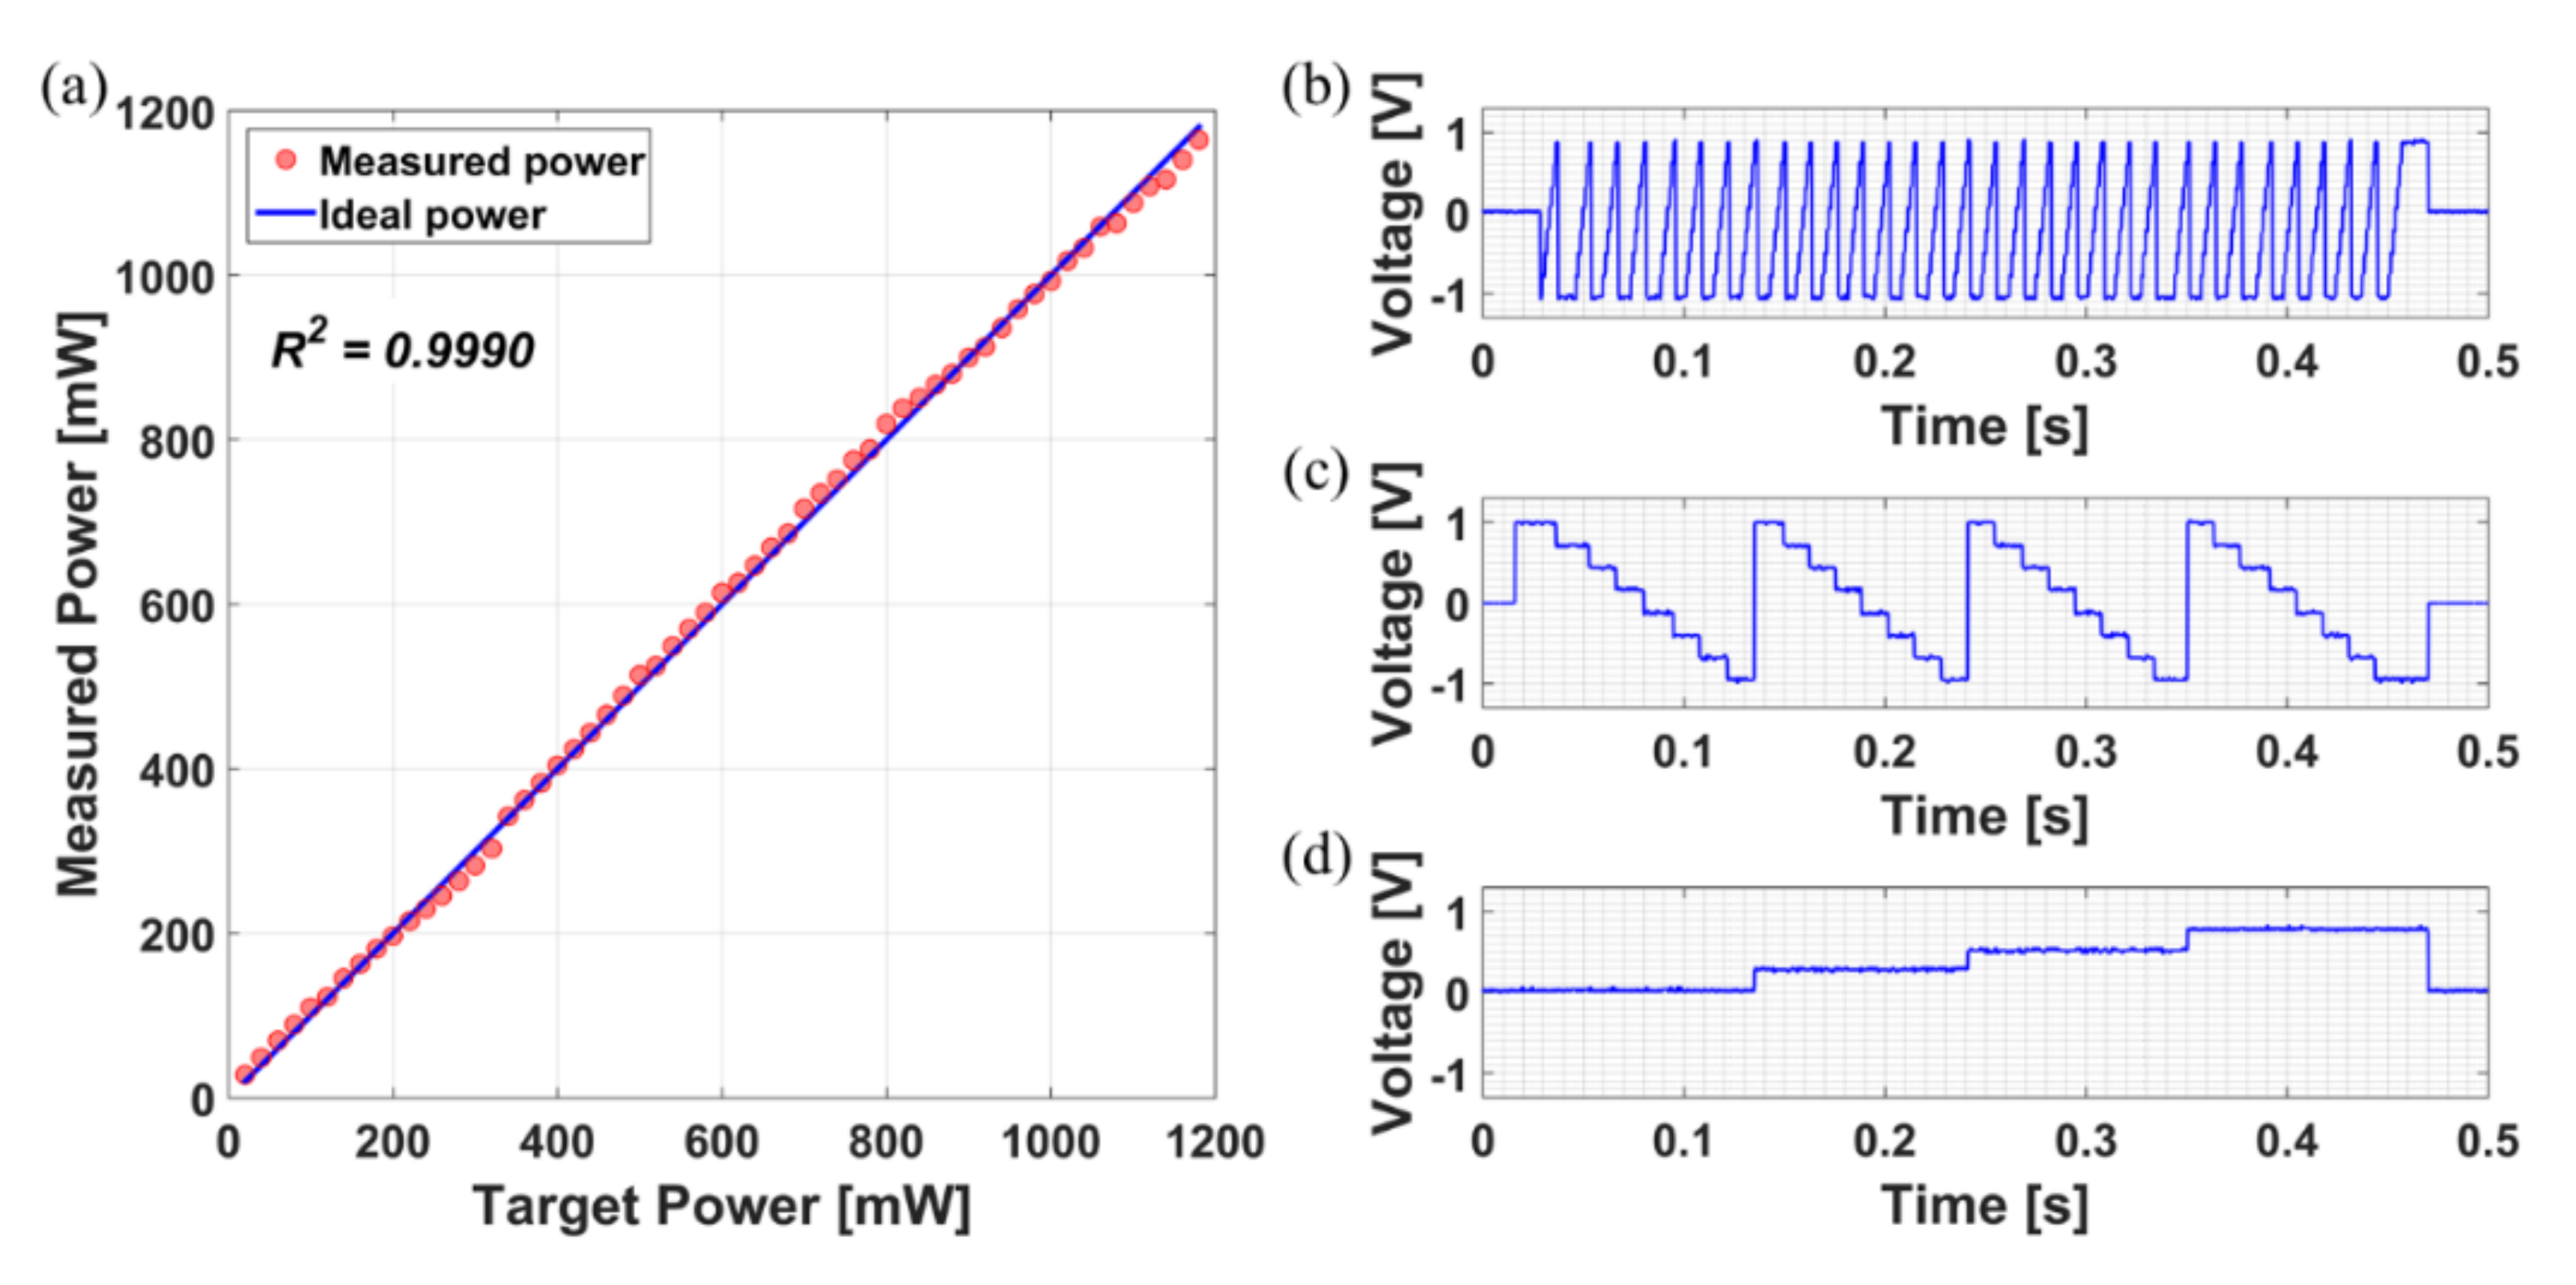
2.1.1. Laser Power Controller Module
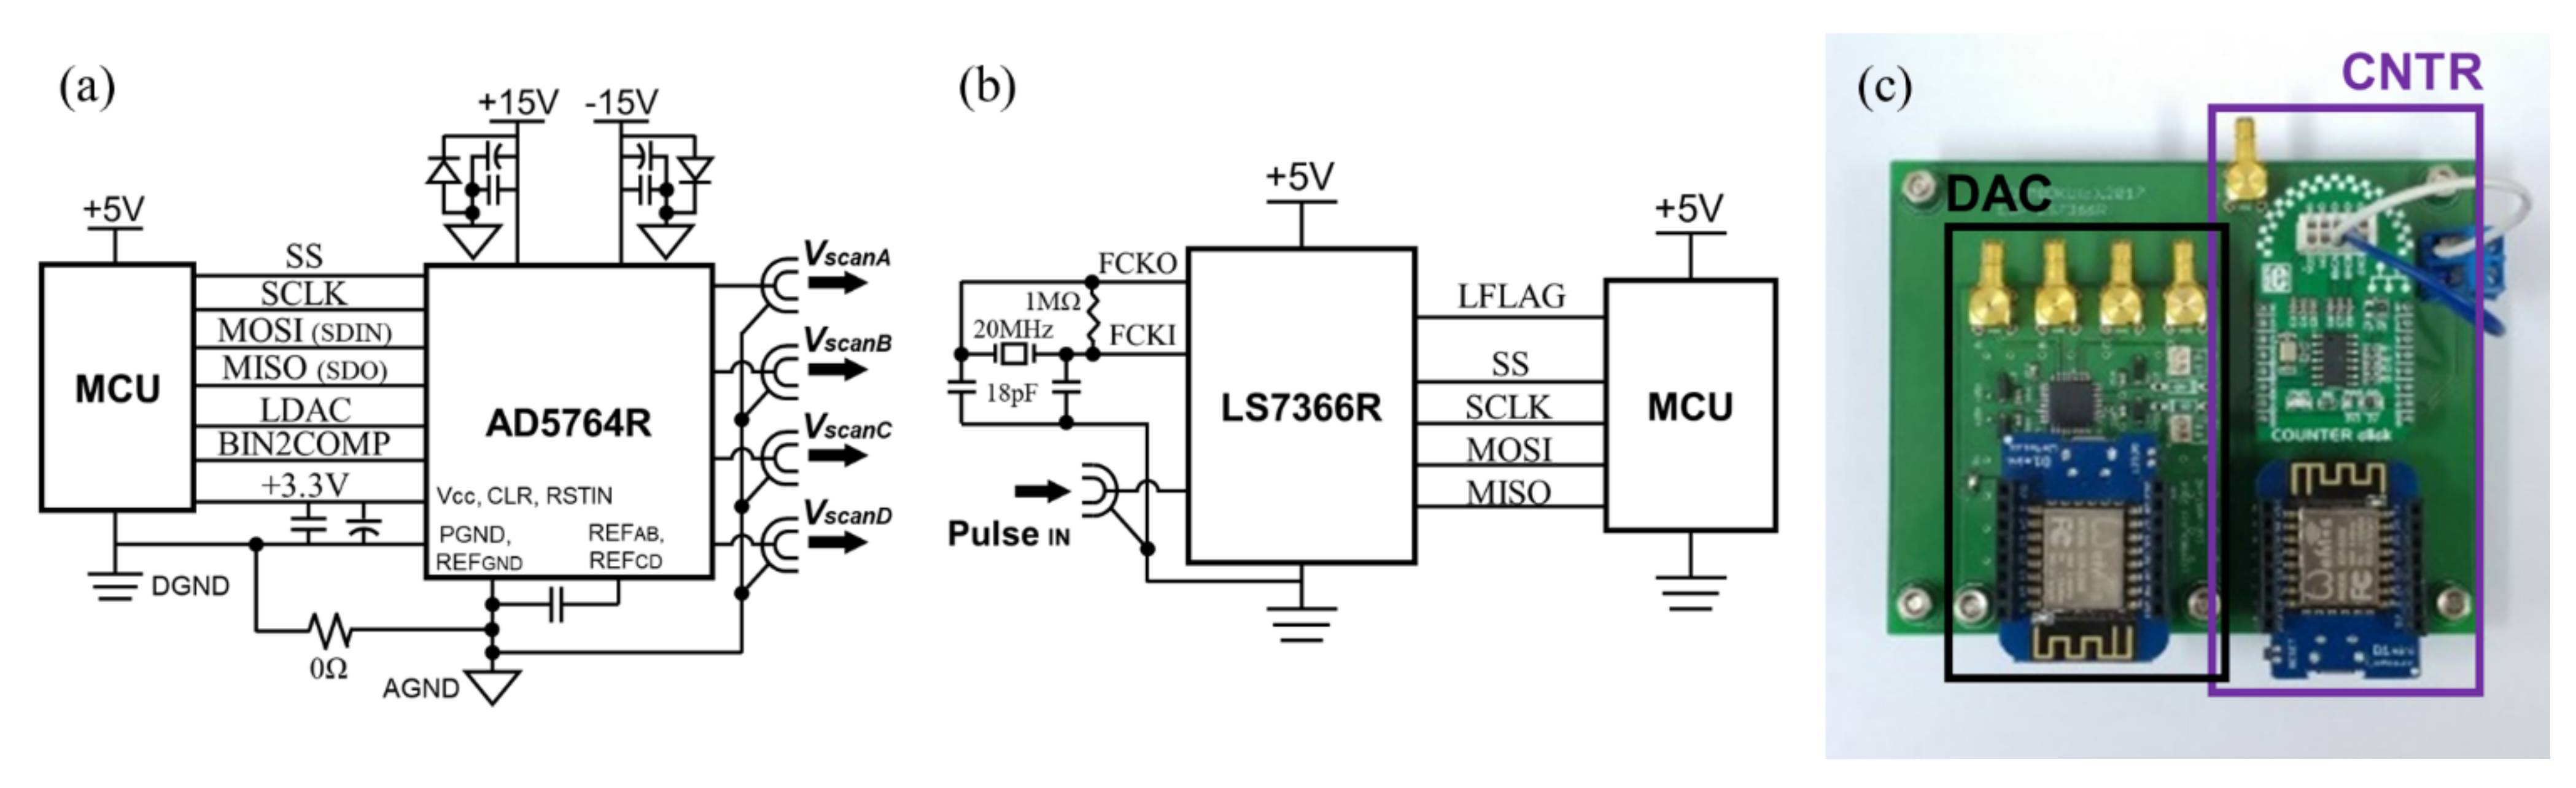
2.1.2. 3D Scanner Module
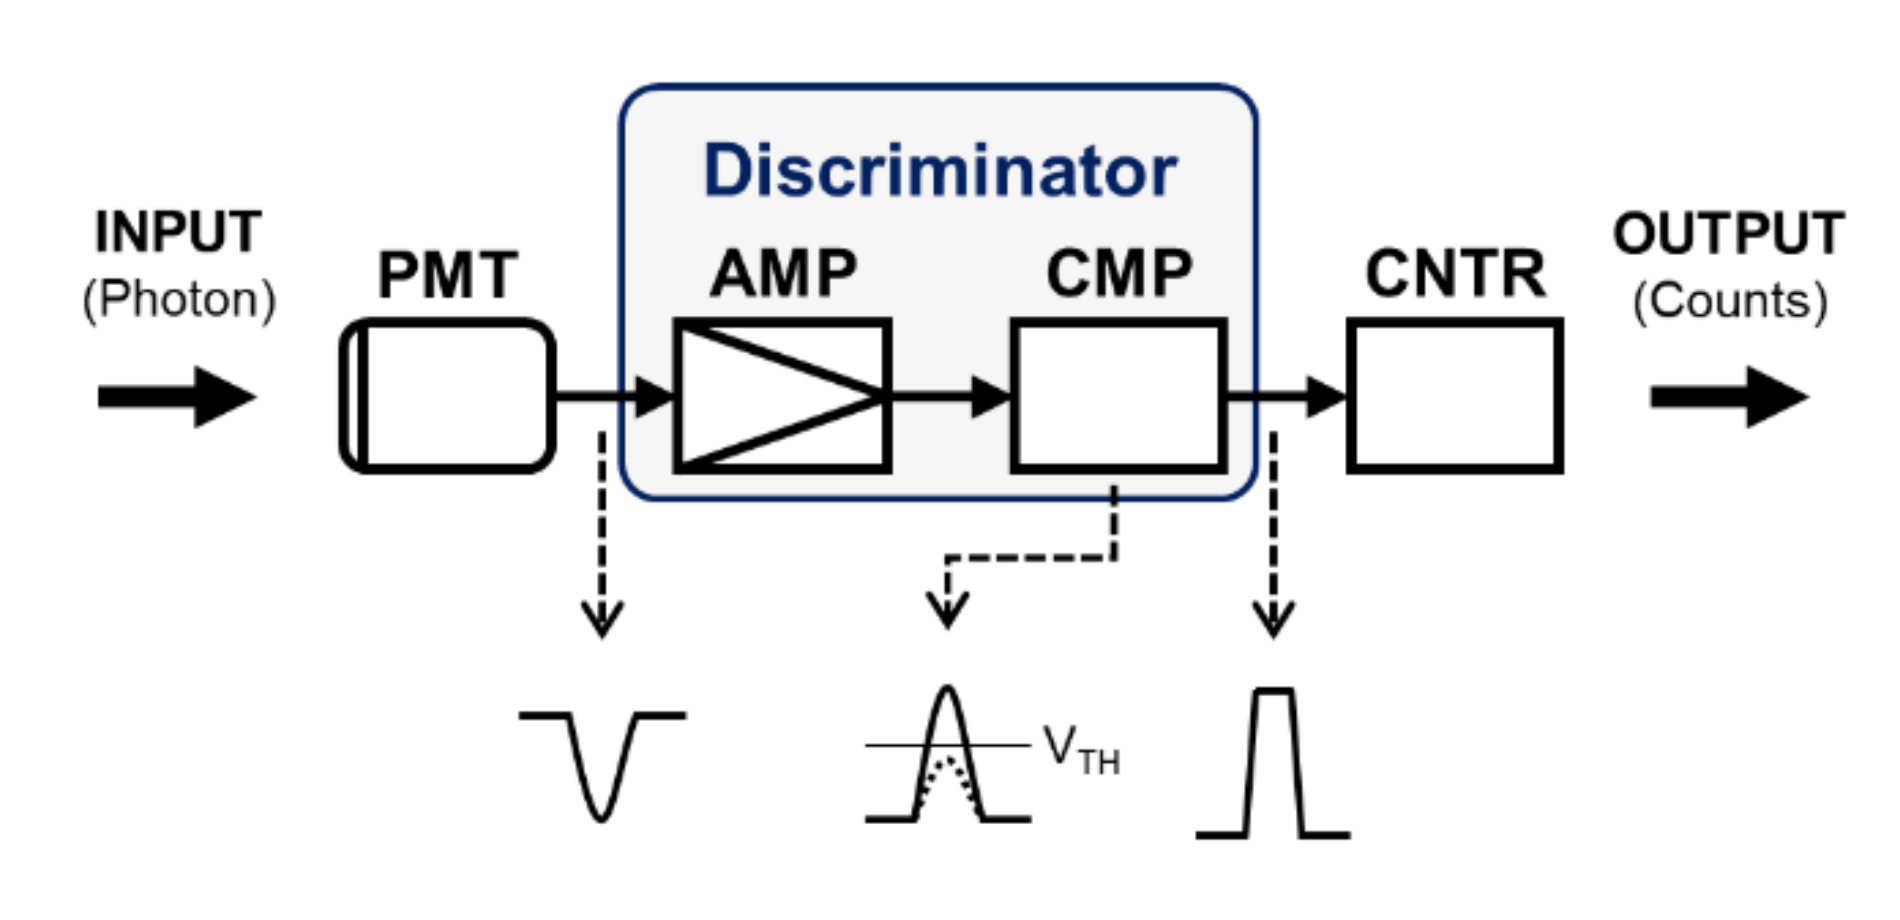
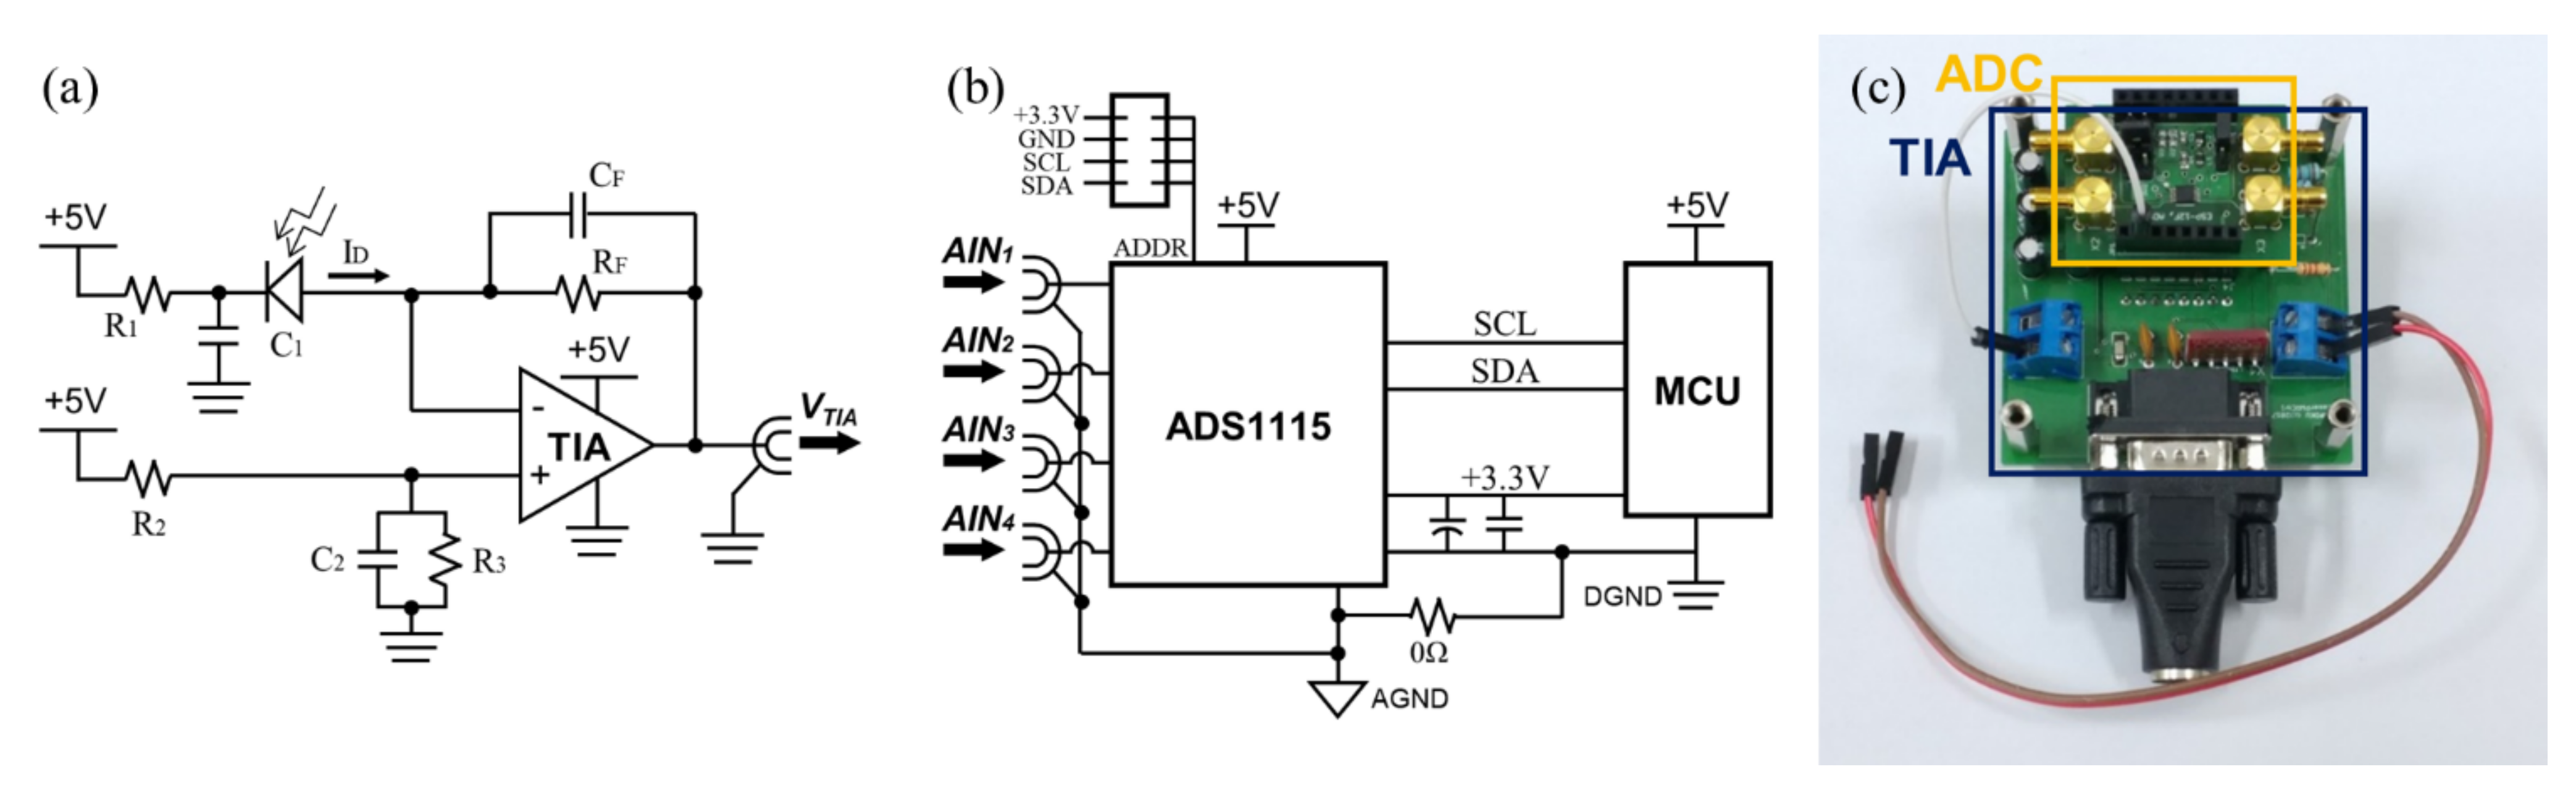
2.1.3. Photon Counter Module
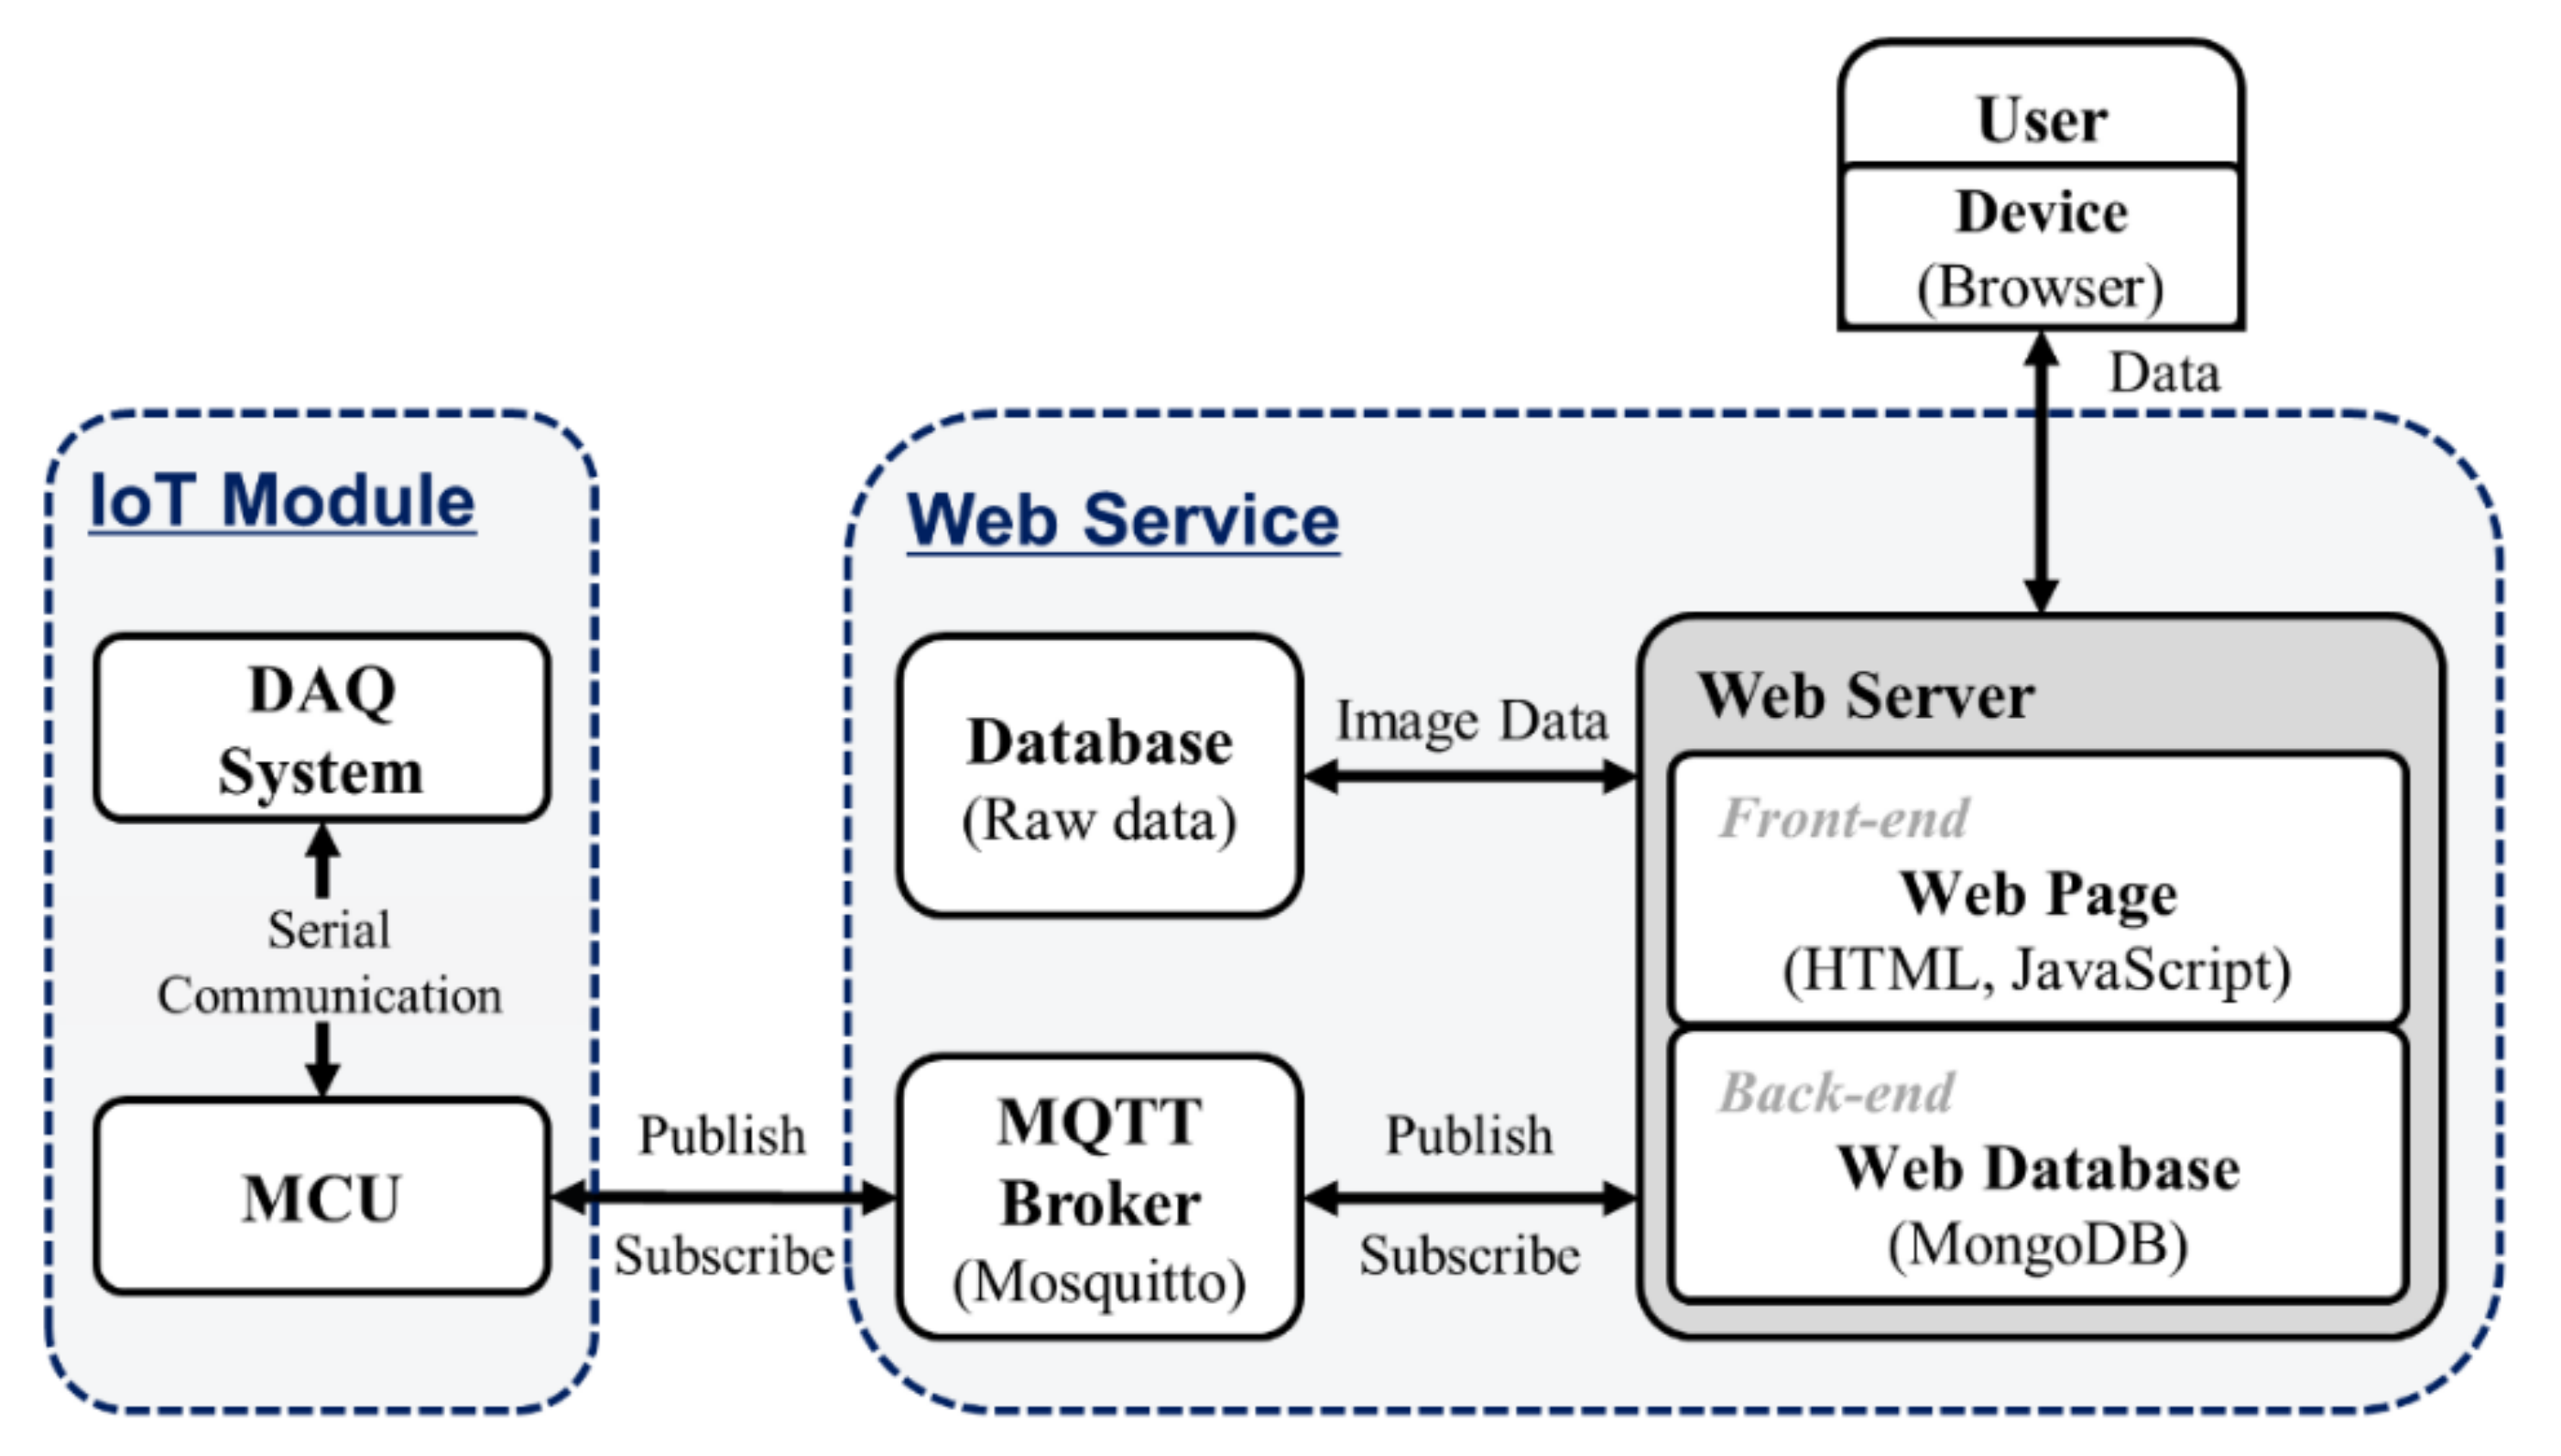
2.2. Software Design
2.2.1. Serial Communication
2.2.2. MQTT Broker
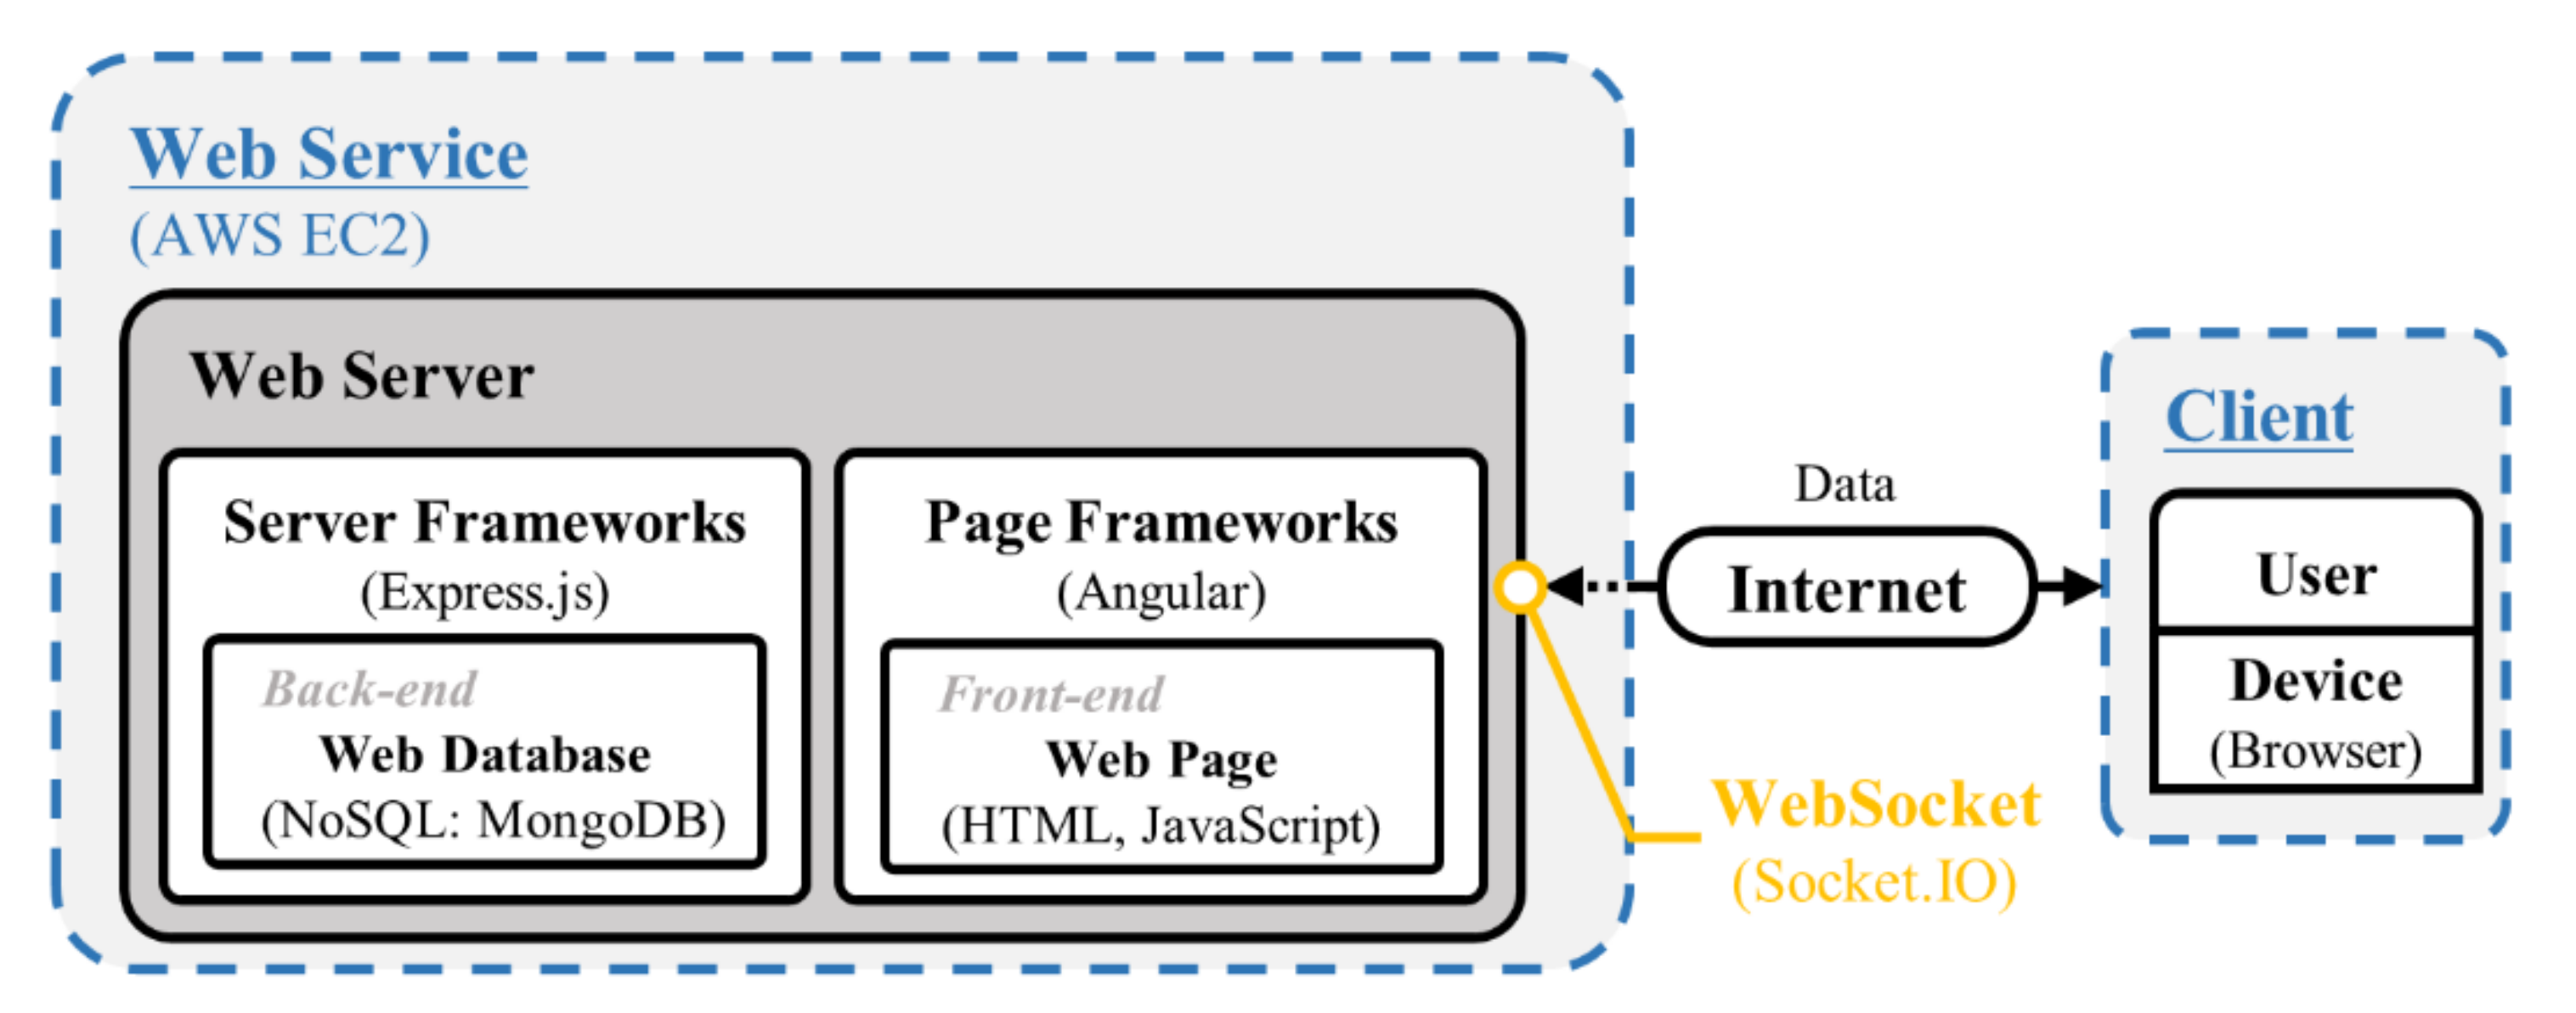
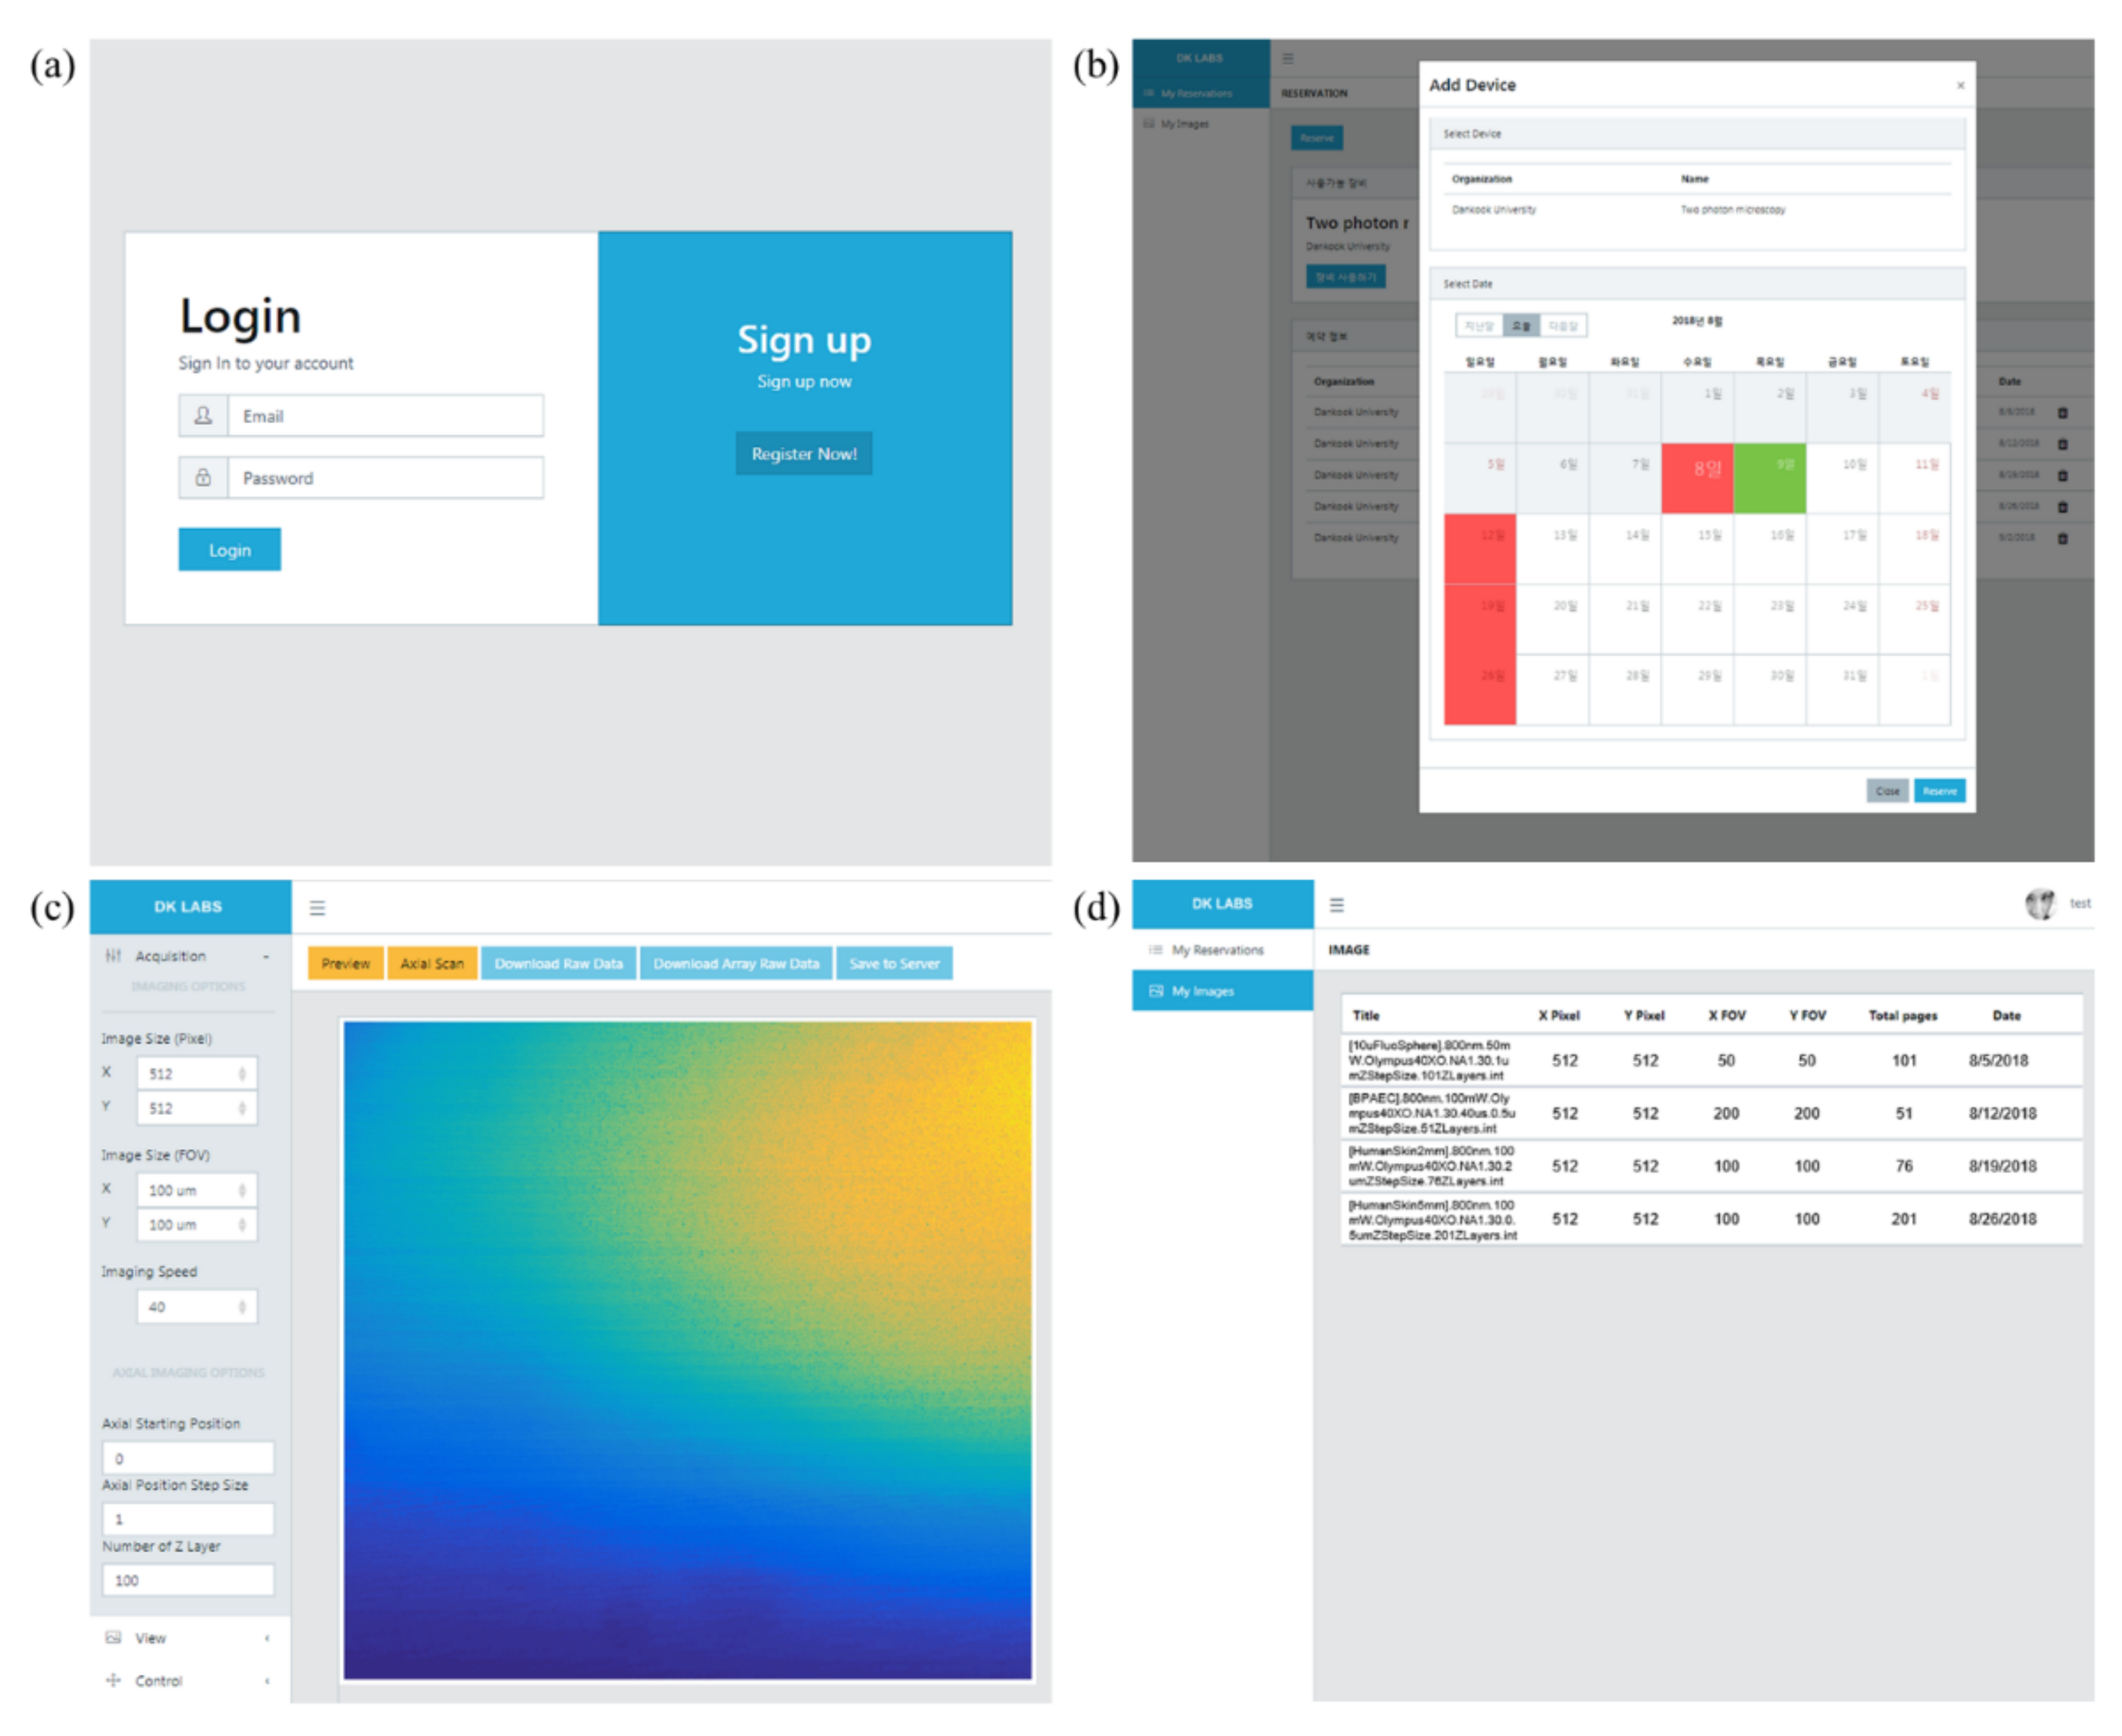
2.2.3. Web Service
3. Results
3.1. Functional Validation at the Module Level
3.2. Performance Comparison for IoT-TPLSM at the System Level
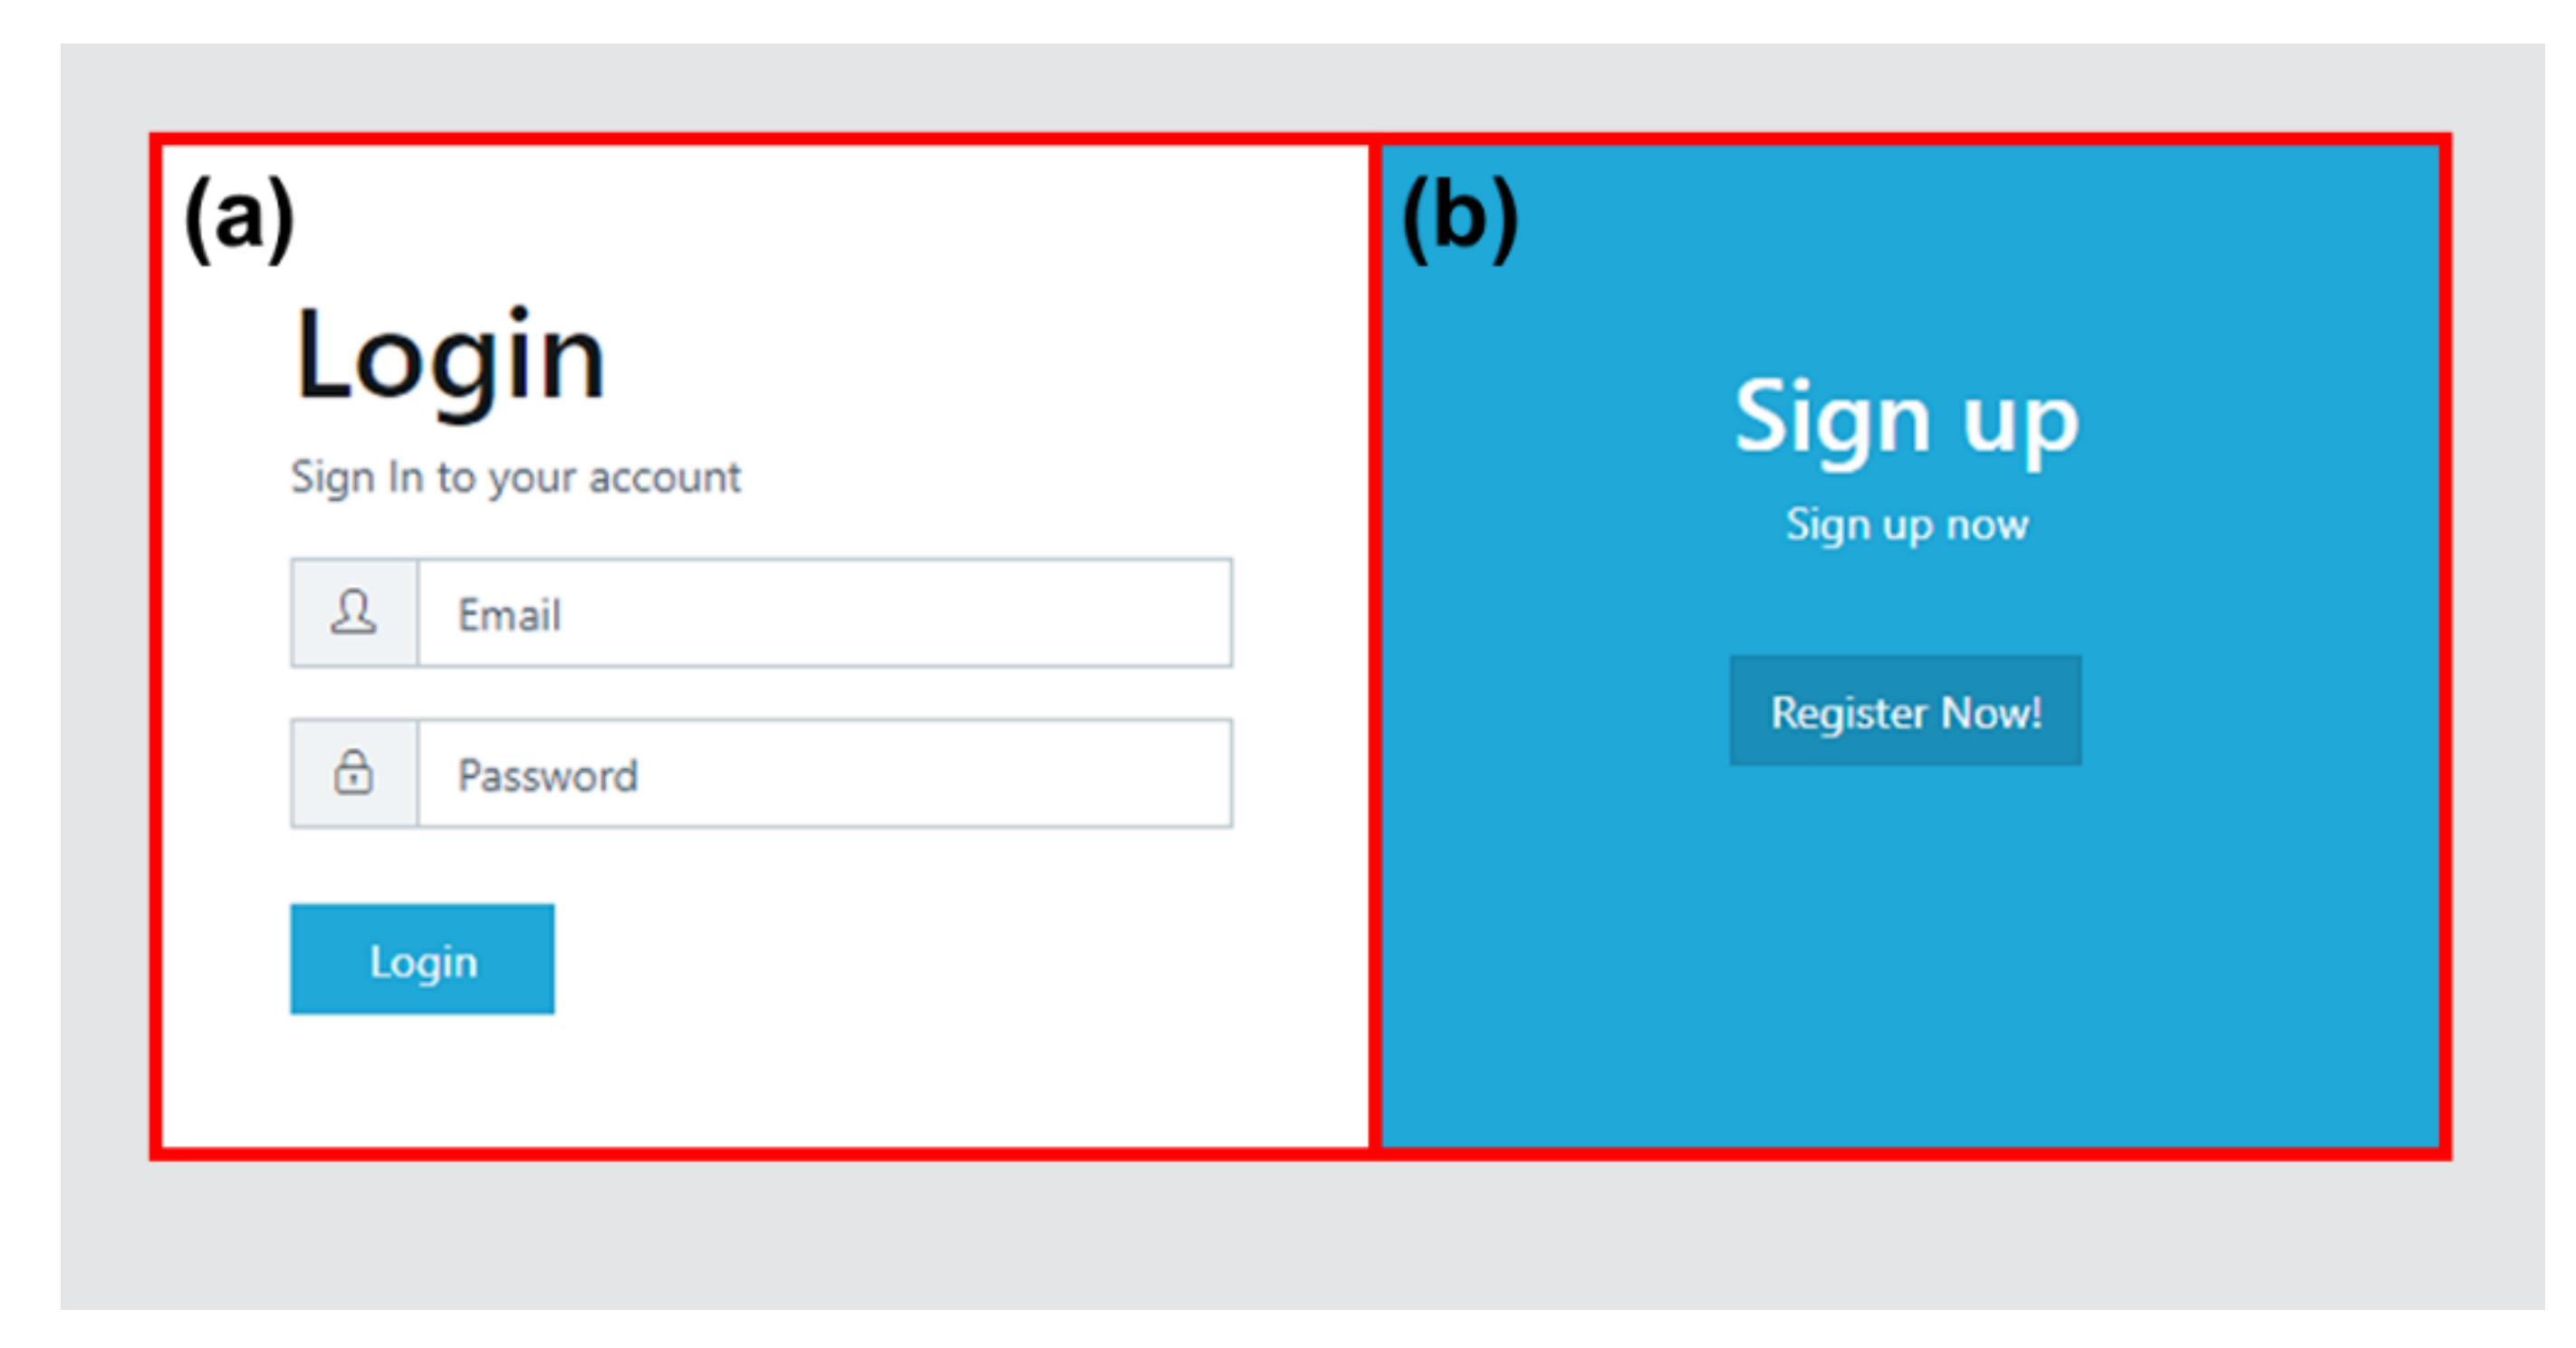
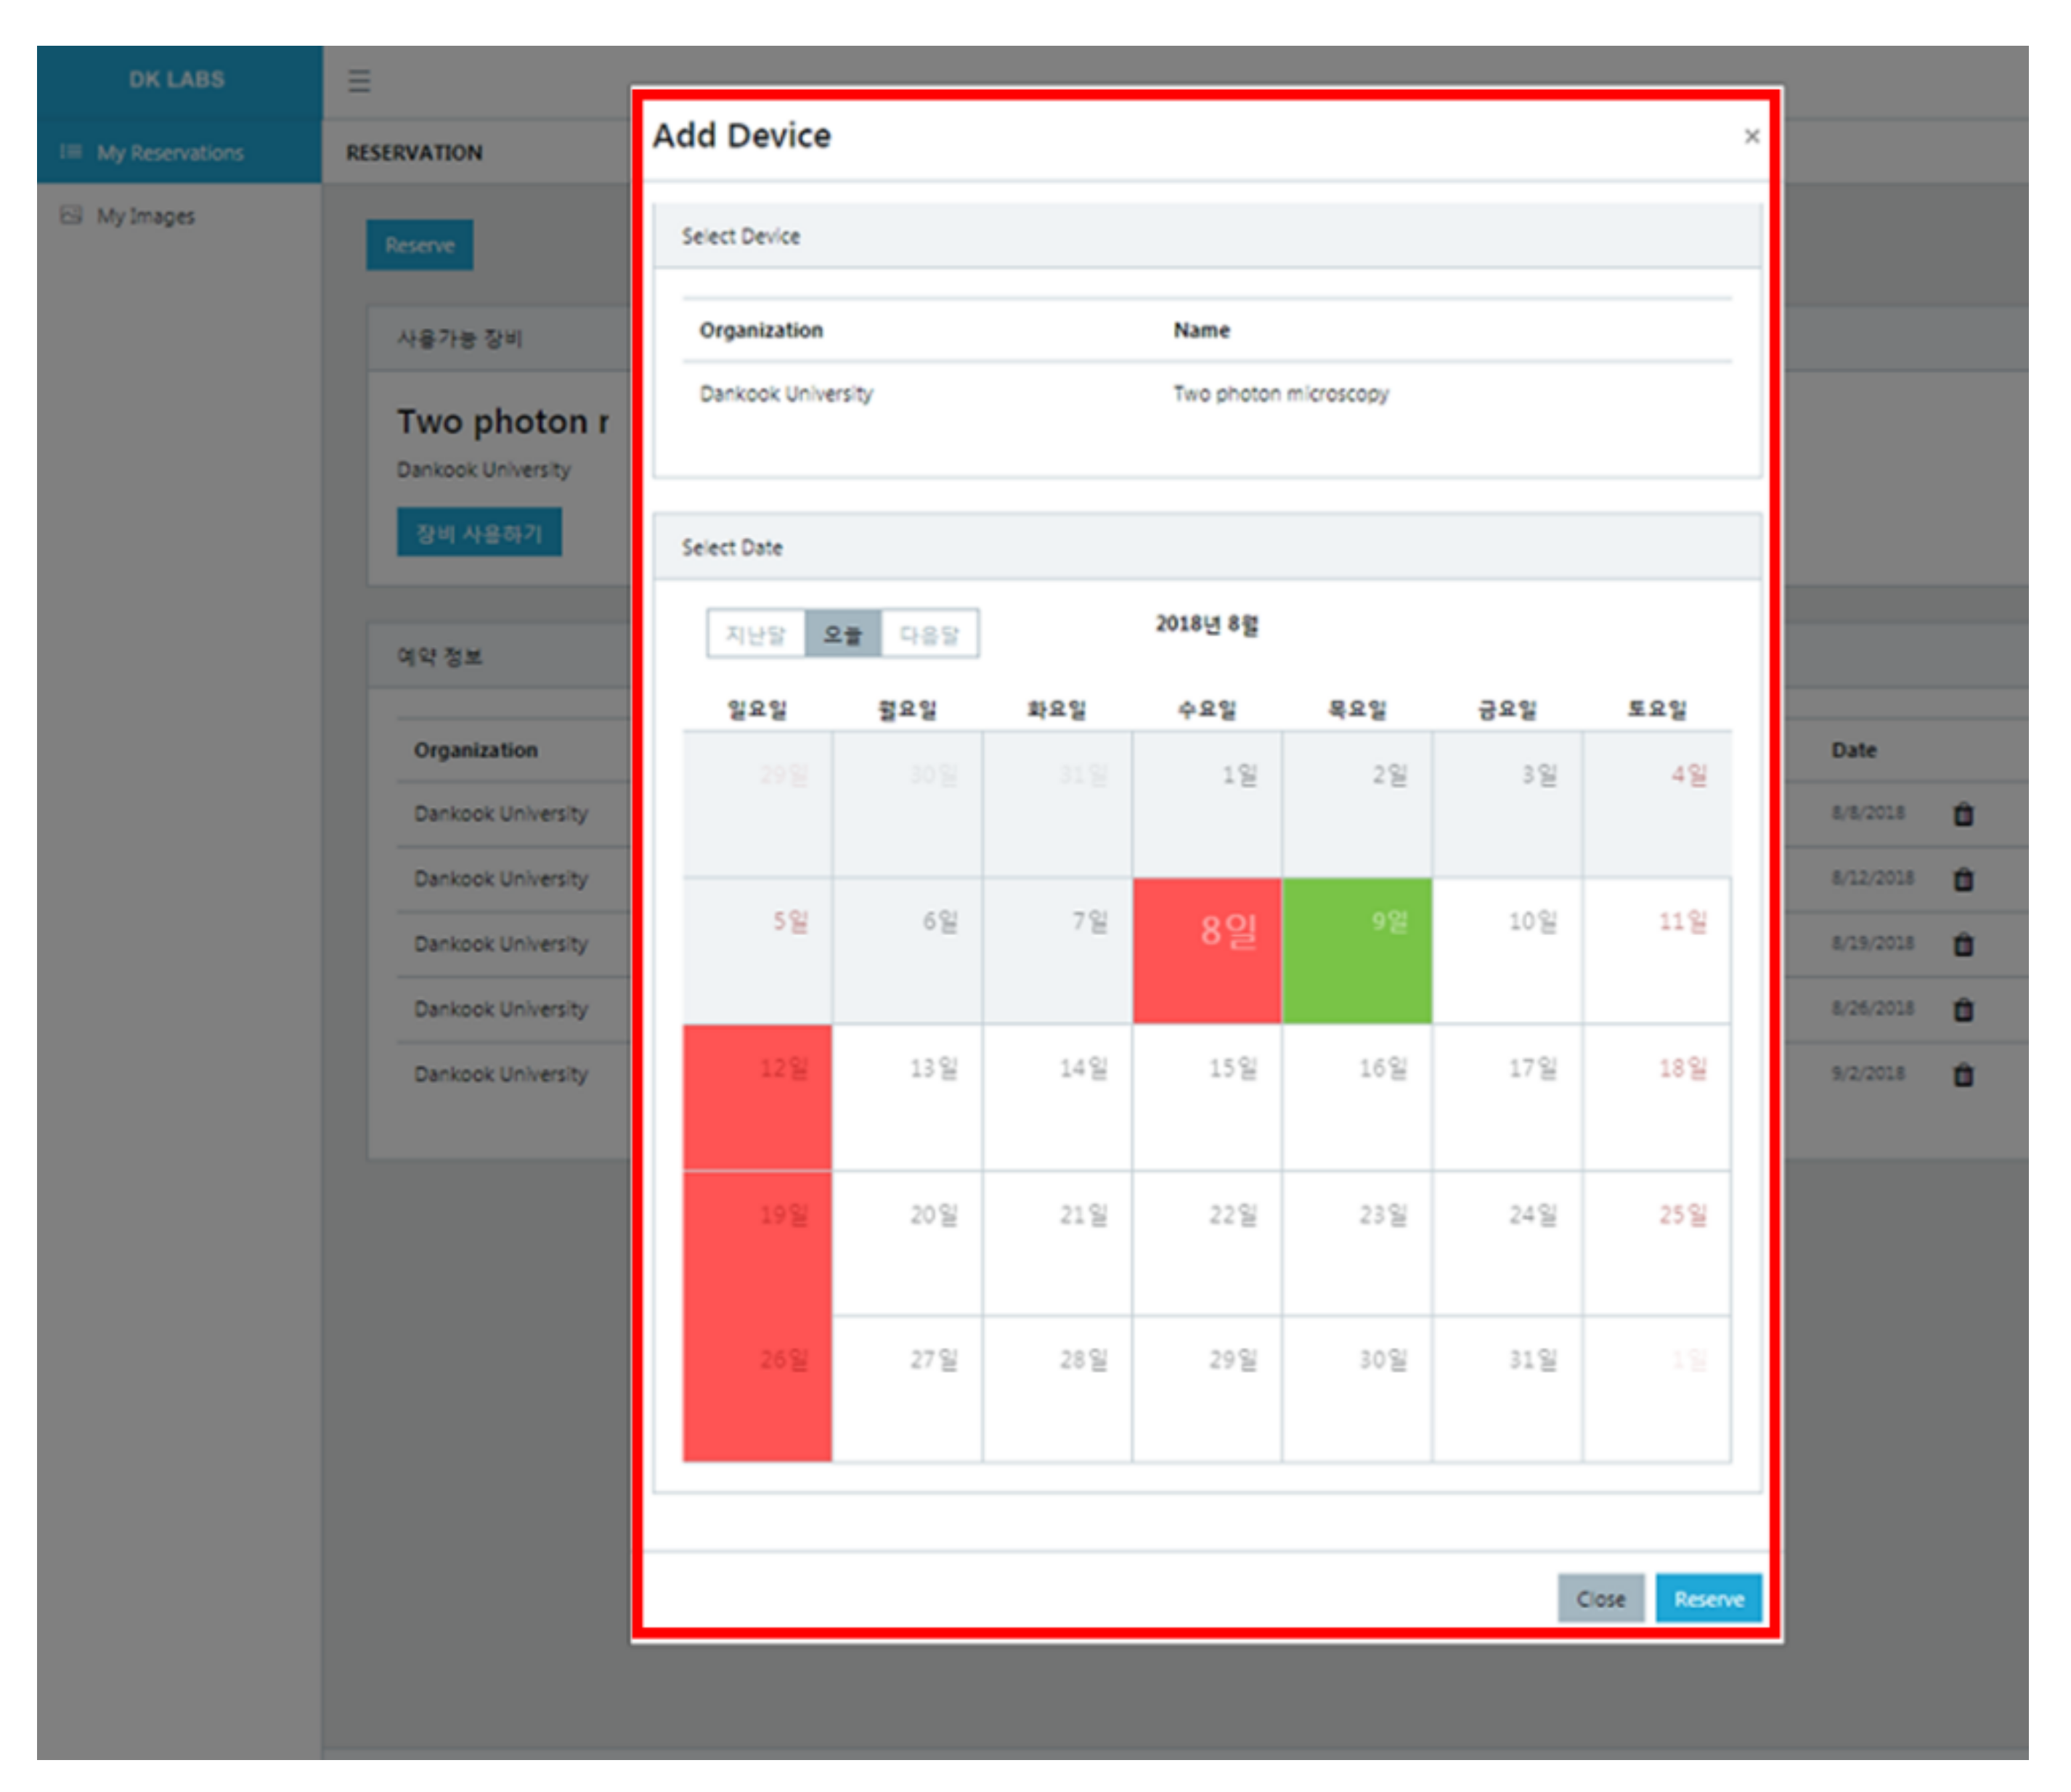
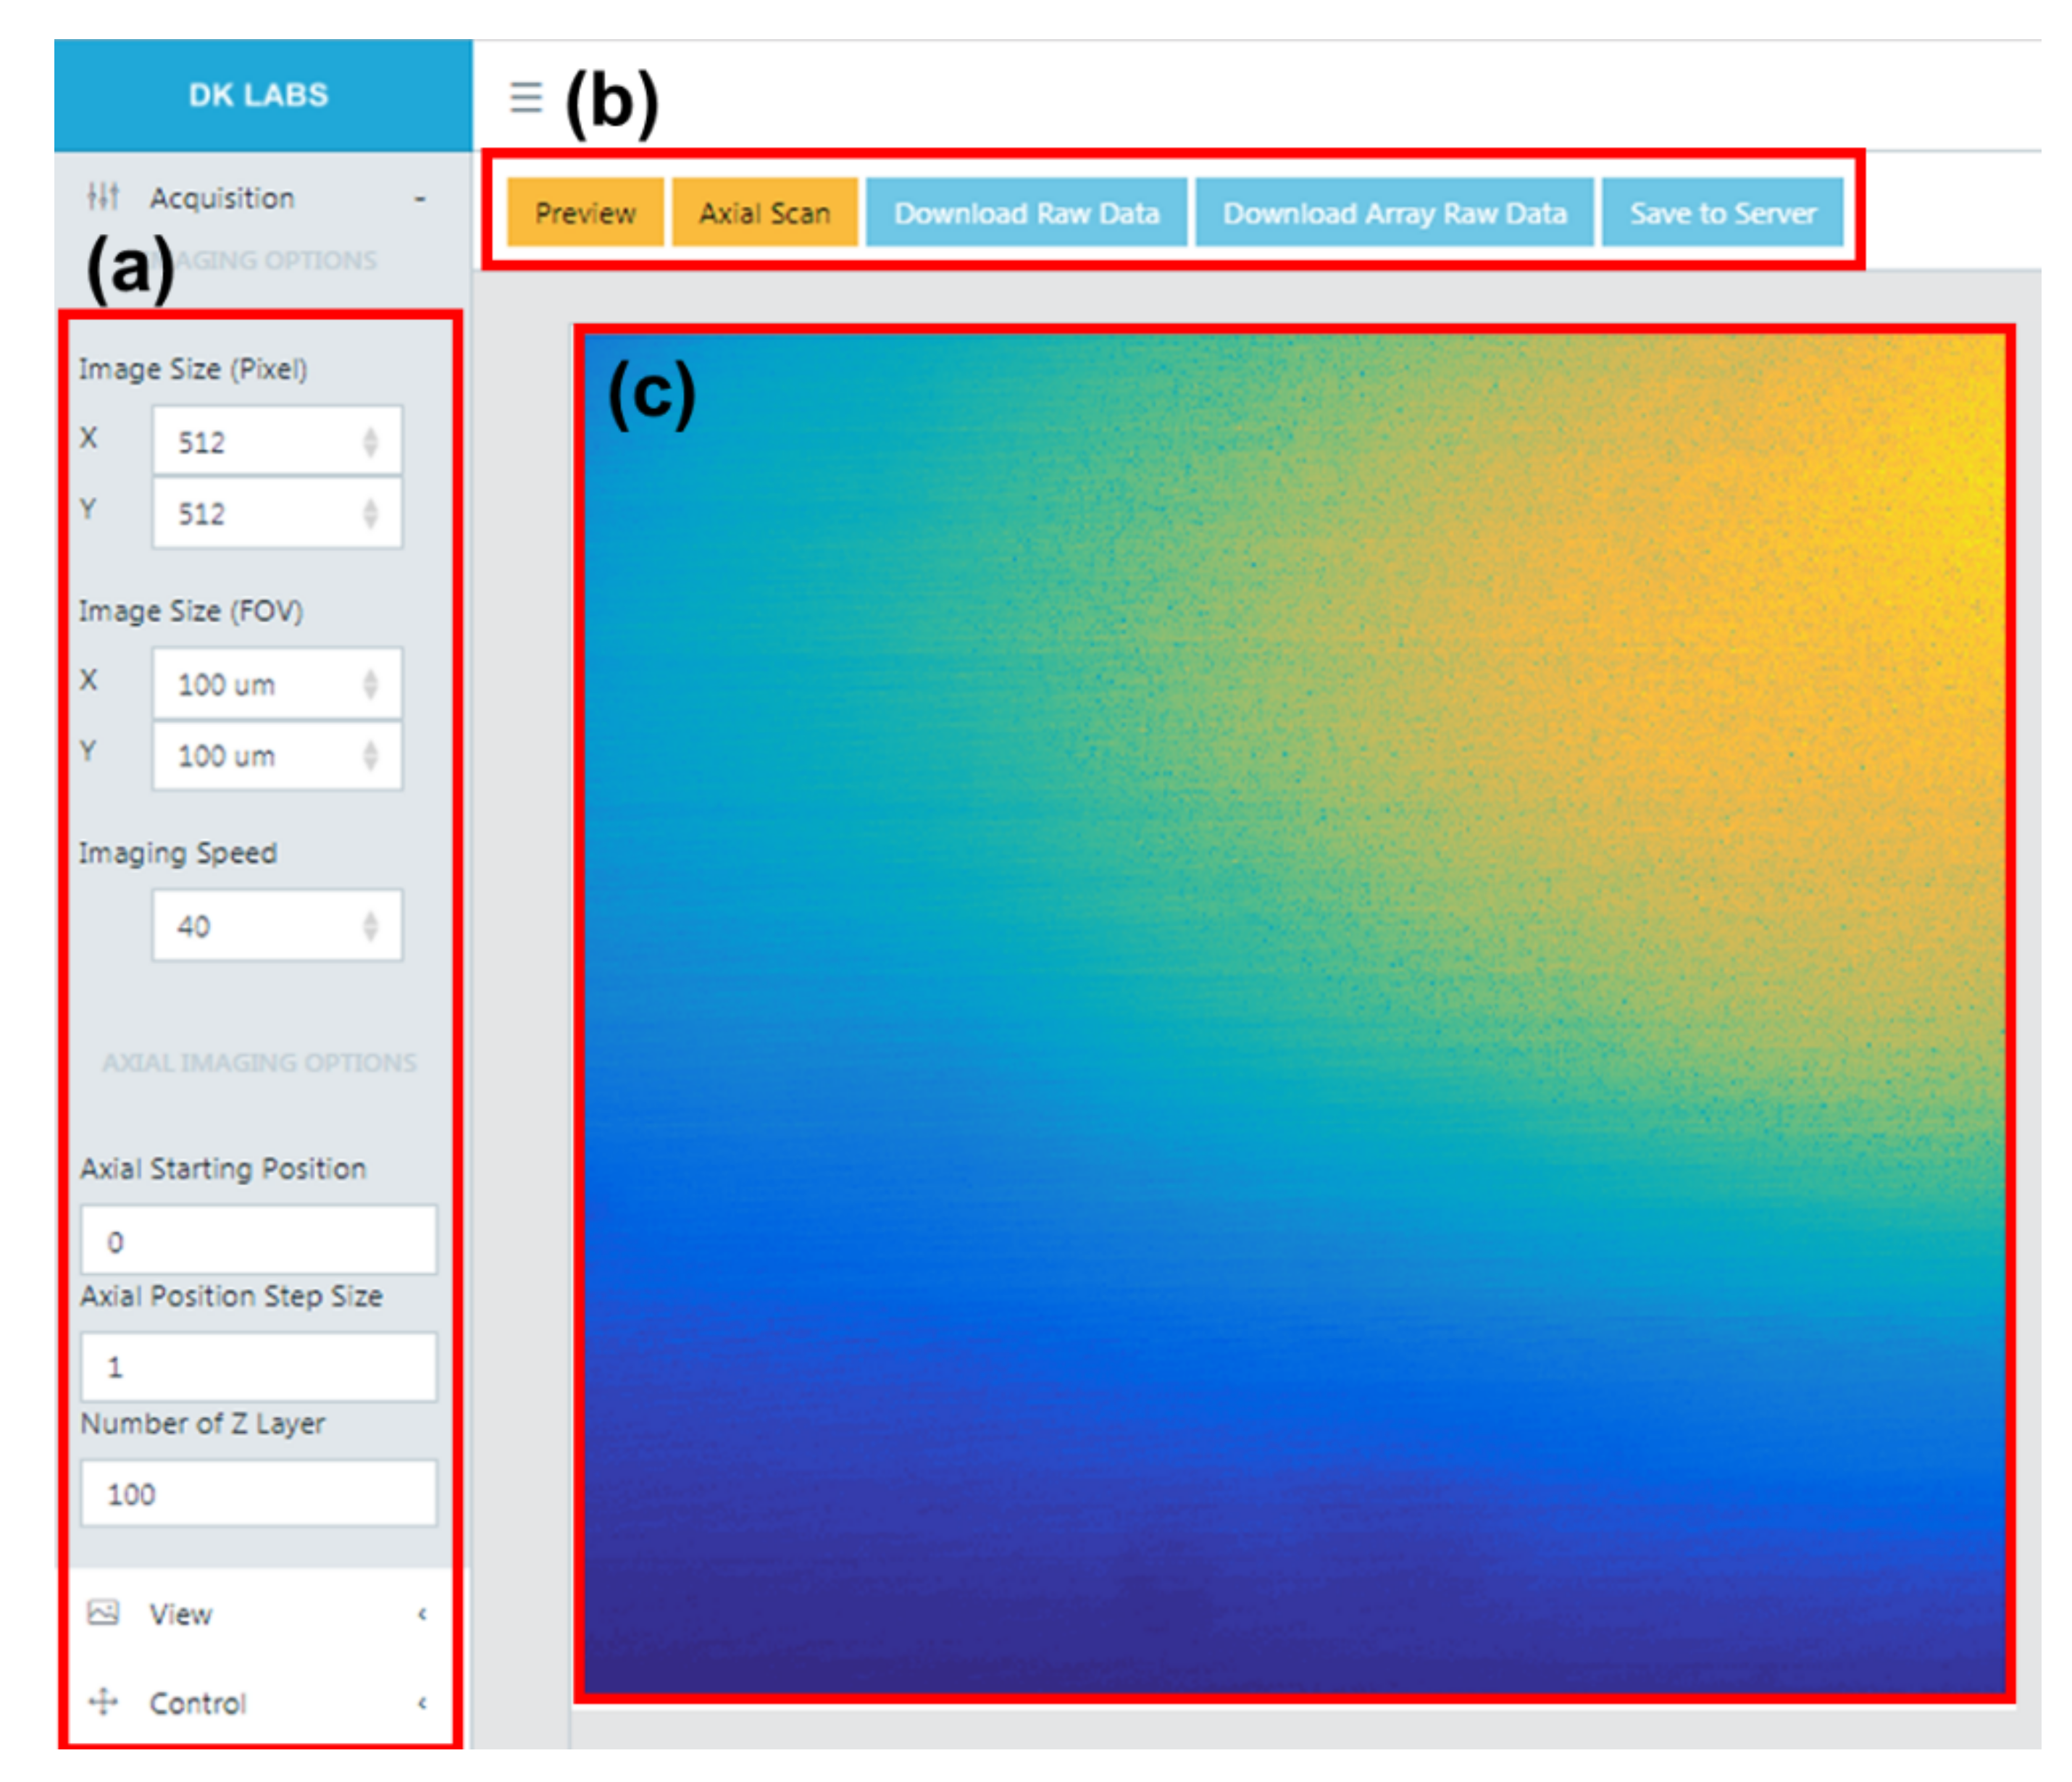
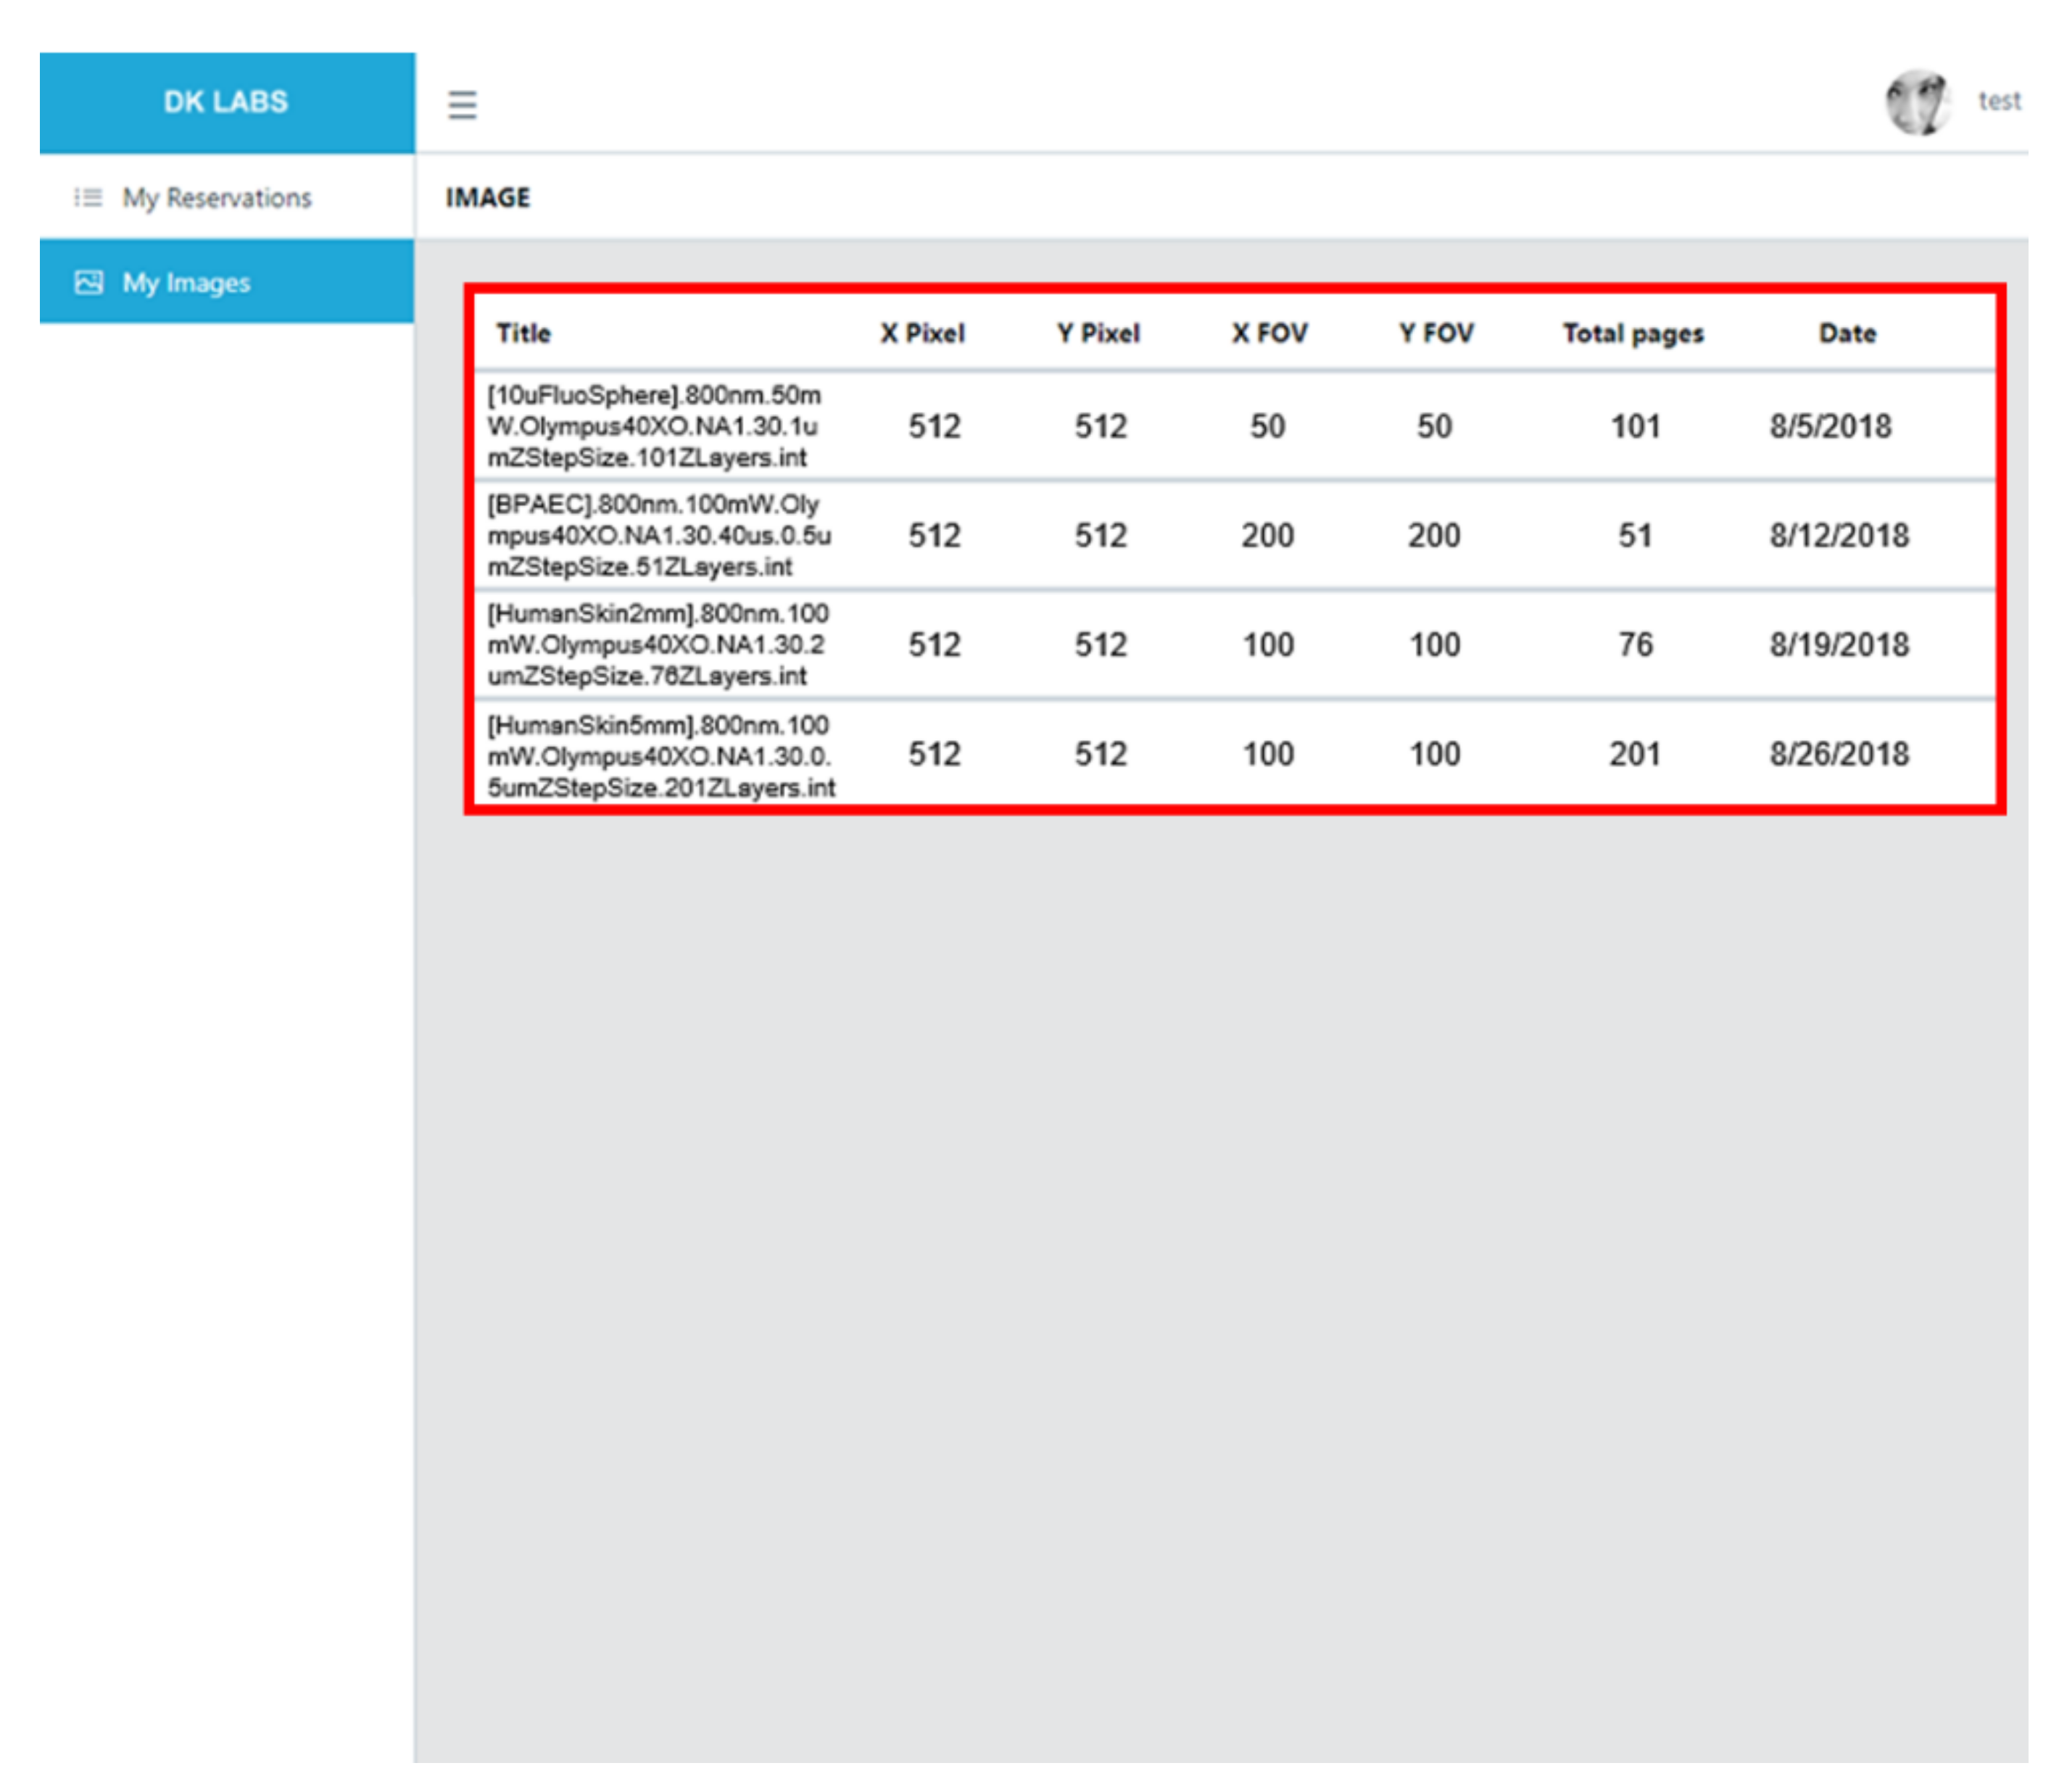
3.2.1. Web Service for IoT-TPLSM
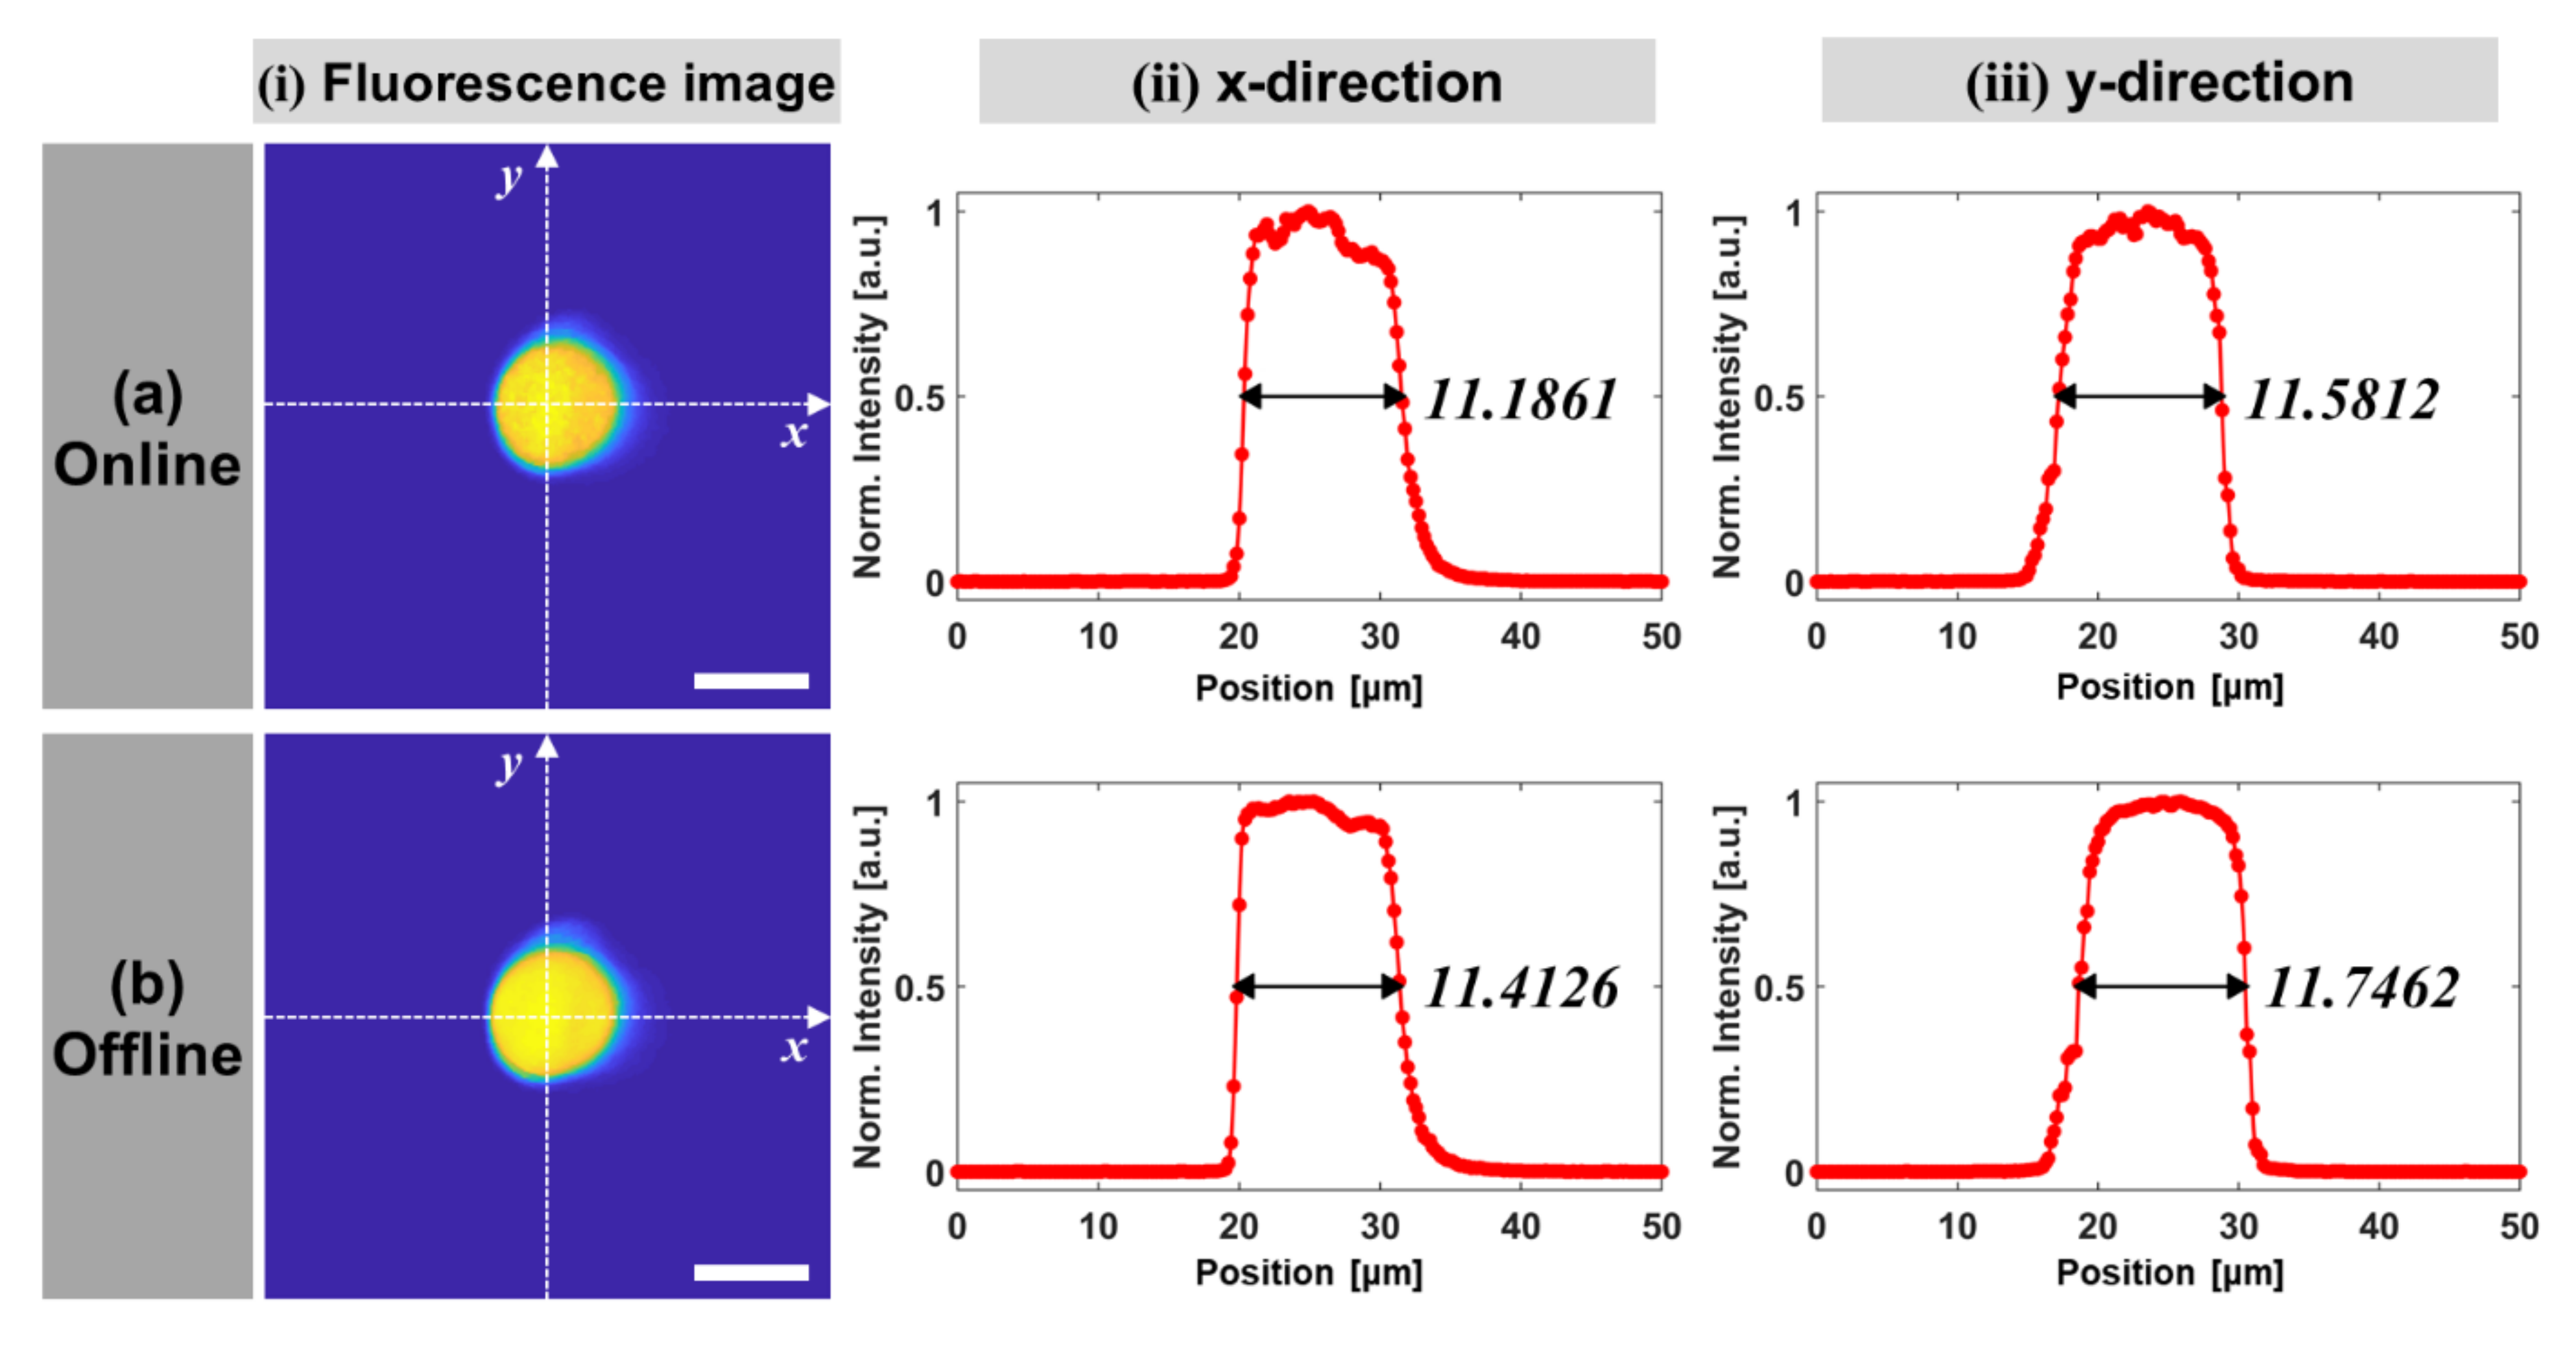
3.2.2. Precision Comparison with Fluorescent Microsphere Imaging
3.3. Demonstration of IoT-TPLSM
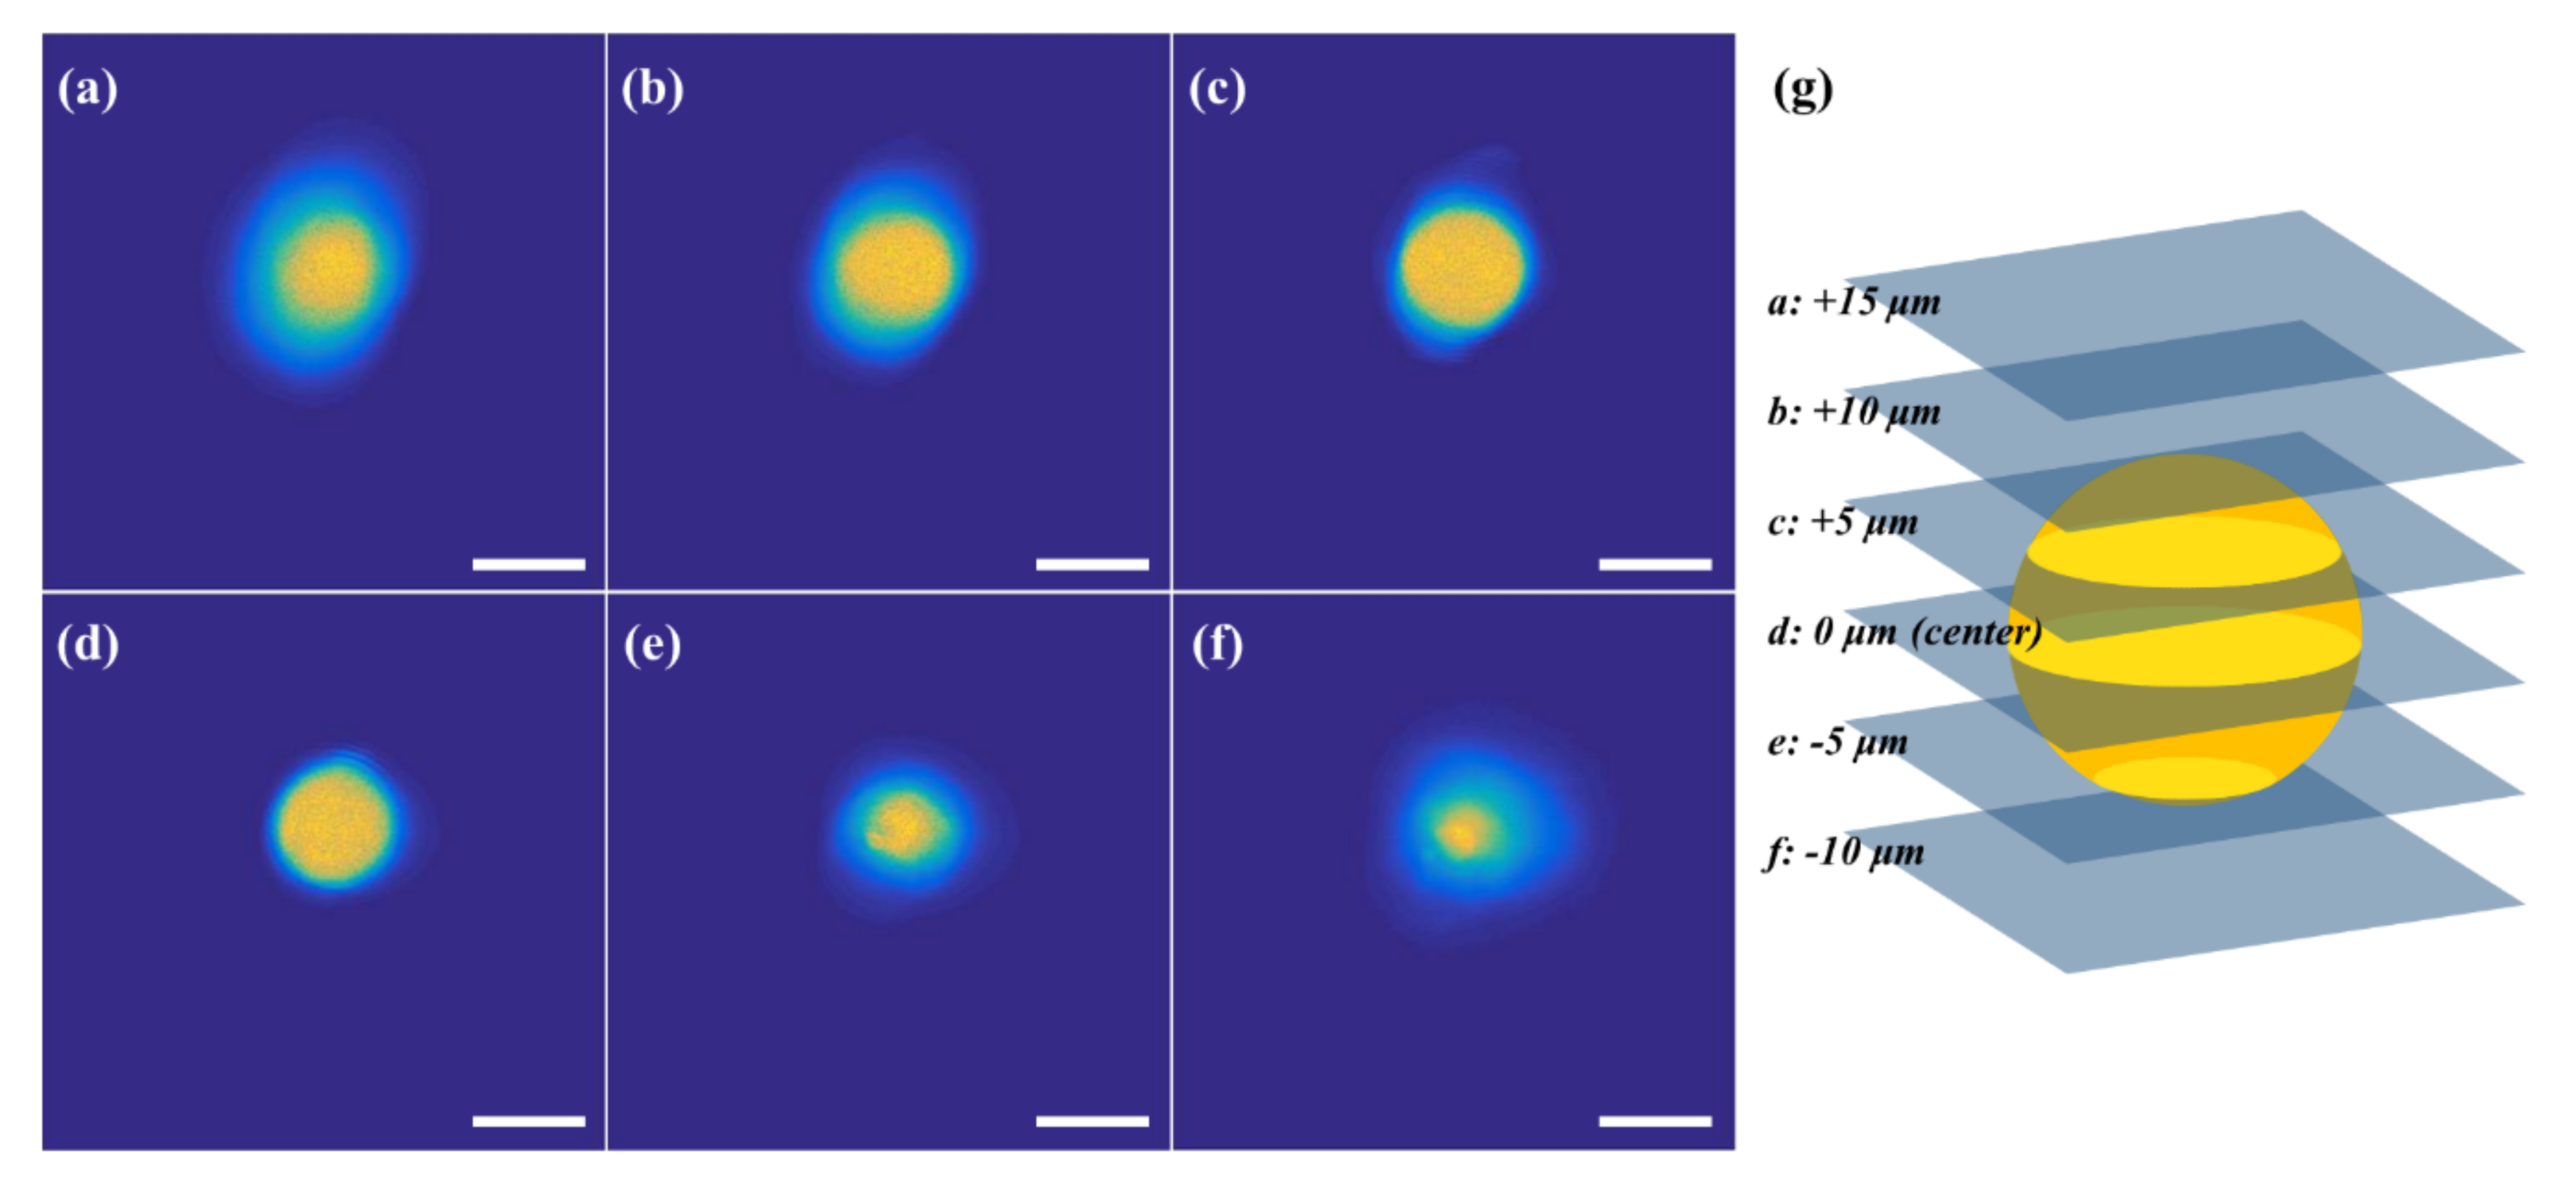
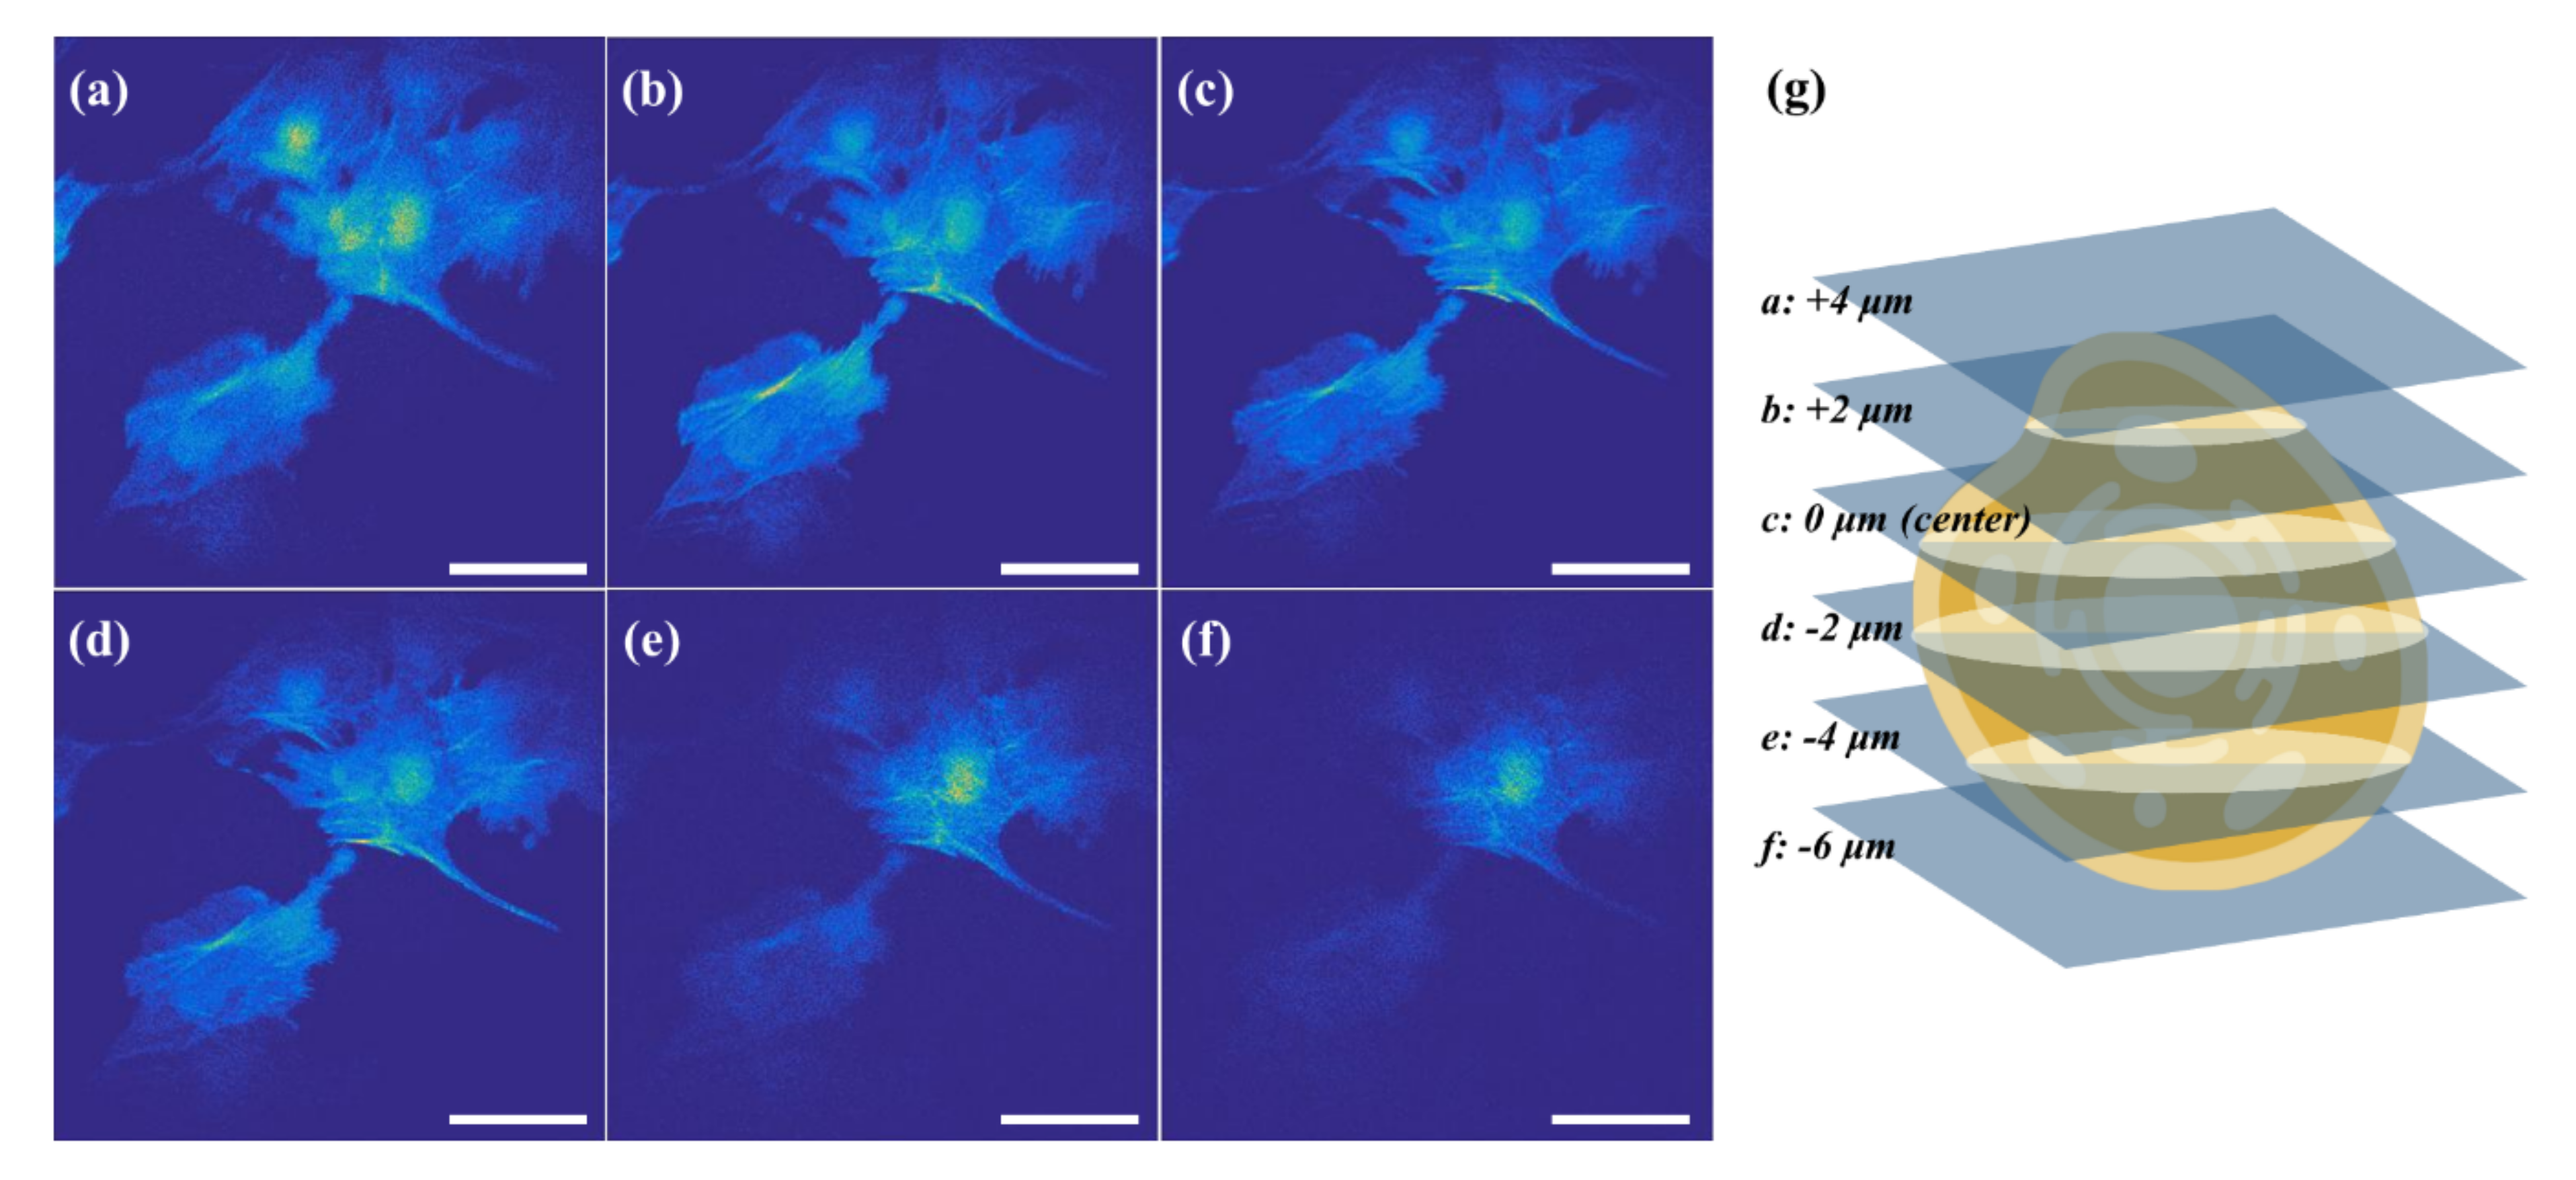
3.3.1. 3D Fluorescence Imaging at the Cellular Level
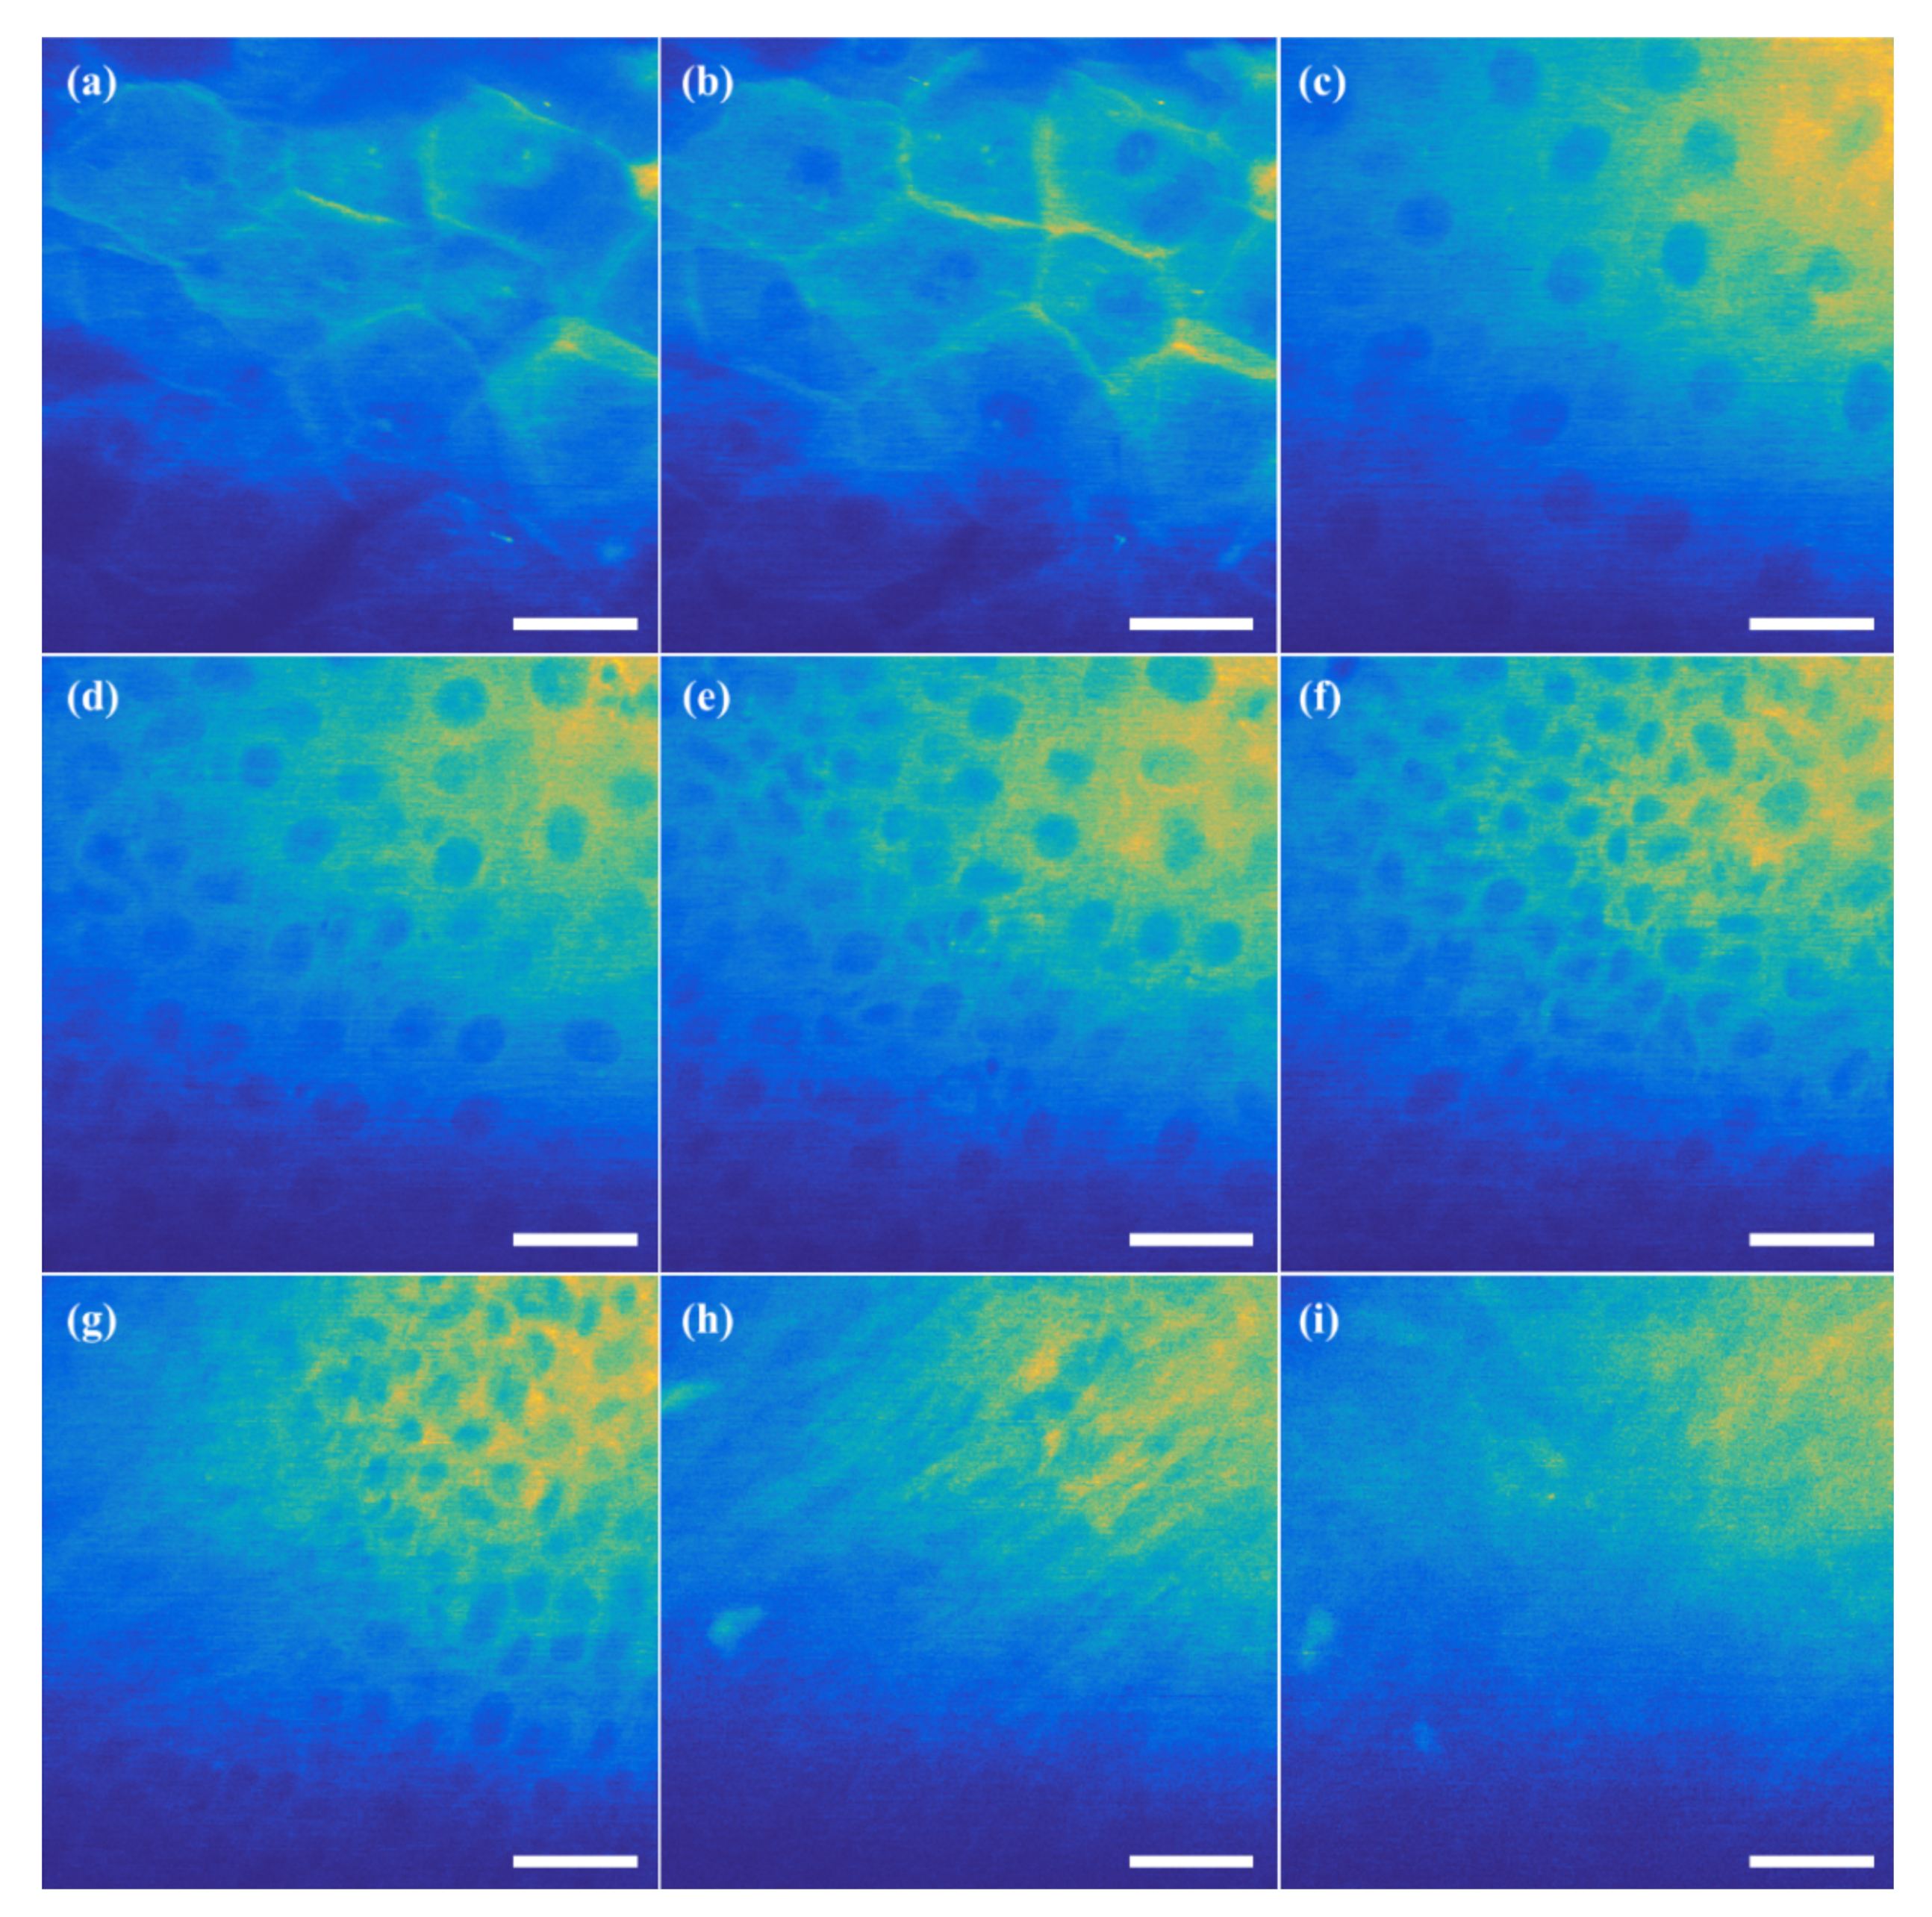
3.3.2. 3D Autofluorescence Imaging at the Tissue Level
4. Discussion and Conclusions
Author Contributions
Funding
Institutional Review Board Statement
Informed Consent Statement
Data Availability Statement
Conflicts of Interest
Appendix A. Electronic Circuits for Modules


Appendix B. IoT-TPLSM Web Service User Interfaces


References
- Schwab, K. The Fourth Industrial Revolution; Penguin Books Ltd.: London, UK, 2016; ISBN 978-024-130-075-6. [Google Scholar]
- Lee, S.H. Policy Trends of the 4th Industrial Revolution in Major Advanced Countries; Institute for Information & Communications Technology Promotion: Seoul, Korea, 2016. [Google Scholar]
- Radziwon, A.; Bilberg, A.; Bogers, M.; Madsen, E.S. The smart factory: Exploring adaptive and flexible manufacturing solutions. Procedia Eng. 2014, 69, 1184–1190. [Google Scholar] [CrossRef] [Green Version]
- Chung, K.P.; Cho, K.B.; Kim, S.W. The study of availability and factor analysis on car-sharing for sharing economy. Korean Comp. Gov. Rev. 2015, 19, 105–124. [Google Scholar] [CrossRef]
- Kwon, K.H.; Kim, H.J.; Shin, S.H.; Kim, B.H.; Seo, I.S.; No, S.C. 2015 National Research Facility Equipment Operation Management Survey Report; Ministry of Science, ICT and Future Planning: Daejeon, Korea, 2015.
- University of Cambridge Research Operations Office. Available online: https://www.research-operations.admin.cam.ac.uk/policies/equipment-sharing (accessed on 5 August 2020).
- Equipment.data. Available online: http://equipment.data.ac.uk/ (accessed on 5 August 2020).
- UNIVERSITIES, U.K. Efficiency, Effectiveness and Value for Money; Universities UK: London, UK, 2015. [Google Scholar]
- Eppendorf AG. Available online: https://online-shop.eppendorf.us/US-en/Freezers-44537/Sample-Management-376575/eLABInventory-software-PF-372725.html (accessed on 28 July 2020).
- Wageningen University & Research. Available online: https://www.wur.nl/en/Value-Creation-Cooperation/Facilities/Wageningen-Shared-Research-Facilities.htm (accessed on 28 July 2020).
- The Ohio State University College of Veterinary Medicine. Available online: https://vet.osu.edu/research/shared-resources-and-equipment (accessed on 28 July 2020).
- Sánchez, J.; Dormido, S.; Pastor, R.; Morilla, F. A Java/Matlab-based environment for remote control system laboratories: Illustrated with an inverted pendulum. IEEE Trans. Educ. 2004, 47, 321–329. [Google Scholar] [CrossRef]
- Ann, Y.H.; Kang, J.S.; Jung, H.J.; Kim, H.S.; Jung, H.S.; Han, H.; Jeong, J.M.; Gu, J.E.; Lee, S.D.; Lee, J.S.; et al. Remote access and data acquisition system for high voltage electron microscopy. Appl. Microsc. 2006, 36, 7–16. [Google Scholar]
- Greengard, S. The Internet of Things, 1st ed.; MIT Press: Cambridge, MA, USA, 2015; ISBN 978-15-3450-774-6. [Google Scholar]
- Jung, H.; Park, C.W. Design and Implementation of MQTT Based Real-time HVAC Control Systems. J. Korea Inst. Inf. Commun. Eng. 2015, 19, 1163–1172. [Google Scholar] [CrossRef] [Green Version]
- Susila, I.P.; Istofa; Kusuma, G.; Sukandar; Isnaini, I. Development of IoT based meteorological and environmental gamma radiation monitoring system. In Proceedings of the 4th International Conference on Engineering, Technology, and Industrial Application (ICETIA2017), Surakarta, Indonesia, 13–14 December 2017; p. 060004. [Google Scholar]
- Antony, J.; Mathuria, D.S.; Datta, T.S.; Maity, T. Development of intelligent instruments with embedded HTTP servers for control and data acquisition in a cryogenic setup—The hardware, firmware, and software implementation. Rev. Sci. Instrum. 2015, 86, 125003. [Google Scholar] [CrossRef] [PubMed]
- Seo, J.O.; Kim, C.W. Design and Implementation of Realtime Things Control System Using MQTT and WebSocket in IoT Environment. J. Korea Inst. Electron. Commun. Sci. 2018, 13, 517–524. [Google Scholar] [CrossRef]
- Owen, T. Fundamentals of Modern UV-Visible Spectroscopy Principles and Applications of UV-Visible Spectroscopy; Agilent Technologeis: Santa Clara, CA, USA, 1996. [Google Scholar]
- Nurseitov, N.; Paulson, M.; Reynolds, R.; Izurieta, C. Comparison of JSON and XML data interchange formats: A case study. Caine 2009, 9, 157–162. [Google Scholar]
- Behnel, S.; Fiege, L.; Muhl, G. On quality-of-service and publish-subscribe. In Proceedings of the 26th IEEE International Conference on Distributed Computing Systems Workshops (ICDCSW’06), Lisboa, Portugal, 4–7 July 2006; p. 20. [Google Scholar]
- Nyati, S.S.; Pawar, S.; Ingle, R. Performance evaluation of unstructured NoSQL data over distributed framework. In Proceedings of the IEEE International Conference on Advances in Computing, Communications and Informatics (ICACCI), Mysore, India, 22–25 August 2013; pp. 1623–1627. [Google Scholar]
- Chang, B.; Zhao, G.; Imran, M.A.; Chen, Z.; Li, L. Dynamic wireless QoS analysis for real-time control in URLLC. In Proceedings of the 2018 IEEE Globecom Workshops (GC Wkshps), Abu Dhabi, United Arab Emirates, 9–13 December 2018; pp. 1–5. [Google Scholar]
- Zhang, Z.; Jin, Y. Design of Temperature Remote Monitoring System Based on STM32. In Proceedings of the 2020 IEEE International Conference on Artificial Intelligence and Computer Applications (ICAICA), Dalian, China, 27–29 June 2020; pp. 757–759. [Google Scholar]
- Lee, K.-H.; Park, K.Y. Overall Design of Satellite Networks for Internet Services with QoS Support. Electronics 2019, 8, 683. [Google Scholar] [CrossRef] [Green Version]
- Marabissi, D.; Mucchi, L.; Caputo, S.; Nizzi, F.; Pecorella, T.; Fantacci, R.; Nawaz, T.; Seminara, M.; Catani, J. Experimental Measurements of a Joint 5G-VLC Communication for Future Vehicular Networks. J. Sens. Actuator Netw. 2020, 9, 32. [Google Scholar] [CrossRef]
- Güldenring, J.; Gorczak, P.; Patchou, M.; Arendt, C.; Tiemann, J.; Wietfeld, C. SKATES: Interoperable Multi-Connectivity Communication Module for Reliable Search and Rescue Robot Operation. In Proceedings of the 2020 16th International Conference on Wireless and Mobile Computing, Networking and Communications (WiMob), Thessaloniki, Greece, 12–14 October 2020; pp. 7–13. [Google Scholar]
- Fu, S.; Bhavsar, P.C. Robotic arm control based on internet of things. In Proceedings of the 2019 IEEE Long Island Systems, Applications and Technology Conference (LISAT), Farmingdale, NY, USA, 3 May 2019; pp. 1–6. [Google Scholar]
- Iqbal, F.M.; Lam, K.; Joshi, M.; Khan, S.; Ashrafian, H.; Darzi, A. Clinical outcomes of digital sensor alerting systems in remote monitoring: A systematic review and meta-analysis. NPJ Digit. Med. 2021, 4, 1–12. [Google Scholar] [CrossRef] [PubMed]
- Kindle, R.D.; Badawi, O.; Celi, L.A.; Sturland, S. Intensive care unit telemedicine in the era of big data, artificial intelligence, and computer clinical decision support systems. Crit. Care Clin. 2019, 35, 483–495. [Google Scholar] [CrossRef] [PubMed]
- Wijesinghe, I.; Gamage, C.; Perera, I.; Chitraranjan, C. A smart telemedicine system with deep learning to manage diabetic retinopathy and foot ulcers. In Proceedings of the 2019 Moratuwa Engineering Research Conference (MERCon), Moratuwa, Sri Lanka, 3–5 July 2019; pp. 686–691. [Google Scholar]


| Topic | {device ID}/mirror/cmd | {device ID}/mirror/data |
| Clients | Publish client: Server Subscribe client: Device | Publish client: Device Subscribe client: Server |
| JSON format dataset | { “command”: “axialscan”, “options”: { “xPixel”: number, “yPixel”: number, “xFov”: number, “yFov”: number, “imagingSpeed”: number, “ch1”: boolean, “ch2”: boolean, “ch3”: boolean, “axialStepSize”: number, “axialZero”: number, “numOfZLayer”: number } } | { “message”: “axialdata”, “data”: { “channel”: string, “totalPages”: number, “page”: number, “xPixel”: number, “yPixel”: number, “line”: number, “imagingData”: Uint16Array } } |
Publisher’s Note: MDPI stays neutral with regard to jurisdictional claims in published maps and institutional affiliations. |
© 2021 by the authors. Licensee MDPI, Basel, Switzerland. This article is an open access article distributed under the terms and conditions of the Creative Commons Attribution (CC BY) license (http://creativecommons.org/licenses/by/4.0/).
Share and Cite
Park, E.; Lim, J.; Park, B.C.; Kim, D. IoT-Based Research Equipment Sharing System for Remotely Controlled Two-Photon Laser Scanning Microscopy. Sensors 2021, 21, 1533. https://doi.org/10.3390/s21041533
Park E, Lim J, Park BC, Kim D. IoT-Based Research Equipment Sharing System for Remotely Controlled Two-Photon Laser Scanning Microscopy. Sensors. 2021; 21(4):1533. https://doi.org/10.3390/s21041533
Chicago/Turabian StylePark, Eunwoo, Jaehyun Lim, Byung Cheol Park, and Daekeun Kim. 2021. "IoT-Based Research Equipment Sharing System for Remotely Controlled Two-Photon Laser Scanning Microscopy" Sensors 21, no. 4: 1533. https://doi.org/10.3390/s21041533