
Gaze and Event Tracking for Evaluation of Recommendation-Driven Purchase

 , ,
, ,  , and
, and
Abstract
:1. Introduction
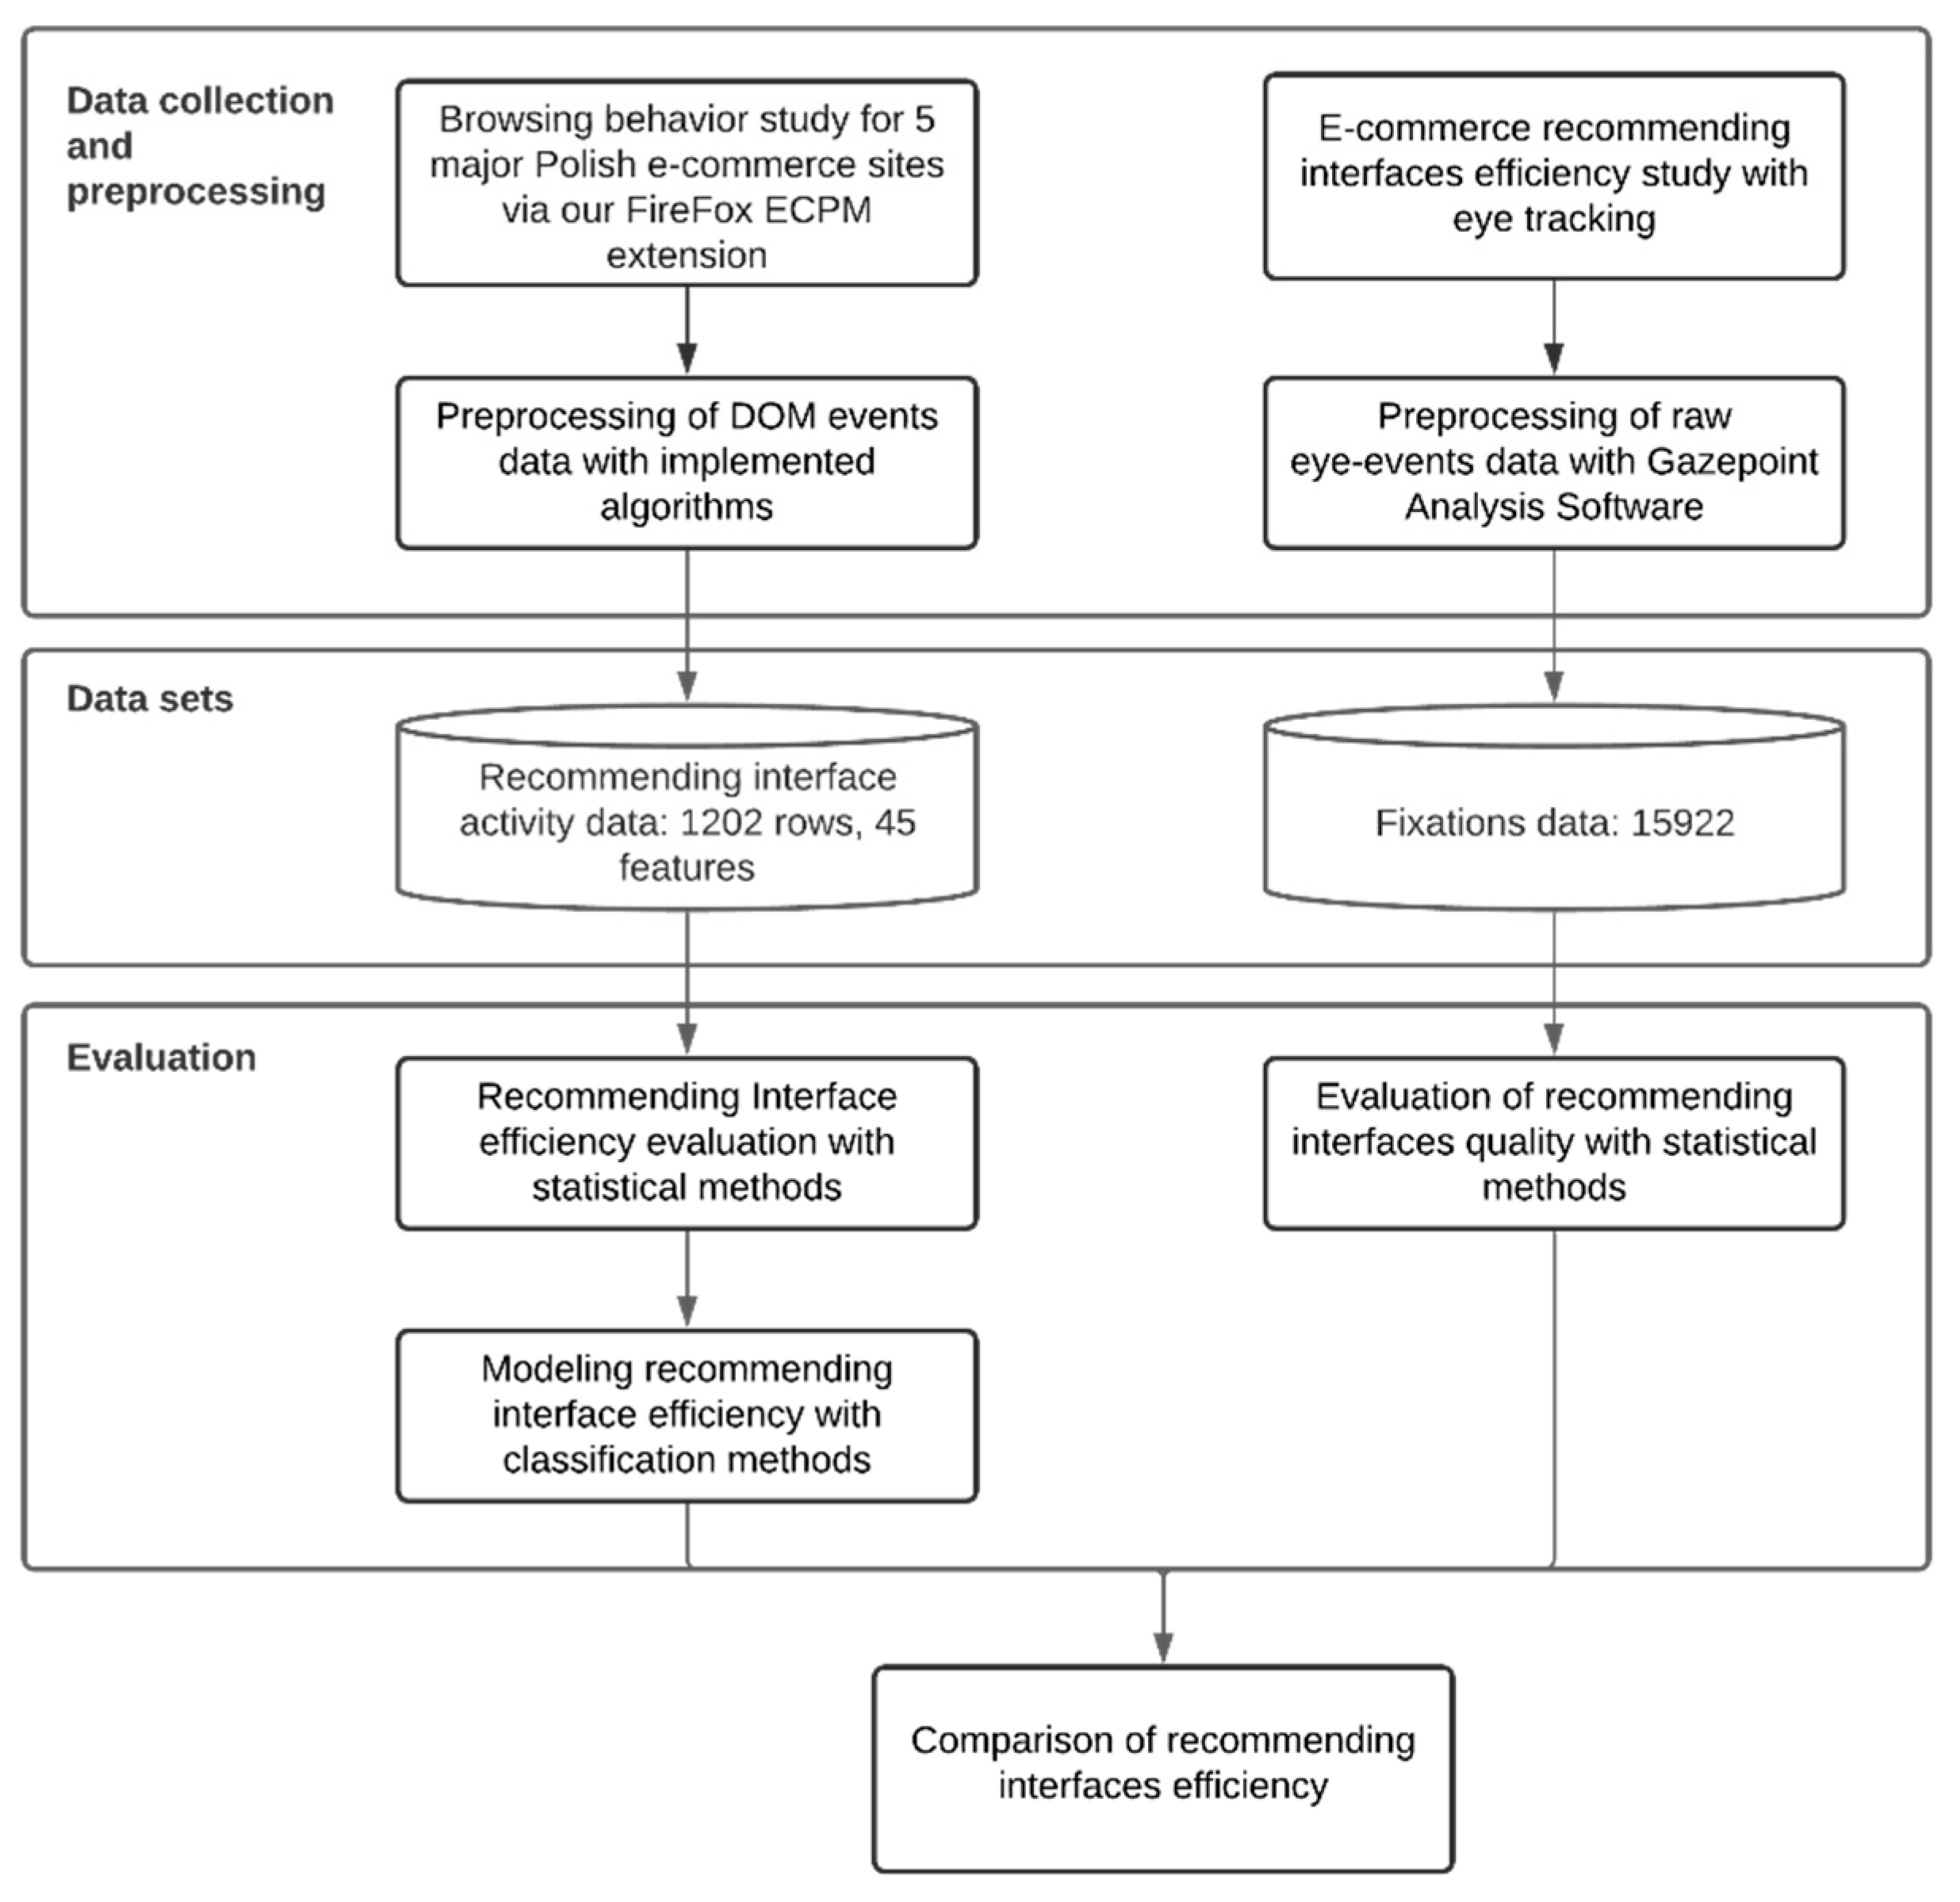
2. Methodology
3. Conceptual System Architecture and Research Experiment Procedure
3.1. Conceptual System Architecture
3.2. Research Experiment Procedure
3.3. Eye-Tracking Experiment Structure and Procedure
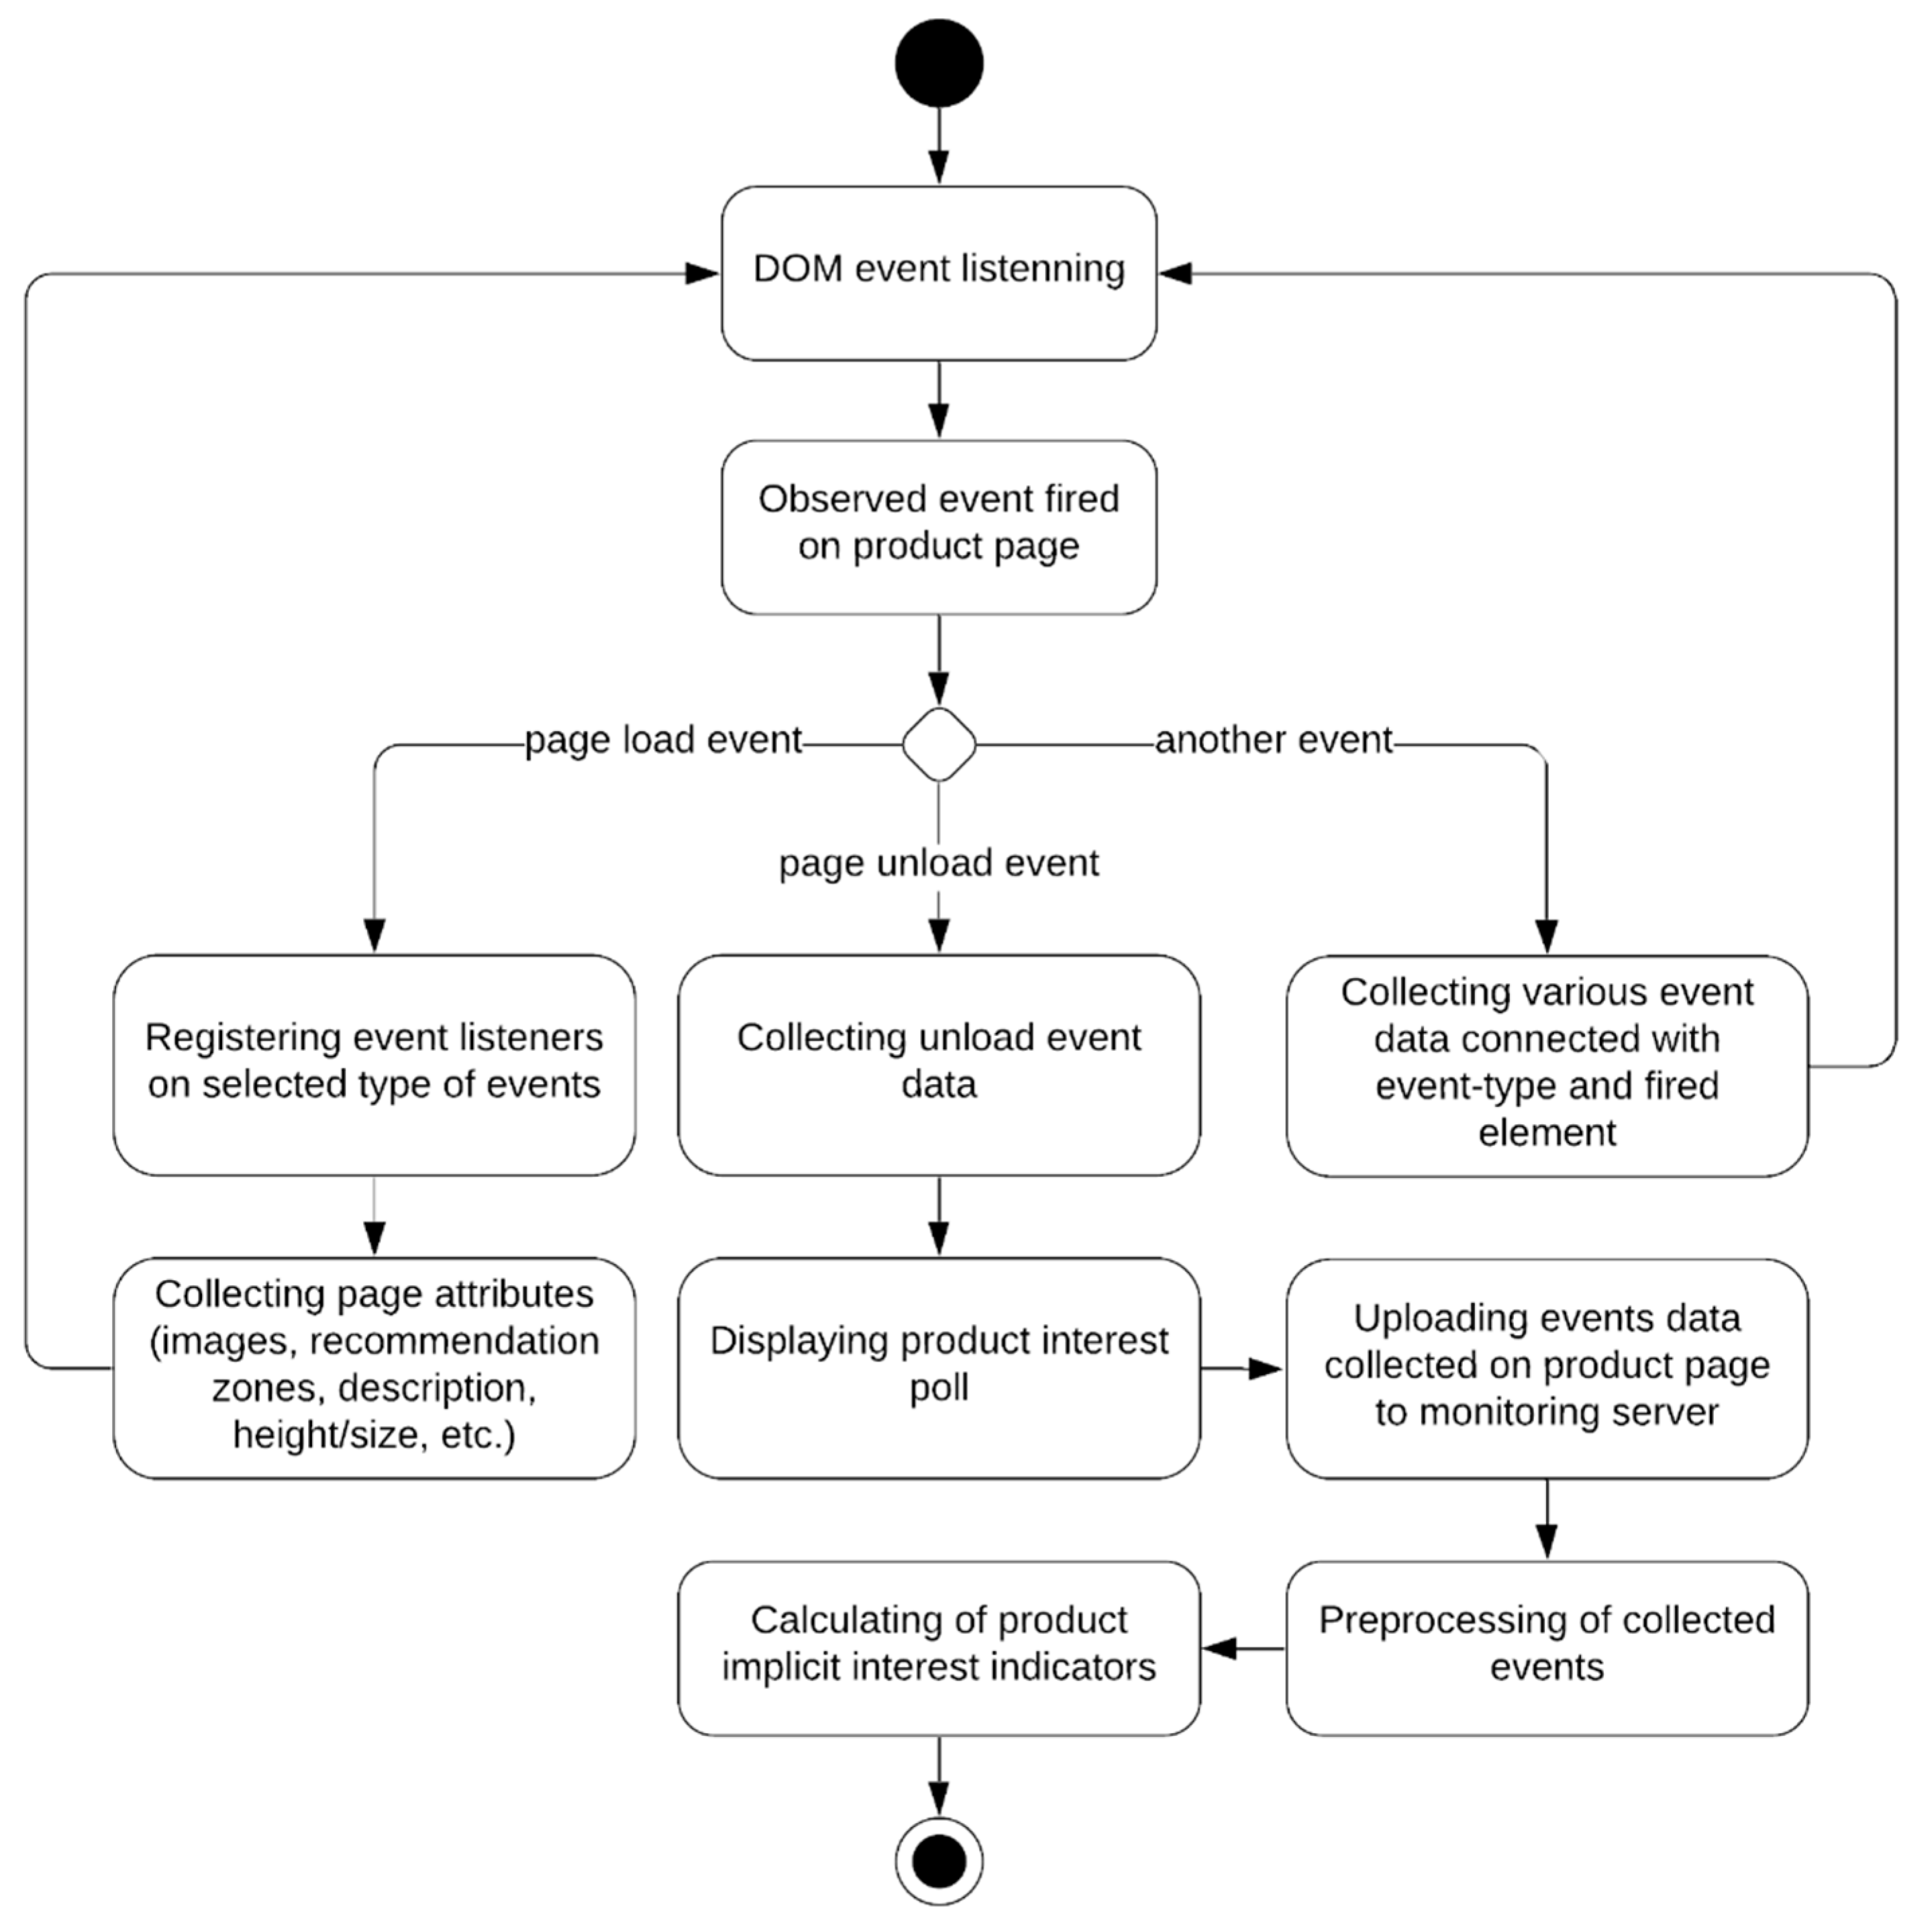
3.4. Implicit Event Tracking via ECPM Browser Extension
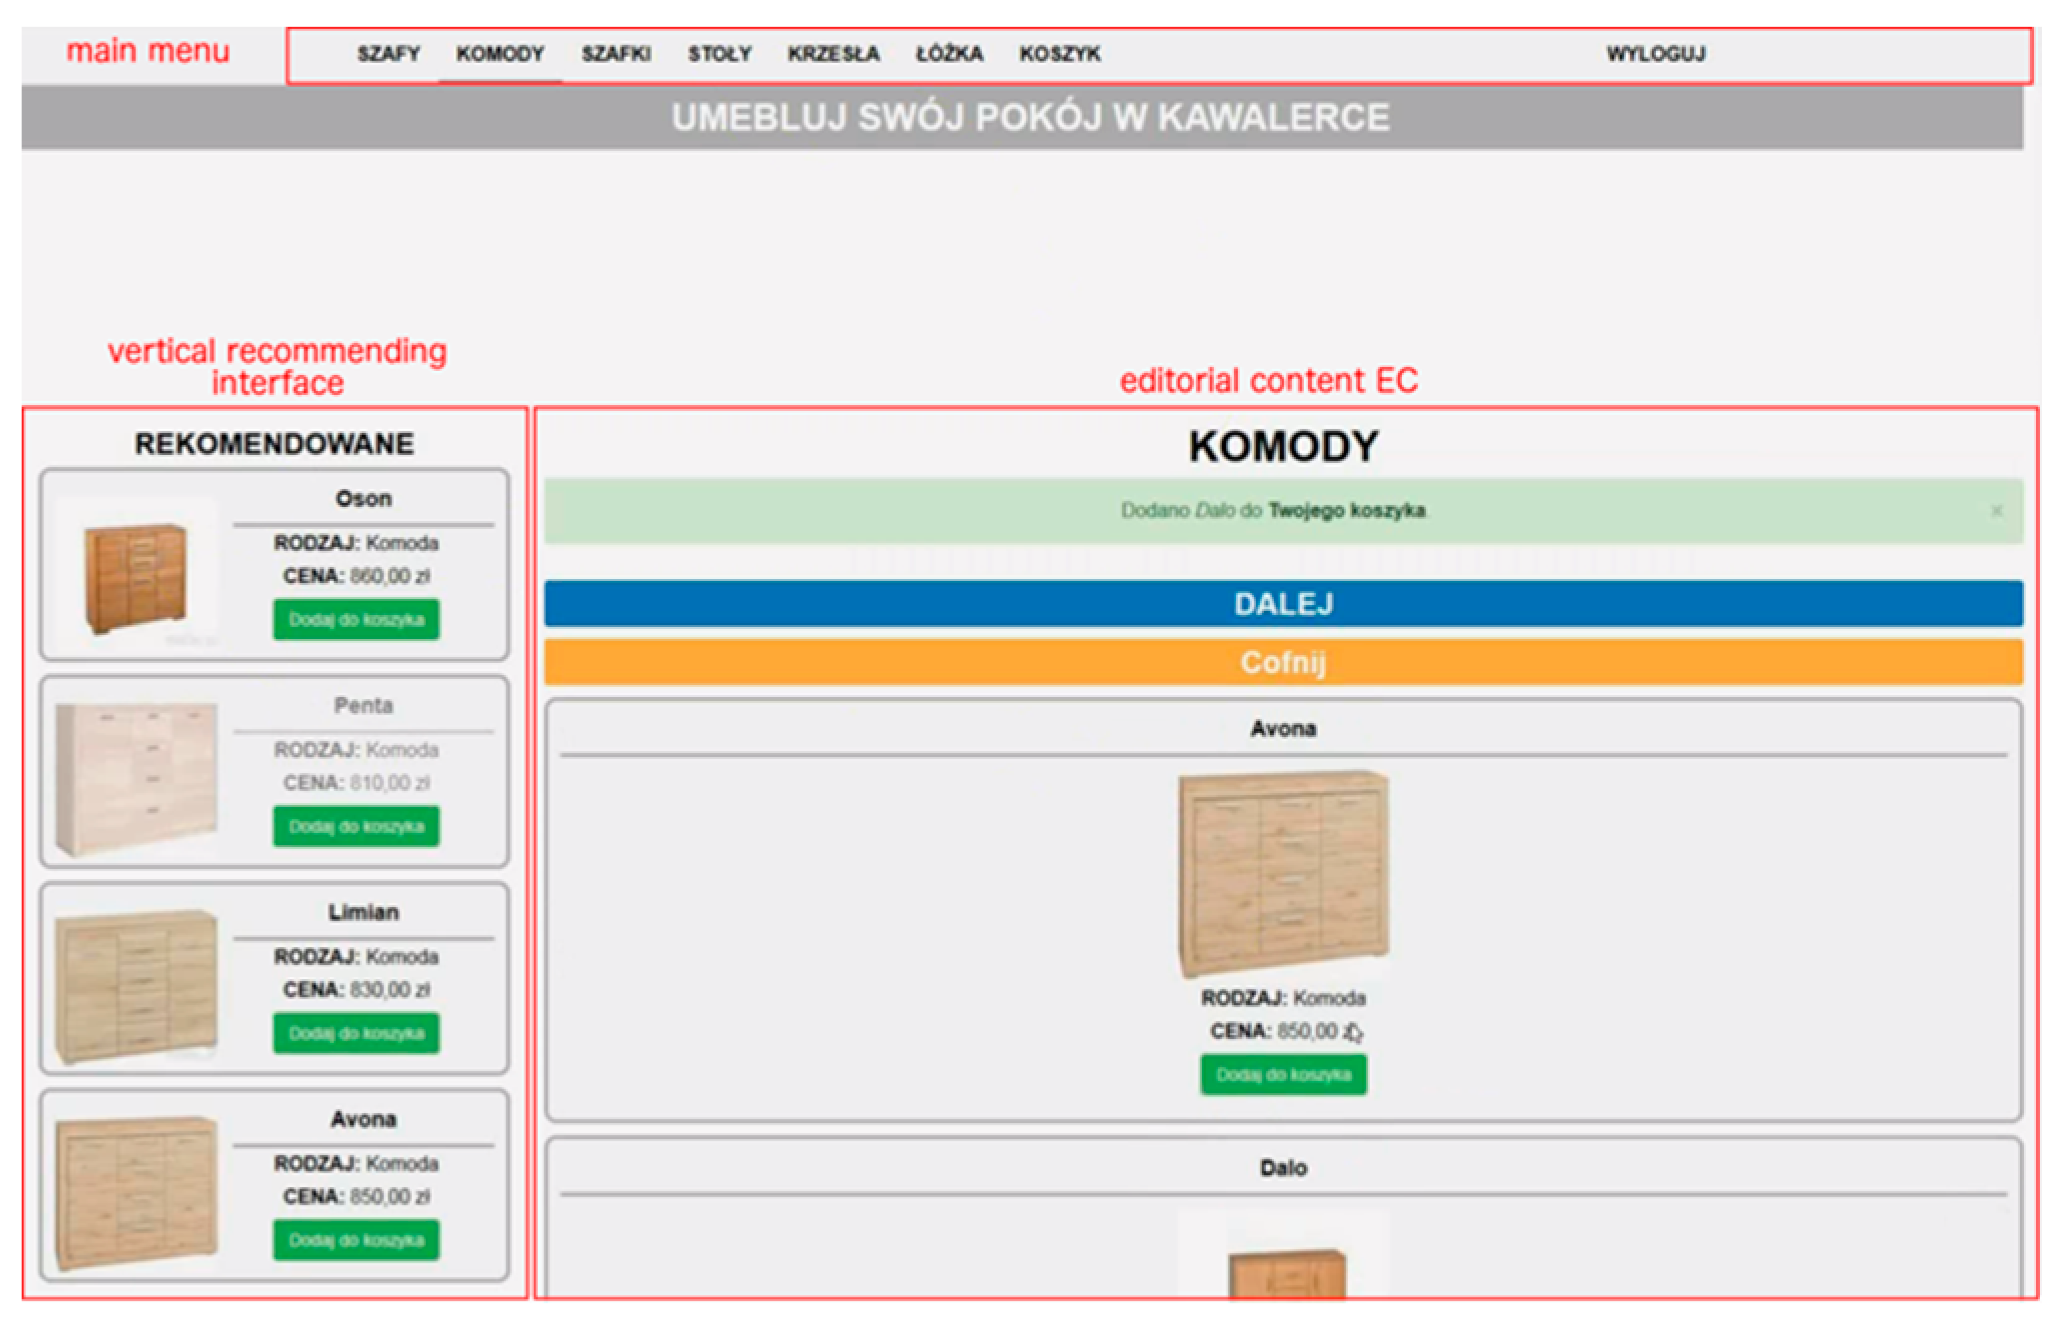
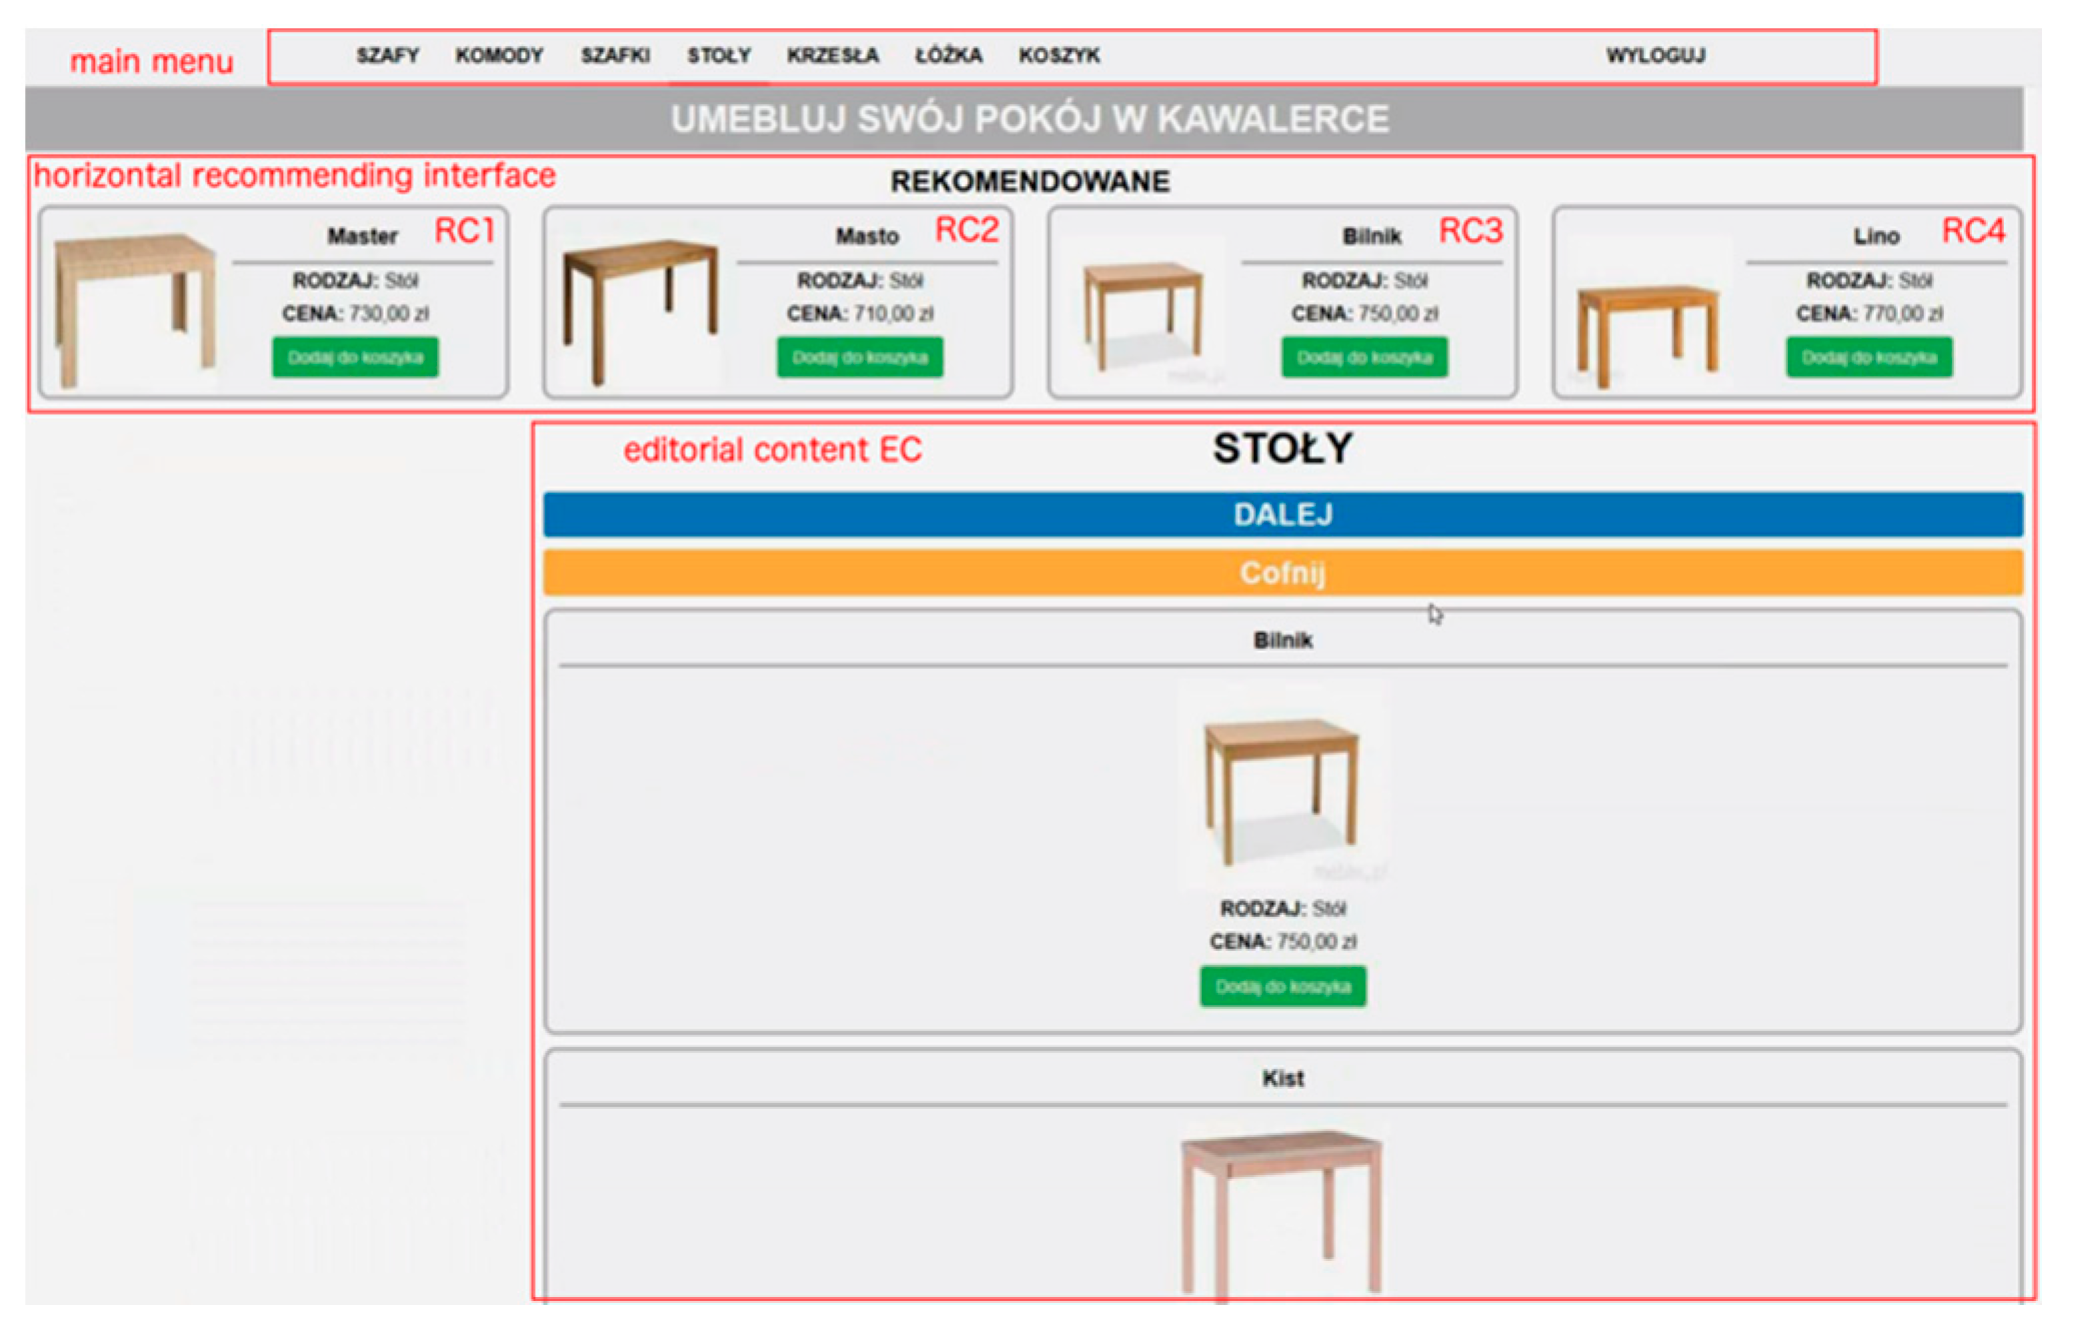
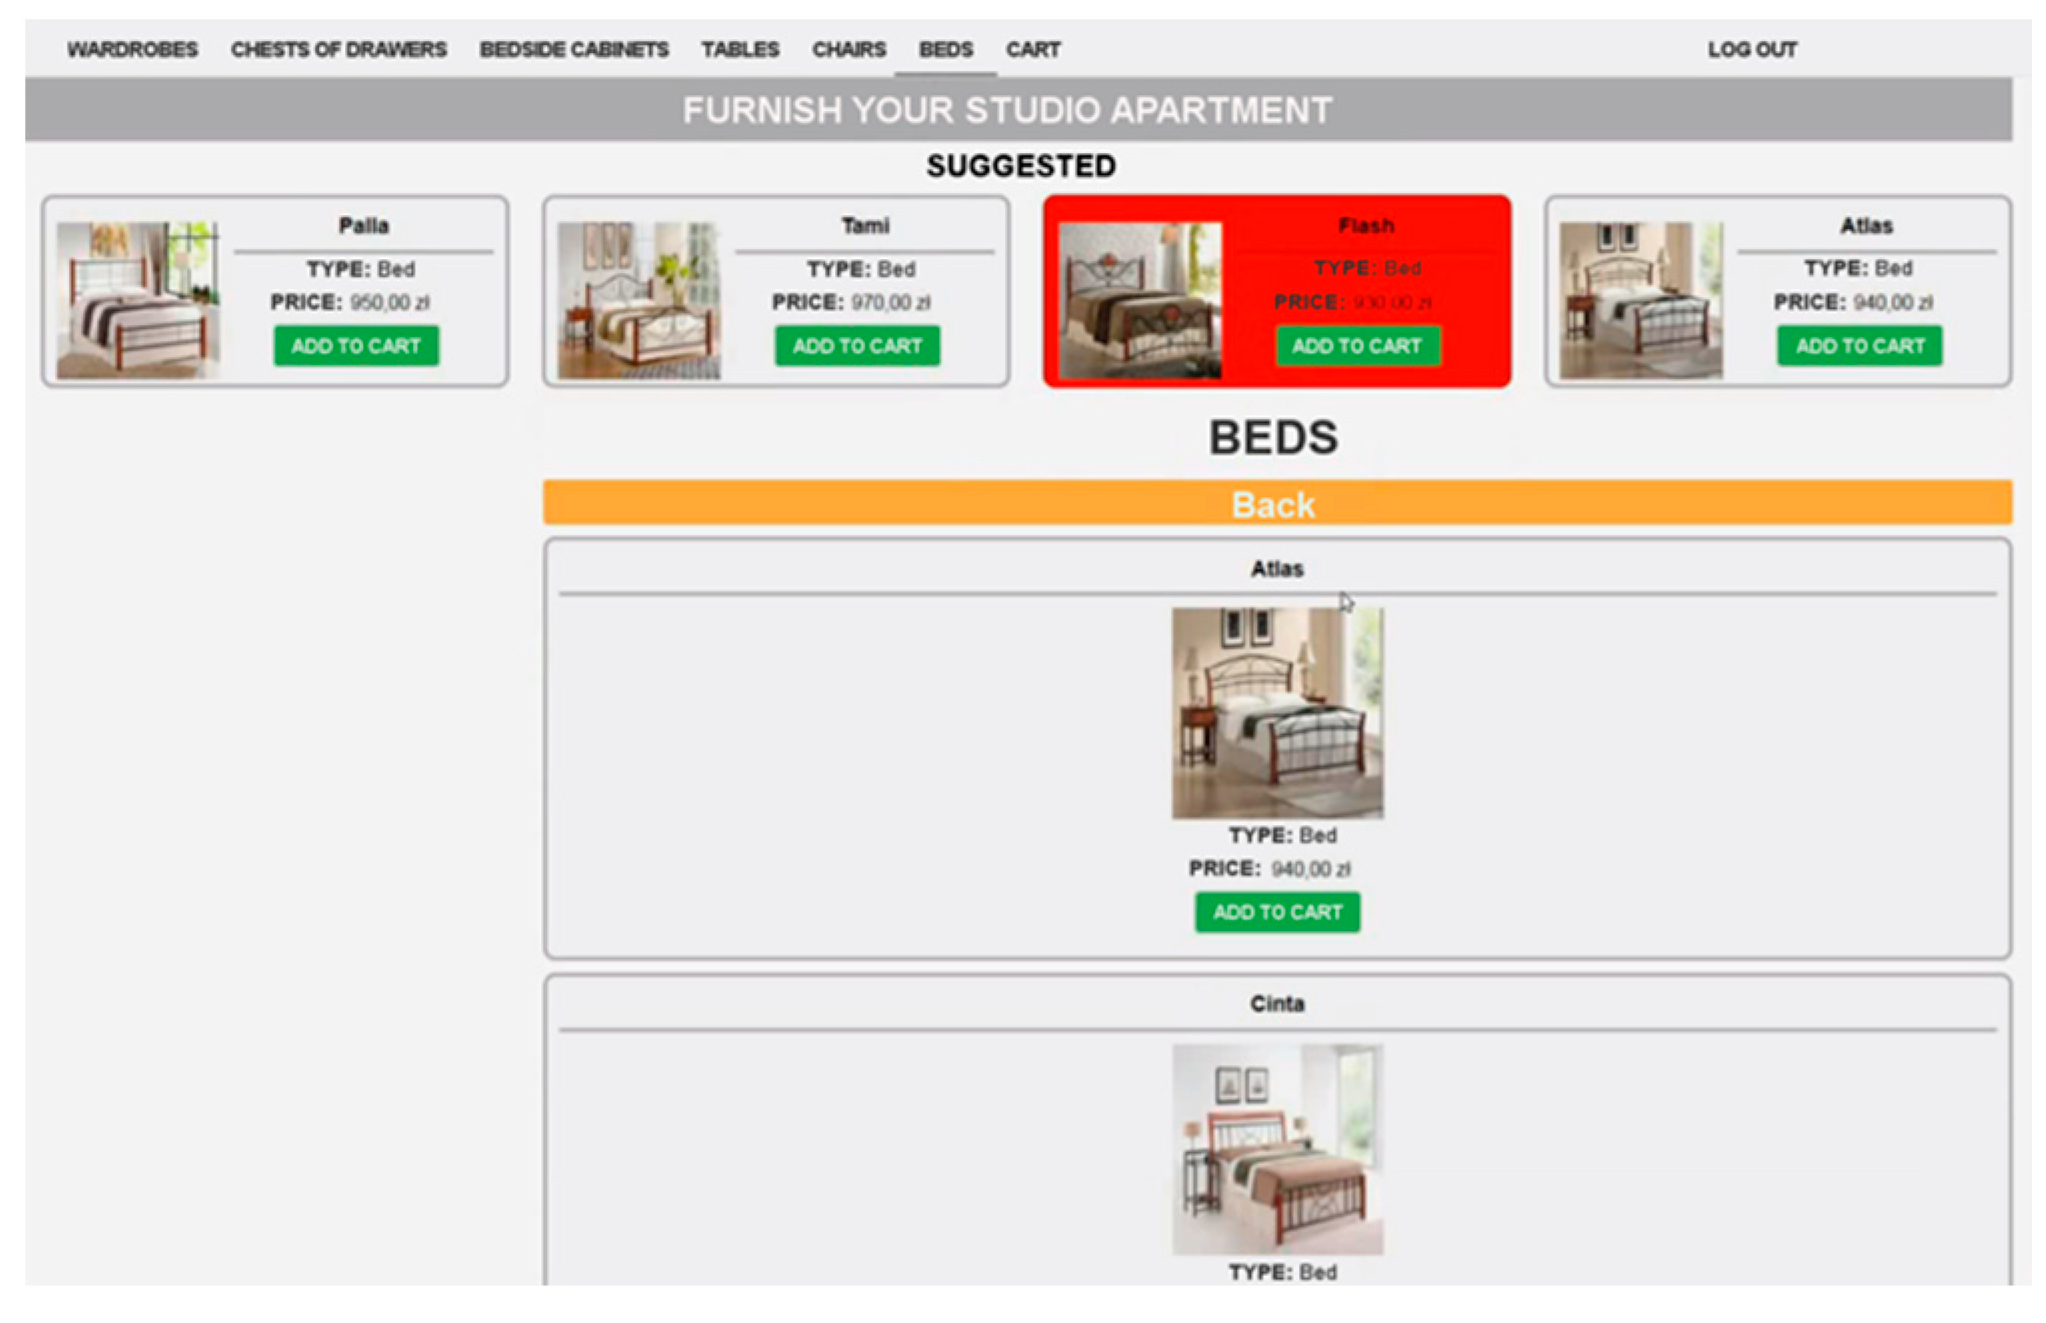
3.5. Comparing Visual Aspects of Recommending Interfaces
4. Results and Evaluation
4.1. Eye-Tracking Results of Recommending Interface Efficiency Evaluation
4.2. Modeling Recommending Interface Efficiency Based on the Eye-Tracking Experiment
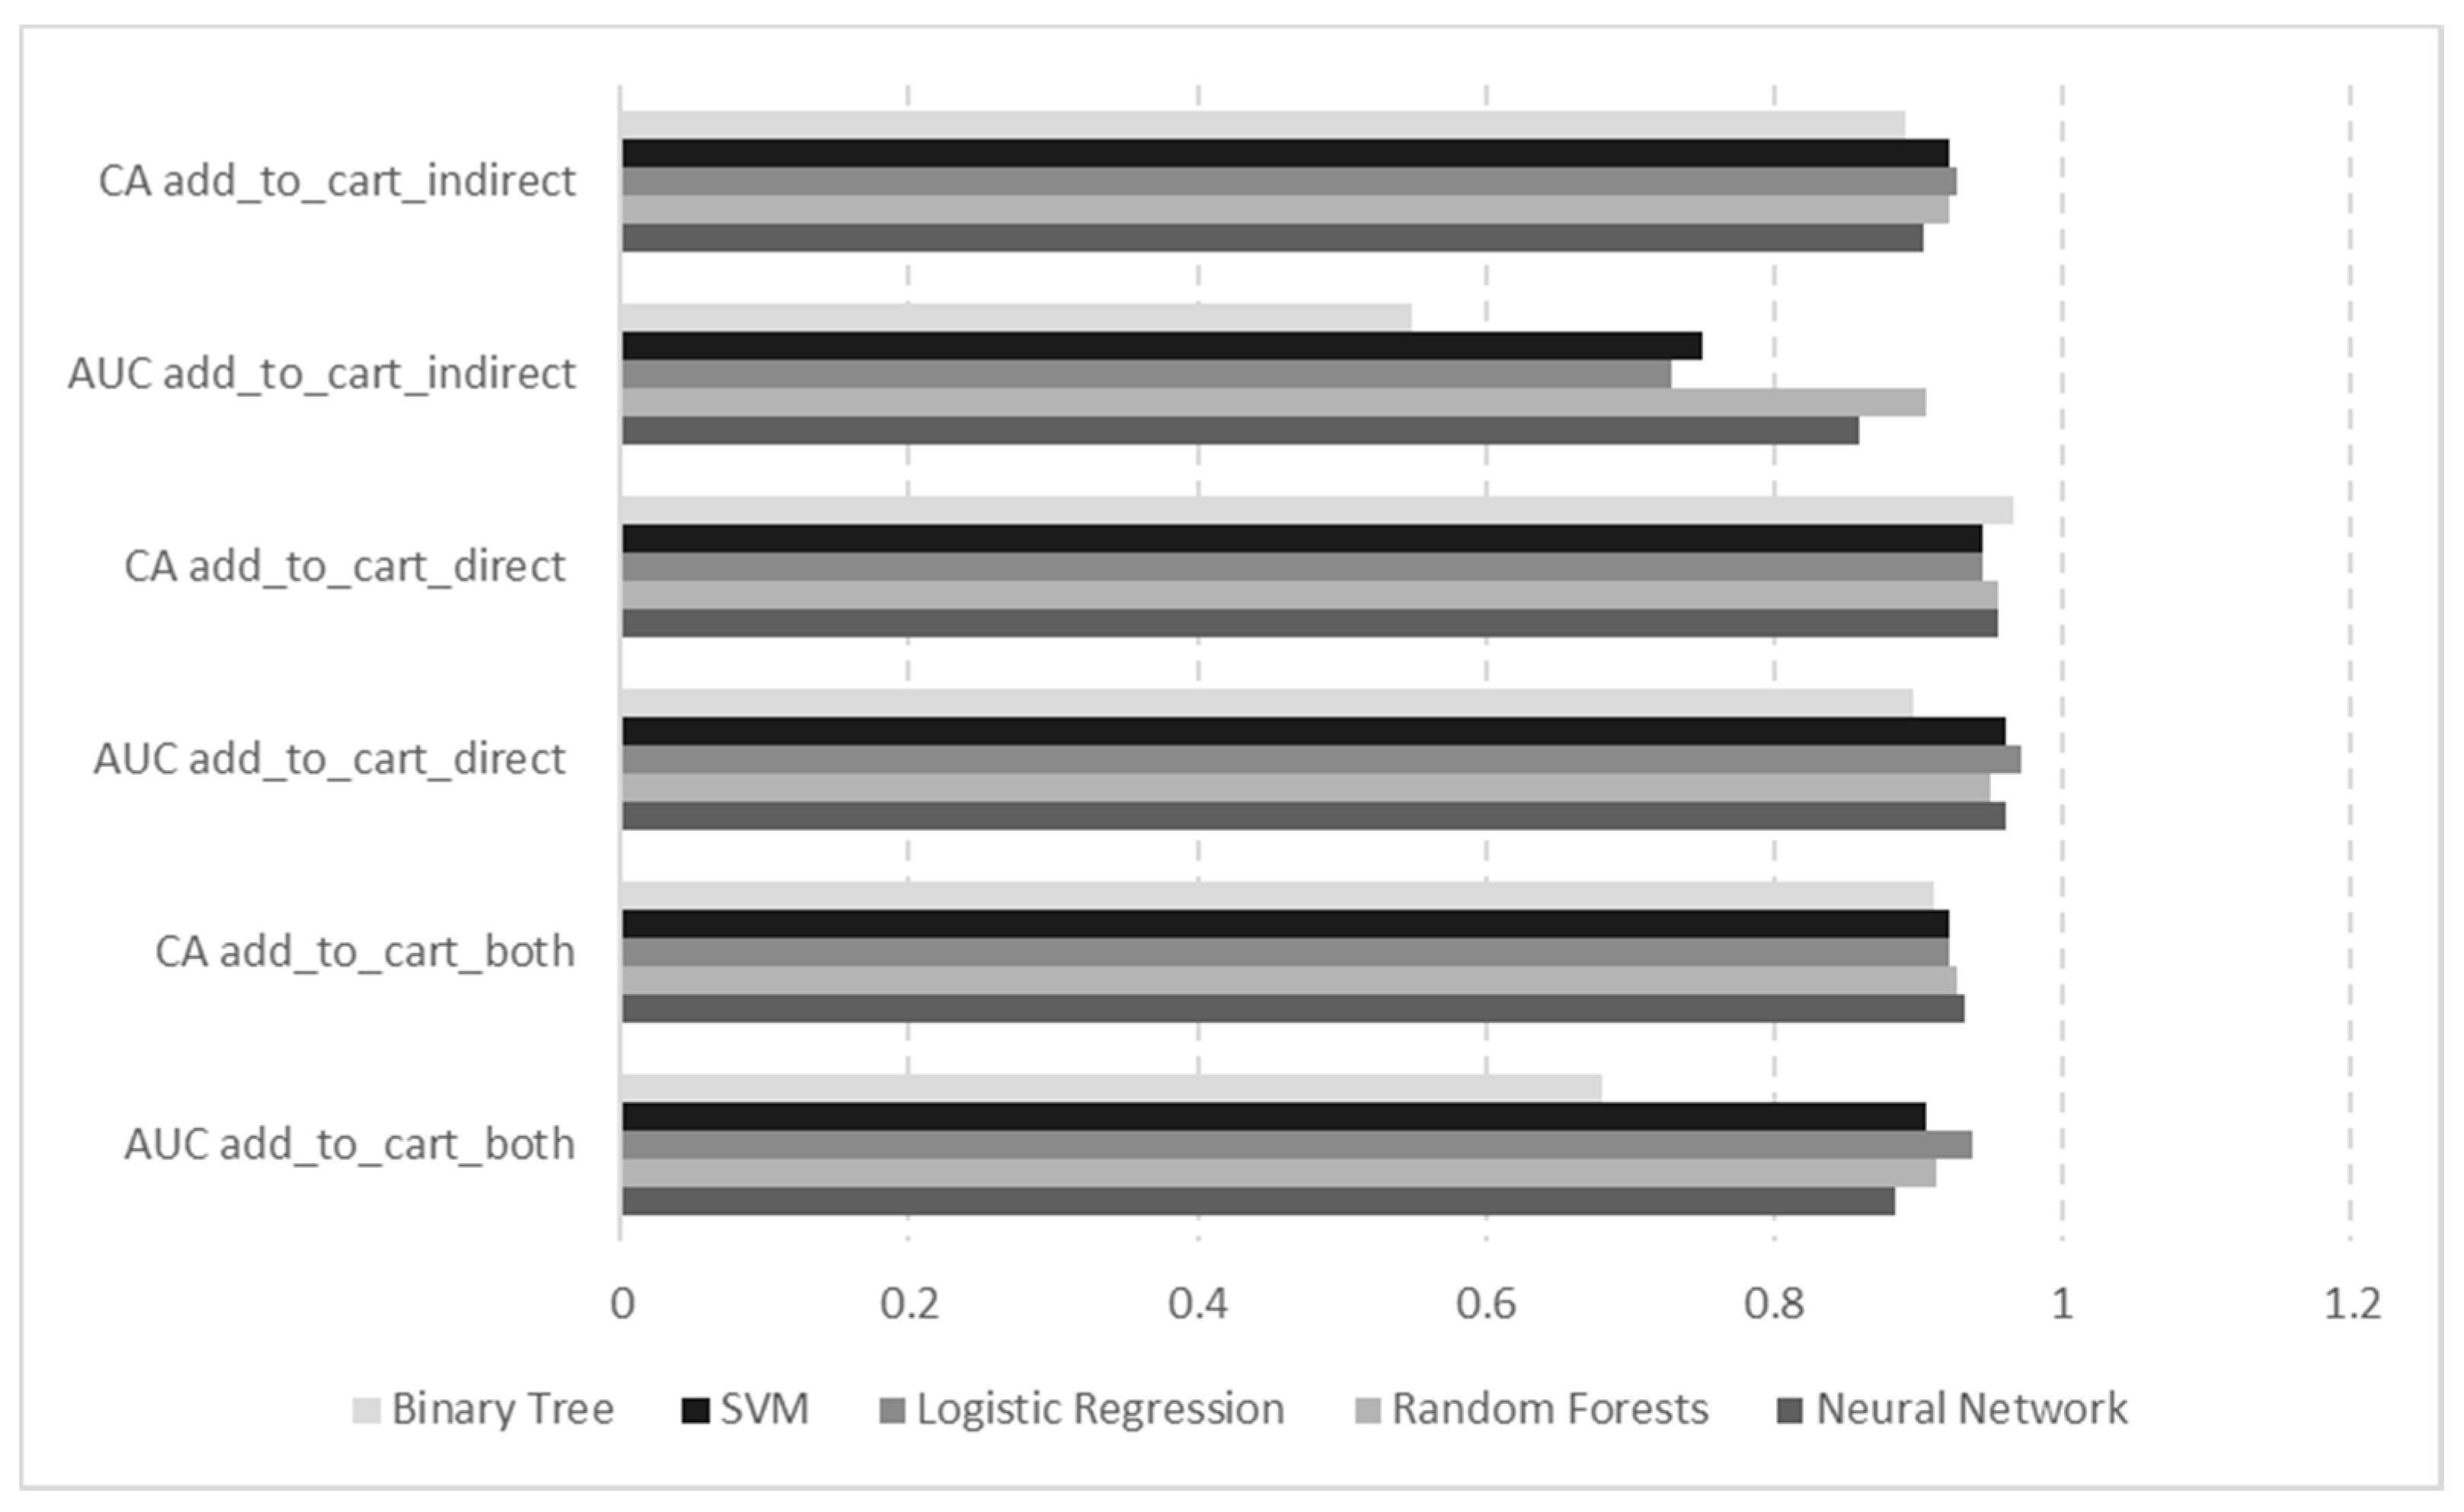
4.2.1. Classification Accuracy for Target Parameter add_to_cart_both
4.2.2. Classification Accuracy for Target Parameter add_to_cart_direct
4.2.3. Classification Accuracy for Target Parameter add_to_cart_indirect
4.3. Results of Recommending Interfaces Efficiency Evaluation Based on the Event Tracking Study
5. Conclusions
Author Contributions
Funding
Institutional Review Board Statement
Informed Consent Statement
Data Availability Statement
Acknowledgments
Conflicts of Interest
References
- Kelly, D. Implicit Feedback: Using Behavior to Infer Relevance. In New Directions in Cognitive Information Retrieval; Spink, A., Cole, C., Eds.; The Information Retrieval Series; Springer: Dordrecht, The Netherlands, 2006; Volume 19, pp. 169–186. [Google Scholar]
- Sulikowski, P.; Zdziebko, T.; Turzyński, D.; Kańtoch, E. Human-website interaction monitoring in recommender systems. Procedia Comput. Sci. 2018, 126, 1587–1596. [Google Scholar] [CrossRef]
- Sulikowski, P.; Zdziebko, T.; Turzyński, D. Modeling online user product interest for recommender systems and ergonomics studies. Concurr. Comput. Pract. Exp. 2019, 31, e4301. [Google Scholar] [CrossRef]
- Wątróbski, J.; Jankowski, J.; Karczmarczyk, A.; Ziemba, P. Integration of Eye-Tracking Based Studies into e-Commerce Websites Evaluation Process with eQual and TOPSIS Methods. In Proceedings of the 10th SIGSAND/PLAIS EuroSymposium 2017, Gdańsk, Poland, 22 September 2017; Springer: Cham, Switzerland, 2017; Volume 300, pp. 56–80. [Google Scholar]
- Jankowski, J.; Ziemba, P.; Wątróbski, J.; Kazienko, P. Towards the Tradeoff Between Online Marketing Resources Exploitation and the User Experience with the Use of Eye Tracking. In Proceedings of the 8th Asian Conference, ACIIDS 2016, Da Nang, Vietnam, 14–16 March 2016; Springer: Berlin/Heidelberg, Germany, 2016; Volume 9621, pp. 330–343. [Google Scholar]
- Zhang, L.; Qin, T.; Teng, P. An Improved Collaborative Filtering Algorithm Based on User Interest. J. Softw. 2014, 9, 999–1006. [Google Scholar] [CrossRef]
- Geuens, S.; Coussement, K.; De Bock, K.W. A Framework for Configuring Collaborative Filtering-based Recommendations Derived from Purchase Data. Eur. J. Oper. Res. 2018, 265, 208–218. [Google Scholar] [CrossRef]
- Zhang, S.; Yao, L.; Sun, A.; Tay, Y. Deep Learning Based Recommender System. Acm Comput. Surv. 2019, 52, 1–38. [Google Scholar] [CrossRef] [Green Version]
- Shahriar, A.; Moon, M.; Mahmud, H.; Hasan, K. Online Product Recommendation System by Using Eye Gaze Data. In Proceedings of the International Conference on Computing Advancements (ICCA 2020), Dhaka, Bangladesh, 10–12 January 2020; Association for Computing Machinery: New York, NY, USA, 2020. Article 61. pp. 1–7. [Google Scholar]
- Chen, L.; Pu, P. Eye-tracking study of user behavior in recommender interfaces. In International Conference on User Modeling, Adaptation, and Personalization; Springer: Berlin/Heidelberg, Germany, 2010; pp. 375–380. [Google Scholar]
- Bobadilla, J.; Ortega, F.; Hernando, A.; Gutierrez, A. Recommender systems survey. Knowl. Based Syst. 2013, 46, 109–132. [Google Scholar] [CrossRef]
- Lu, J.; Wu, D.; Mao, M.; Wang, W.; Zhang, G. Recommender system application developments: A survey. Decis. Support Syst. 2015, 74, 12–32. [Google Scholar] [CrossRef]
- Cazzato, D.; Leo, M.; Distante, C.; Voos, H. When I Look into Your Eyes: A Survey on Computer Vision Contributions for Human Gaze Estimation and Tracking. Sensors 2020, 20, 3739. [Google Scholar] [CrossRef]
- Pu, P.; Chen, L.; Kumar, P. Evaluating Product Search and Recommender Systems for E-Commerce Environments. Electron. Commer. Res. 2008, 8, 1–27. [Google Scholar] [CrossRef] [Green Version]
- Bortko, K.; Bartków, P.; Jankowski, J.; Kuras, D.; Sulikowski, P. Multi-criteria Evaluation of Recommending Interfaces towards Habituation Reduction and Limited Negative Impact on User Experience. Procedia Comput. Sci. 2019, 159, 2240–2248. [Google Scholar] [CrossRef]
- Portnoy, F.; Marchionini, G. Modeling the effect of habituation on banner blindness as a function of repetition and search type: Gap analysis for future work. In CHI’10 Extended Abstracts on Human Factors in Computing Systems; ACM: New York, NY, USA, 2010; pp. 4297–4302. [Google Scholar]
- Ha, L.; McCann, K. An integrated model of advertising clutter in offline and online media. Int. J. Advert. 2008, 27, 569–592. [Google Scholar] [CrossRef]
- Jin, X.; Zhou, Y.; Mobasher, B. Task-oriented web user modeling for recommendation. In International Conference on User Modeling; Springer: Berlin/Heidelberg, Germany, 2005; pp. 109–118. [Google Scholar]
- Jankowski, J.; Hamari, J.; Watróbski, J. A gradual approach for maximising user conversion without compromising experience with high visual intensity website elements. Internet Res. 2019, 29, 194–217. [Google Scholar] [CrossRef]
- Rohrer, C.; Boyd, J. The rise of intrusive online advertising and the response of user experience research at yahoo! In CHI’04 Extended Abstracts on Human Factors in Computing Systems; ACM: New York, NY, USA, 2004; pp. 1085–1086. [Google Scholar]
- Jankowski, J. Modeling the Structure of Recommending Interfaces with Adjustable Influence on Users, Intelligent Information and Database Systems. Lect. Notes Comput. Sci. 2013, 7803, 429–438. [Google Scholar]
- Sałabun, W.; Karczmarczyk, A.; Mejsner, P. Experimental Study of Color Contrast Influence in Internet Advertisements with Eye Tracker Usage. In Neuroeconomic and Behavioral Aspects of Decision Making. Springer Proceedings in Business and Economics; Nermend, K., Łatuszyńska, M., Eds.; Springer: Cham, Switzerland, 2017. [Google Scholar]
- Gomes, L.; Almeida, C.; Vale, Z. Recommendation of Workplaces in a Coworking Building: A Cyber-Physical Approach Supported by a Context-Aware Multi-Agent System. Sensors 2020, 20, 3597. [Google Scholar] [CrossRef] [PubMed]
- Sulikowski, P. Evaluation of Varying Visual Intensity and Position of a Recommendation in a Recommending Interface Towards Reducing Habituation and Improving Sales. In Advances in E-Business Engineering for Ubiquitous Computing, Proceedings of the 16th International Conference on E-Business Engineering, ICEBE 2019, Shanghai, China, 11–13 October 2019; Lecture Notes on Data Engineering and Communications Technologies; Chao, K.M., Jiang, L., Hussain, O., Ma, S.P., Fei, X., Eds.; Springer Nature: Cham, Switzerland, 2020; Volume 41, pp. 208–218. [Google Scholar]
- Jannach, D.; Lerche, L.; Zanker, M. Recommending based on implicit feedback. In Social Information Access; Springer: Cham, Swizerland, 2018; pp. 510–569. [Google Scholar]
- Lerche, L. Using Implicit Feedback for Recommender Systems: Characteristics, Applications, and Challenges. Ph.D. Thesis, Technische Universität Dortmund, Dortmund, Germany, December 2016. [Google Scholar]
- Zhao, Q.; Harper, F.M.; Adomavicius, G.; Konstan, J.A. Explicit or implicit feedback? Engagement or satisfaction? A field experiment on machine-learning-based recommender systems. In Proceedings of the 33rd Annual ACM Symposium on Applied Computing, Pau, France, 9–13 April 2018; ACM: New York, NY, USA, 2018; pp. 1331–1340. [Google Scholar]
- Zhou, M.; Ding, Z.; Tang, J.; Yin, D. Micro behaviors: A new perspective in e-commerce recommender systems. In Proceedings of the Eleventh ACM International Conference on Web Search and Data Mining, Los Angeles, CA, USA, 5–9 February 2018; pp. 727–735. [Google Scholar]
- Tian, G.; Wang, J.; He, K.; Sun, C.; Tian, Y. Integrating implicit feedbacks for time-aware web service recommendations. Inf. Syst. Front. 2017, 19, 75–89. [Google Scholar] [CrossRef]
- Liversedge, S.P.; Drieghe, D.; Li, X.; Yan, G.; Bai, X.; Hyönä, J. Universality in eye movements and reading: A trilingual investigation. Cognition 2016, 147, 1–20. [Google Scholar] [CrossRef] [PubMed] [Green Version]
- Buscher, G.; Dengel, A.; Biedert, R.; Van Elst, L. Attentive documents: Eye tracking as implicit feedback for information retrieval and beyond. ACM Trans. Interact. Intell. Syst. 2012, 1, 1–30. [Google Scholar] [CrossRef]
- Steichen, B.; Carenini, G.; Conati, C. Adaptive Information Visualization-Predicting user characteristics and task context from eye gaze. In Proceedings of the International Conference on User Modeling, UMAP Workshops, Montreal, QC, Canada, 16–20 July 2012; Volume 872. [Google Scholar]
- Loyola, P.; Brunetti, E.; Martinez, G.; Velásquez, J.D.; Maldonado, P. Leveraging Neurodata to Support Web User Behavior Analysis. In Wisdom Web of Things; Web Information Systems Engineering and Internet Technologies Book Series; Zhong, N., Ma, J., Liu, J., Huang, R., Tao, X., Eds.; Springer: Cham, Switzerland, 2016; pp. 181–207. [Google Scholar]
- Sharafi, Z.; Shaffer, T.; Sharif, B.; Guéhéneuc, Y.-G. Eye-Tracking Metrics in Software Engineering. In Proceedings of the 2015 Asia-Pacific Software Engineering Conference, New Delhi, India, 1–4 December 2015; IEEE Press: Piscataway, NJ, USA, 2015; pp. 96–103. [Google Scholar]
- Lee, J.; Ahn, J.-H.; Park, B. The effect of repetition in internet banner ads and the moderating role of animation. Comput. Hum. Behav. 2015, 46, 202–209. [Google Scholar] [CrossRef]
- Akuma, S.; Iqbal, R.; Jayne, C.; Doctor, F. Comparative analysis of relevance feedback methods based on two user studies. Comput. Hum. Behav. 2016, 60, 138–146. [Google Scholar] [CrossRef] [Green Version]
- Boi, P.; Fenu, G.; Spano, L.; Vargiu, V. Reconstructing User’s Attention on the Web through Mouse Movements and Perception-Based Content Identification. Acm Trans. Appl. Percept. 2016, 13, 1–21. [Google Scholar] [CrossRef] [Green Version]
- Zhao, Q.; Chang, S.; Harper, M.; Konstan, J.A. Gaze Prediction for Recommender Systems. In Proceedings of the 10th ACM Conference on Recommender Systems (RecSys ’16); Association for Computing Machinery: New York, NY, USA, 2016; pp. 131–138. [Google Scholar]
- Sulikowski, P.; Zdziebko, T. Horizontal vs. Vertical Recommendation Zones Evaluation Using Behavior Tracking. Appl. Sci. 2021, 11, 56. [Google Scholar] [CrossRef]
- Sulikowski, P.; Zdziebko, T. Deep Learning-Enhanced Framework for Performance Evaluation of a Recommending Interface with Varied Recommendation Position and Intensity Based on Eye-Tracking Equipment Data Processing. Electronics 2020, 9, 266. [Google Scholar] [CrossRef] [Green Version]
- Kantardzic, M. Data Mining: Concepts, Models, Methods, and Algorithms; John Wiley & Sons Publishing: Hoboken, NJ, USA, 2003. [Google Scholar]
- Al-Nabiand, D.L.A.; Ahmed, S.S. Survey on classification algorithms for data mining: (comparison and evaluation). Comput. Eng. Intell. Syst. 2013, 4, 18–24. [Google Scholar]
- Vasiljevas, M.; Gedminas, T.; Ševčenko, A.; Jančiukas, M.; Blažauskas, T.; Damaševičius, R. Modelling eye fatigue in gaze spelling task. In Proceedings of the 2016 IEEE 12th International Conference on Intelligent Computer Communication and Processing (ICCP), Cluj-Napoca, Romania, 8–10 September 2016; pp. 95–102. [Google Scholar]
- Kim, T.; Lee, E.C. Experimental Verification of Objective Visual Fatigue Measurement Based on Accurate Pupil Detection of Infrared Eye Image and Multi-Feature Analysis. Sensors 2020, 20, 4814. [Google Scholar] [CrossRef]
- Katona, J.; Kovari, A.; Heldal, I.; Costescu, C.; Rosan, A.; Demeter, R.; Thill, S.; Stefanut, T. Using Eye- Tracking to Examine Query Syntax and Method Syntax Comprehension in LINQ. In Proceedings of the 2020 11th IEEE International Conference on Cognitive Infocommunications (CogInfoCom), Stockholm, Sweden, 23–25 September 2020. [Google Scholar]
- Ujbanyi, T.; Kovari, A.; Sziládi, G.; Katona, J. Examination of the eye-hand coordination related to computer mouse movement. Infocommun. J. 2020, 12, 26–31. [Google Scholar] [CrossRef]
- Maskeliunas, R.; Raudonis, V. Are you ashamed? Can a gaze tracker tell? PeerJ Comput. Sci. 2016, 2, e75. [Google Scholar] [CrossRef]
- Costescu, C.; Rosan, A.; Brigitta, N.; Hathazi, A.; Kovari, A.; Katona, J.; Heldal, I.; Helgesen, C.; Thill, S.; Demeter, R. Emotion recognition in typical and atypical development–a technology-based paradigm. In Proceedings of the 10th IEEE International Conference on Infocommunications (CogInfoCom), Naples, Italy, 23–25 October 2019; pp. 349–352. [Google Scholar]


| Recommendation Technique | Advantages | Disadvantages |
|---|---|---|
| Collaborative filtering | Serendipity—user can discover new items/products Intuitive and rationale recommendations Easy scalability No need for content data about items/products | Cold start problem for both new users and new items Low recommendation quality for sparse data Model training can be expensive |
| Content-based | User independence—the model needs data only about the current user Explainability of the results Ability to generate a recommendation for the user with a unique taste | Lack of recommendation novelty Over-specialization Cold start problem for both user and item Requires description of products/items |
| Feature | Feature Description |
|---|---|
| rc_layout | RC layout (horizontal/vertical) |
| rc_location_intensity | intensity level of a recommendation location (1–3) |
| rc_location | RCi position (1–4) |
| fixation_time_location | overall fixation time for RCi position |
| fixation_time_layout | overall fixation time for RC layout |
| fixation_time_category | overall time spent by the participant on a product category page |
| share_time_location_category | fraction of time when fixation was registered inside RCi position with respect to the overall time spent on a category page |
| share_time_layout_category | fraction of time when fixation was registered inside RC layout to the overall time registered on a product category page |
| share_time_location_layout | proportion of time when fixation was observed inside RCi position to the overall time registered on RC layout |
| add_to_cart_direct | action of adding the product to cart directly from RC |
| add_to_cart_indirect | action of adding the product to cart action from EC while product was looked at in RC |
| add_to_cart_both | adding the product to cart action from RC or EC while product was being observed in RC |
| Model | Hyper-Parameter | Hyper-Parameter Value |
|---|---|---|
| Neural Network | activation function | Rectified Linear (ReLU) |
| Neural Network | maxium number of neurons in hidden layer | 150 |
| Decision trees | stop extending a tree when majority reaches | 95% |
| Decision trees | do not split subsets smaller than | 5 |
| Logistic Regression | regularization function | Ridge (L2) |
| Logistic Regression | strength | C = 0.18 |
| Random Forests | maxium number of trees | 15 |
| Random Forests | depth limit of individual tree | 3 |
| Random Forests | splitting stop subset limit | 5 |
| SVM | kernel | RBF with Auto Gamma |
| SVM | cost | 1 |
| SVM | regression loss epsilon | 0.1 |
| Feature | Feature Description |
|---|---|
| rc_layout | RC layout (horizontal/vertical) |
| recommend_length | number of characters within all recommended products sections |
| document_length | number of characters within all texts on the page |
| page_time | time between page load and page unload |
| tab_activ_time | time while tab containing particular page is active |
| user_activ_time | time while user is actively interacting with page (generating keyboard or mouse events) |
| rc_prod_recommend_time | time while mouse pointer was positioned over recommended products |
| rel_recommend_time_document_length | relative time while mouse pointer was positioned over recommending interface in relation to the number of characters within all texts on the page |
| rel_recommend_time_page_time | relative time, while mouse pointer was positioned over recommending interface, in relation to time between page load and page unload |
| rel_recommend_time_tab_activ | relative time while mouse pointer was positioned over recommending interface in relation to time while tab containing particular page is active |
| rel_recommend_time_user_activ | relative time while mouse pointer was positioned over recommending interface in relation to time while user is actively interacting with page (generating keyboard or mouse events) |
| Recommendation Location | Time (s) | |
|---|---|---|
| Vertical RC | Horizontal RC | |
| RC1 | 2.4 | 1.3 |
| RC2 | 3.1 | 2.1 |
| RC3 | 2.1 | 3.9 |
| RC4 | 0.6 | 0.8 |
| Total | 8.2 | 8.1 |
| Recommendation Location | Vertical RC | Horizontal RC | ||||
|---|---|---|---|---|---|---|
| PC1 | PC2 | PC3 | PC4 | PC5 | PC6 | |
| RC1 direct | 0.019 (VI1) | 0.019 (VI1) | 0 (VI1) | 0.038 (VI1) | 0 (VI1) | 0.077 (VI1) |
| RC1 indirect | 0.019 (VI1) | 0 (VI1) | 0 (VI1) | 0.019 (VI1) | 0 (VI1) | 0.058 (VI1) |
| RC2 direct | 0.038 (VI1) | 0.077 (VI2) | 0.096 (VI1) | 0 (VI1) | 0.058 (VI2) | 0 (VI1) |
| RC2 indirect | 0.038 (VI1) | 0.058 (VI2) | 0.077 (VI1) | 0.019 (VI1) | 0.038 (VI2) | 0.019 (VI1) |
| RC3 direct | 0.019 (VI1) | 0.077 (VI1) | 0.019 (VI3) | 0 (VI1) | 0.019 (VI1) | 0.038 (VI3) |
| RC3 indirect | 0.058 (VI1) | 0.096 (VI1) | 0.019 (VI3) | 0 (VI1) | 0.038 (VI1) | 0.058 (VI3) |
| RC4 direct | 0.038 (VI1) | 0 (VI1) | 0.038 (VI1) | 0 (VI1) | 0.038 (VI1) | 0 (VI1) |
| RC4 indirect | 0.019 (VI1) | 0.019 (VI1) | 0.038 (VI1) | 0 (VI1) | 0.058 (VI1) | 0.019 (VI1) |
| Total direct | 0.115 | 0.173 | 0.154 | 0.038 | 0.115 | 0.115 |
| Total indirect | 0.135 | 0.173 | 0.135 | 0.038 | 0.135 | 0.154 |
| Metric | Neural Network | Random Forests | Logistic Regression | SVM | Binary Tree |
|---|---|---|---|---|---|
| AUC | 0.883 | 0.913 | 0.938 | 0.905 | 0.681 |
| CA | 0.932 | 0.927 | 0.921 | 0.921 | 0.910 |
| Model | F1 | Precision | Recall | Specificity |
|---|---|---|---|---|
| Neural Network | 0.929 | 0.929 | 0.932 | 0.694 |
| Random Forests | 0.919 | 0.923 | 0.927 | 0.582 |
| Logistic Regression | 0.911 | 0.916 | 0.921 | 0.544 |
| SVM | 0.911 | 0.916 | 0.921 | 0.544 |
| Binary Tree | 0.901 | 0.901 | 0.910 | 0.543 |
| Model | F1 | Precision | Recall | Specificity |
|---|---|---|---|---|
| Random Forests | 0.649 | 0.857 | 0.522 | 0.987 |
| Logistic Regression | 0.611 | 0.846 | 0.478 | 0.987 |
| SVM | 0.611 | 0.846 | 0.478 | 0.987 |
| Neural Network | 0.714 | 0.789 | 0.652 | 0.974 |
| Binary Tree | 0.579 | 0.733 | 0.478 | 0.974 |
| Model | F1 | Precision | Recall | Specificity |
|---|---|---|---|---|
| Neural Network | 0.962 | 0.949 | 0.974 | 0.652 |
| Random Forests | 0.959 | 0.933 | 0.987 | 0.522 |
| Logistic Regression | 0.956 | 0.927 | 0.987 | 0.478 |
| SVM | 0.956 | 0.927 | 0.987 | 0.478 |
| Binary Tree | 0.949 | 0.926 | 0.974 | 0.478 |
| Metric | Binary Tree | SVM | Random Forests | Neural Network | Logistic Regression |
|---|---|---|---|---|---|
| AUC | 0.897 | 0.961 | 0.950 | 0.960 | 0.971 |
| CA | 0.966 | 0.944 | 0.955 | 0.955 | 0.944 |
| Model | F1 | Precision | Recall | Specificity |
|---|---|---|---|---|
| Binary Tree | 0.967 | 0.969 | 0.966 | 0.828 |
| SVM | 0.941 | 0.939 | 0.944 | 0.487 |
| Random Forests | 0.955 | 0.955 | 0.955 | 0.657 |
| Neural Network | 0.953 | 0.951 | 0.955 | 0.573 |
| Logistic Regression | 0.941 | 0.939 | 0.944 | 0.487 |
| Model | F1 | Precision | Recall | Specificity |
|---|---|---|---|---|
| Binary Tree | 0.750 | 0.692 | 0.818 | 0.976 |
| SVM | 0.500 | 0.556 | 0.455 | 0.976 |
| Random Forests | 0.636 | 0.636 | 0.636 | 0.976 |
| Neural Network | 0.600 | 0.667 | 0.545 | 0.982 |
| Logistic Regression | 0.500 | 0.556 | 0.455 | 0.976 |
| Model | F1 | Precision | Recall | Specificity |
|---|---|---|---|---|
| Binary Tree | 0.982 | 0.988 | 0.976 | 0.818 |
| SVM | 0.970 | 0.964 | 0.976 | 0.455 |
| Random Forests | 0.976 | 0.976 | 0.976 | 0.636 |
| Neural Network | 0.976 | 0.970 | 0.982 | 0.545 |
| Logistic Regression | 0.970 | 0.964 | 0.976 | 0.455 |
| Model | Neural Network | Binary Tree | Logistic Regression | Random Forests | SVM |
|---|---|---|---|---|---|
| AUC | 0.858 | 0.548 | 0.729 | 0.905 | 0.750 |
| CA | 0.904 | 0.891 | 0.927 | 0.921 | 0.921 |
| Model | F1 | Precision | Recall | Specificity |
|---|---|---|---|---|
| Neural Network | 0.902 | 0.900 | 0.904 | 0.562 |
| Binary Tree | 0.884 | 0.886 | 0.881 | 0.526 |
| Logistic Regression | 0.897 | 0.869 | 0.927 | 0.508 |
| Random Forests | 0.894 | 0.868 | 0.921 | 0.496 |
| SVM | 0.894 | 0.868 | 0.921 | 0.446 |
| Model | F1 | Precision | Recall | Specificity |
|---|---|---|---|---|
| Neural Network | 0.949 | 0.926 | 0.952 | 0.616 |
| Binary Tree | 0.936 | 0.919 | 0.933 | 0.562 |
| Logistic Regression | 0.962 | 0.912 | 0.994 | 0.562 |
| Random Forests | 0.959 | 0.891 | 0.988 | 0.568 |
| SVM | 0.959 | 0.891 | 0.988 | 0.538 |
| Model | F1 | Precision | Recall | Specificity |
|---|---|---|---|---|
| Neural Network | 0.795 | 0.648 | 0.768 | 0.424 |
| Binary Tree | 0.786 | 0.646 | 0.751 | 0.418 |
| Logistic Regression | 0.698 | 0.562 | 0.717 | 0.403 |
| Random Forests | 0.657 | 0.520 | 0.626 | 0.387 |
| SVM | 0.657 | 0.520 | 0.626 | 0.340 |
| Store/rc_layout | prod_recommend_time [ms] | rel_recommend_time_ recommend_length [ms/char] | rel_recommend_time_ document_length [ms/char] | rel_recommend_time_ page_time | rel_recommend_time_ tab_activ | rel_recommend_time_ user_activ |
|---|---|---|---|---|---|---|
| Agito.pl vertical | 2669 | 1.584 | 0.075 | 0.059 | 0.067 | 0.101 |
| Agito.pl horizontal | 1920 | 1.304 | 0.054 | 0.043 | 0.048 | 0.073 |
| Electro.pl vertical | 4029 | 2.048 | 0.157 | 0.089 | 0.096 | 0.174 |
| Electro.pl horizontal | 1858 | 0.944 | 0.072 | 0.041 | 0.044 | 0.080 |
| Merlin.pl vertical | 1977 | 0.351 | 0.108 | 0.049 | 0.084 | 0.156 |
| Merlin.pl horizontal | 1312 | 0.285 | 0.072 | 0.032 | 0.056 | 0.104 |
| Morele.net vertical | 1777 | 0.905 | 0.104 | 0.054 | 0.052 | 0.079 |
| Morele.net horizontal | 1953 | 0.752 | 0.114 | 0.059 | 0.058 | 0.087 |
Publisher’s Note: MDPI stays neutral with regard to jurisdictional claims in published maps and institutional affiliations. |
© 2021 by the authors. Licensee MDPI, Basel, Switzerland. This article is an open access article distributed under the terms and conditions of the Creative Commons Attribution (CC BY) license (http://creativecommons.org/licenses/by/4.0/).
Share and Cite
Sulikowski, P.; Zdziebko, T.; Coussement, K.; Dyczkowski, K.; Kluza, K.; Sachpazidu-Wójcicka, K. Gaze and Event Tracking for Evaluation of Recommendation-Driven Purchase. Sensors 2021, 21, 1381. https://doi.org/10.3390/s21041381
Sulikowski P, Zdziebko T, Coussement K, Dyczkowski K, Kluza K, Sachpazidu-Wójcicka K. Gaze and Event Tracking for Evaluation of Recommendation-Driven Purchase. Sensors. 2021; 21(4):1381. https://doi.org/10.3390/s21041381
Chicago/Turabian StyleSulikowski, Piotr, Tomasz Zdziebko, Kristof Coussement, Krzysztof Dyczkowski, Krzysztof Kluza, and Karina Sachpazidu-Wójcicka. 2021. "Gaze and Event Tracking for Evaluation of Recommendation-Driven Purchase" Sensors 21, no. 4: 1381. https://doi.org/10.3390/s21041381