
A-WEAR Bracelet for Detection of Hand Tremor and Bradykinesia in Parkinson’s Patients


Abstract
:1. Introduction
1.1. Background
1.2. Related Work
2. Experimental Set-Up
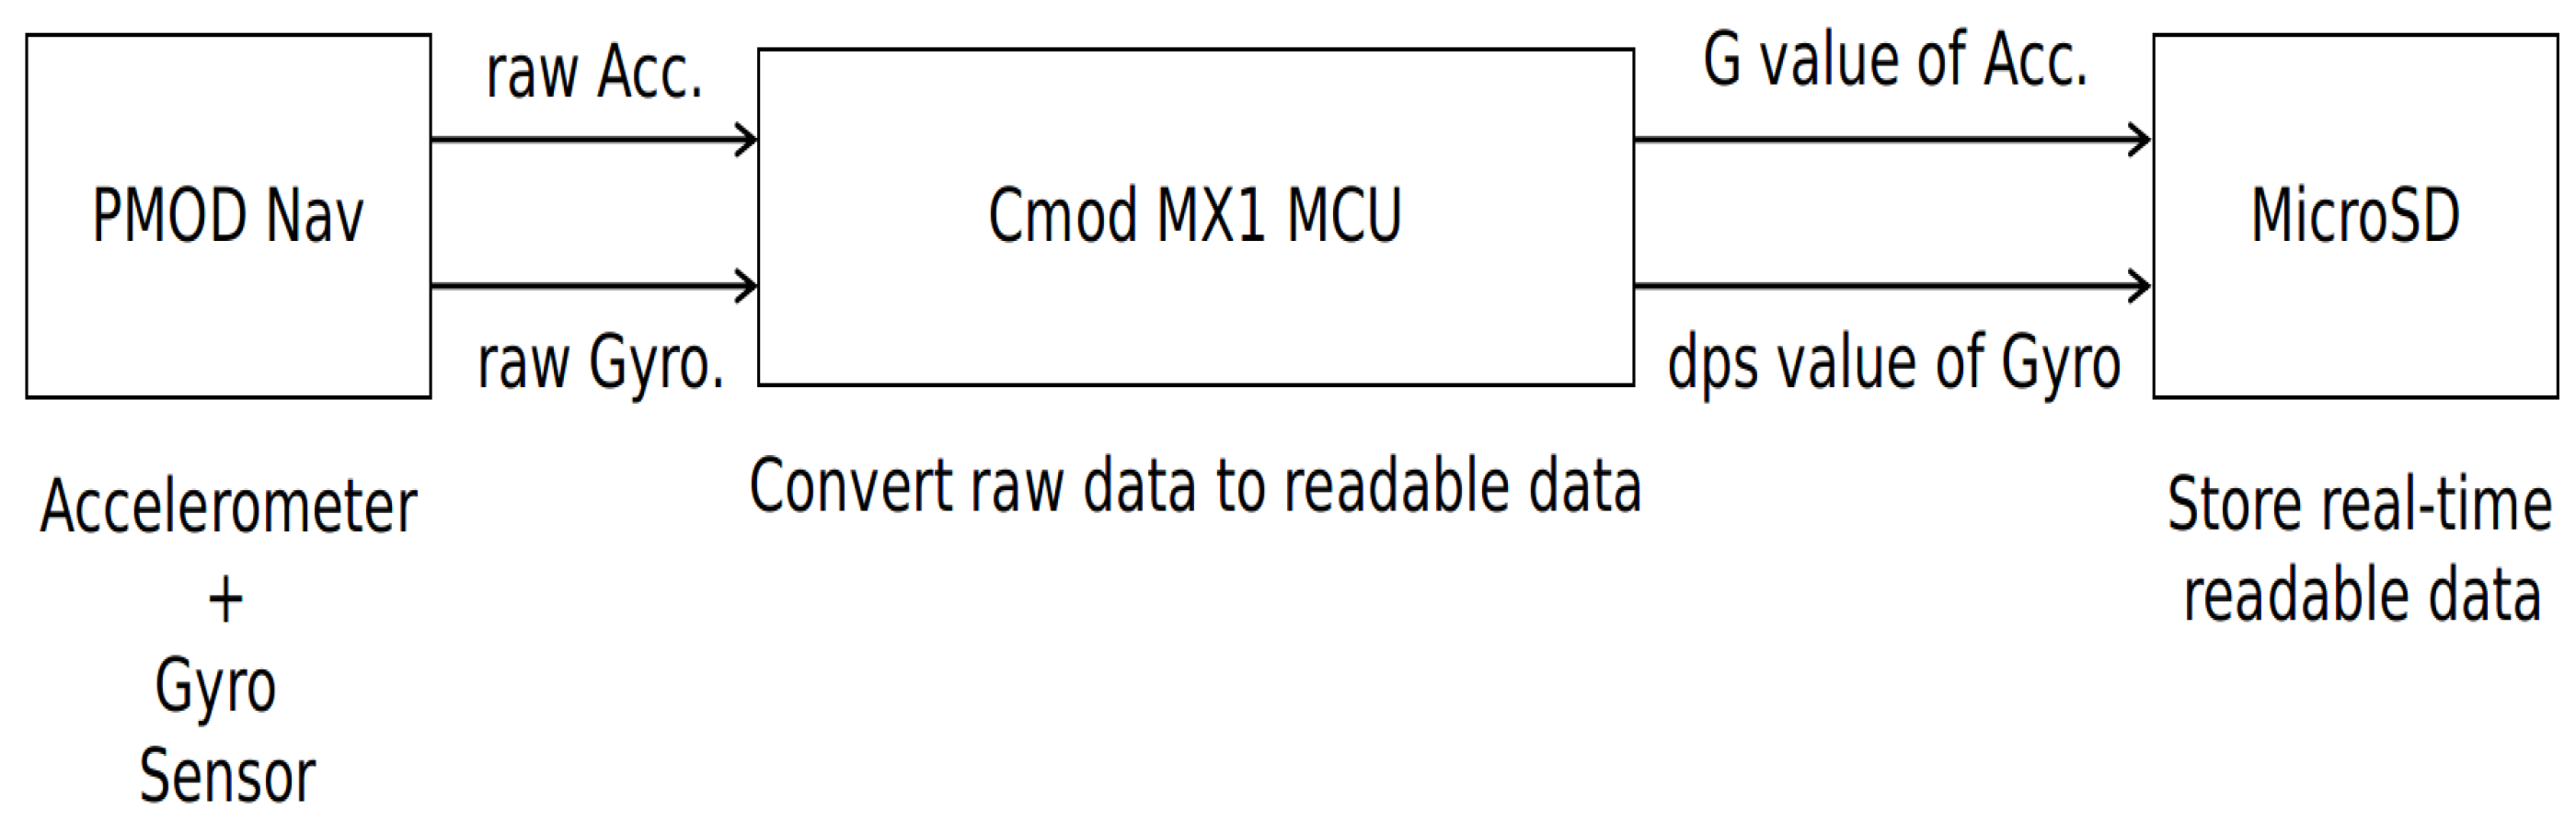
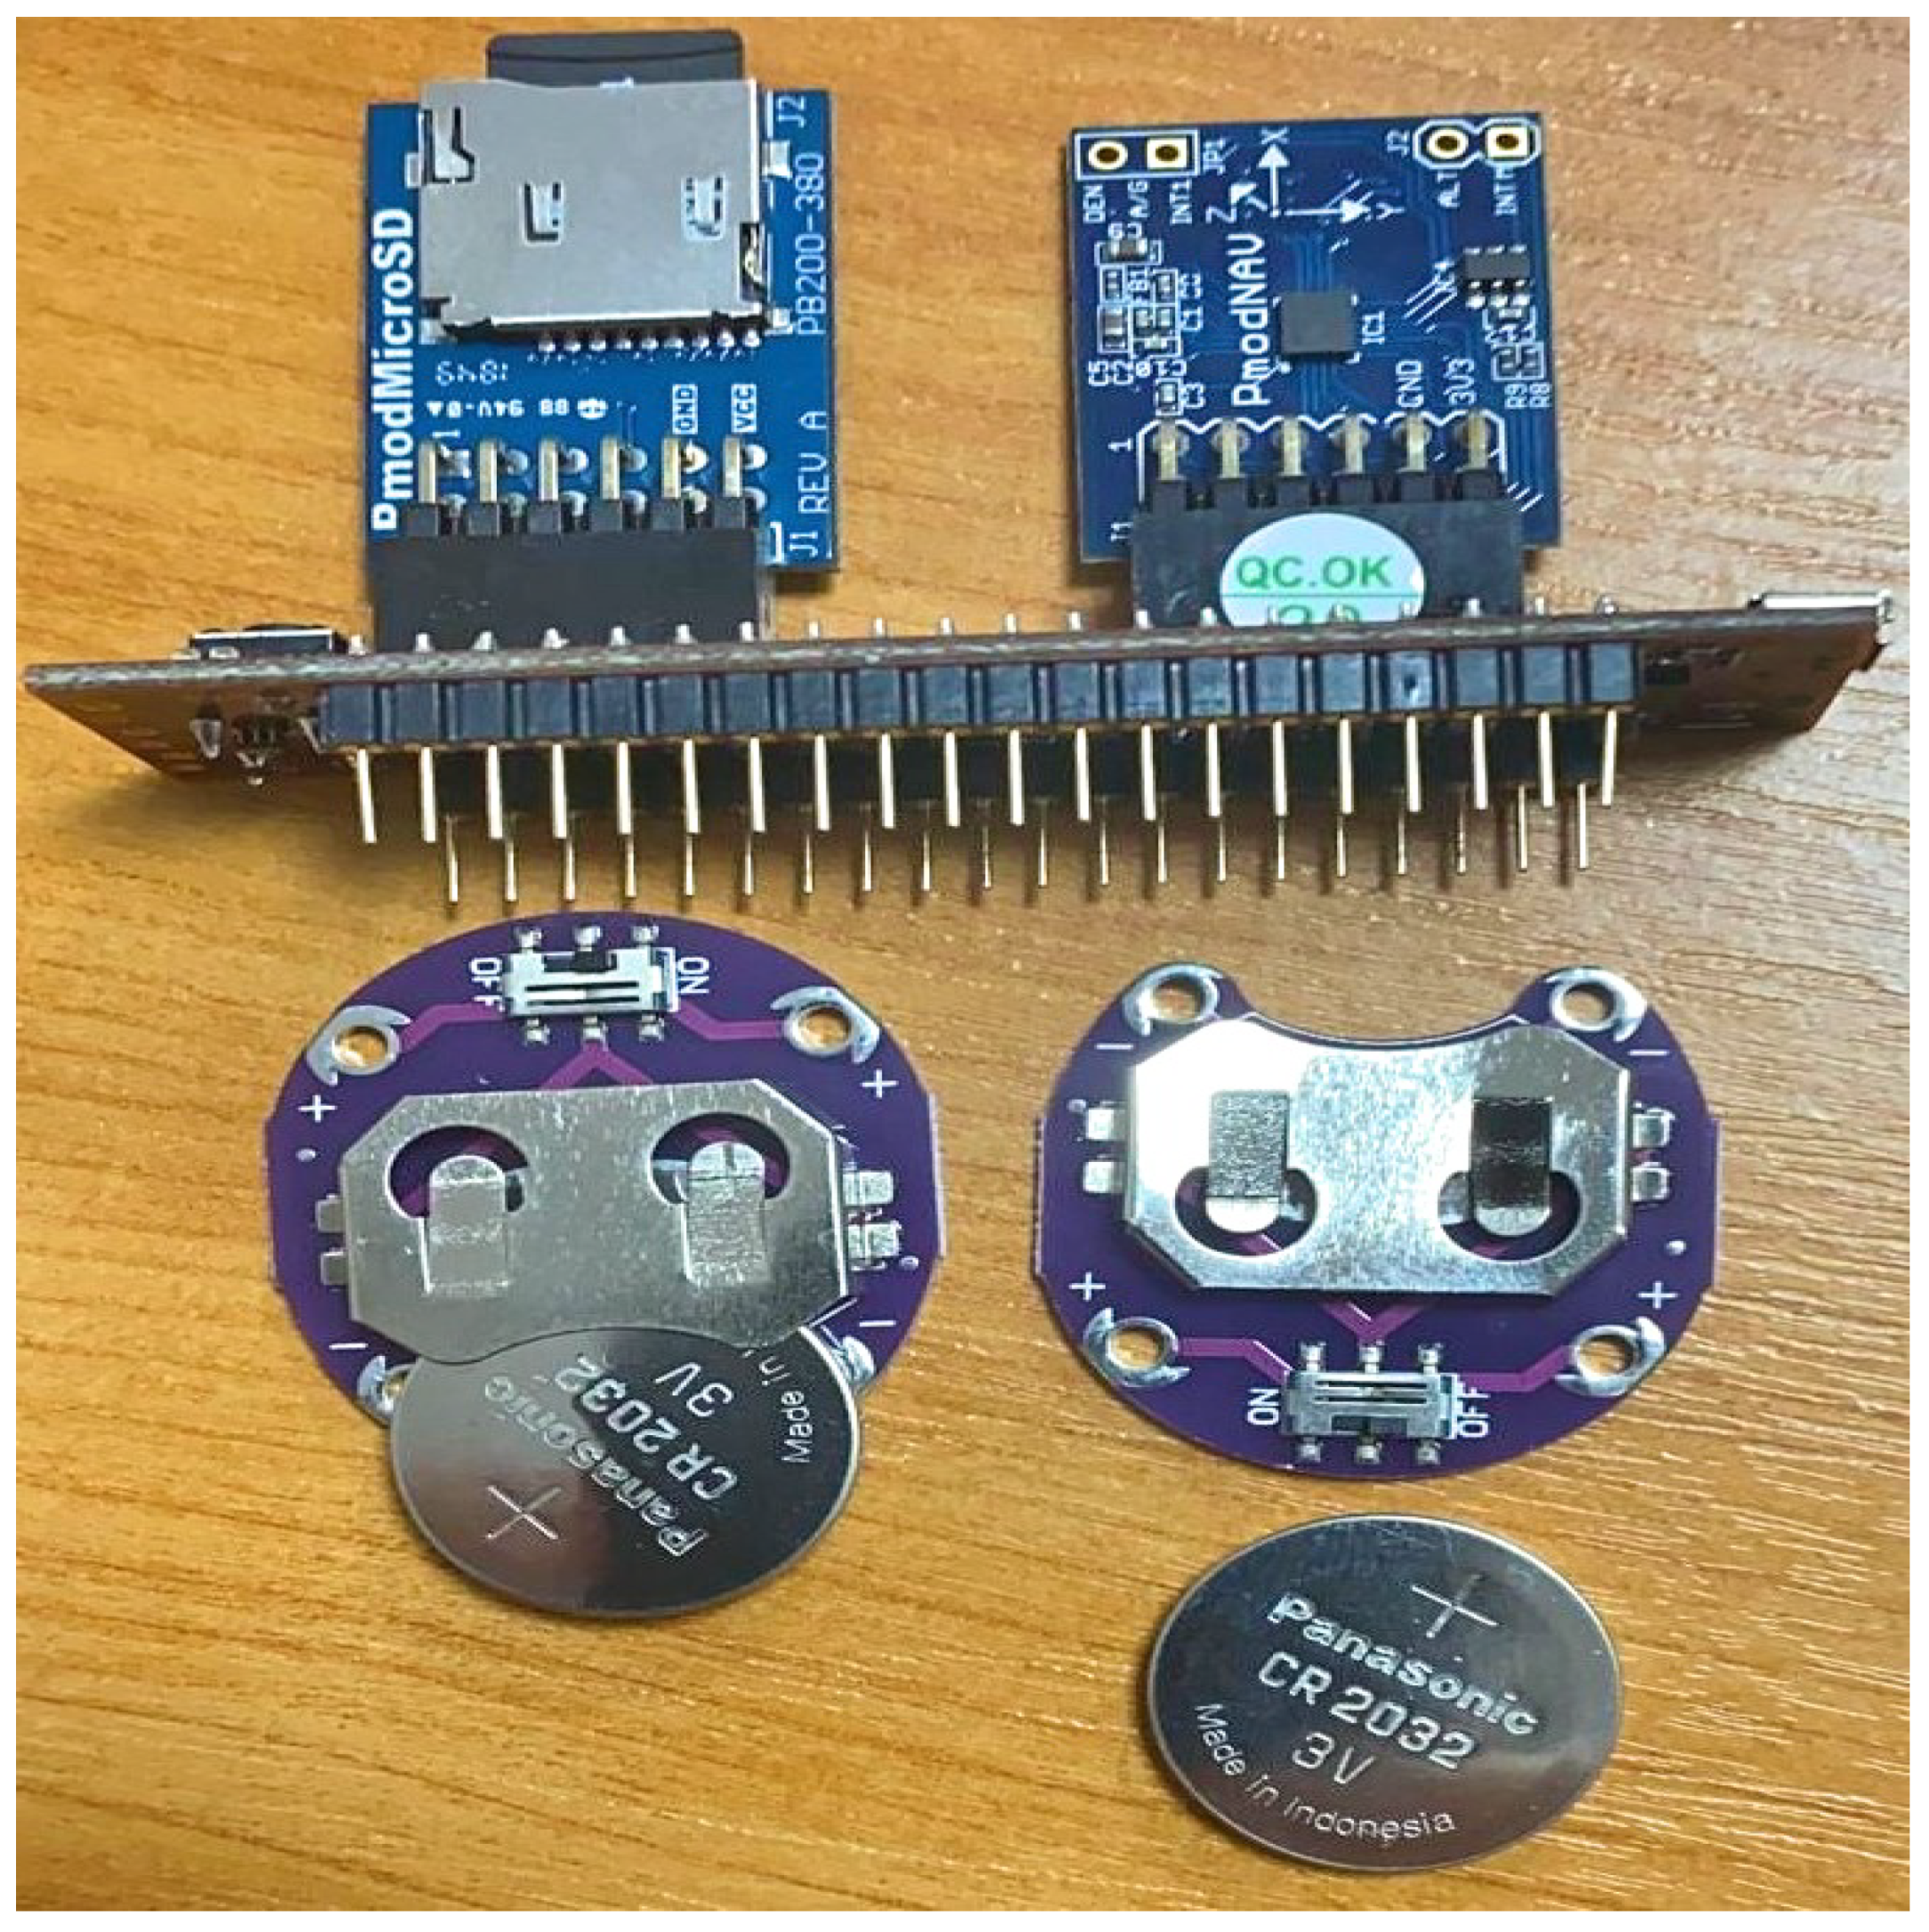
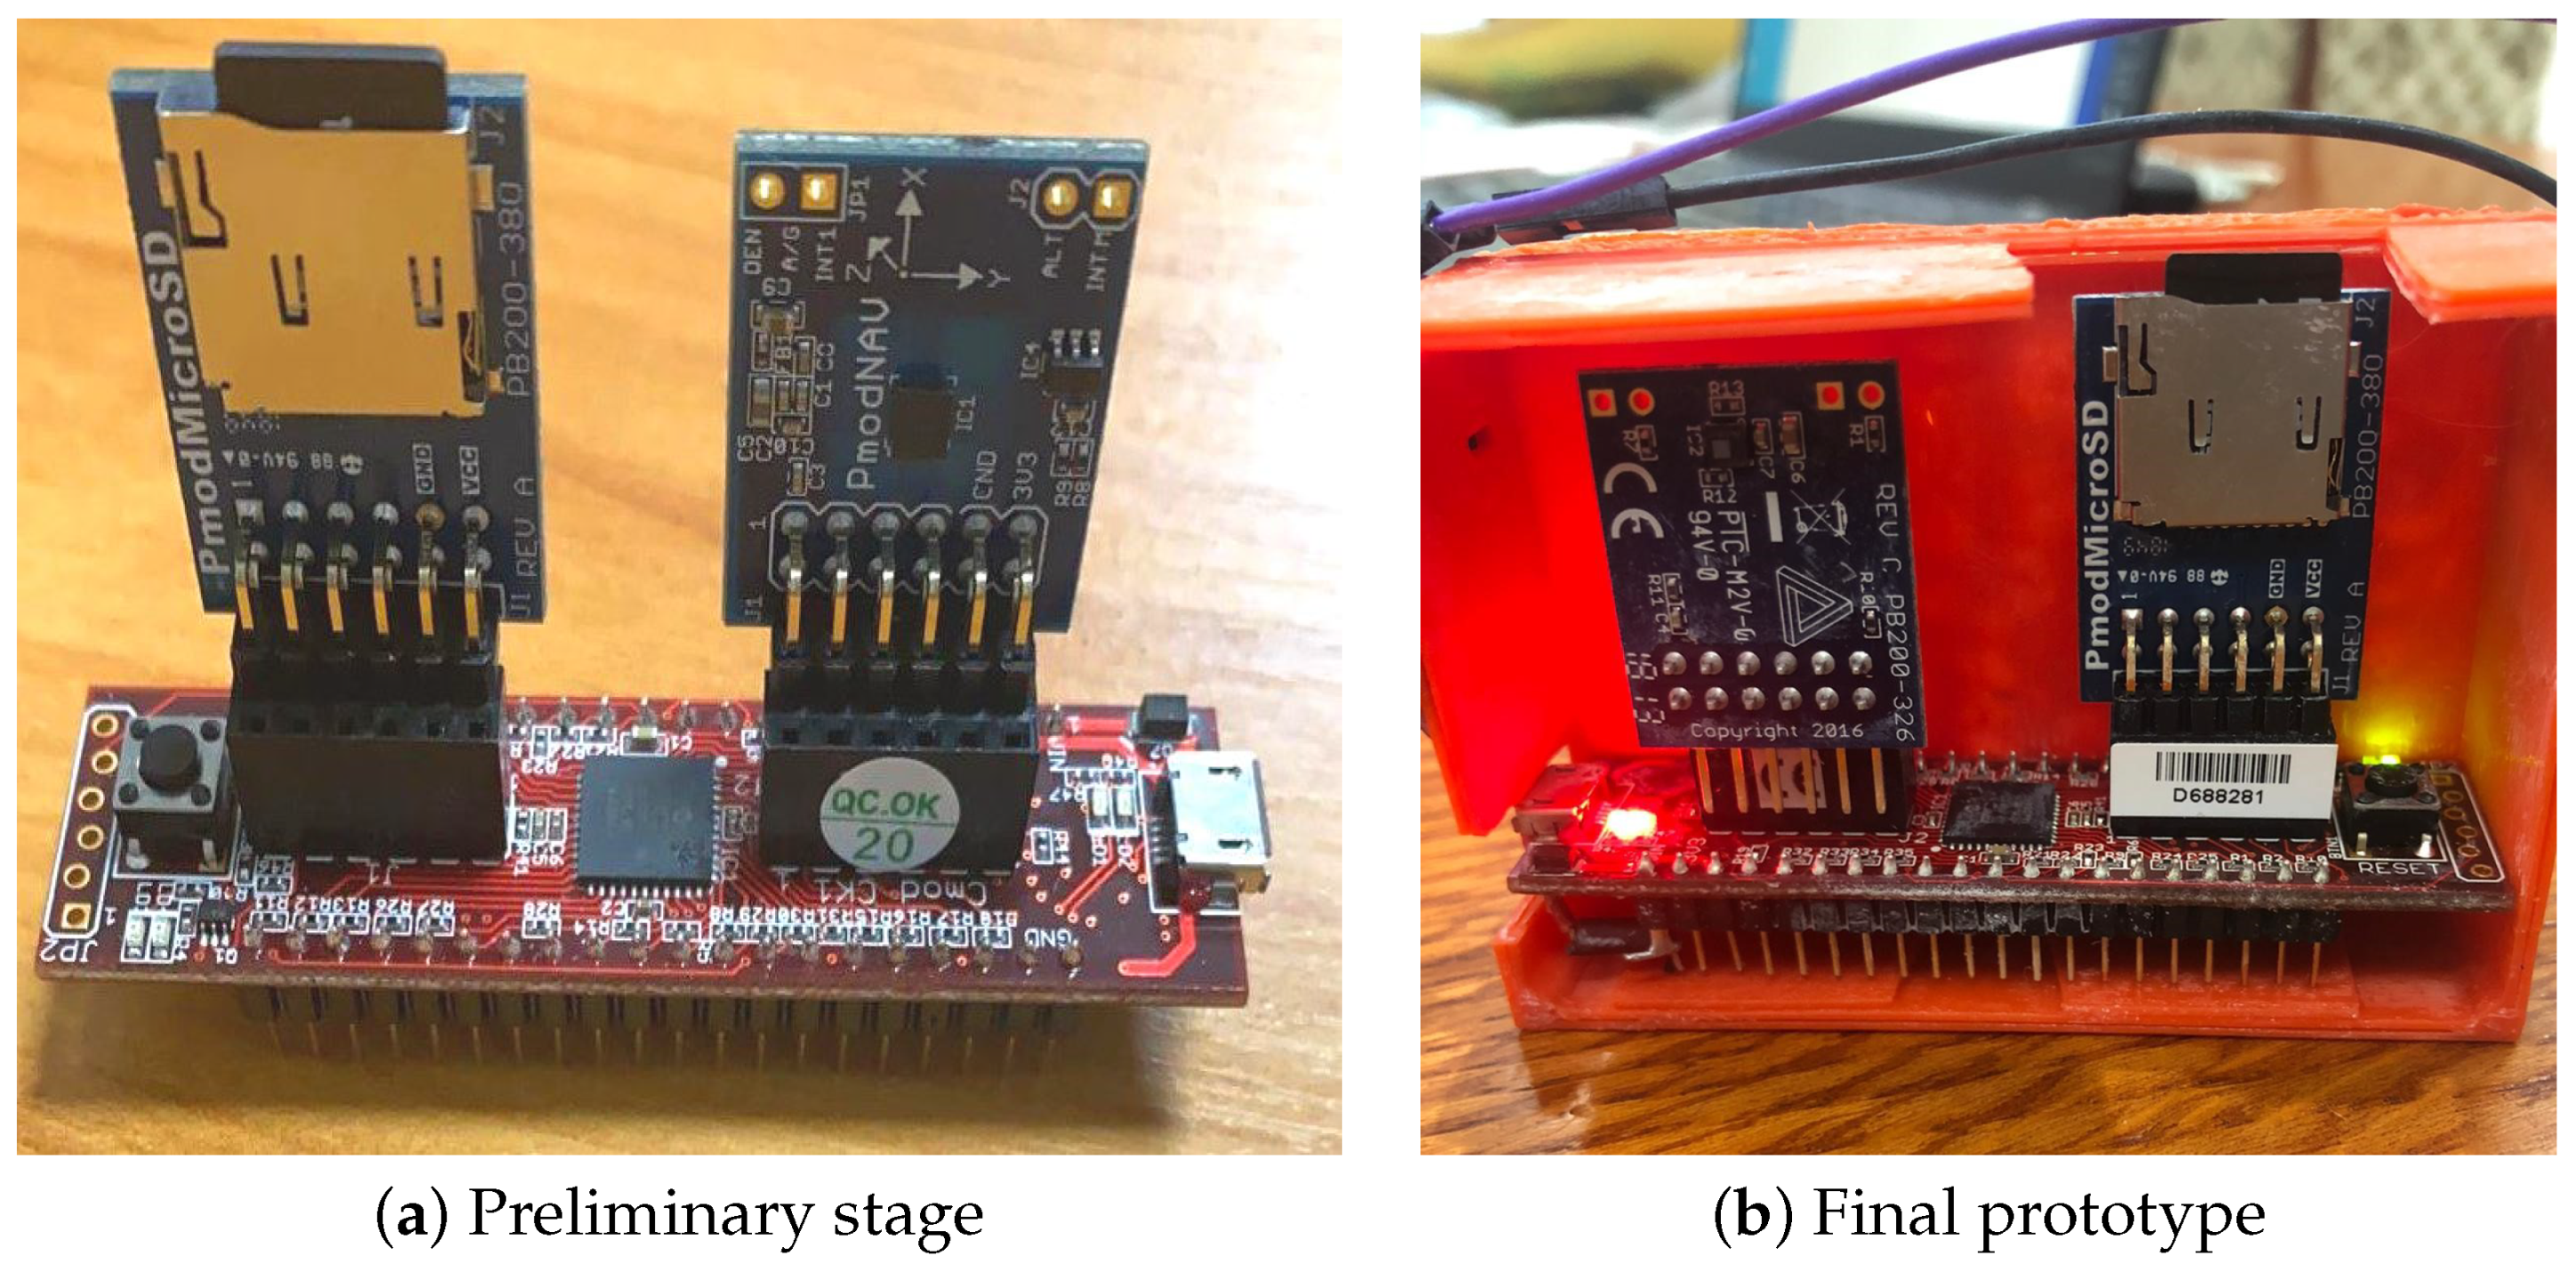
2.1. Measurement System/Hardware Description
- The Cmod MX1 microcontroller containing a microchip PIC32MX150F128D microprocessor.
- Pmod NAV module: 3-axis accelerometer and 3-axis gyroscope sensor.
- Pmod micro SD module, which is used for storing data on the micro SD card.
2.2. The Subjects and the Acquisition Procedure
2.2.1. Part 1: Validation of Tremor Detection
- Testing for Resting tremor (RT): To evaluate RT within the upper limits, the patients are inquired to rest the forearms comfortably on the thighs for one minute. Resting tremor most commonly shows up as a flexion-extension development of the wrist/hand, a pronation-supination exercise of the forearm, or a pill-rolling exercise of the thumb and index finger.
- Testing for Postural tremor (PT): Postural tremor is a kind of tremor that develops when the patient maintains a position against gravity and its frequency is typically in between 4–12 Hz [43]. To test for postural tremor, the patient is first asked to completely elongate the elbow and to flex the arm forward at 90°. At that point, the subject is requested to spread their fingers out as much as conceivable and continue this position for a minute. This is essential since a PT in PD is often evidenced in a minute after the position is accepted.
- Action or kinetic tremor (KT): This sort of tremor shows up only when the participant is carrying out an activity. The recurrence of kinematic tremor is often between 2–7 Hz [44]. To test for action tremor, the finger to nose test is considered. In performing this movement, the patients are taught to alternatively touch their nose and observer finger. In doing so, the patients ought to extend their arm fully and ought not to move quickly. In this way, we have more chance of activating the tremor. This test is performed for 60 s on each partcipant.
2.2.2. Part 2: Validation of Bradykinesia Detection
- Finger Tapping: The primary test is finger tapping in which the control subject is seated and requested to tap his thumb and index finger as much as he can and as quickly as feasible for 60 s.
- Fist Open and Close: Bradykinesia is likewise rated with the arms in the same position as for hand movement, but this time inquiring the patient to open and close the hand as fast as feasible, along with the biggest possible excursion. This activity is attempted for one minute.
- Pronation/Supination: Bradykinesia is also rated for each upper extremity by asking the seated patient to raise the elbow to the level of the mid-chest, flex it to 90° with the hand pointing up, and after that move the hand and forearm as fast as feasible with the greatest possible excursion. This motion is continued for 60 s. This is often related in the same way as finger tapping for each side.
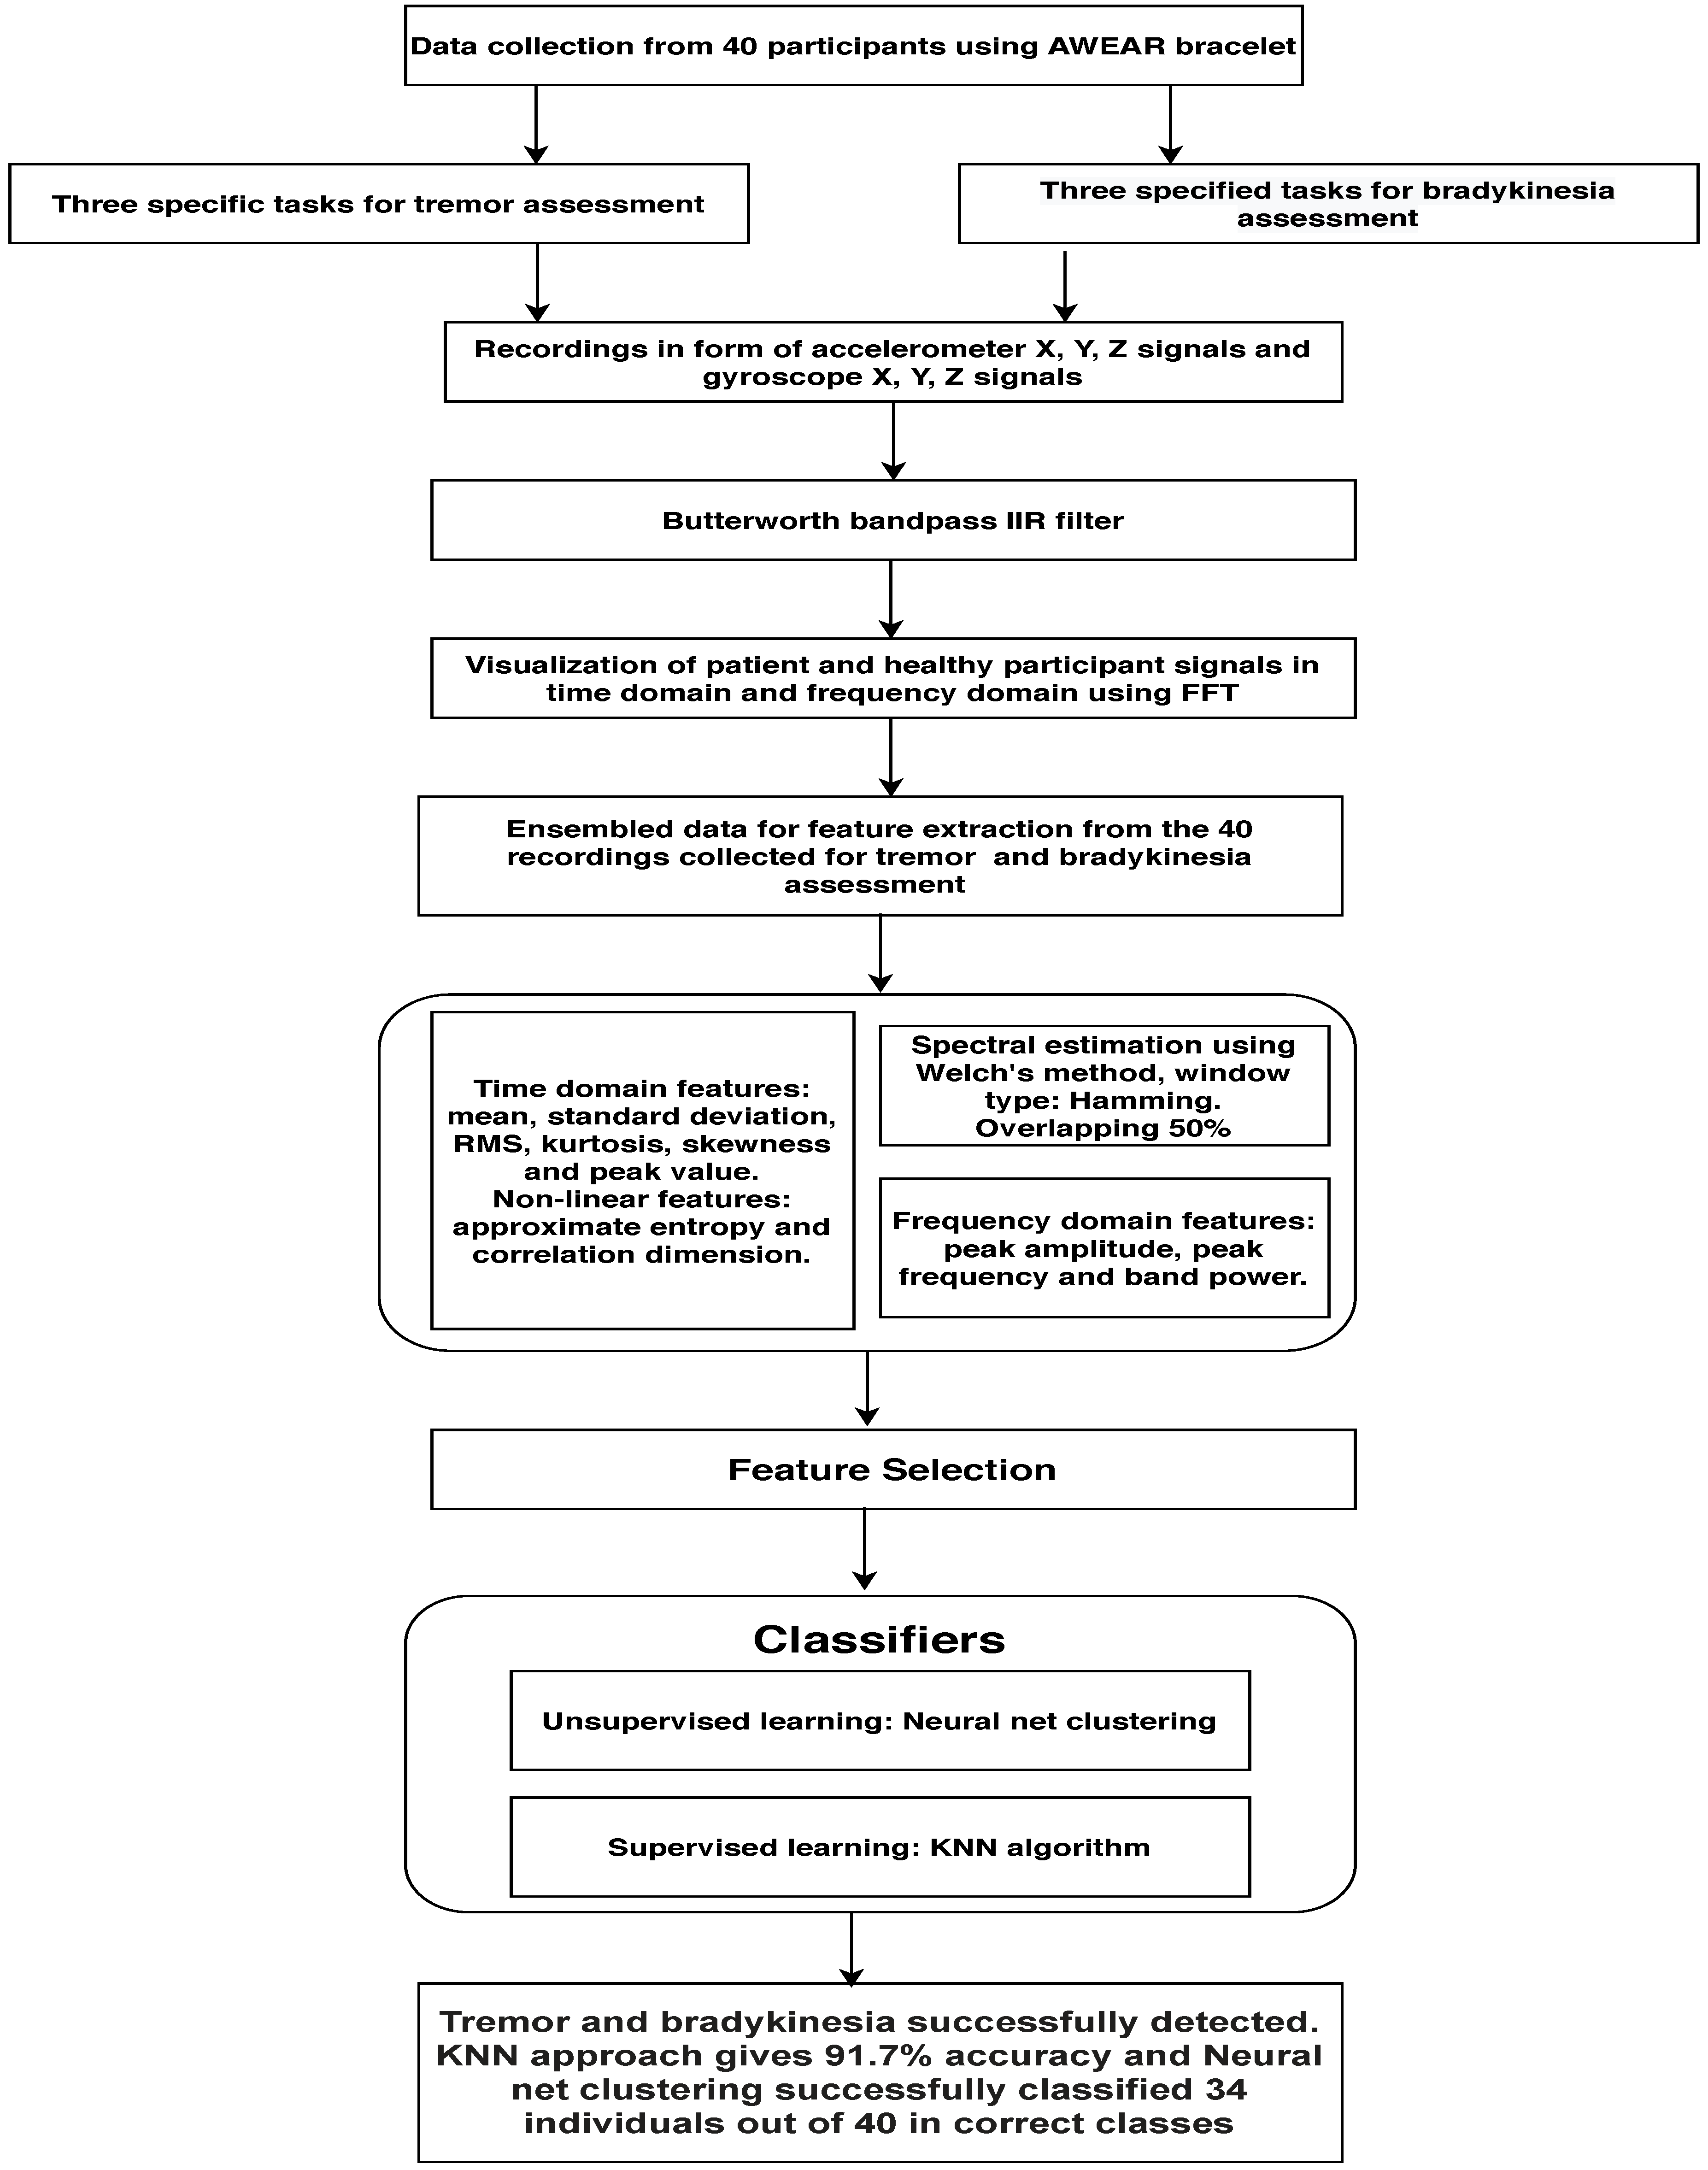
3. Methodology
3.1. Data Analysis
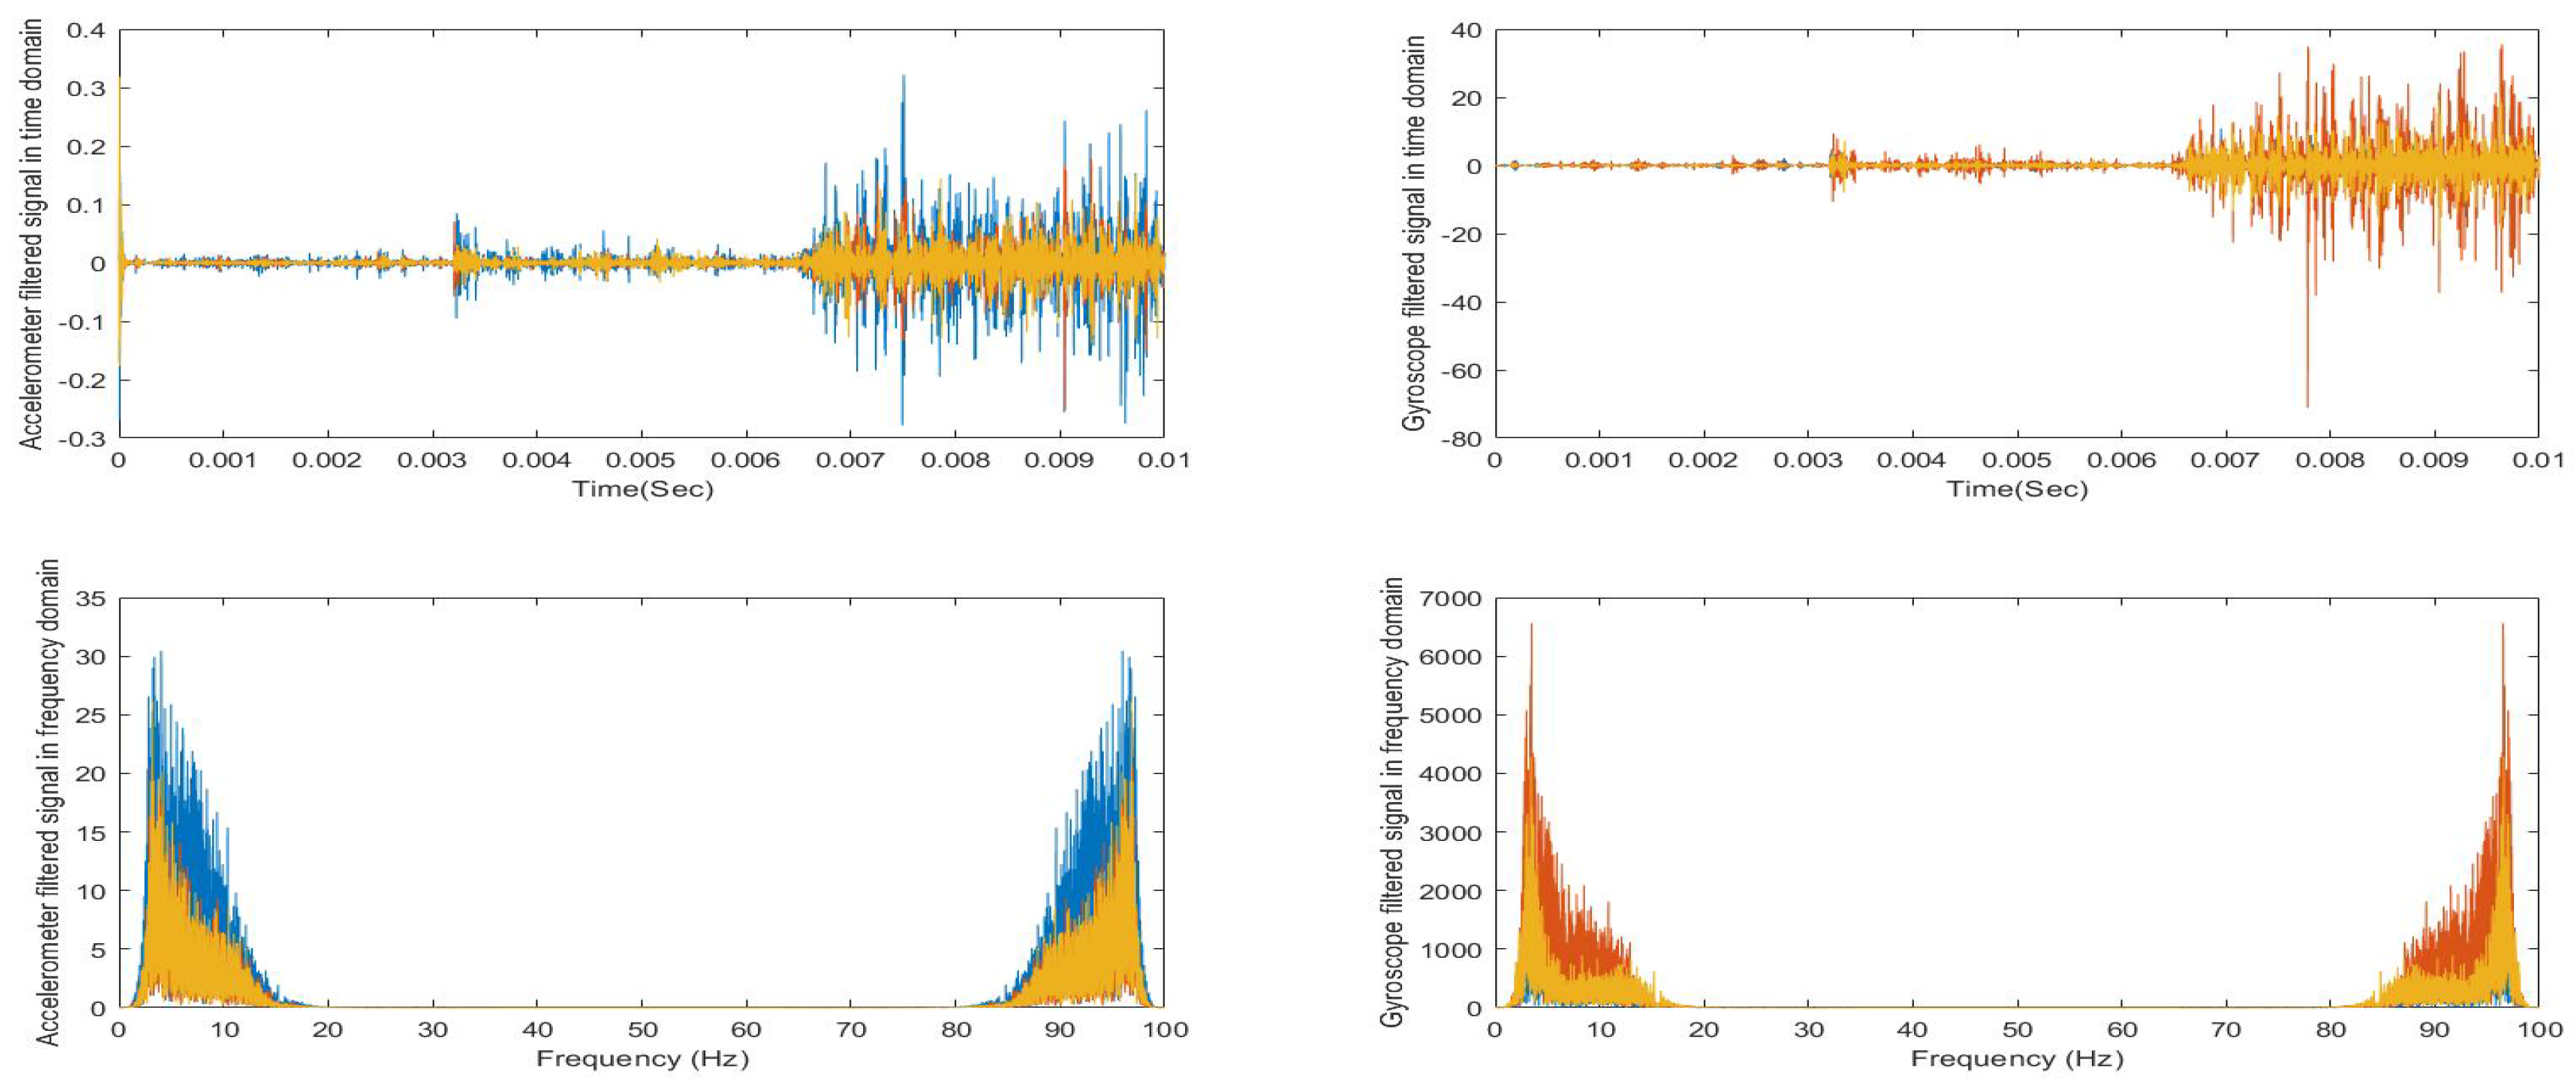
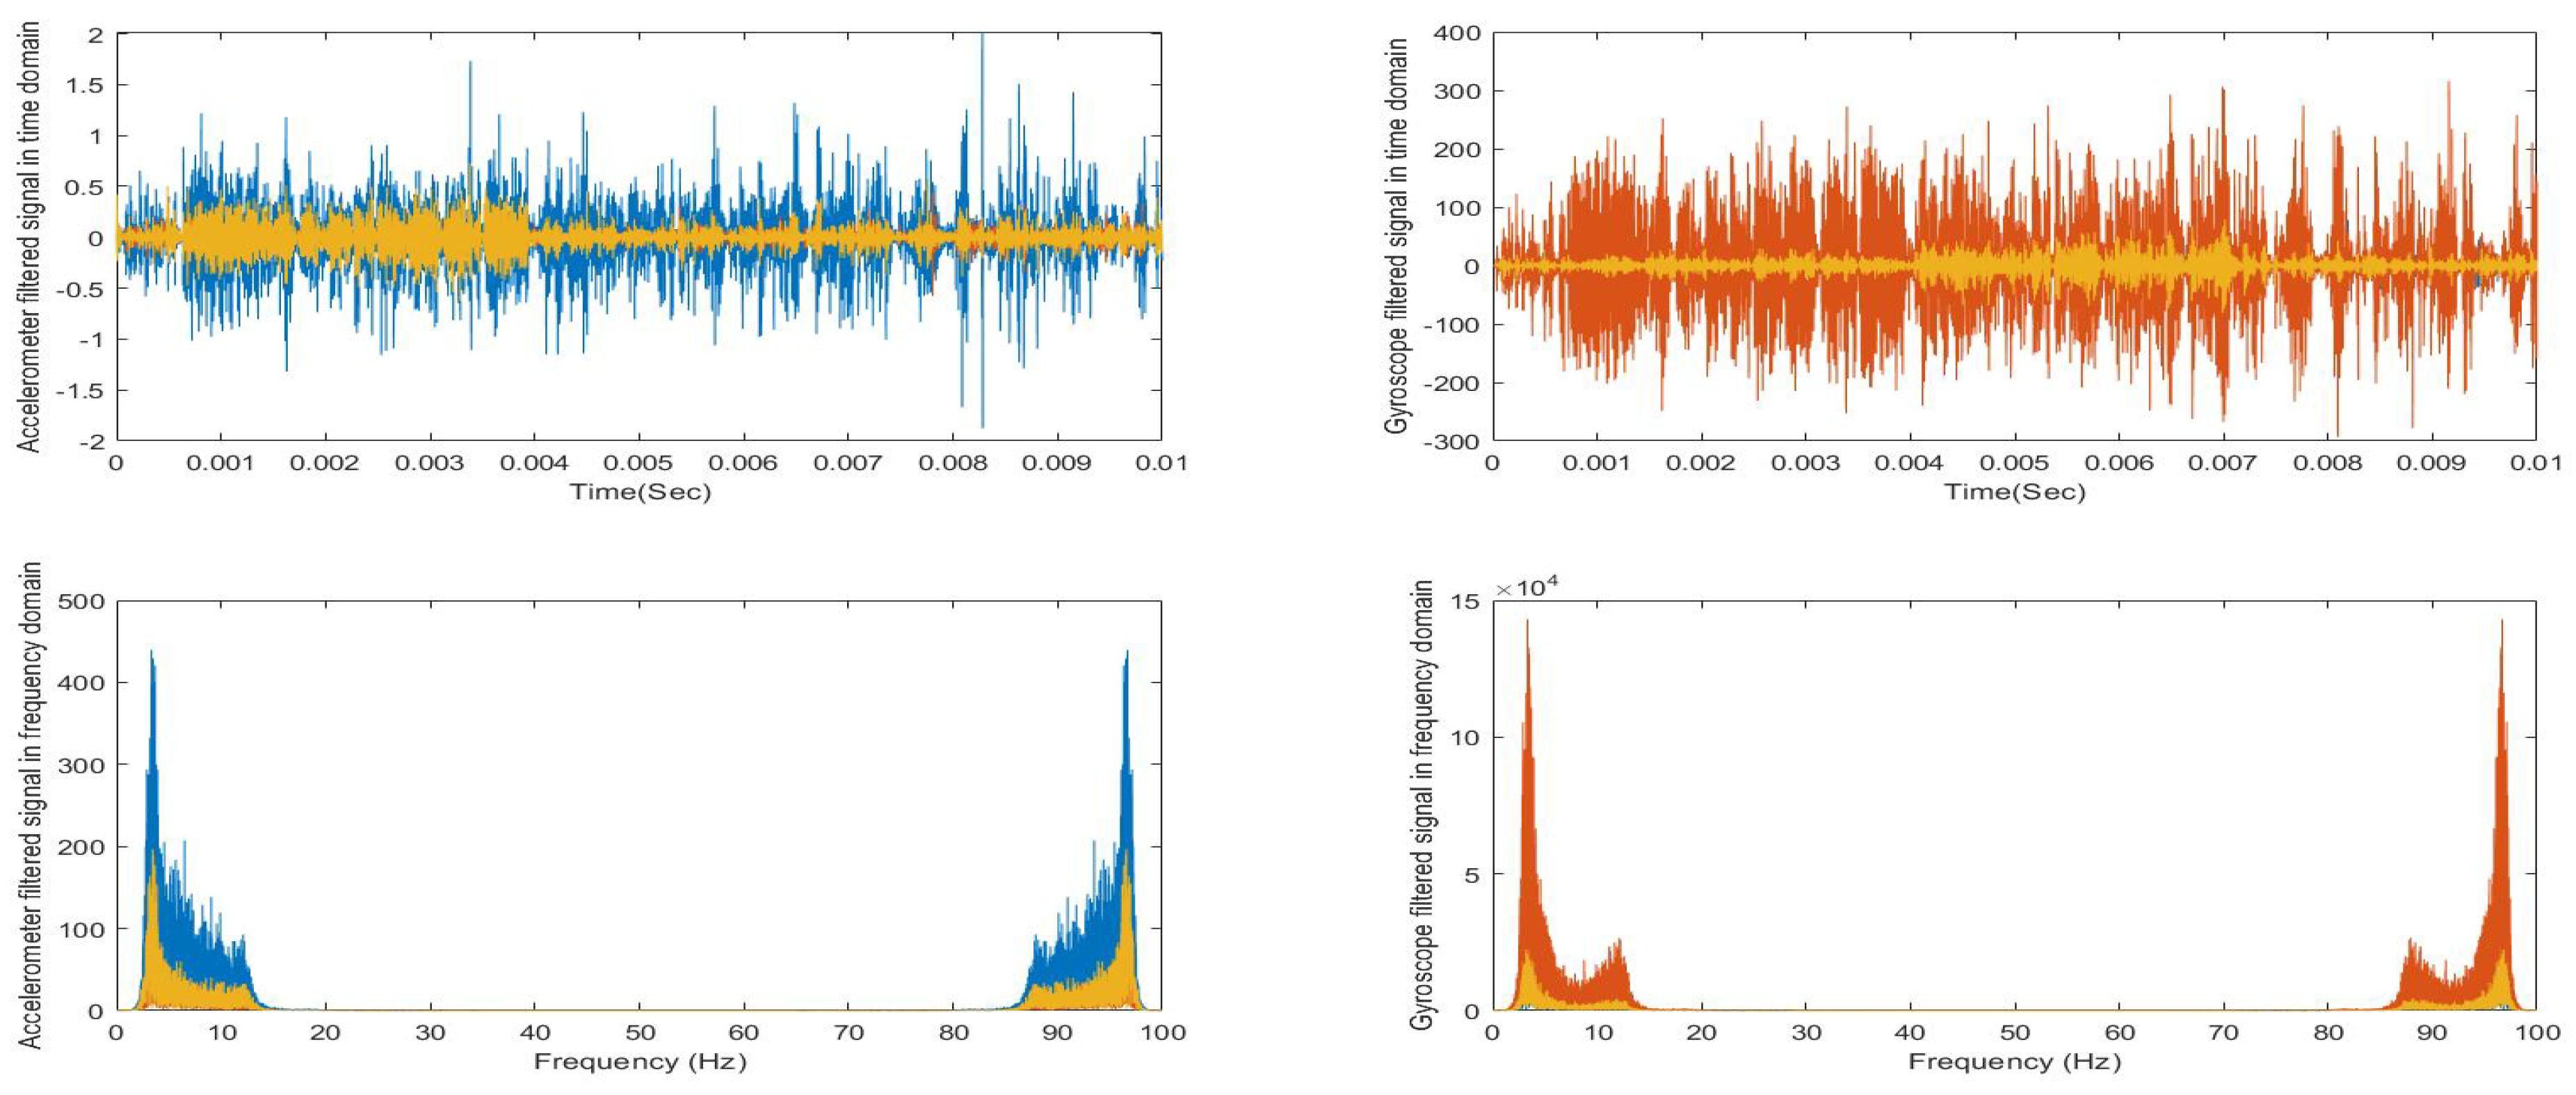
3.1.1. Signal Processing
3.1.2. Signal Visualization
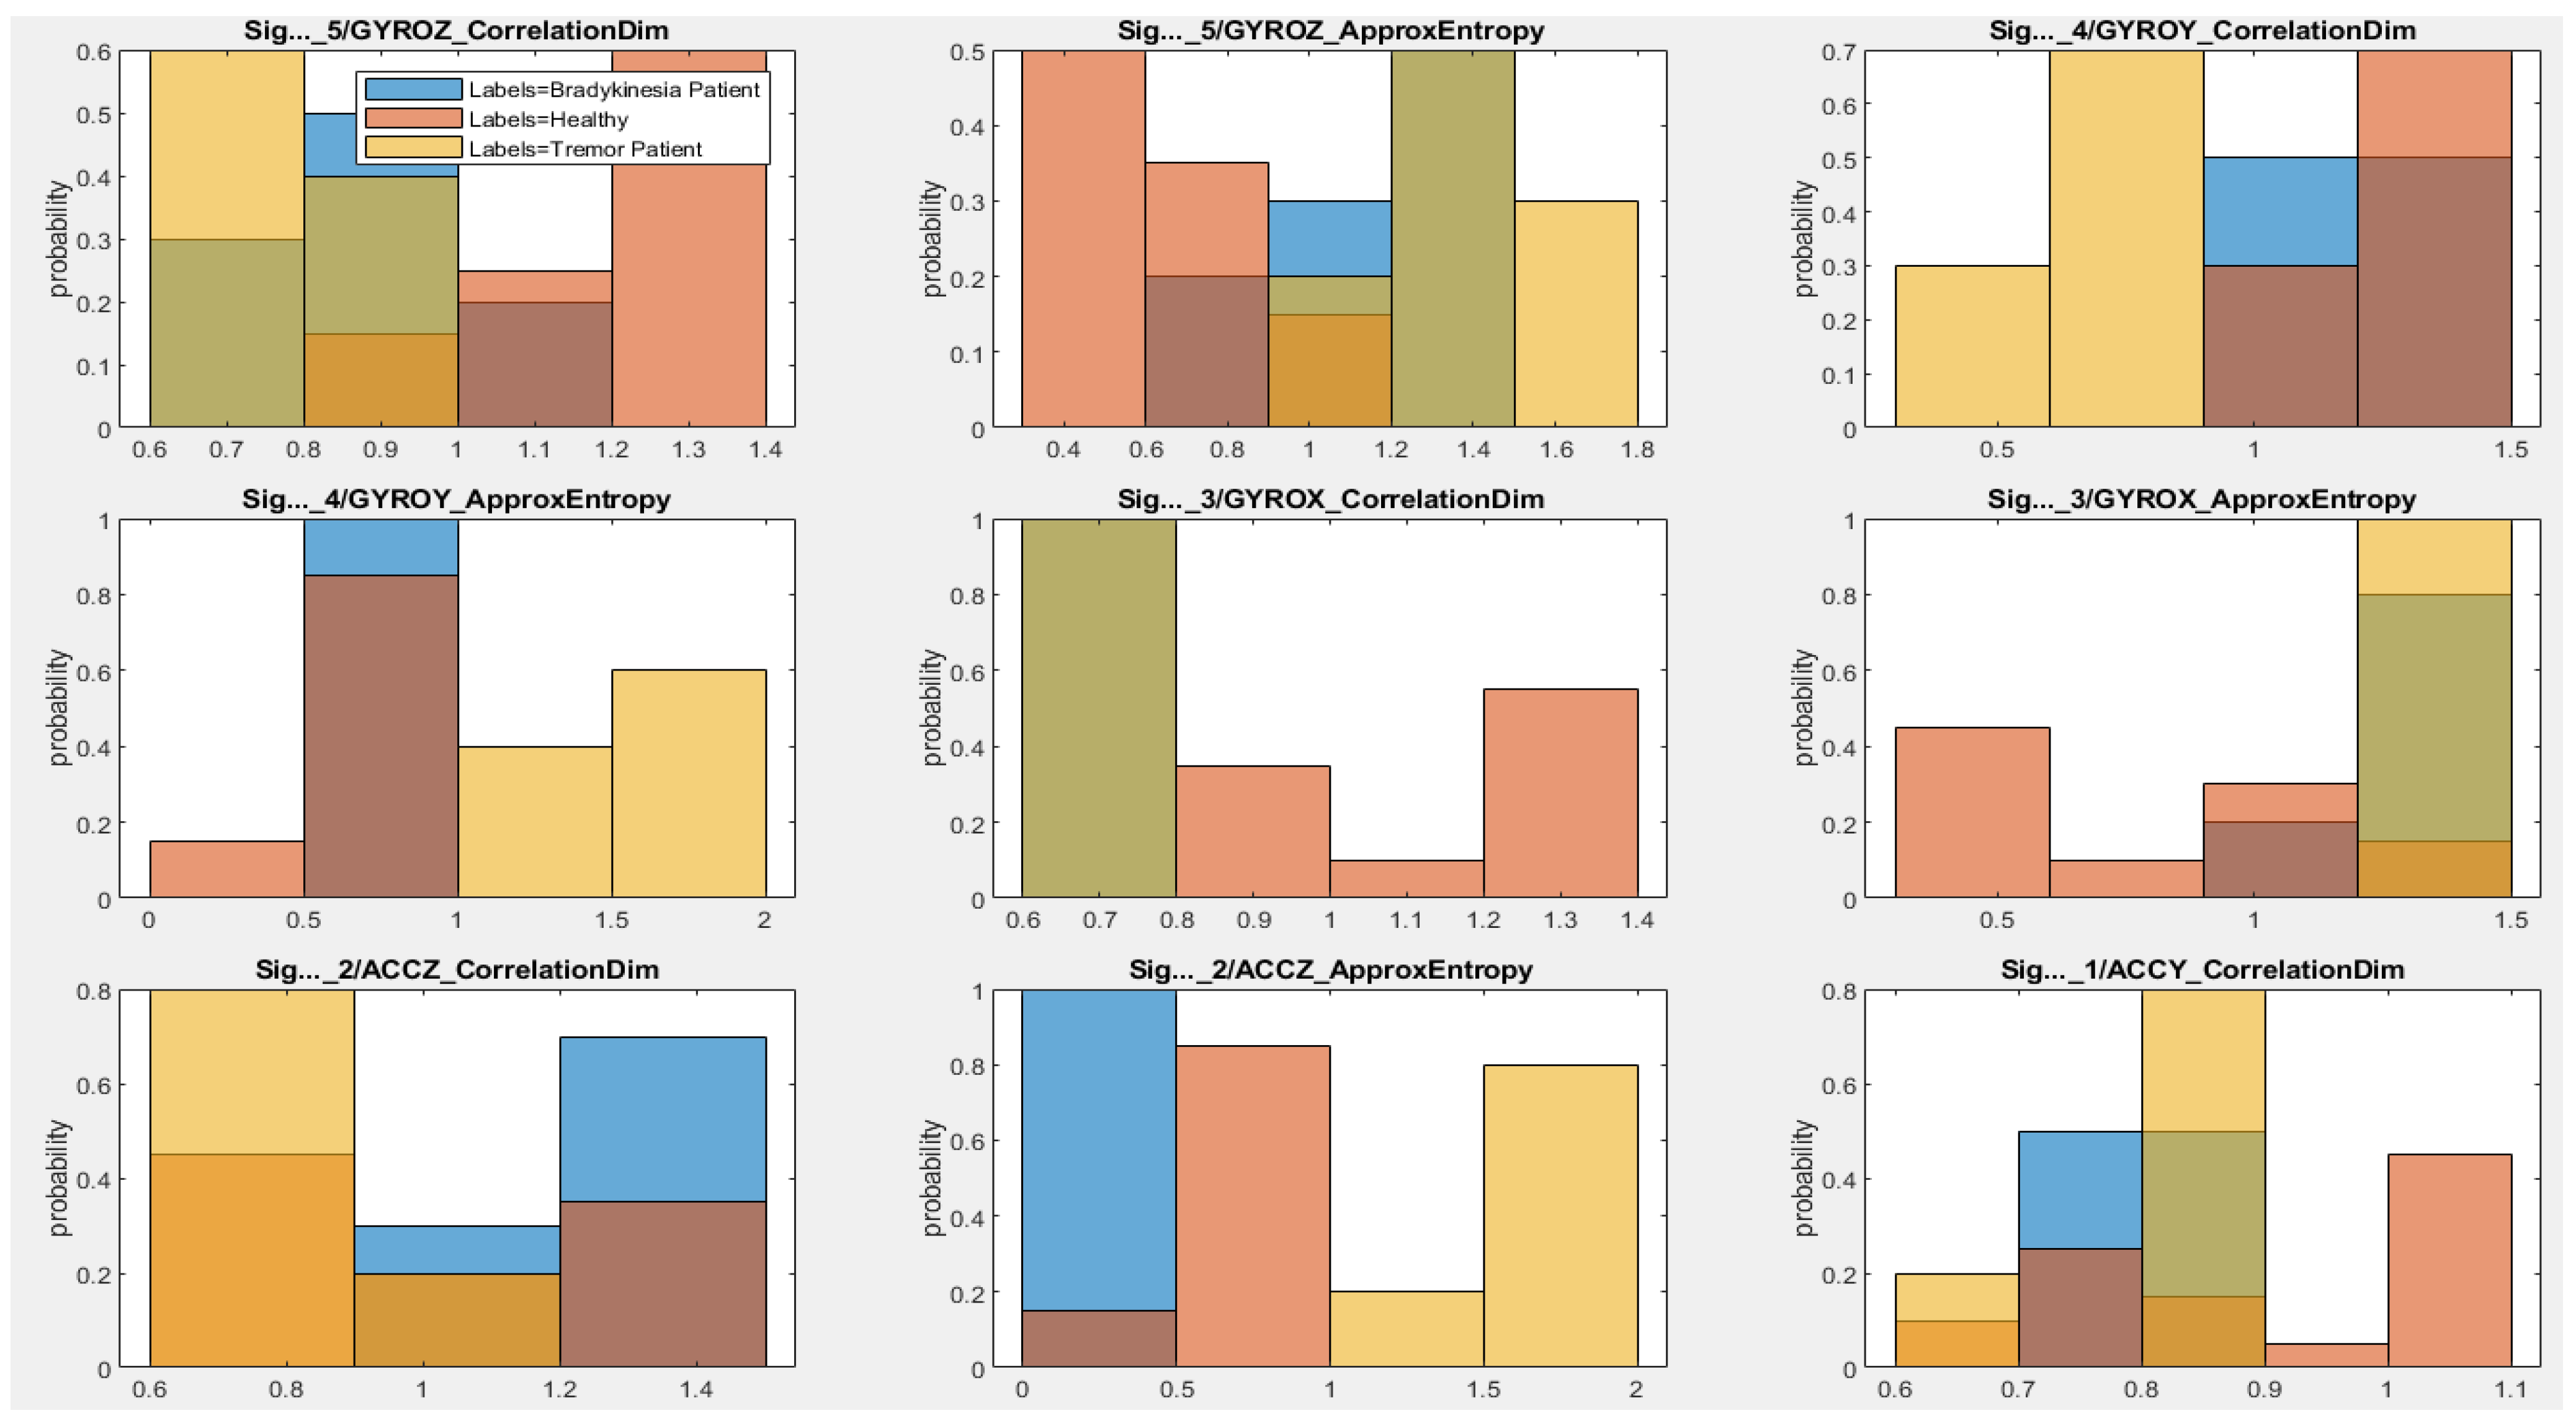
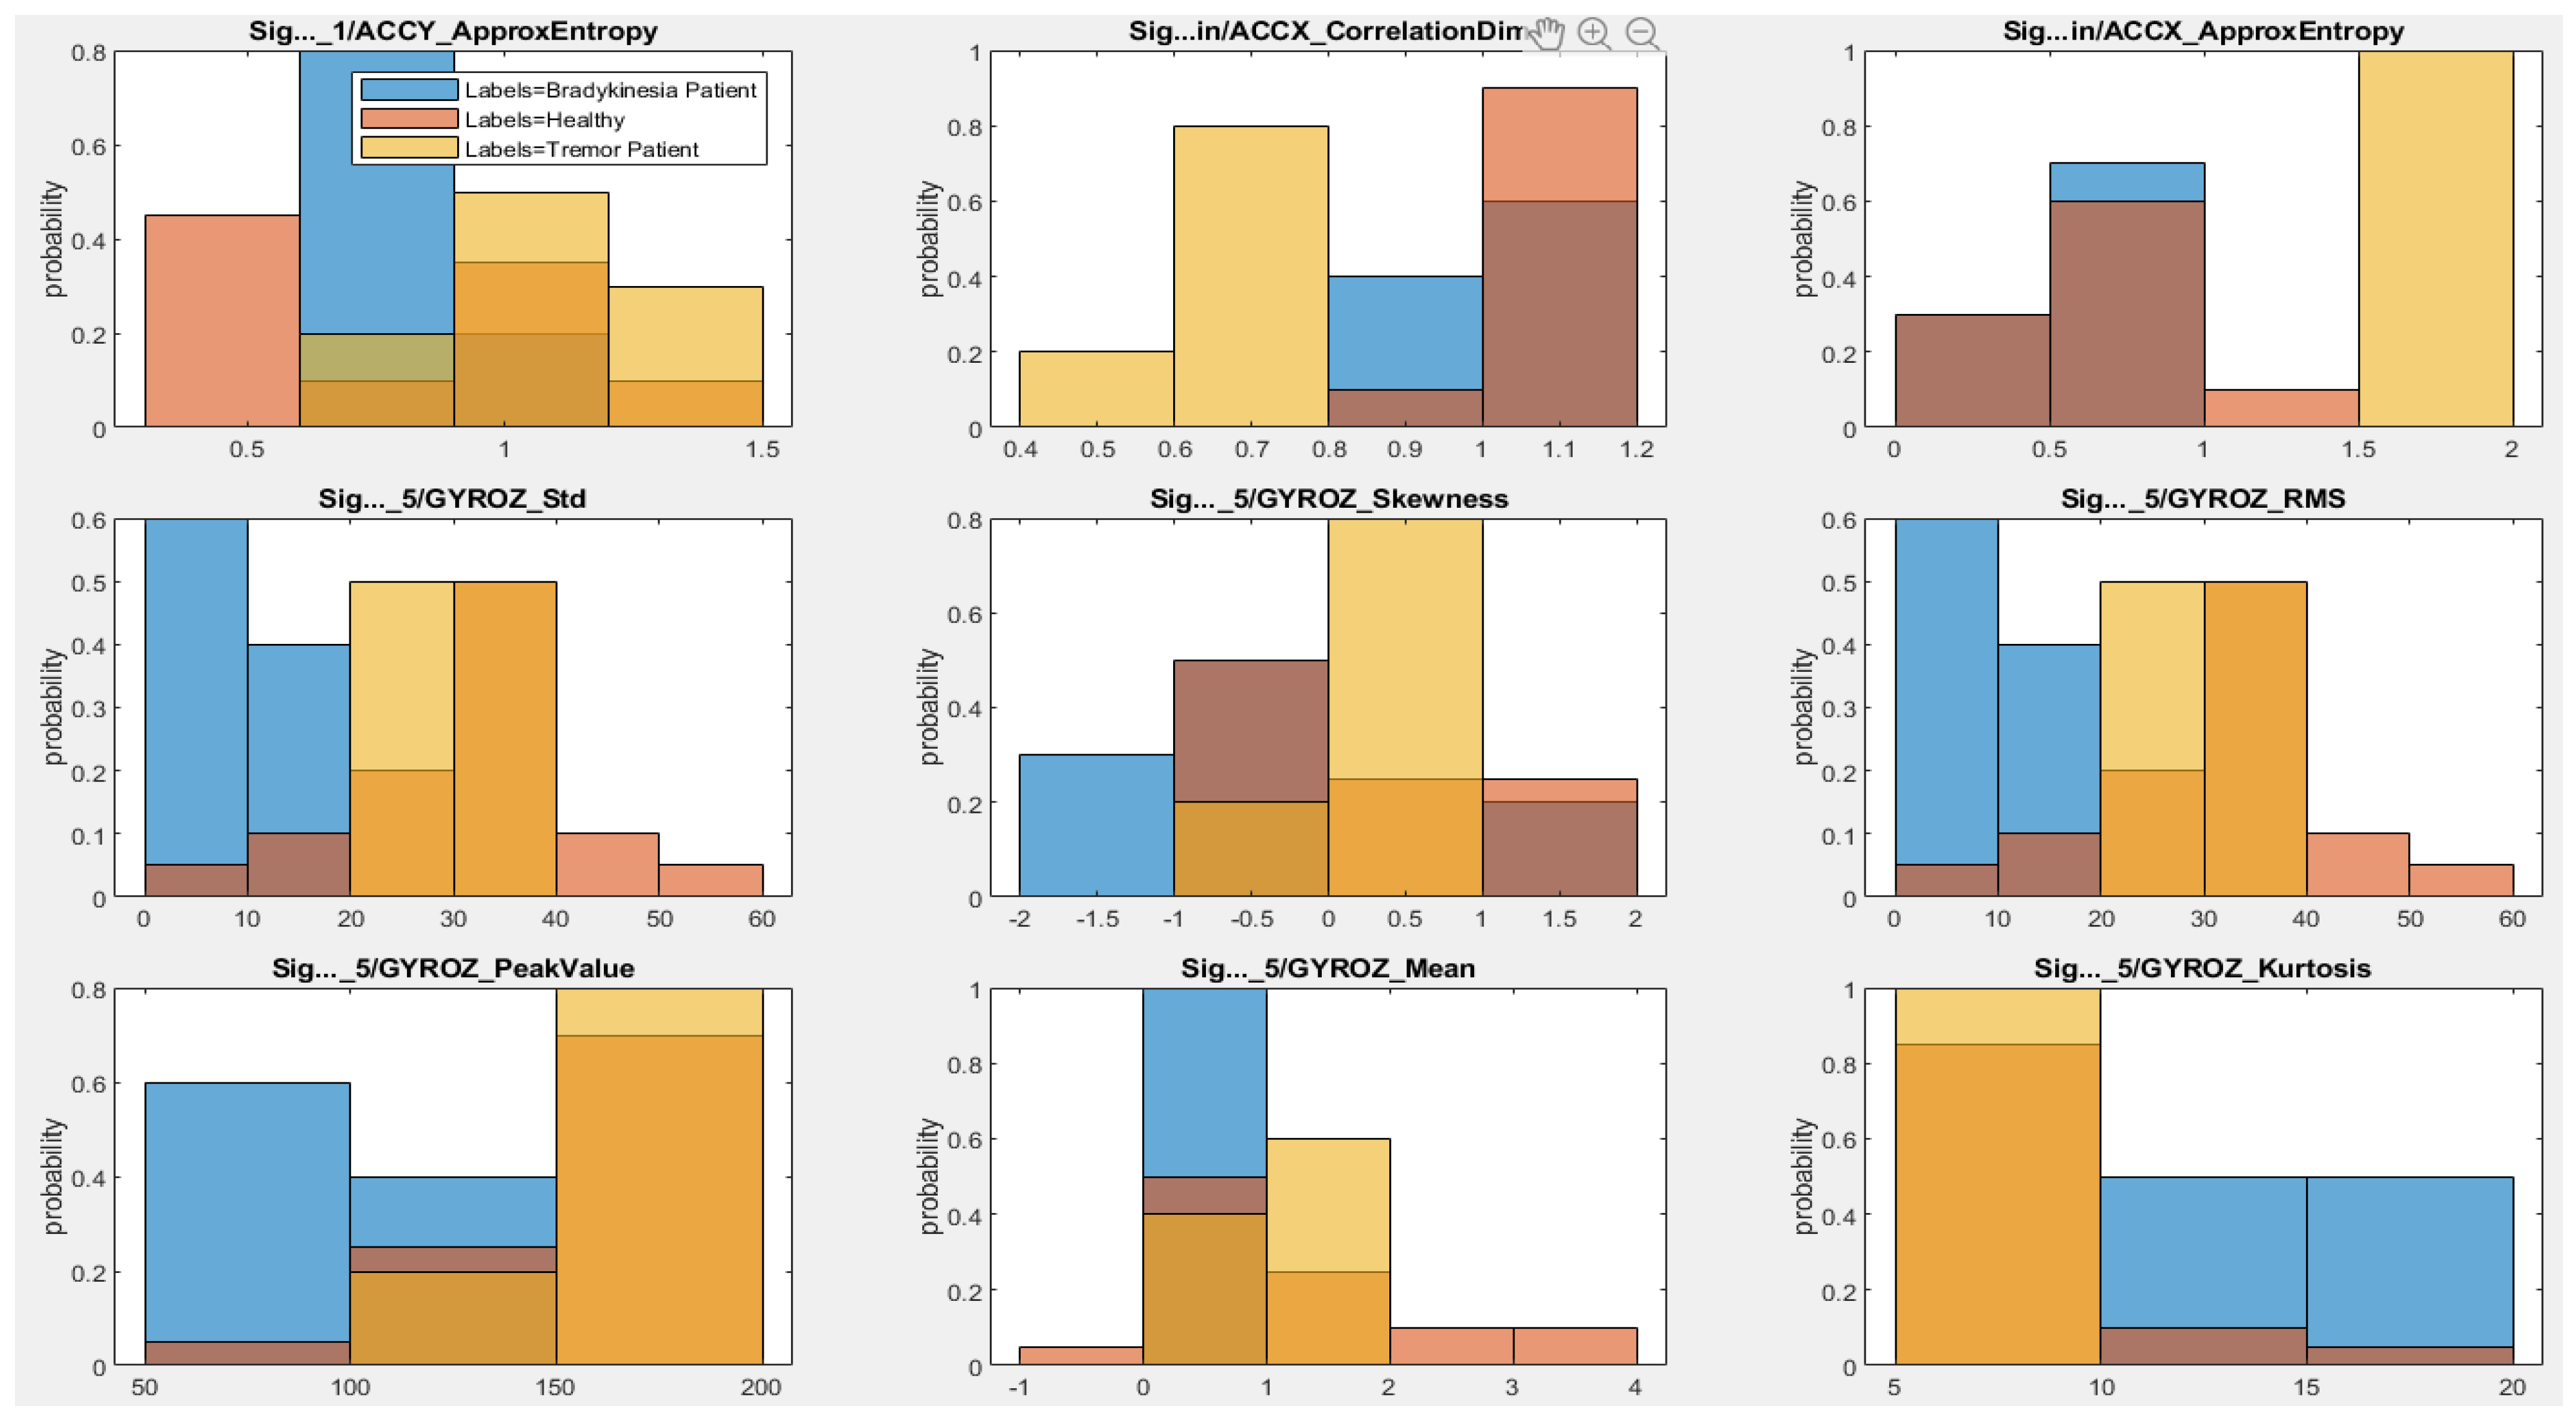
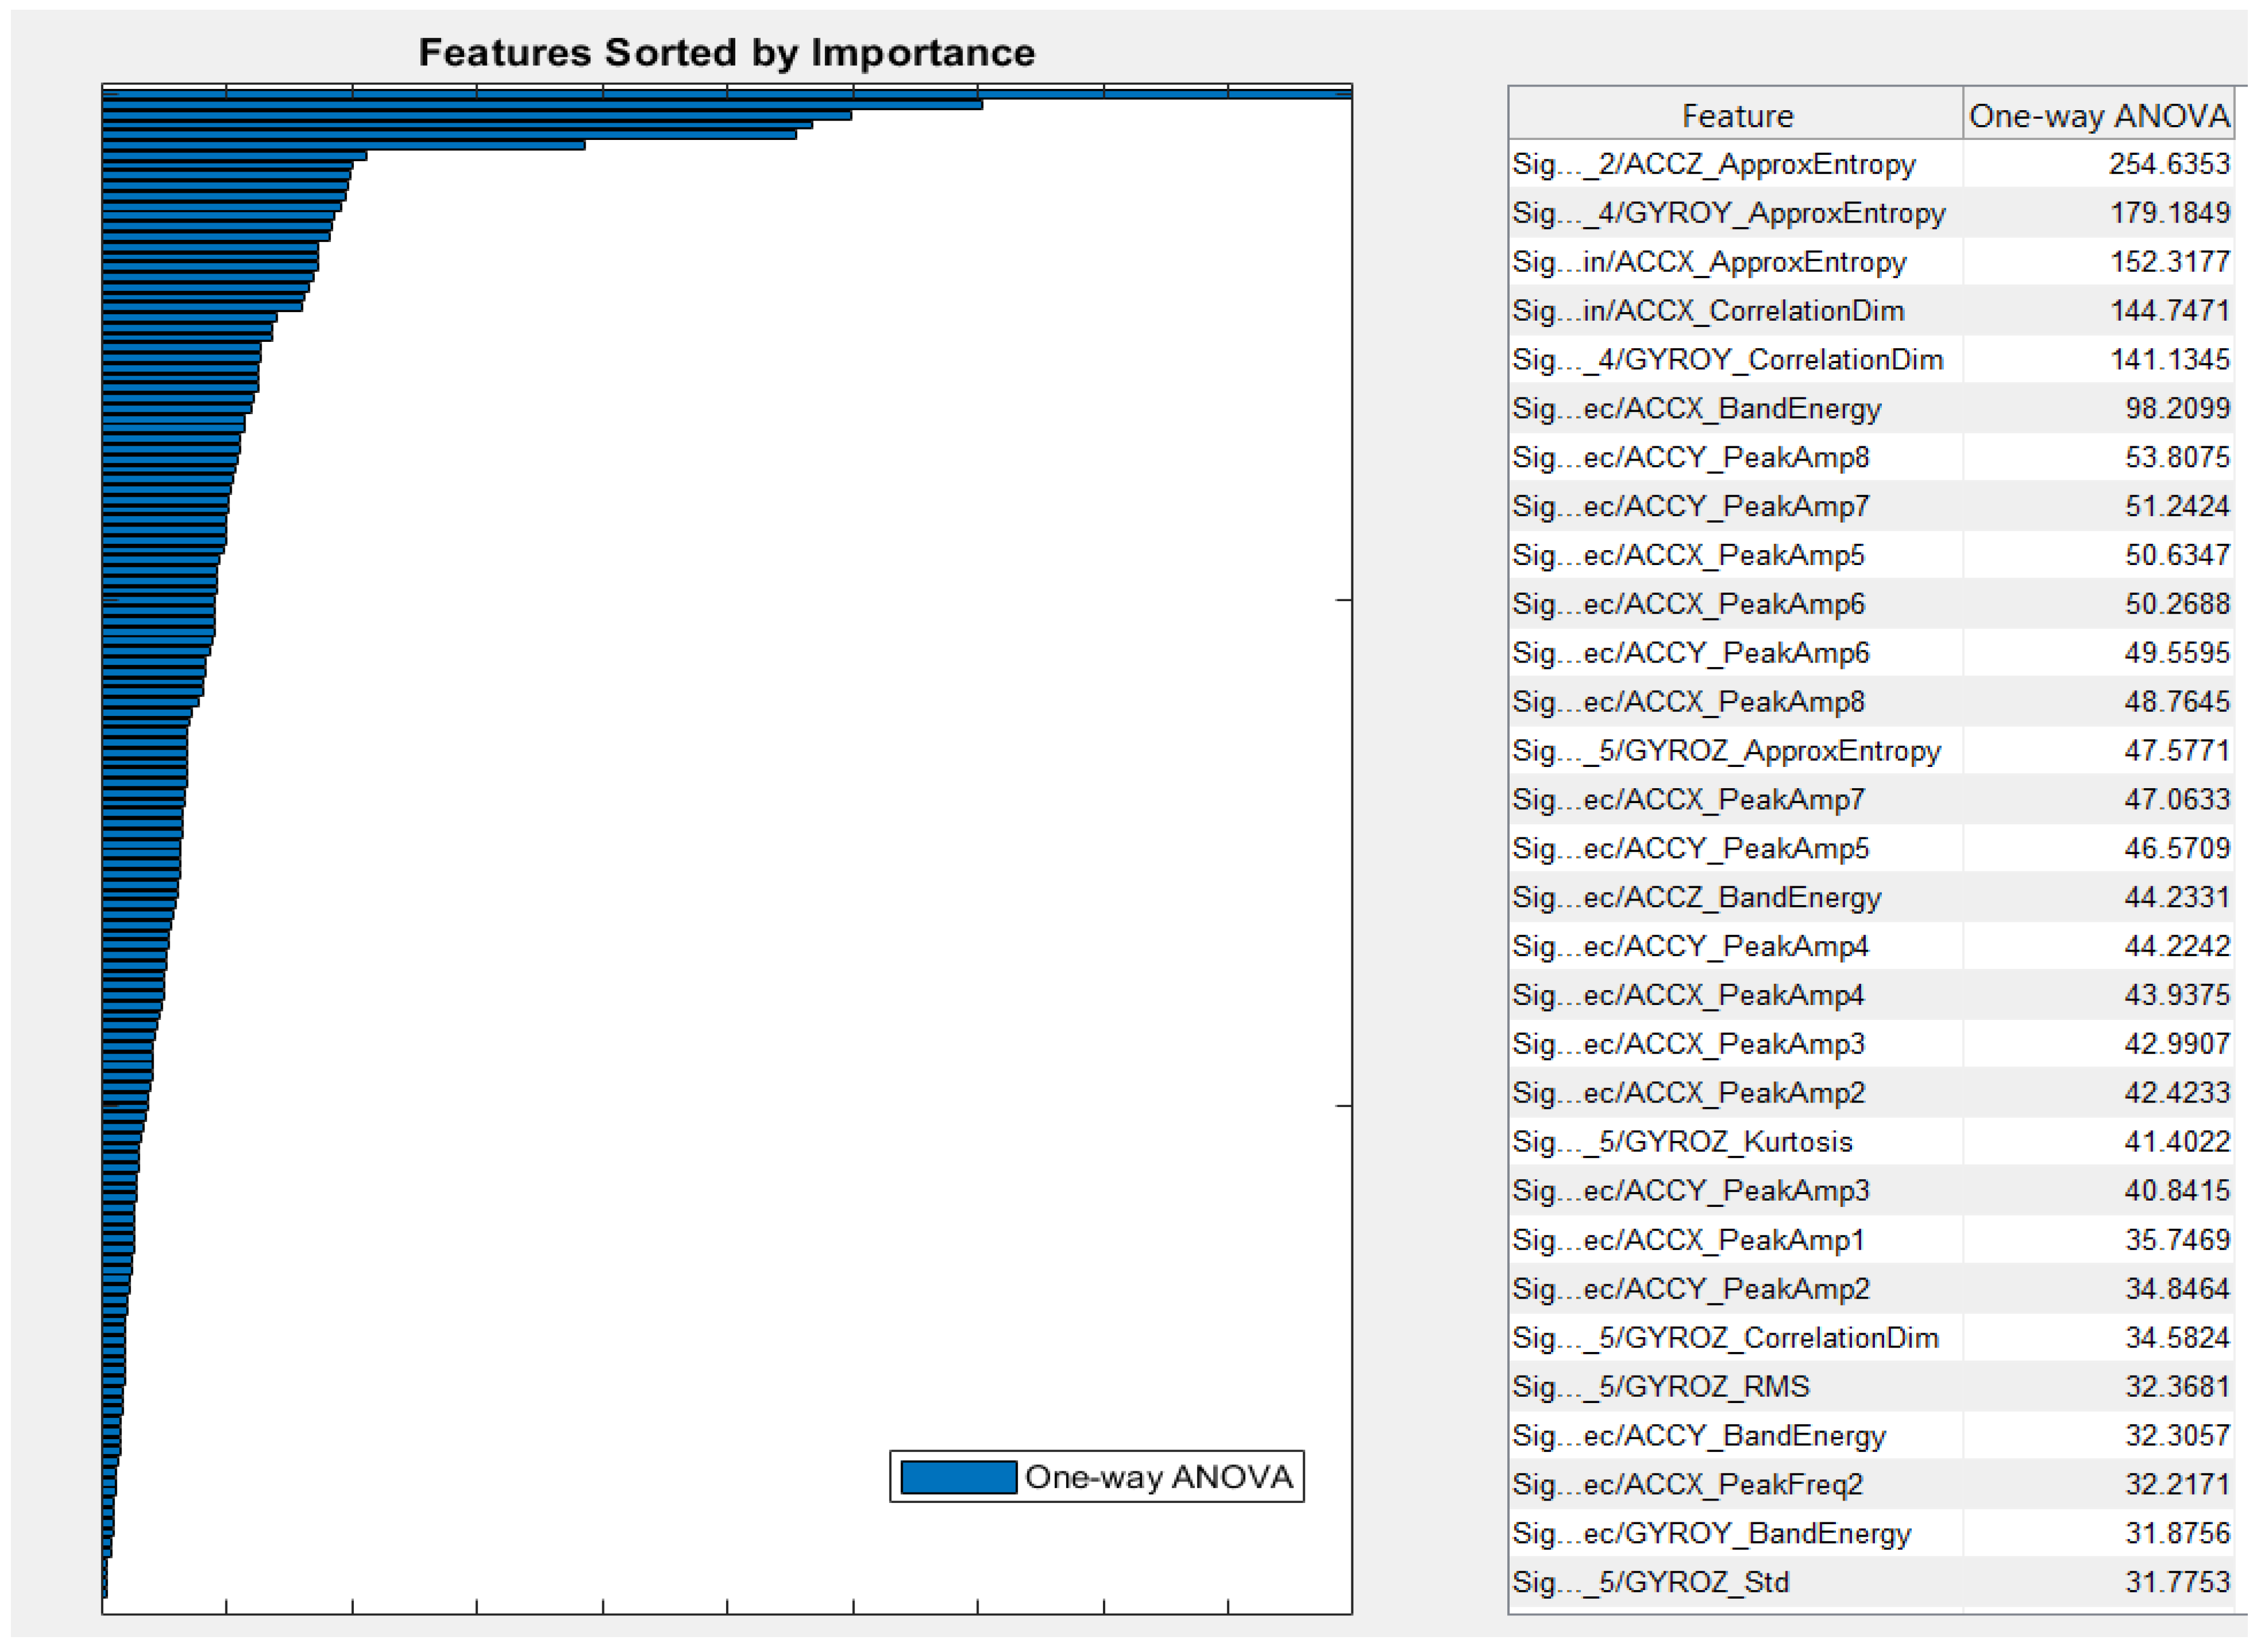
3.2. Feature Extraction and Importance
3.2.1. Time Domain Features
3.2.2. Frequency Domain Features
3.3. Classification and Performance
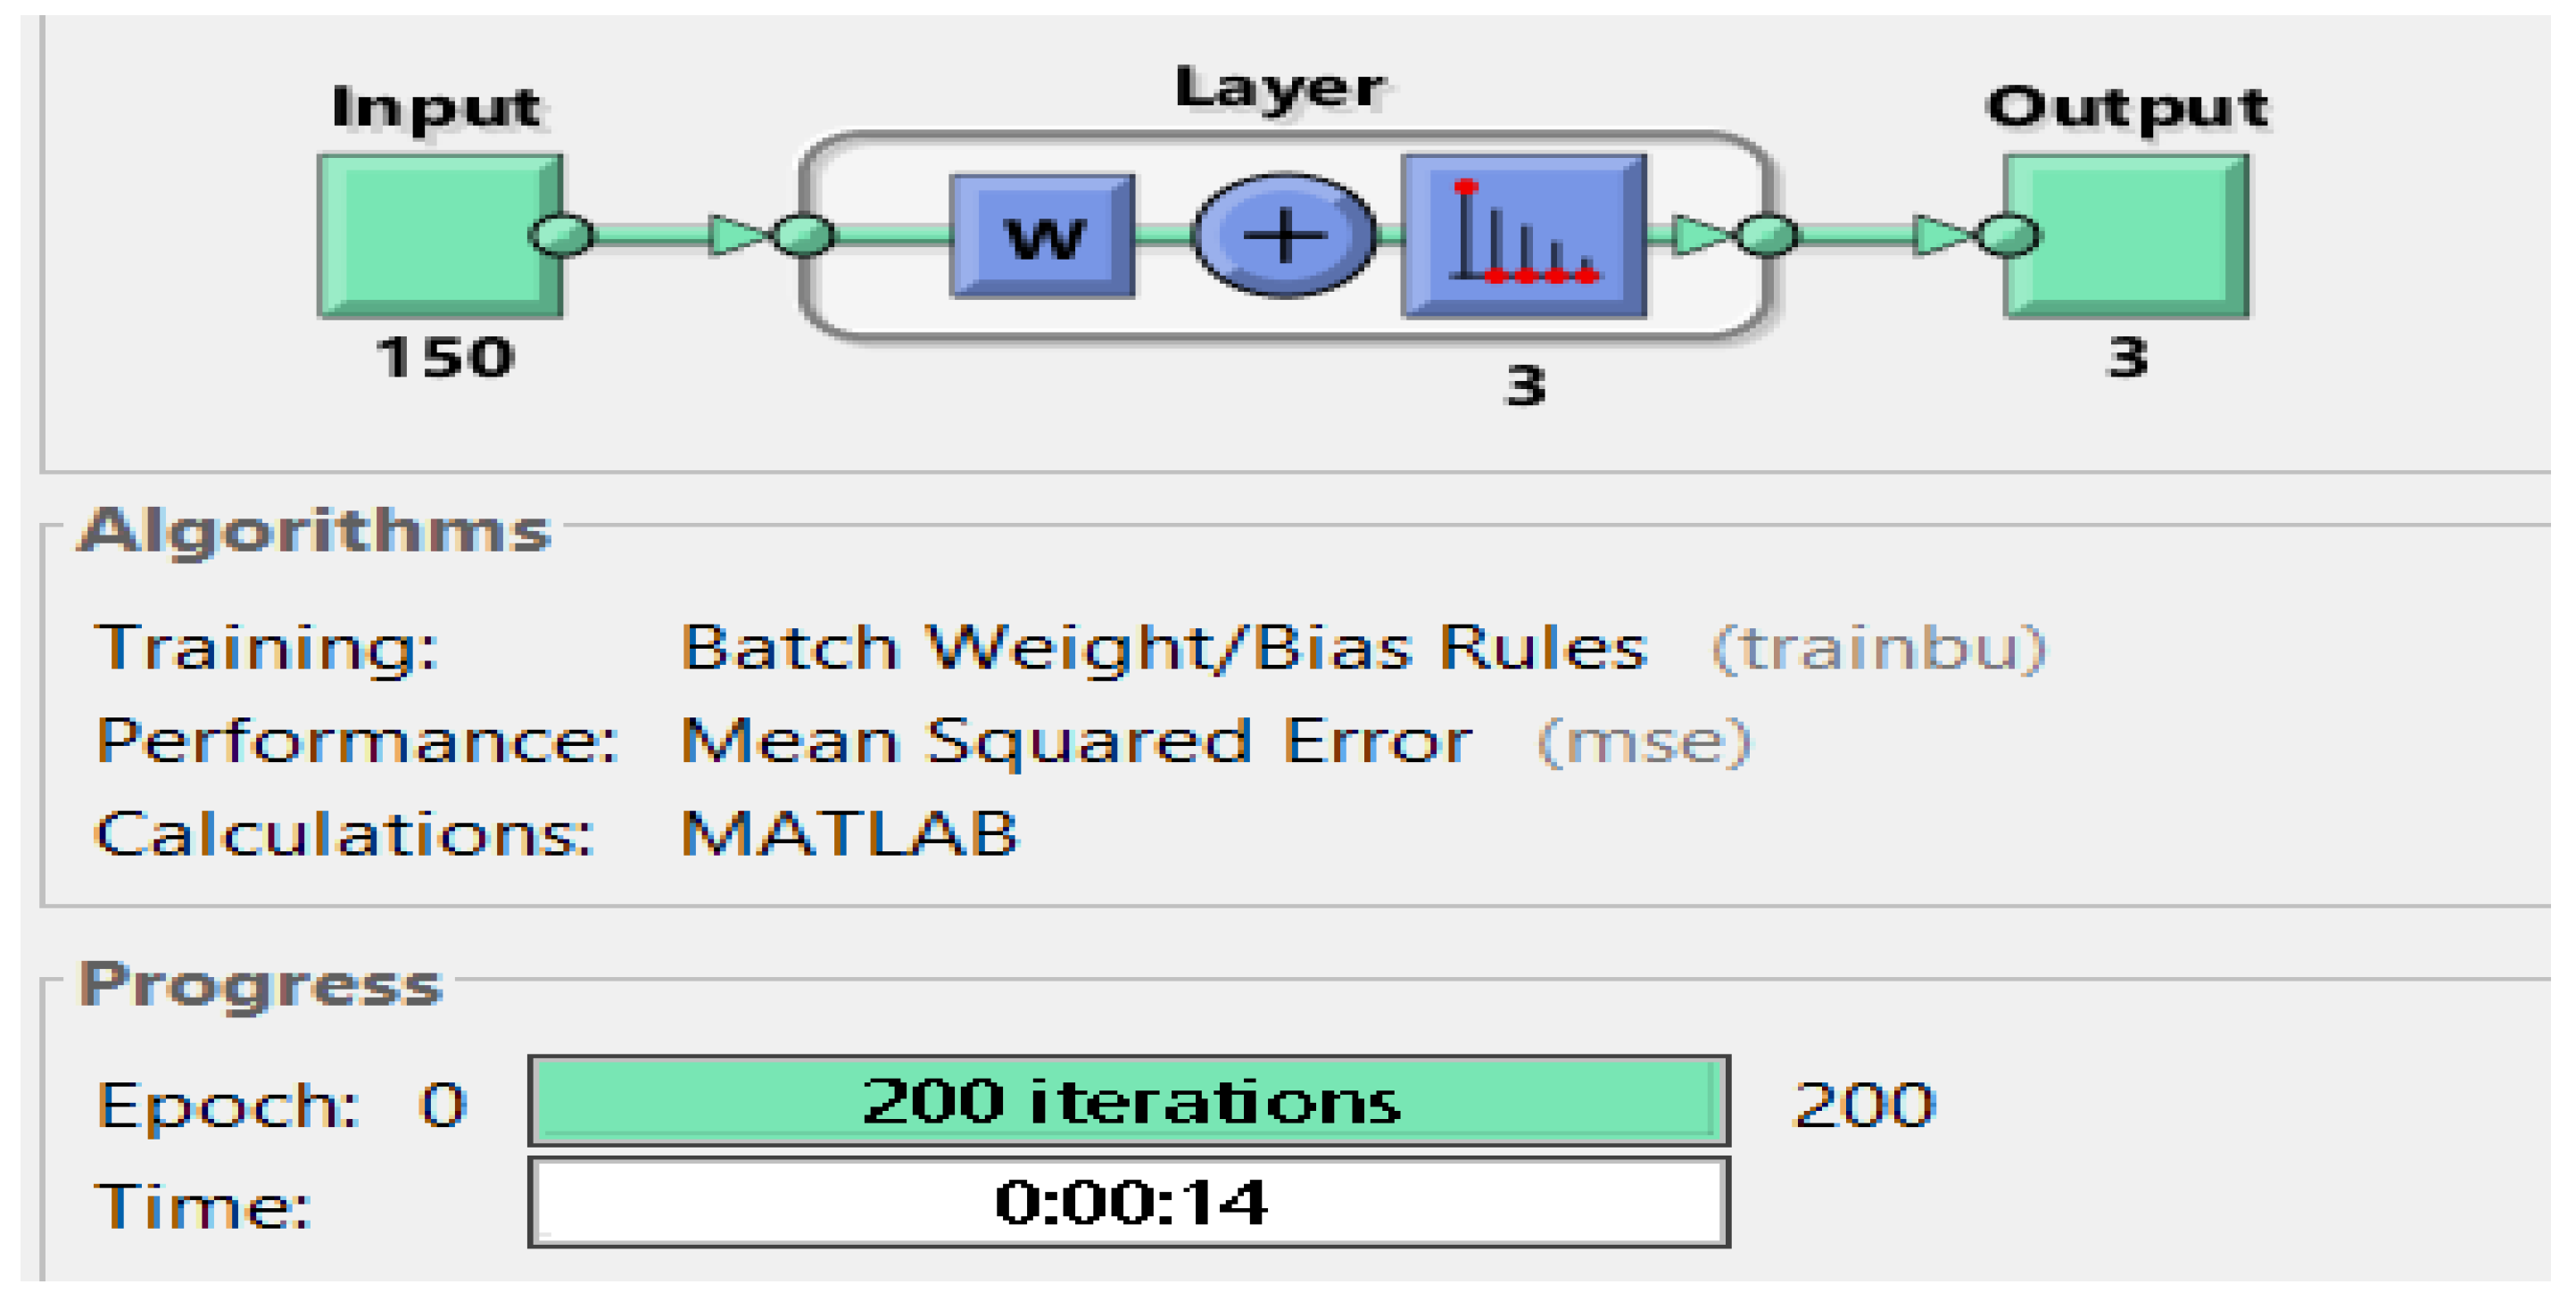
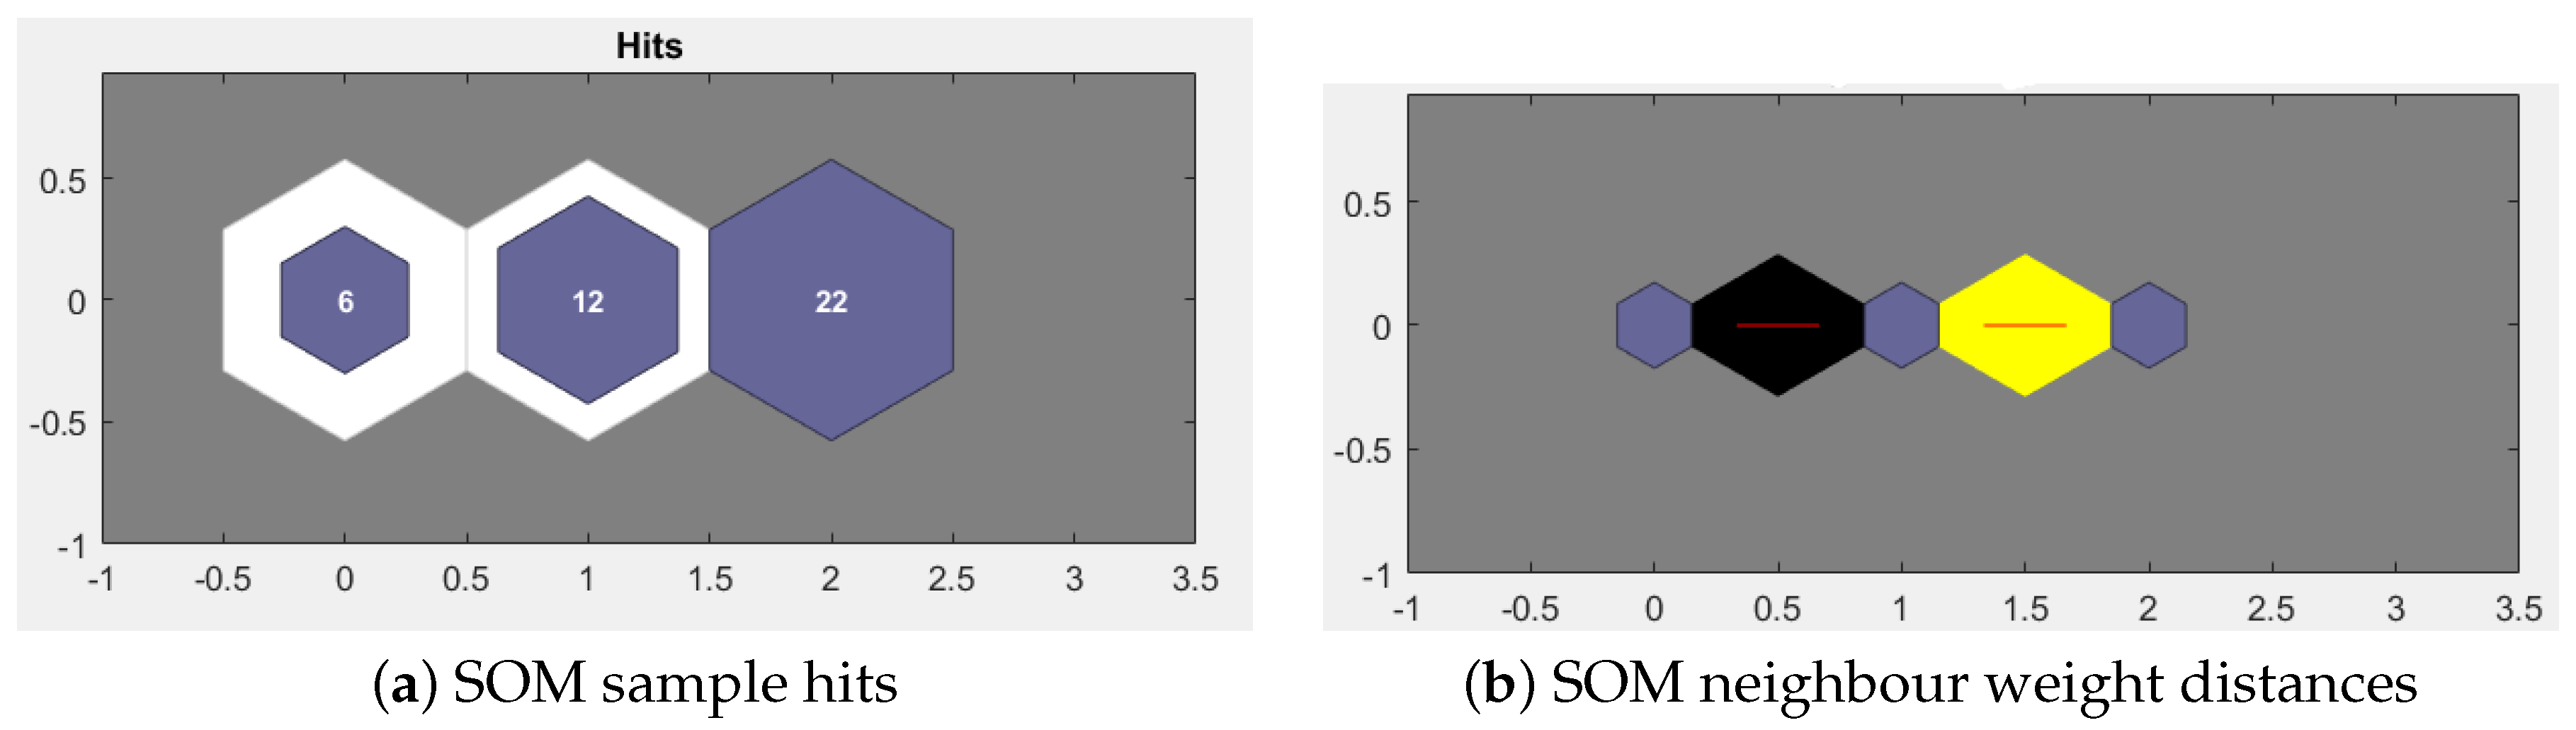
3.3.1. Using Unsupervised Method: The Neural Net Clustering Approach
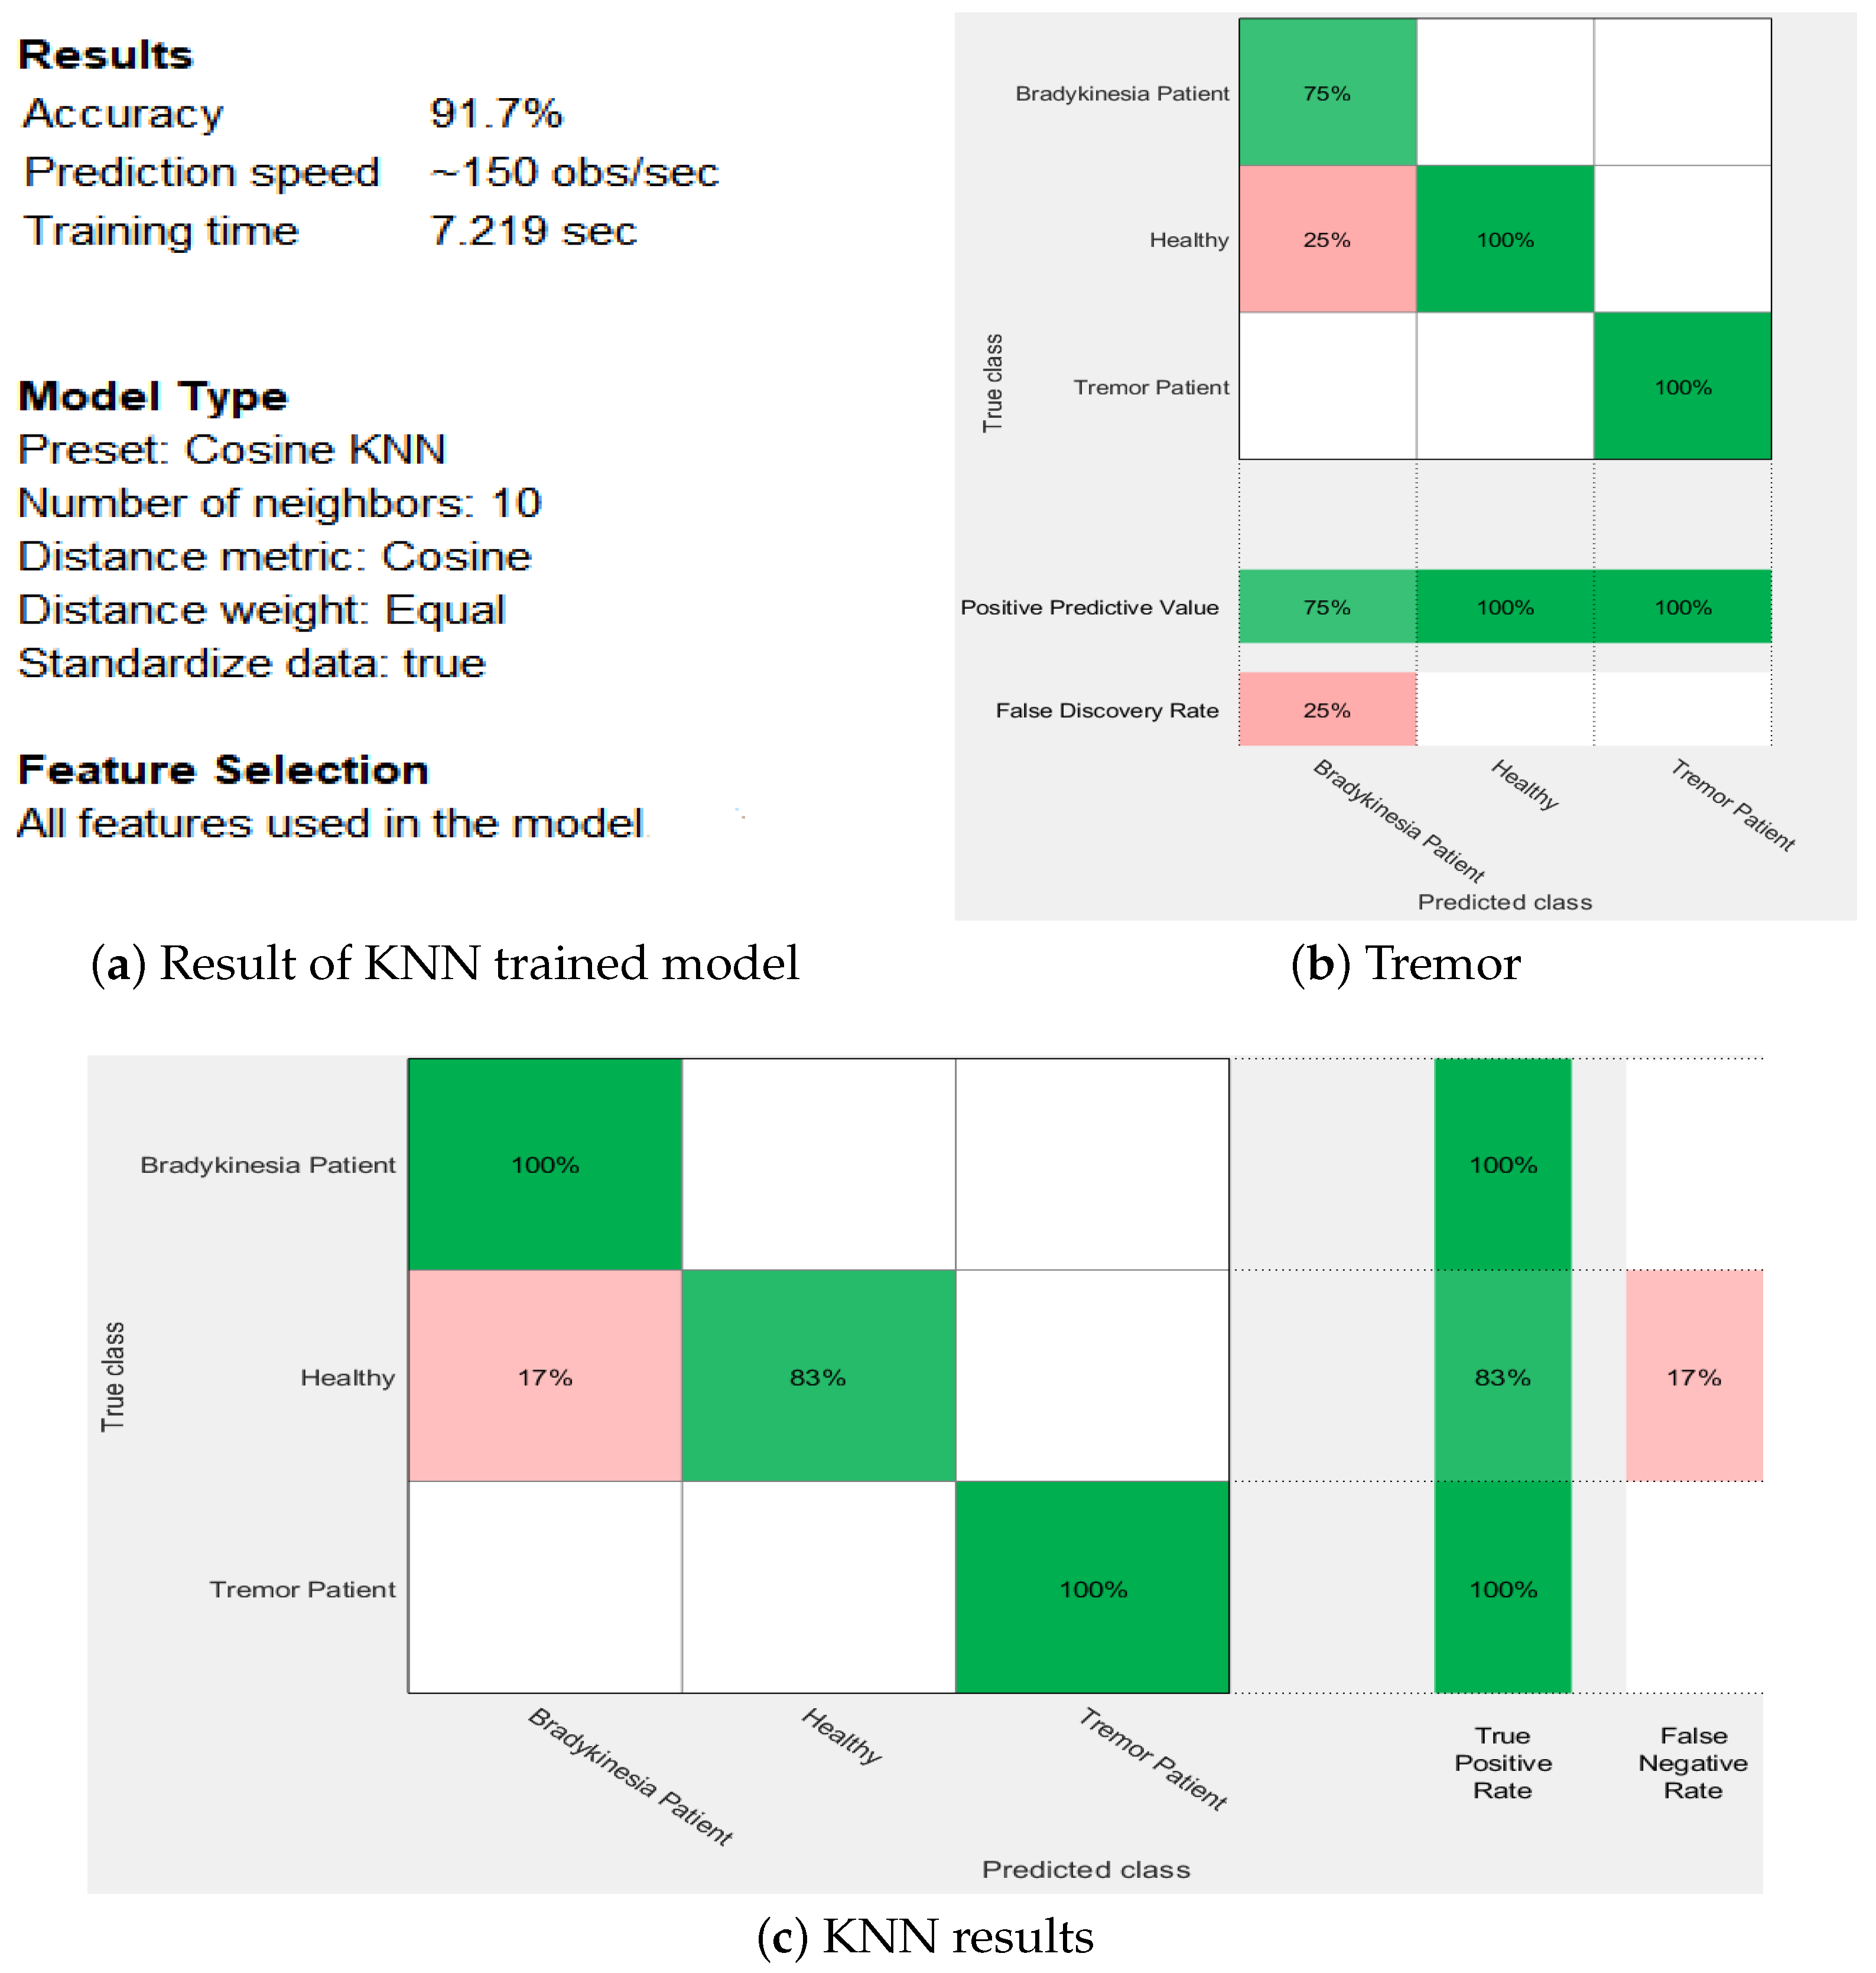
3.3.2. Using Supervised Method: The K-Nearest Neighbors (KNN) Approach
4. Results
5. Discussion
6. Conclusions and Future Directions
Author Contributions
Funding
Institutional Review Board Statement
Informed Consent Statement
Data Availability Statement
Acknowledgments
Conflicts of Interest
Abbreviations
| UPDRS | Unified Parkinson’s Disease Rating Scale |
| PD | Parkinson Disease |
| QoL | Quality of Life |
| ADL | Activities of Daily Life |
| LF | Low frequency |
| HF | High frequency |
| SVM | Support vector machine |
| HMM | Hidden markov model |
| DBS | Deep brain simulation |
| ET | Essential tremor |
| KNN | K nearest neighbours |
| PT | Postural tremor |
| KT | Kinetic tremor |
| SOM | Sample of map |
| PwPD | Patients with Parkinson Disease |
References
- Behari, M.; Srivastava, A.K.; Pandey, R. Quality of life in patients with Parkinson’s disease. Park. Relat. Disord. 2005, 11, 221–226. [Google Scholar] [CrossRef] [PubMed]
- Thorp, J.E.; Adamczyk, P.G.; Ploeg, H.L.; Pickett, K.A. Monitoring motor symptoms during activities of daily living in individuals with Parkinson’s disease. Front. Neurol. 2018, 9, 1036. [Google Scholar] [CrossRef] [PubMed] [Green Version]
- Heusinkveld, L.E.; Hacker, M.L.; Turchan, M.; Davis, T.L.; Charles, D. Impact of tremor on patients with early stage Parkinson’s disease. Front. Neurol. 2018, 9, 628. [Google Scholar] [CrossRef] [PubMed] [Green Version]
- Murphy, R.; Tubridy, N.; Kevelighan, H.; O’Riordan, S. Parkinson’s disease: How is employment affected? Irish J. Med. Sci. 2013, 182, 415–419. [Google Scholar] [CrossRef] [PubMed]
- Factor, S.A.; Weiner, W. Parkinson’s Disease: Diagnosis and Clinical Management; Demos Medical Publishing: New York, NY, USA, 2007. [Google Scholar]
- Rabelo, A.G.; Neves, L.P.; Paixao, A.P.S.; Oliveira, F.H.M.; de Souza, L.A.P.S.; Vieira, M.F.; Pereira, A.A.; Andrade, A.O. Objective assessment of bradykinesia estimated from the wrist extension in older adults and patients with Parkinson’s disease. Ann. Biomed. Eng. 2017, 45, 2614–2625. [Google Scholar] [CrossRef] [PubMed]
- Chen, W.; Hopfner, F.; Becktepe, J.S.; Deuschl, G. Rest tremor revisited: Parkinson’s disease and other disorders. Transl. Neurodegener. 2017, 6, 1–8. [Google Scholar] [CrossRef] [Green Version]
- Goetz, C.G.; Tilley, B.C.; Shaftman, S.R.; Stebbins, G.T.; Fahn, S.; Martinez-Martin, P.; Poewe, W.; Sampaio, C.; Stern, M.B.; Dodel, R.; et al. Movement Disorder Society-sponsored revision of the Unified Parkinson’s Disease Rating Scale (MDS-UPDRS): Scale presentation and clinimetric testing results. Mov. Disord. Off. J. Mov. Disord. Soc. 2008, 23, 2129–2170. [Google Scholar] [CrossRef]
- Lin, B.; Luo, W.; Luo, Z.; Wang, B.; Deng, S.; Yin, J.; Zhou, M. Bradykinesia Recognition in Parkinson’s Disease via Single RGB Video. ACM Trans. Knowl. Discov. Data 2020, 14, 1–19. [Google Scholar] [CrossRef] [Green Version]
- Chen, L.; Cai, G.; Weng, H.; Yu, J.; Yang, Y.; Huang, X.; Chen, X.; Ye, Q. More Sensitive Identification for Bradykinesia Compared to Tremors in Parkinson’s Disease Based on Parkinson’s KinetiGraph (PKG). Front. Aging Neurosci. 2020, 12, 594701. [Google Scholar] [CrossRef]
- Rissanen, S.; Kankaanpää, M.; Tarvainen, M.P.; Nuutinen, J.; Tarkka, I.M.; Airaksinen, O.; Karjalainen, P.A. Analysis of surface EMG signal morphology in Parkinson’s disease. Physiol. Meas. 2007, 28, 1507. [Google Scholar] [CrossRef]
- Meigal, A.I.; Rissanen, S.; Tarvainen, M.; Karjalainen, P.; Iudina-Vassel, I.; Airaksinen, O.; Kankaanpää, M. Novel parameters of surface EMG in patients with Parkinson’s disease and healthy young and old controls. J. Electromyogr. Kinesiol. 2009, 19, e206–e213. [Google Scholar] [CrossRef] [PubMed]
- Salarian, A.; Russmann, H.; Wider, C.; Burkhard, P.R.; Vingerhoets, F.J.; Aminian, K. Quantification of tremor and bradykinesia in Parkinson’s disease using a novel ambulatory monitoring system. IEEE Trans. Biomed. Eng. 2007, 54, 313–322. [Google Scholar] [CrossRef] [PubMed]
- Daneault, J.F.; Carignan, B.; Codère, C.É.; Sadikot, A.F.; Duval, C. Using a smart phone as a standalone platform for detection and monitoring of pathological tremors. Front. Hum. Neurosci. 2013, 6, 357. [Google Scholar] [CrossRef] [PubMed] [Green Version]
- Martinez-Manzanera, O.; Roosma, E.; Beudel, M.; Borgemeester, R.; van Laar, T.; Maurits, N.M. A method for automatic and objective scoring of bradykinesia using orientation sensors and classification algorithms. IEEE Trans. Biomed. Eng. 2015, 63, 1016–1024. [Google Scholar] [CrossRef] [Green Version]
- Sturman, M.M.; Vaillancourt, D.E.; Corcos, D.M. Effects of aging on the regularity of physiological tremor. J. Neurophysiol. 2005, 93, 3064–3074. [Google Scholar] [CrossRef] [Green Version]
- Thanawattano, C.; Pongthornseri, R.; Anan, C.; Dumnin, S.; Bhidayasiri, R. Temporal fluctuations of tremor signals from inertial sensor: A preliminary study in differentiating Parkinson’s disease from essential tremor. Biomed. Eng. Online 2015, 14, 101. [Google Scholar] [CrossRef] [Green Version]
- Kostikis, N.; Hristu-Varsakelis, D.; Arnaoutoglou, M.; Kotsavasiloglou, C. A smartphone-based tool for assessing parkinsonian hand tremor. IEEE J. Biomed. Health Inform. 2015, 19, 1835–1842. [Google Scholar] [CrossRef]
- Rissanen, S.M.; Kankaanpää, M.; Meigal, A.; Tarvainen, M.P.; Nuutinen, J.; Tarkka, I.M.; Airaksinen, O.; Karjalainen, P.A. Surface EMG and acceleration signals in Parkinson’s disease: Feature extraction and cluster analysis. Med. Biol. Eng. Comput. 2008, 46, 849–858. [Google Scholar] [CrossRef]
- Wile, D.J.; Ranawaya, R.; Kiss, Z.H. Smart watch accelerometry for analysis and diagnosis of tremor. J. Neurosci. Methods 2014, 230, 1–4. [Google Scholar] [CrossRef]
- Kostikis, N.; Hristu-Varsakelis, D.; Arnaoutoglou, M.; Kotsavasiloglou, C. Smartphone-based evaluation of parkinsonian hand tremor: Quantitative measurements vs. clinical assessment scores. In Proceedings of the 2014 36th Annual International Conference of the IEEE Engineering in Medicine and Biology Society, Chicago, IL, USA, 26–30 August 2014; pp. 906–909. [Google Scholar]
- Heida, T.; Wentink, E.C.; Marani, E. Power spectral density analysis of physiological, rest and action tremor in Parkinson’s disease patients treated with deep brain stimulation. J. Neuroeng. Rehabil. 2013, 10, 70. [Google Scholar] [CrossRef] [Green Version]
- Rigas, G.; Tzallas, A.T.; Tsipouras, M.G.; Bougia, P.; Tripoliti, E.E.; Baga, D.; Fotiadis, D.I.; Tsouli, S.G.; Konitsiotis, S. Assessment of tremor activity in the Parkinson’s disease using a set of wearable sensors. IEEE Trans. Inf. Technol. Biomed. 2012, 16, 478–487. [Google Scholar] [CrossRef] [PubMed]
- Giuffrida, J.P.; Riley, D.E.; Maddux, B.N.; Heldman, D.A. Clinically deployable Kinesia™ technology for automated tremor assessment. Mov. Disord. Off. J. Mov. Disord. Soc. 2009, 24, 723–730. [Google Scholar] [CrossRef] [PubMed]
- Pan, D.; Dhall, R.; Lieberman, A.; Petitti, D.B. A mobile cloud-based Parkinson’s disease assessment system for home-based monitoring. JMIR Mhealth Uhealth 2015, 3, e29. [Google Scholar] [CrossRef] [PubMed]
- Dai, H.; Zhang, P.; Lueth, T.C. Quantitative assessment of parkinsonian tremor based on an inertial measurement unit. Sensors 2015, 15, 25055–25071. [Google Scholar] [CrossRef] [Green Version]
- Cole, B.T.; Roy, S.H.; De Luca, C.J.; Nawab, S.H. Dynamical learning and tracking of tremor and dyskinesia from wearable sensors. IEEE Trans. Neural Syst. Rehabil. Eng. 2014, 22, 982–991. [Google Scholar] [CrossRef]
- Hoff, J.I.; Wagemans, E.A.; van Hilten, B.J. Ambulatory objective assessment of tremor in Parkinson’s disease. Clin. Neuropharmacol. 2001, 24, 280–283. [Google Scholar] [CrossRef]
- Roy, S.H.; Cole, B.T.; Gilmore, L.D.; De Luca, C.J.; Nawab, S.H. Resolving signal complexities for ambulatory monitoring of motor function in Parkinson’s disease. In Proceedings of the 2011 Annual International Conference of the IEEE Engineering in Medicine and Biology Society, Boston, MA, USA, 30 August–3 September 2011; pp. 4836–4839. [Google Scholar]
- Cole, B.T.; Roy, S.H.; De Luca, C.J.; Nawab, S.H. Dynamic neural network detection of tremor and dyskinesia from wearable sensor data. In Proceedings of the 2010 Annual International Conference of the IEEE Engineering in Medicine and Biology, Buenos Aires, Argentina, 31 August–4 September 2010; pp. 6062–6065. [Google Scholar]
- Meigal, A.Y.; Rissanen, S.; Tarvainen, M.; Georgiadis, S.; Karjalainen, P.; Airaksinen, O.; Kankaanpää, M. Linear and nonlinear tremor acceleration characteristics in patients with Parkinson’s disease. Physiol. Meas. 2012, 33, 395. [Google Scholar] [CrossRef]
- López-Blanco, R.; Velasco, M.A.; Méndez-Guerrero, A.; Romero, J.P.; Del Castillo, M.D.; Serrano, J.I.; Rocon, E.; Benito-León, J. Smartwatch for the analysis of rest tremor in patients with Parkinson’s disease. J. Neurol. Sci. 2019, 401, 37–42. [Google Scholar] [CrossRef]
- Rovini, E.; Maremmani, C.; Cavallo, F. A Wearable System to Objectify Assessment of Motor Tasks for Supporting Parkinson’s Disease Diagnosis. Sensors 2020, 20, 2630. [Google Scholar] [CrossRef]
- Giuberti, M.; Ferrari, G.; Contin, L.; Cimolin, V.; Azzaro, C.; Albani, G.; Mauro, A. Automatic UPDRS evaluation in the sit-to-stand task of Parkinsonians: Kinematic analysis and comparative outlook on the leg agility task. IEEE J. Biomed. Health Inform. 2015, 19, 803–814. [Google Scholar] [CrossRef]
- Parisi, F.; Ferrari, G.; Giuberti, M.; Contin, L.; Cimolin, V.; Azzaro, C.; Albani, G.; Mauro, A. Body-sensor-network-based kinematic characterization and comparative outlook of UPDRS scoring in leg agility, sit-to-stand, and Gait tasks in Parkinson’s disease. IEEE J. Biomed. Health Inform. 2015, 19, 1777–1793. [Google Scholar] [CrossRef] [PubMed]
- Parisi, F.; Ferrari, G.; Giuberti, M.; Contin, L.; Cimolin, V.; Azzaro, C.; Albani, G.; Mauro, A. Inertial BSN-based characterization and automatic UPDRS evaluation of the gait task of Parkinsonians. IEEE Trans. Affect. Comput. 2016, 7, 258–271. [Google Scholar] [CrossRef]
- Samà, A.; Pérez-López, C.; Rodríguez-Martín, D.; Català, A.; Moreno-Aróstegui, J.M.; Cabestany, J.; de Mingo, E.; Rodríguez-Molinero, A. Estimating bradykinesia severity in Parkinson’s disease by analysing gait through a waist-worn sensor. Comput. Biol. Med. 2017, 84, 114–123. [Google Scholar] [CrossRef] [PubMed]
- Dunnewold, R.J.; Hoff, J.I.; van Pelt, H.C.; Fredrikze, P.Q.; Wagemans, E.A.; van Hilten, B.J. Ambulatory quantitative assessment of body position, bradykinesia, and hypokinesia in Parkinson’s disease. J. Clin. Neurophysiol. 1998, 15, 235–242. [Google Scholar] [CrossRef] [PubMed]
- Klapper, D.A.; Weaver, J.; Fernandez, H.; Ohno-Machado, L. Classification of movement states in Parkinson’s disease using a wearable ambulatory monitor. In Proceedings of the AMIA Annual Symposium Proceedings, Washington, DC, USA, 8–12 November 2003; American Medical Informatics Association: Bethesda, MD, USA, 2003; Volume 2003, p. 896. [Google Scholar]
- Patel, S.; Lorincz, K.; Hughes, R.; Huggins, N.; Growdon, J.H.; Welsh, M.; Bonato, P. Analysis of feature space for monitoring persons with Parkinson’s disease with application to a wireless wearable sensor system. In Proceedings of the 2007 29th Annual International Conference of the IEEE Engineering in Medicine and Biology Society, Lyon, France, 22–26 August 2007; pp. 6290–6293. [Google Scholar]
- Kempster, P.A.; Hurwitz, B.; Lees, A.J. A new look at James Parkinson’s Essay on the Shaking Palsy. Neurology 2007, 69, 482–485. [Google Scholar] [CrossRef]
- Stanford Medicine 25. (n.d.). Parkinson’s Disease Exam. Available online: https://stanfordmedicine25.stanford.edu/the25/parkinsondisease.html (accessed on 27 January 2021).
- Grimaldi, G.; Manto, M. Neurological tremor: Sensors, signal processing and emerging applications. Sensors 2010, 10, 1399–1422. [Google Scholar] [CrossRef]
- Findley, L.J.; Koller, W.C. Handbook of Tremor Disorders; Informa Health Care: London, UK, 1994; Volume 30. [Google Scholar]
- Butt, A.H.; Rovini, E.; Esposito, D.; Rossi, G.; Maremmani, C.; Cavallo, F. Biomechanical parameter assessment for classification of Parkinson’s disease on clinical scale. Int. J. Distrib. Sens. Netw. 2017, 13, 1550147717707417. [Google Scholar] [CrossRef] [Green Version]
- Hosseinpour, N. Implementation of the Kinect Sensor and Leap Motion for Distance Study of Motor Skills in Parkinson’s Disease. Master’s Thesis, Department of Signal and Systems Chalmers University of Technology Sweden, Gothenburg, Sweden, 2016. [Google Scholar]
- Hssayeni, M.D. Automatic assessment of medication states of patients with Parkinson’s disease using wearable sensors. In Proceedings of the 2016 38th Annual International Conference of the IEEE Engineering in Medicine and Biology Society (EMBC), Orlando, FL, USA, 16–20 August 2016. [Google Scholar]
- Rovini, E.; Maremmani, C.; Cavallo, F. How wearable sensors can support Parkinson’s disease diagnosis and treatment: A systematic review. Front. Neurosci. 2017, 11, 555. [Google Scholar] [CrossRef]
- Johnson, M.J. Detection of Parkinson Disease Rest Tremor; Washington University in St Louis: St. Louis, MO, USA, 2014. [Google Scholar]


| Key Features | Parkinsonian Tremor | Dystonia Tremor | Essential Tremor |
|---|---|---|---|
| Frequency | 4–6 Hz | 7 Hz | 4–8 Hz |
| Amplitude | Regular | Irregular | Regular |
| Symmetry | Asymmetrical | Asymmetrical | Symmetrical |
| Topography | Hands > other | Head > hands > others | Hands > head > voice > others |
| Potential accompanying sign | Bradykinesia, rigidity | Dystonic posture | Impaired tandem gait |
| Suppression of tremor during movement onset | In most cases | Rare | Not found |
| Activation condition | Rest > postural/kinetic | Postural > kinetic > rest | Postural > kinetic > rest |
| Sensory tricks | No | Yes | No |
| Handwriting | Micrographia | Macrographia | Large angulated loops |
| Decreased arm swing | Yes | May be in dystonic limb | No |
| Study [Ref] | Technology Description | Location | Subjects | Algorithms | Metrics | Activity | Main Results |
|---|---|---|---|---|---|---|---|
| [17] | IMU unit. Six-axis inertial sensor on index finger of tremor dominant hand | Hospital | 35 PD patients and 22 ET | Autoregression process using Yule-walker method and t-tests. | Power spectrum of subsequences, peak frequency | 3 tasks each of 10 s, i.e., kinetic, postural and resting tasks | Temporal fluctuation of resting task can differentiate between PD and ET |
| [22] | 4 inertial sensors taped on hands, feet and around the waist | Clinical | 7 PD patients | Wilcoxon’s two-tailed rank sum test, bonferroni correction and spearman’s rank correlation coefficient testing | Angular velocity and power spectral density | Two tests. Rest tremor, while sitting at rest patient was reading a text aloud for 45 s. For action tremor a tapping movement performed for 30 s | Application of DBS come forth in a redistribution of power in the tremor and LF band |
| [23] | Sensors at 6 different positions of subject’s body i.e., right and left wrists (RW and LW), right and left legs (RL and LL), waist and chest | Clinical | 18 PD patients and 5 HS | Hidden Markov’s model | Angle between two sensors and LF energy. For tremor severity classification: spectrum entropy, LF and HF energy, ratio of high to total energy and energy from other body segments | DLA’s | (1) Quantifies tremor severity with 87% accuracy (2) Discriminates tremor from other PD symptoms. |
| [26] | IMU | Hospital | 7 PD patients | Least square estimation models | Amplitude of parkinsonian tremor and dominant frequency of parkinsonian tremor | 3 tasks. Rest tremor (RT), postural tremor (PT) and action kinetic tremor assessment (KT). Each last for 10 s. | Measured amplitude correlated well with judgement of neurologists (r = 0.98) |
| [24] | Kinesia affixed finger worn sensors and wrist worn command module | Clinical | 60 PD patients | Multiple linear regression model | Peak power frequency of peak power, RMS of angular velocity and RMS of angle | RT assessed for 30 s when participant remain settle with his hands still in lap, PT for 20 s with arms stretched out infront and KT while participant frequently enlarged his arm and touched his nose for 15 s | Quantitative kinematic features are processed and highly correlated to clinicians scores |
| [28] | Part 1: 3 uni-axial accelerometers on one wrist. In part 2: same as of part 1 also 2 pairs of uni-axial accelerometers (at stemum and upper dominant leg) | Part 1 in lab and part 2 in home | Part 1: 7 patients, part 2: 59 patients and 43 HS | Part 1: FTFT, detect tremor if longer than minimal duration (1.5 s) of dominant frequency with limited BW. Part 2: same as P1 also determine standing vs. sitting based on gravitational vector | Part 1 measured amplitude, dominant frequency duration and BW. Part 2: same as P1 also measured duration of posture of tremor and mean amplitude | In part 1 seated postures recorded at rest and while performing motor activities. In part 2 measured for 24 h while keeping diary | Part 1: Tremor vs. no tremor compared to specialists: SENS > 82%; SPEC > 93%. Part 2: Duration of tremor moderately correlated with UPDRS score for resting tremor ( = 0.66 standing, 0.77 sitting) Intensity of tremor correlated with resting tremor ( = 0.70 standing, 0.75 sitting) |
| [30] | Part 1: 3 uni-axial gyroscopes near wrist and part 2: two uni-axial gyroscopes near wrist | Hospital | 7 PD patients | IIR filter with 3 s windows and autoregression model. Tremor detected if frequency lies between 3.5 and 7.5 Hz and amplitude >0.92. Tremor amplitude estimated from RMS angular velocity | Dominant pole frequency and amplitude | 45 min of 17 ADL while videotaped (DBS on and DBS off). In second part 3–5 h moving freely | Tremor vs. no tremor compared: SENS = 99.5%, SPEC = 94.2%. Estimated tremor amplitude from roll axis showed high correlation (r = 0.87) to the UPDRS tremor subscore. |
| [19] | For EMG, electrodes at belly and ME6000-biosignal monitoring system is used. Tri-axial accelerometers attached to palmar sides of subjects wrists | Hospital | 42 patients and 59 HS | K-means algorithm | Kurtosis variable of EMG (K), crossing rate variable of EMG (CR), correlation dimension and recurrence rate of EMG, sample entropy of acceleration (SampEn), coherence variable of EMG and acceleration (Coh) | Subjects asked to hold their elbows at 90° angle for 10–30 s | According to clustering results one cluster contained 90% HC and two other clusters 76% of patients |
| [21] | Data from gyroscope and accelerometer | Clinical | 23 PD patients | To analyze correlation pearson correlation is used | Acceleration vector and rotation rate vector | Wearing iphone on top of hand while sitting on chair and resting both hands on lap atleast for 30 s. Repeated for both hands | Strong correlation (x > 0.7 and p < 0.01) between patients UPDRS score and signal metrics applied to measure signal |
| Study [Ref] | Technology Description | Location | Subjects | Algorithms | Metrics | Activity | Main Results |
|---|---|---|---|---|---|---|---|
| [38] | Pairs of uni-axial accelerometers on sternum, upper leg, and wrist | Hospital | NA | Discriminant analysis to determine thresholds, Multiple regression analysis for objective measures and UPDRS scores | Bradykinesia: magnitude of acceleration for arm and leg; Hypokinesia: MIP (period with acceleration below a threshold) for hand and trunk | 24-h continuous recording | Bradykinesia: mean arm and leg accelerations showed inverse relation with UPDRS (R2 = 0.1, R2 = 0.45) |
| [39] | Tri-axial accelerometers near the wrists, ankles and hip | Main room for a day program of PD | 2 PD patients | Classification trees and neural networks | Absolute value of derivative of magnitude of acceleration, position and magnitude correlation between sensors | 2 subjects recorded for about 320 min each while videotaped | Bradykinesia/ hypokinesia vs. no bradykinesia/ hypokinesia compared to neurologist: Neural network with c-index of 88.0–92.1% Classification tree with accuracies of 74.8–85.3% |
| [40] | Tri-axial accelerometers on upper arms, forearms, supper thighs, and shins | Lab | 12 PD patients | Clustering evaluation index to select features and linear discriminant classifier to predict performance of features | Intensity (RMS), auto-covariance, dominant frequency, correlation features, and entropy | Standardized clinical motor tasks (alternating hand movements, finger to nose, and heel tapping) while videotaped | Best features: approximate entropy and intensity (RMS of acceleration) Optimal window length 6 s |
| [15] | 9 DoF sensor (3 accelerometers, 3 gyroscopes and 3 magnetic sensors). On the dorsal side of the index finger, dorsal side of the forearm close to the wrist and on the in step of the foot over the shoe of the participant. | Clinical | 25 PD patients and 10 HS | SVM | Mean, amplitude and mean frequency | finger tapping, diadochokinesis and toe tapping | The classification errors for finger tapping, diadochokinesis and toe tapping were 15–16.5%, 9.3–9.8% and 18.2–20.2% smaller than the average inter-rater scoring error |
| Healthy Control | Patient with PD | |||
|---|---|---|---|---|
| Age (Gender) | Age (Gender) | UPDRS (0–56) | H & Y (1–5) | Disease Duration (Years) |
| 75(F) | 62(F) | 23 | 1.5 | 7 |
| 64(M) | 66(F) | 5 | 1.5 | 6 |
| 75(M) | 72(F) | 9 | 2 | 6 |
| 80(F) | 73(F) | 26 | 2 | 20 |
| 83(M) | 78(M) | 5 | 1 | 13 |
| 65(M) | 65(M) | 27 | 1 | 14 |
| 65(M) | 79(F) | 23 | 1 | 5 |
| 61(M) | 69(F) | 15 | 2 | 3 |
| 63(M) | 80(M) | 25 | 2 | 8 |
| 70(M) | 81(M) | 18 | 1.5 | 4 |
| 70(F) | 60(F) | 20 | 2 | 11 |
| 76(M) | 80(F) | 26 | 2 | 10 |
| 67(M) | 65(F) | 7 | 1 | 1 |
| 66(F) | 75(M) | 30 | 1 | 2 |
| 62(M) | 72(F) | 18 | 1 | 7 |
| 66(M) | 63(F) | 22 | 1.5 | 3 |
| 74(M) | 66(F) | 15 | 1.5 | 9 |
| 71(M) | 83(F) | 15 | 2.5 | 10 |
| 72(M) | 75(F) | 32 | 2.5 | 5 |
| 80(M) | 69(F) | 30 | 2.5 | 10 |
| 70.25(±6.307) | 71.65(±6.872) | 18.91(±7.831) | 1.65(±0.526) | 7.7(±4.495) |
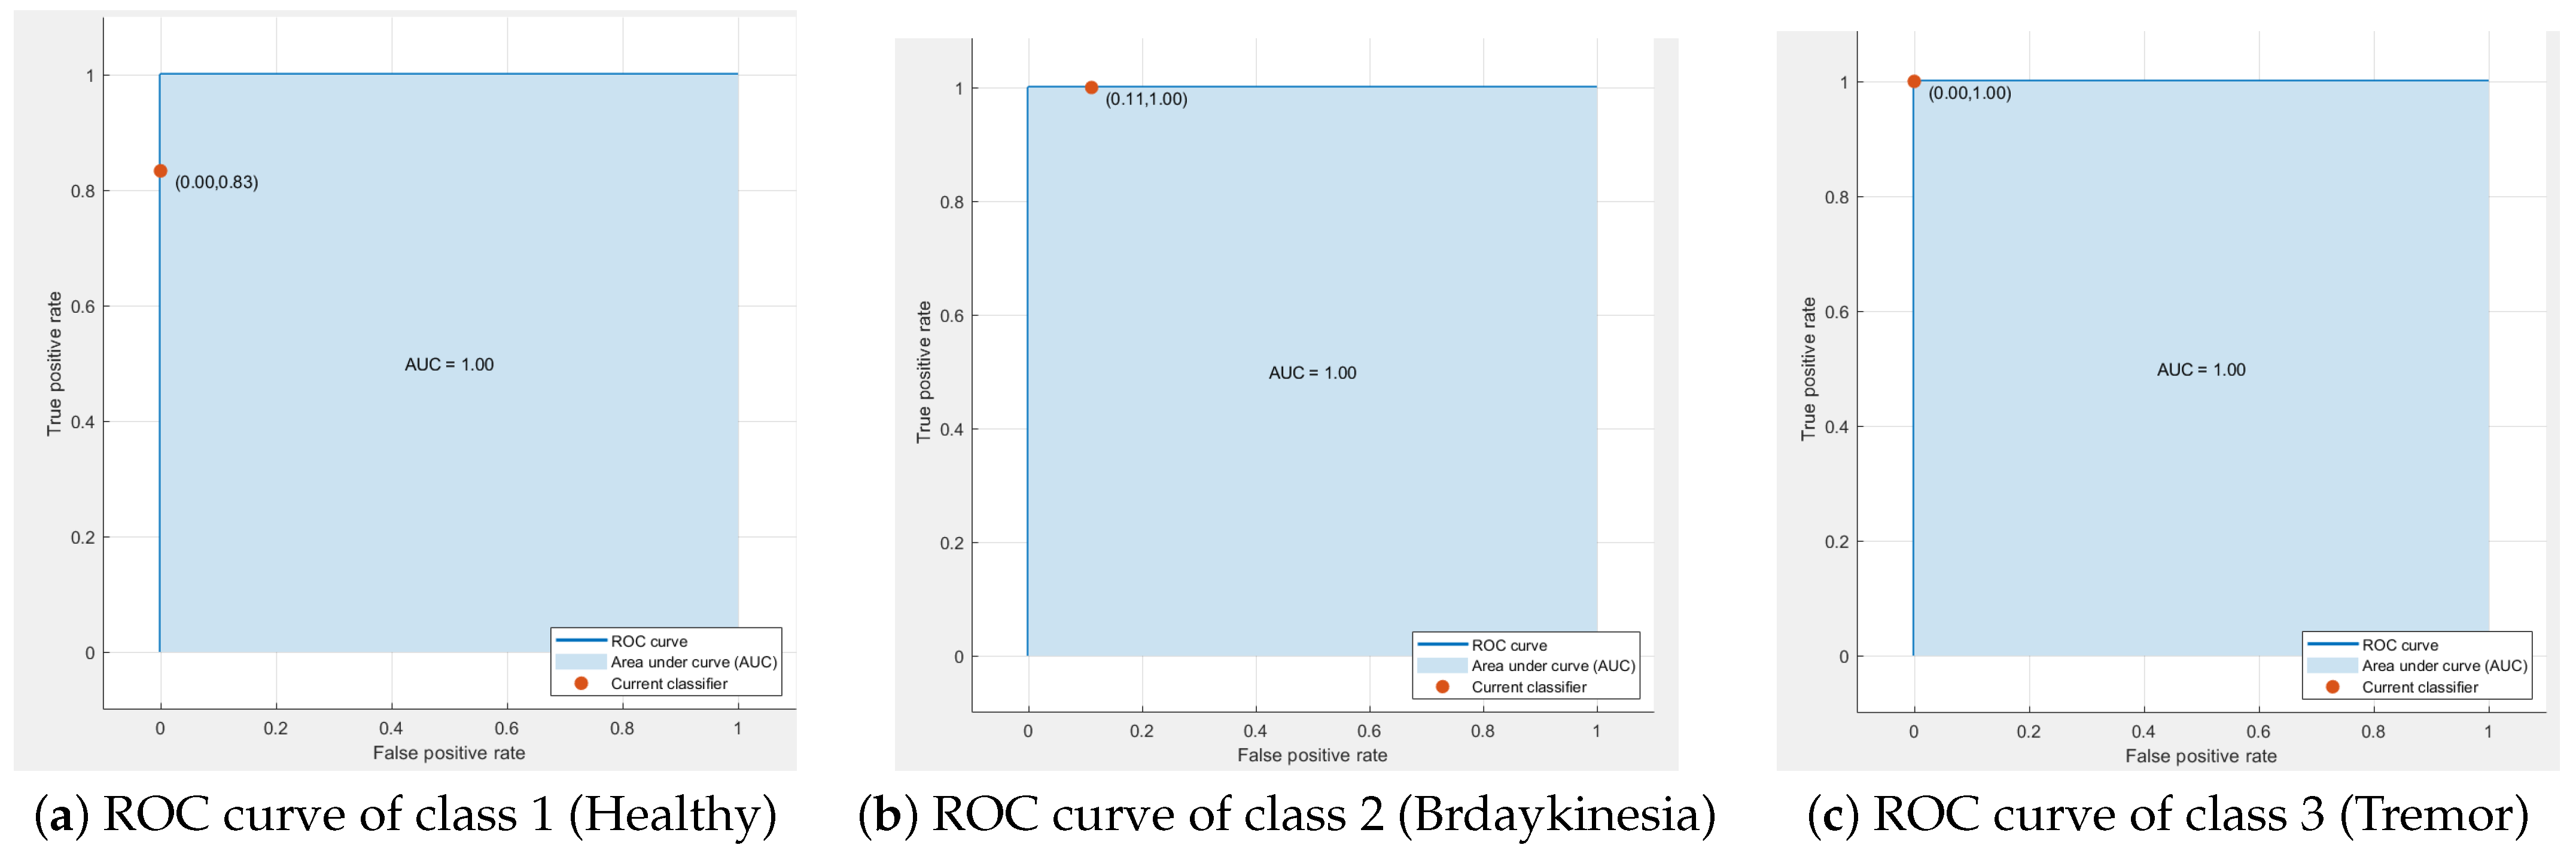
| Class | Sensitivity | Specificity |
|---|---|---|
| 1 (Healthy) | 0.83 | 1.00 |
| 2 (Bradykinesia) | 1.00 | 0.89 |
| 3 (Tremor) | 1.00 | 1.00 |
Publisher’s Note: MDPI stays neutral with regard to jurisdictional claims in published maps and institutional affiliations. |
© 2021 by the authors. Licensee MDPI, Basel, Switzerland. This article is an open access article distributed under the terms and conditions of the Creative Commons Attribution (CC BY) license (http://creativecommons.org/licenses/by/4.0/).
Share and Cite
Channa, A.; Ifrim, R.-C.; Popescu, D.; Popescu, N. A-WEAR Bracelet for Detection of Hand Tremor and Bradykinesia in Parkinson’s Patients. Sensors 2021, 21, 981. https://doi.org/10.3390/s21030981
Channa A, Ifrim R-C, Popescu D, Popescu N. A-WEAR Bracelet for Detection of Hand Tremor and Bradykinesia in Parkinson’s Patients. Sensors. 2021; 21(3):981. https://doi.org/10.3390/s21030981
Chicago/Turabian StyleChanna, Asma, Rares-Cristian Ifrim, Decebal Popescu, and Nirvana Popescu. 2021. "A-WEAR Bracelet for Detection of Hand Tremor and Bradykinesia in Parkinson’s Patients" Sensors 21, no. 3: 981. https://doi.org/10.3390/s21030981