Article

Reliability and Validity of Running Cadence and Stance Time Derived from Instrumented Wireless Earbuds

Faculty of Behavioural and Movement Sciences, Vrije Universiteit Amsterdam, Amsterdam Movement Sciences, van der Boechorststraat 7-9, 1081 BT Amsterdam, The Netherlands
*
Authors to whom correspondence should be addressed.
Sensors 2021, 21(23), 7995; https://doi.org/10.3390/s21237995
Submission received: 19 October 2021 / Revised: 20 November 2021 / Accepted: 26 November 2021 / Published: 30 November 2021

Abstract

:
Instrumented earbuds equipped with accelerometers were developed in response to limitations of currently used running wearables regarding sensor location and feedback delivery. The aim of this study was to assess test–retest reliability, face validity and concurrent validity for cadence and stance time in running. Participants wore an instrumented earbud (new method) while running on a treadmill with embedded force-plates (well-established method). They ran at a range of running speeds and performed several instructed head movements while running at a comfortable speed. Cadence and stance time were derived from raw earbud and force-plate data and compared within and between both methods using t-tests, ICC and Bland–Altman analysis. Test–retest reliability was good-to-excellent for both methods. Face validity was demonstrated for both methods, with cadence and stance time varying with speed in to-be-expected directions. Between-methods agreement for cadence was excellent for all speeds and instructed head movements. For stance time, agreement was good-to-excellent for all conditions, except while running at 13 km/h and shaking the head. Overall, the measurement of cadence and stance time using an accelerometer embedded in a wireless earbud showed good test–retest reliability, face validity and concurrent validity, indicating that instrumented earbuds may provide a promising alternative to currently used wearable systems.

1. Introduction

Using an instrumented treadmill to measure gait parameters in the lab is a widely accepted and commonly applied method [1,2]. The force platforms embedded in the treadmill allow accurate recording of all steps in a trial, which constitutes a significant improvement over the previously used force platforms embedded in the floor that could only measure a single stance [1]. However, measurements with instrumented treadmills are restricted to the lab and, although biomechanically similar [3], some aspects of treadmill gait differ from overground gait because of the often fixed imposed speed in combination with the limited treadmill surface [4,5,6]. Moreover, the option of providing real-time feedback for long-term performance improvement is limited in a lab as it requires that participants regularly return to the lab. Various methods for gait analysis using inertial sensors have been developed for both walking and running. These inertial sensors can measure multiple steps, and are mobile, allowing measurement and feedback in the field [7,8,9,10,11,12,13,14].
Although the use of inertial sensors is popular among runners, usually in the form of wearables [15,16,17], they still have limitations that need to be resolved. First, the wearable sensors are often located on the legs [7,8,10,13] or the lower back [9,13], which is not very practical for the runner. In addition, the sensor placement can influence output variables and there is still no consensus on the optimal location for sensor placement [11,12,13,18,19,20], although algorithms for the determination of cadence have been developed that do not depend on sensor location [21]. Second, real-time feedback of gait parameters such as cadence and contact times derived from inertial sensors is often provided visually on a watch, looking at which interferes with running [15,22]. Auditory instructions or feedback on gait parameters, for example through auditory pacing [23] or sonification [24,25], is therefore preferable [26]. Third, previous research indicated that runners dislike carrying their phone and would prefer using an all-in-one device [16]. Thus, although many wearable sensors have been developed, there are still improvements to be made regarding the location on the body and feedback delivery.
Ear-based sensors could provide a solution to these limitations. The location of an ear-based sensor solves the placement problem associated with wearables, and neither the sensor itself nor the provision and pickup of feedback will interfere with running. In addition, the sensor may be influenced less by vibrations due to the soft tissue between sensor and bone [27], since it is positioned close to the skull. After all, accelerations are highest in the lower extremities and decrease along the vertical axis of the body, with the lowest accelerations being measured on the head [28]. Still, previous research has shown that an ear-based accelerometer could be used to distinguish between medium to high level activity [20], between impaired and non-impaired gait [29], and between walking and running [30]. An ear-based accelerometer can also be used to measure parameters related to the gait cycle and force loading in walking [31,32,33,34], especially at faster walking speeds, during which accelerations are higher [32]. It was suggested that the larger difference between the ear-based accelerometer-derived parameters and the treadmill-derived parameters when walking at lower speeds was due to more incidental head movements, such as nodding and looking around, which caused measurement artefacts [32].
Instrumented wireless earbuds, equipped with embedded accelerometers to measure and process acceleration data, were developed by Dopple B.V. (Assen, The Netherlands). These earbuds can provide real-time auditory feedback of gait parameters during the run, essentially creating an all-in-one device. The main purpose of the present study was to assess the test–retest reliability, face validity and concurrent validity of running gait parameters derived from accelerometer data collected with the instrumented earbuds of Dopple B.V., and thus, to extend the findings regarding the use of ear-worn sensors in walking [31,32,33,34] to running. We focused on cadence and stance time, as recent literature proposed that the combination of these gait parameters can be used to describe running technique [35]. Cadence and stance time were derived from concurrent earbud and force-plate data for a range of running speeds. We assessed their test–retest reliability for both measurement methods, their face validity in terms of changes in to-be-expected directions with increasing running speed (i.e., higher cadence and shorter stance times [35]), and concurrent validity in terms of their agreement between both measurement methods. In addition, we looked at the between-methods agreement of the derived gait parameters when participants performed incidental head movements upon instruction while running at a comfortable running speed.

2. Materials and Methods

Fourteen healthy runners (6 male/8 female), 36 ± 13 years of age (mean ± standard deviation; M ± SD) with body weights of 71.4 ± 14.1 kg, participated in the study. All participants provided written informed consent before participating. The protocol was in accordance with the Declaration of Helsinki and approved by the Scientific and Ethical Review Board of the Faculty of Behavioural and Movement Sciences of the Vrije Universiteit Amsterdam (VCWE-2019-006R1).
Participants ran on an instrumented treadmill (Motek, Amsterdam), which was equipped with force plates that measured the 3D ground reaction force (Figure 1). Participants wore an earbud equipped with a 3D accelerometer (LIS2DW12, STMicroelectronics, Geneva, Switzerland) in their left ear (Figure 2). The earbud came with three attachments in different sizes, to ensure a snug fit for every participant (Figure 2a). Data were sampled at 500 Hz in the force plate and at 800 Hz in the accelerometer.

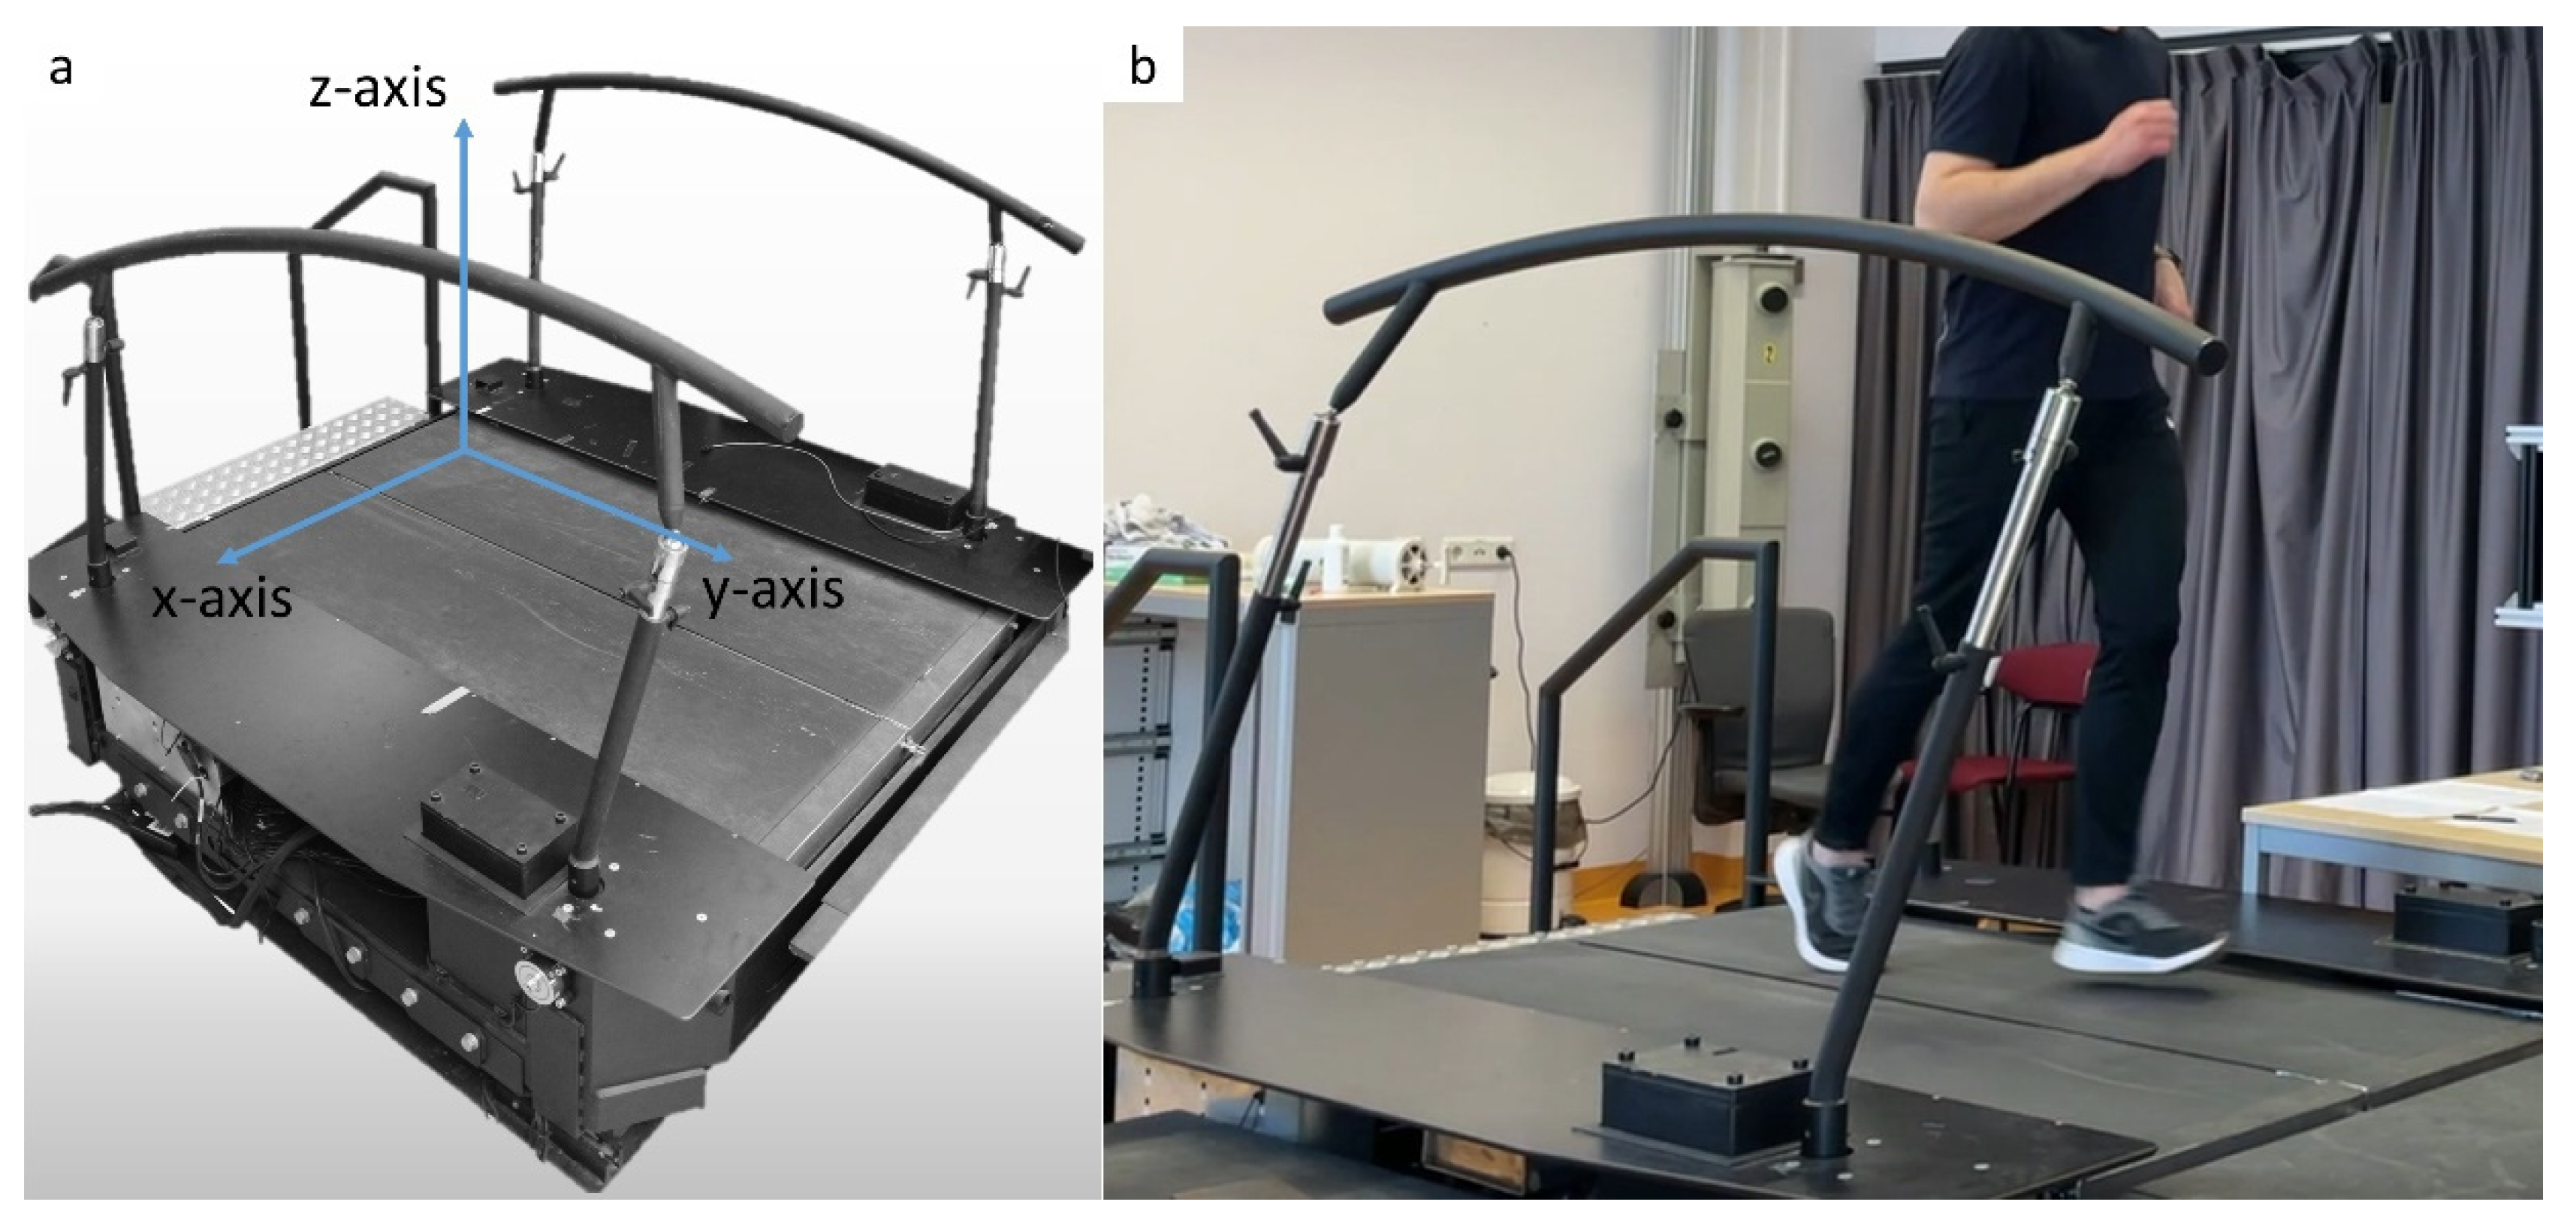
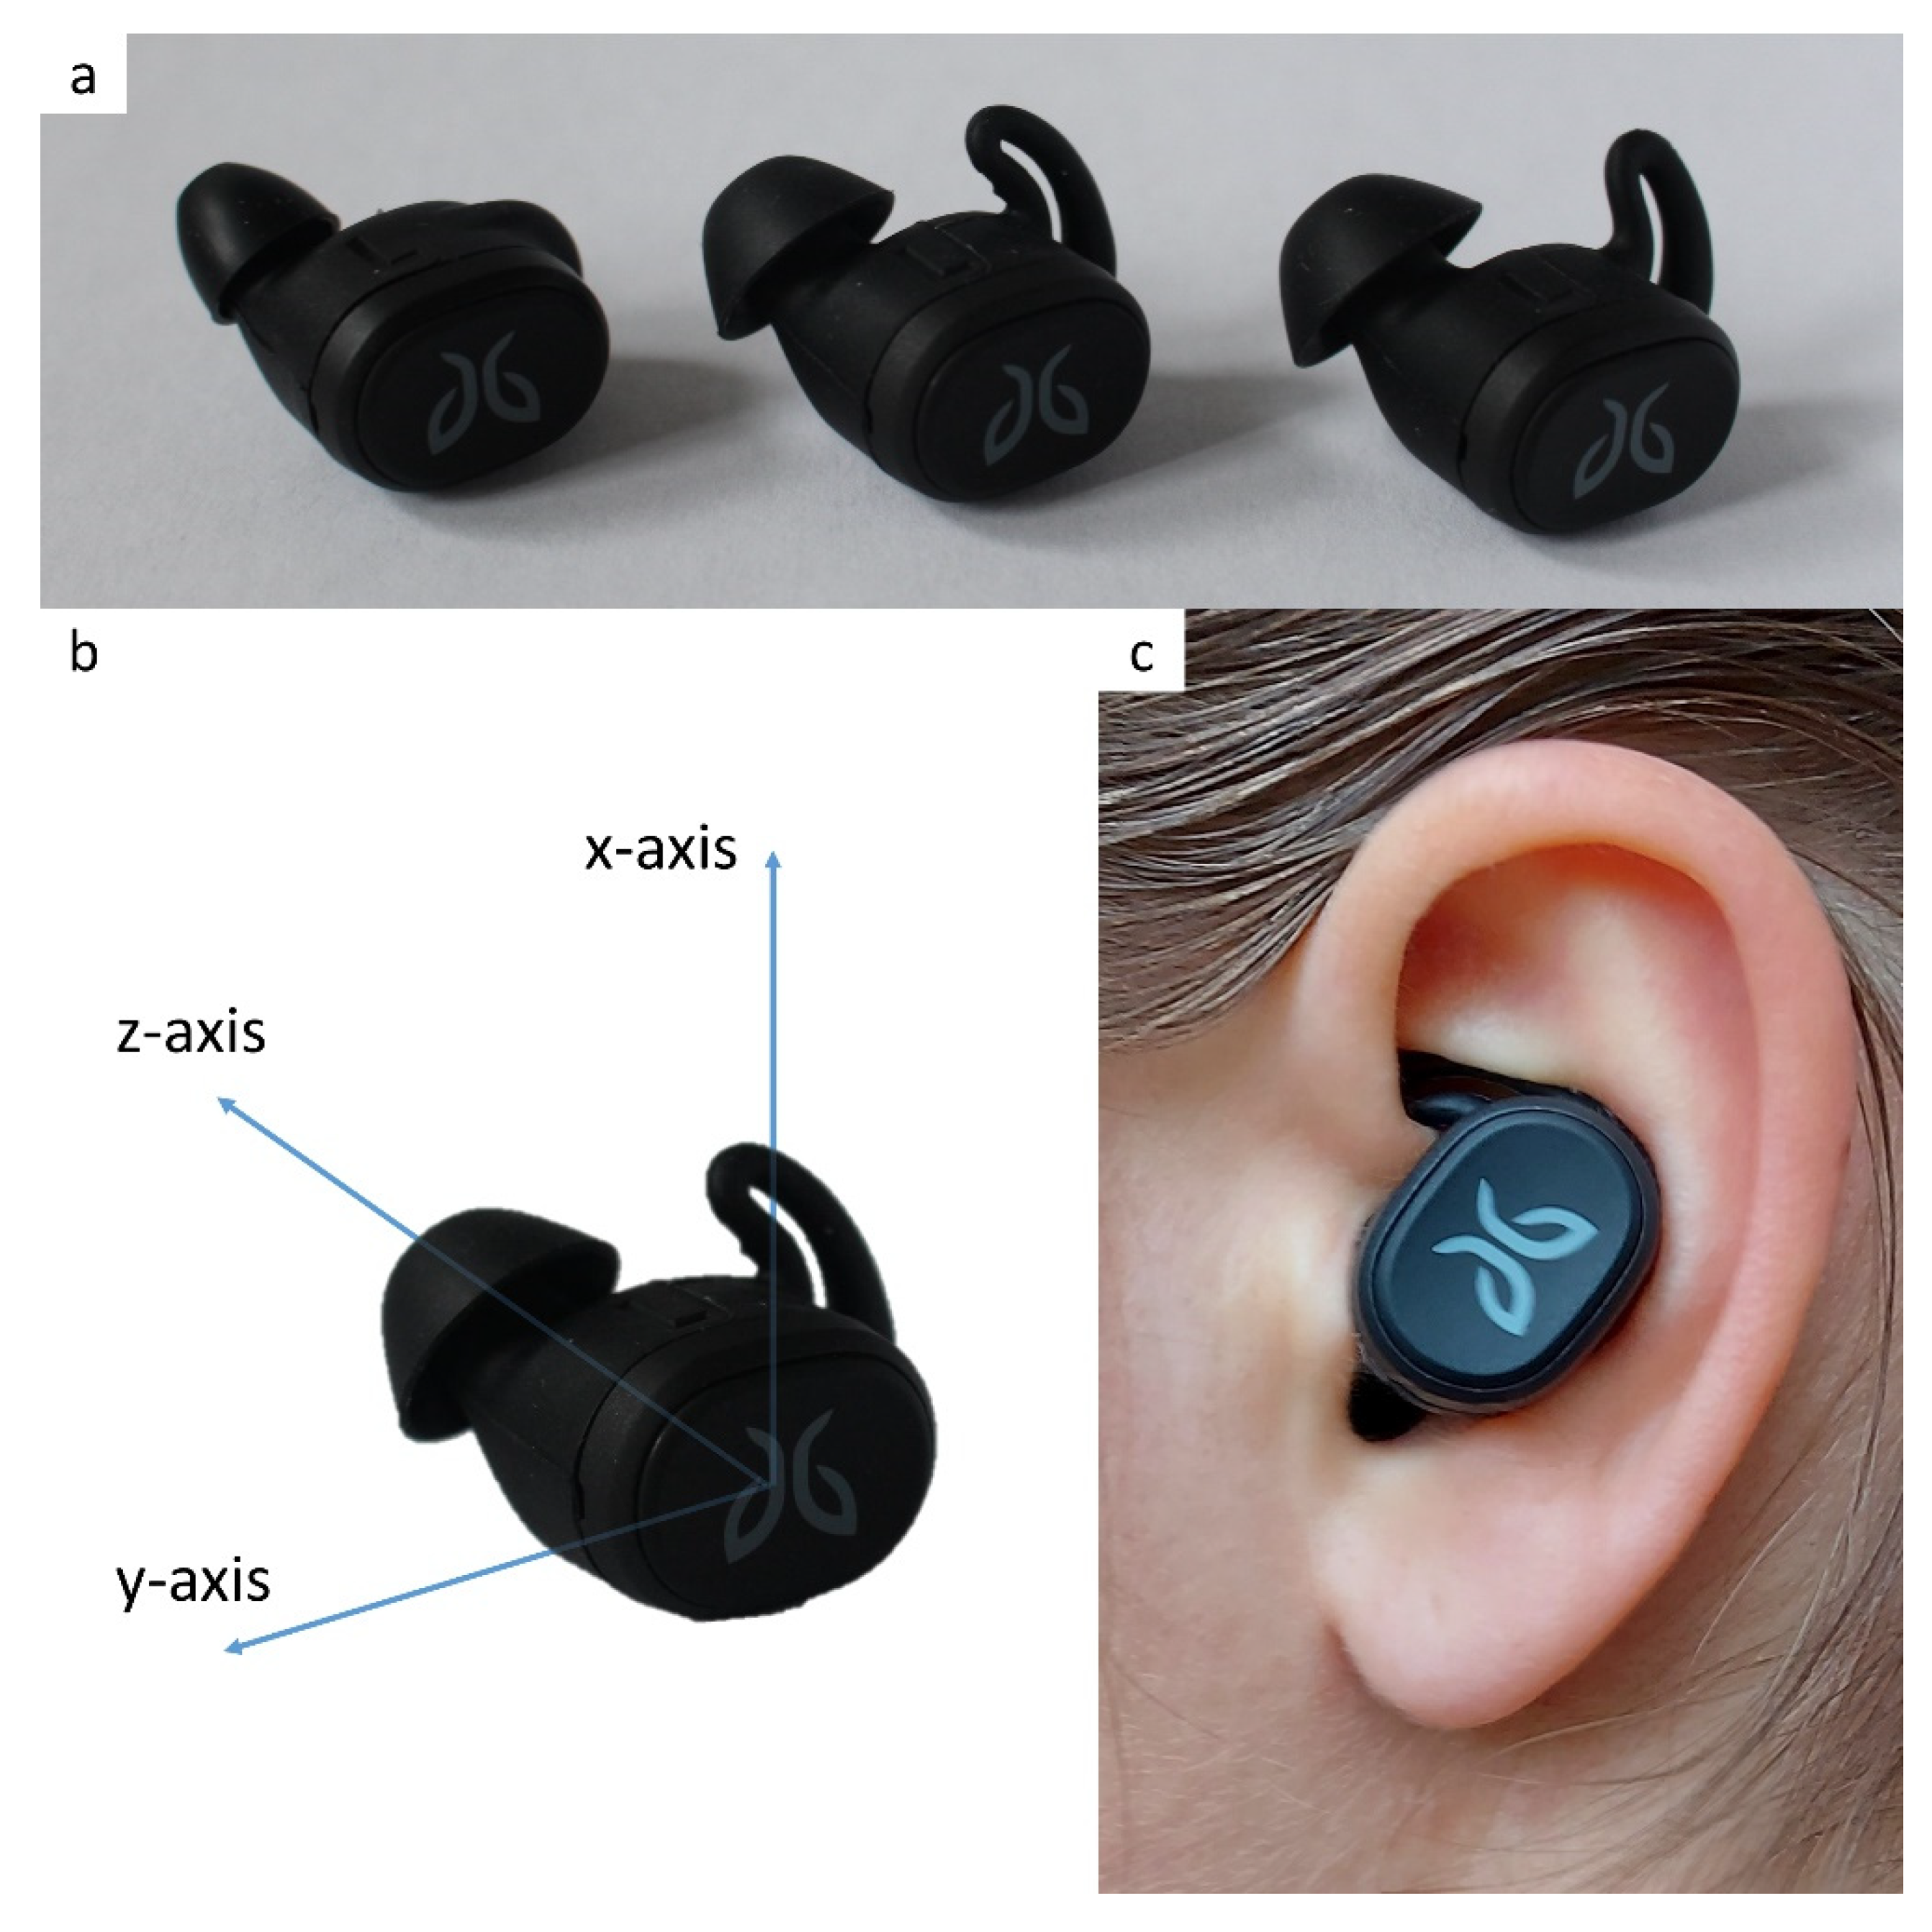
2.1. Data Collection
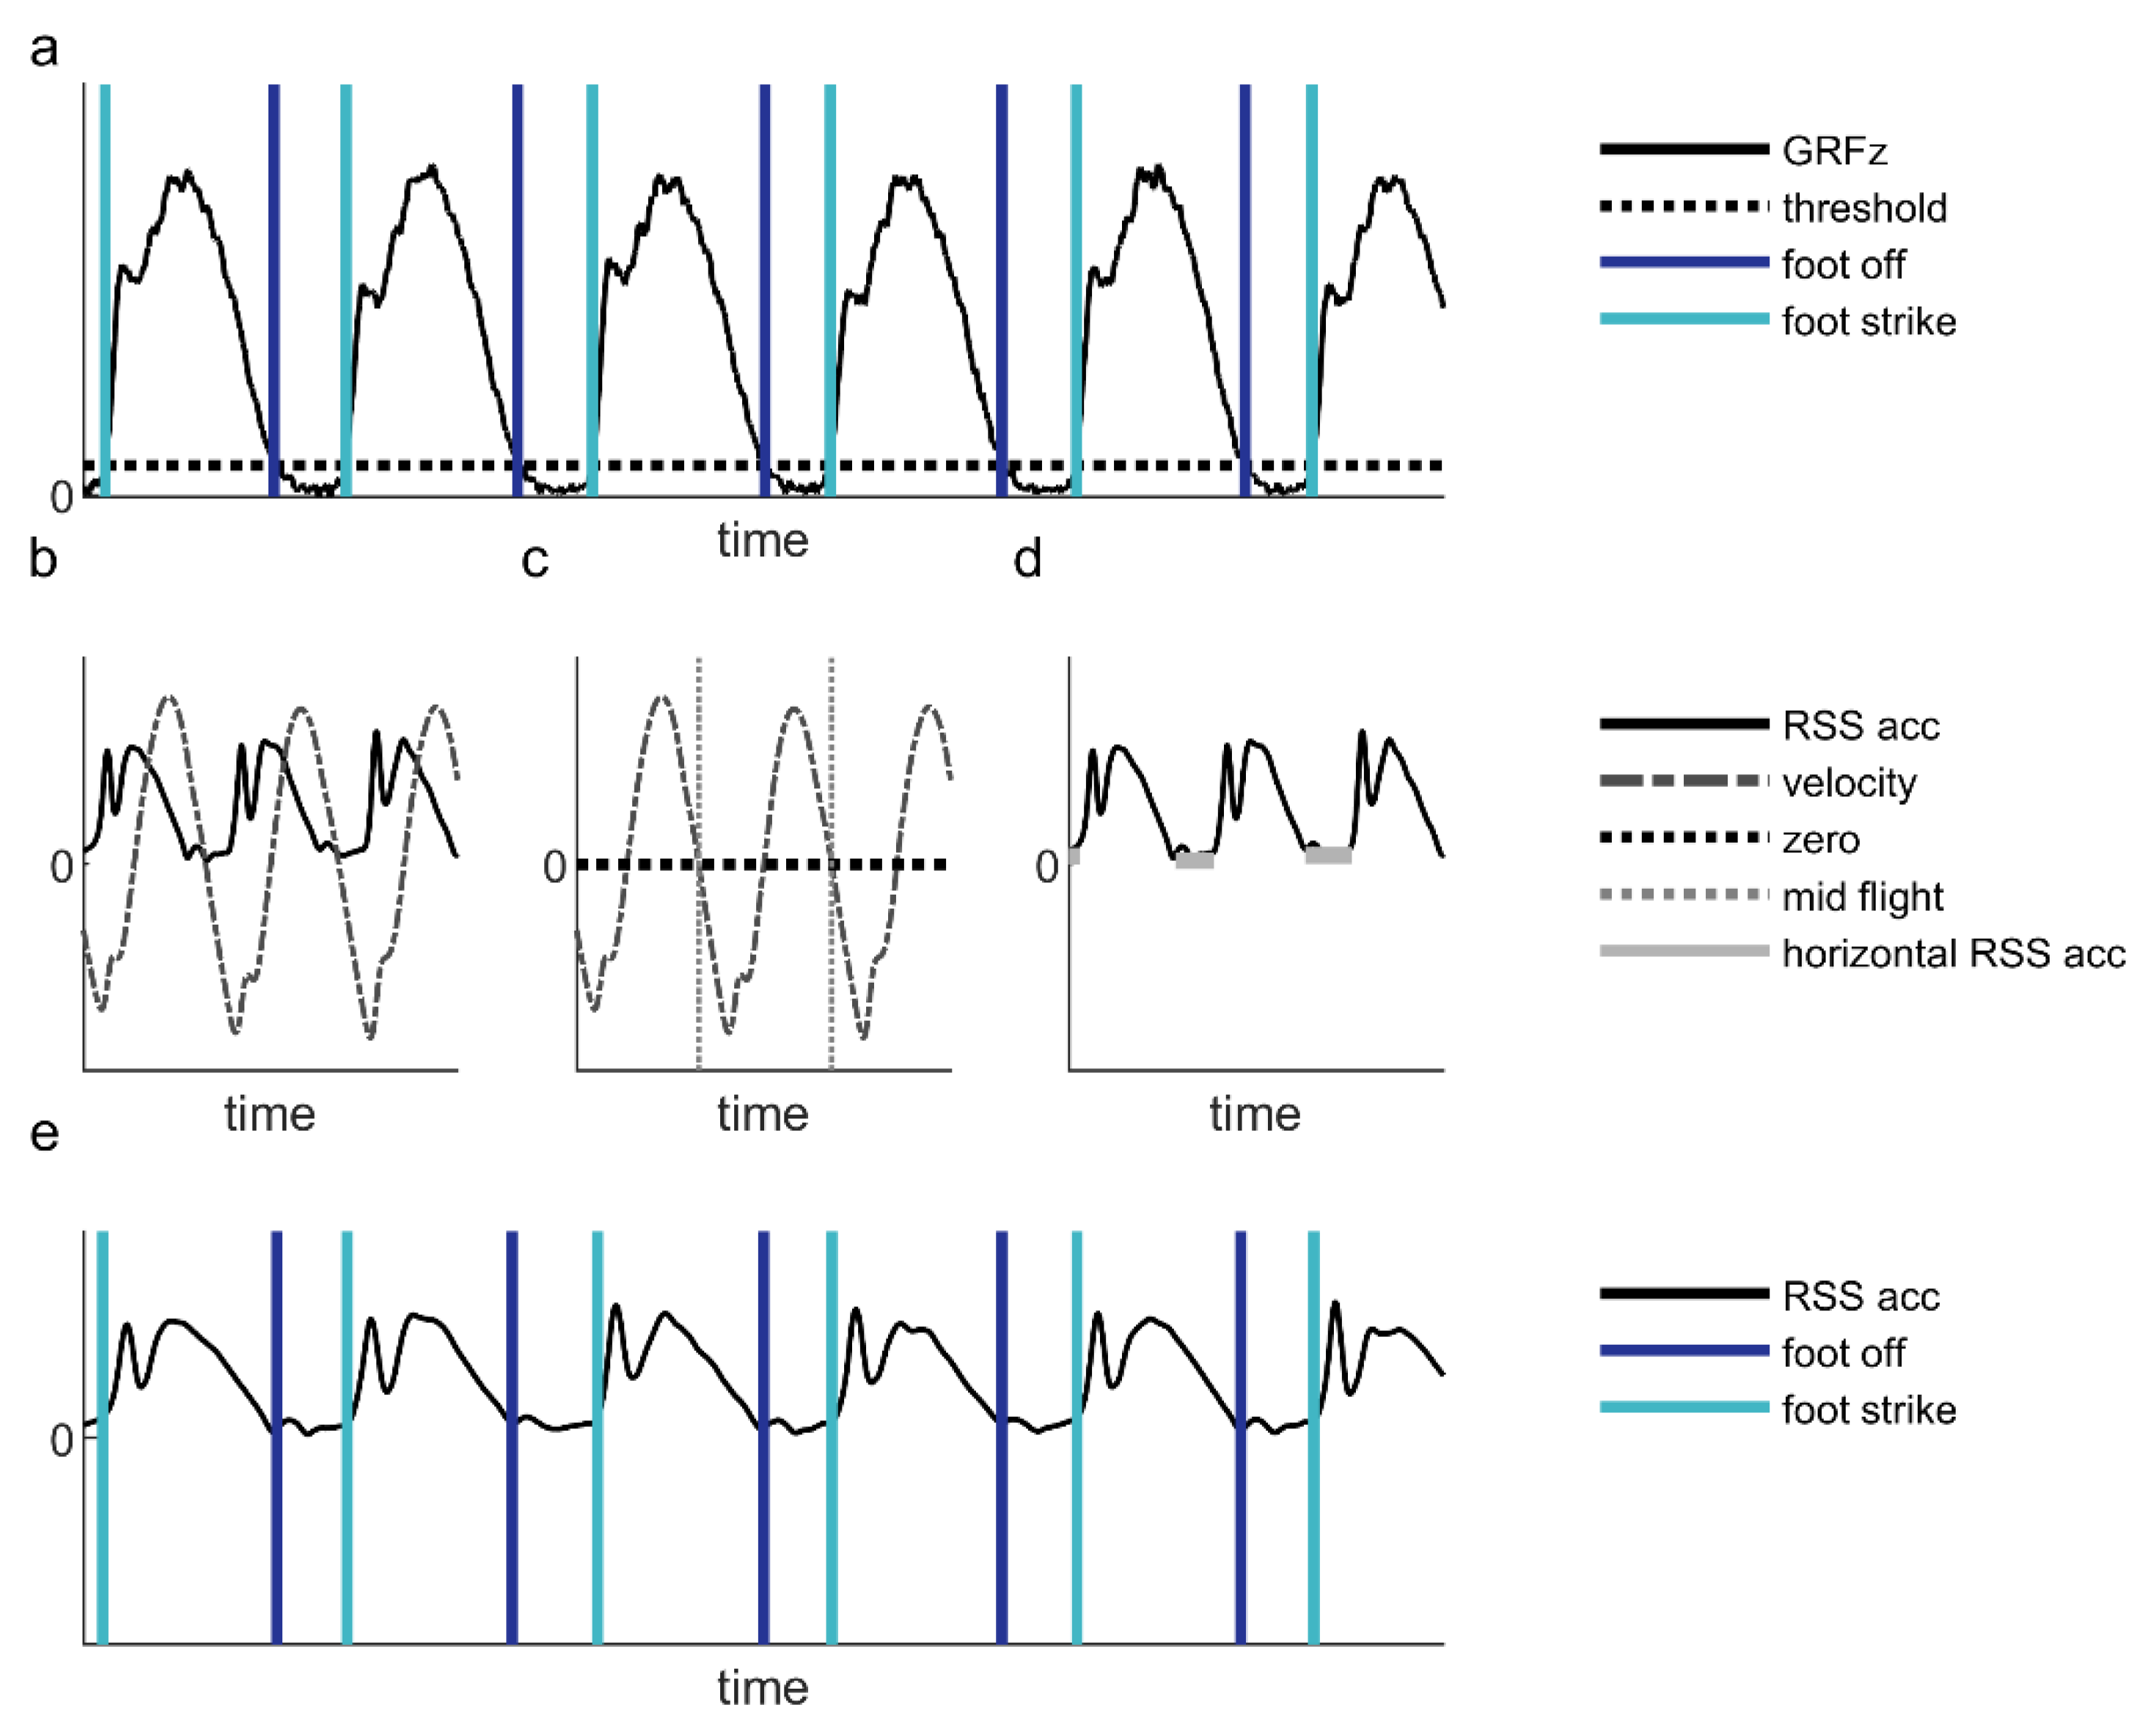
Each participant completed all conditions in a repeated-measures design. Before the measurements began, participants ran on the treadmill at a comfortable speed to warm-up and familiarize themselves with running on the treadmill. Then, the maximum running speed was determined by discussing it with the participant and optionally trying to run at that speed for a short while. Participants were told that they could abort a trial at any time if the speed turned out to be too high.
The participants were invited to run at four speeds ranging from 7 km/h, around which the transition from walking to running occurs [36], to 16 km/h, which was the maximum speed of the belt, with increments of 3 km/h, i.e., they ran at 7 km/h, 10 km/h, 13 km/h, and the maximum running speed of the participant, up to a maximum of 16 km/h. Each speed was measured for one minute. During the speed trials, no instruction regarding head movement was given. The order in which participants performed the speed conditions was randomized. After having completed all speed conditions once, participants performed a trial with instructed head movements while running at a comfortable running speed. During this head-movement trial, participants started running while keeping the head in a neutral position (facing forward). After about 15 s, participants were verbally instructed by the researcher to perform a particular head-movement condition every 15 s. Participants received seven such instructions, pertaining to a variety of different head-movement conditions (Table 1), which were explained beforehand. They were instructed to perform the head movements as realistically as they could during a run. The order in which those head-movement conditions were performed within the head-movement trial was random. After this trial with instructed head movements, the participants performed all speed conditions a second time in the same order to establish the test–retest reliability.
Each trial started with a jump on the instrumented treadmill for synchronization purposes. Subsequently, the treadmill was started and brought up to speed. At the end of each trial, the speed of the treadmill was decreased to standstill. To avoid fatigue, participants were allowed a break in between trials for as long as they deemed necessary to recover. The experiment was concluded when the participants had completed all trials.

2.2. Data Analysis

All calculations were conducted in MATLAB (MathWorks®, R2018b). The earbud data were resampled to 500 Hz and synchronized to the force-plate data manually by overlapping the jumps in the different datasets. Differences in maximum running speed and technical problems led to an incomplete dataset, within which not all speeds could be compared for all participants. Therefore, the sample size was reported for each comparison, and the maximum speed condition was not analyzed statistically due to the small sample size.
For all trials, the time instances of foot strike (tfoot strike) and foot off (tfoot off) were determined based on the force data and the acceleration data from the earbud. For the different speed conditions, data for 50 s of consistent running were used for the analysis, and for the head-movement conditions, data for 10 s around the head movement were used.
Force plate. Foot-strike and foot-off events were determined as the time instances at which the vertical component of the ground reaction force crossed a threshold of 25% of body weight in the upward and downward direction, respectively (Figure 3a). Based on the determined events, cadence (in steps/min) was calculated as:
Cadence = 1 n i = 2 n ( 60 t foot   strike   ( i ) t foot   strike ( i 1 ) )
and stance time (in s) was calculated as:
Stance   time = 1 n i = 1 n ( t foot   off ( i ) t foot   strike ( i ) ) ,
where n is the number of steps and tfoot strike(i+1) > tfoot off(i) > tfoot strike(i).
Earbud. A custom-written algorithm, which was developed specifically for the instrumented earbud by Dopple B.V., was used to determine cadence and stance time. This algorithm comprises a sliding window analysis (2 s, 0.6 s overlap) for real-time gait-event estimation. For each sample in a window, it first calculates the root sum square of the 3D acceleration to limit the effect of orientation differences. Then, the integral over time of this root sum square series is calculated to represent the velocity time series (Figure 3b). Next, the negative zero crossings of the velocity are determined, which roughly represent the middle of the flight phase (Figure 3c). Finally, for every flight phase identified in the window, the corresponding width of the horizontal section in the root sum square of the acceleration is determined, whose boundaries provided estimates of foot-off and foot-strike events (Figure 3d,e). All events were collated and duplicates were removed before calculating the cadence and stance time according to Equations (1) and 2, respectively.

2.3. Statistical Analysis

The statistical analysis was performed in IBM SPSS Statistics 25. Results were deemed significant when α < 0.05.
For each speed, within-method test–retest reliability was assessed for cadence and stance time using a two-tailed paired-samples t-test to identify systematic biases between test and retest, accompanied by the intra-class correlation coefficient (ICC) based on a single-rater, absolute agreement, 2-way mixed-effects model (values <0.5, 0.5 to 0.75, 0.75 to 0.9, and >0.9 indicate poor, moderate, good, and excellent agreement, respectively [37]). Bland–Altman analysis was used to establish the bias and 95% limits of agreement [38]. Bland–Altman plots were made to visualize the bias and limits of agreement.
Face validity was determined per method by comparing cadence and stance time over speeds with a one-way repeated-measures ANOVA, with paired-samples t-tests for post-hoc comparisons. Greenhouse–Geisser corrections were applied when Mauchly’s test of sphericity was significant.
The between-methods agreement for cadences and stance times was assessed for the test and retest separately, as well as for the two tests combined [39], again using paired-samples t-tests accompanied by ICC and Bland–Altman analysis.

3. Results

Datafiles of the force and acceleration data for all trials per participant, together with the calculated variables, can be found in the Supplementary Materials. The mean cadence and stance time, as measured for the different speeds by the two methods in test and retest, are shown in Figure 4.

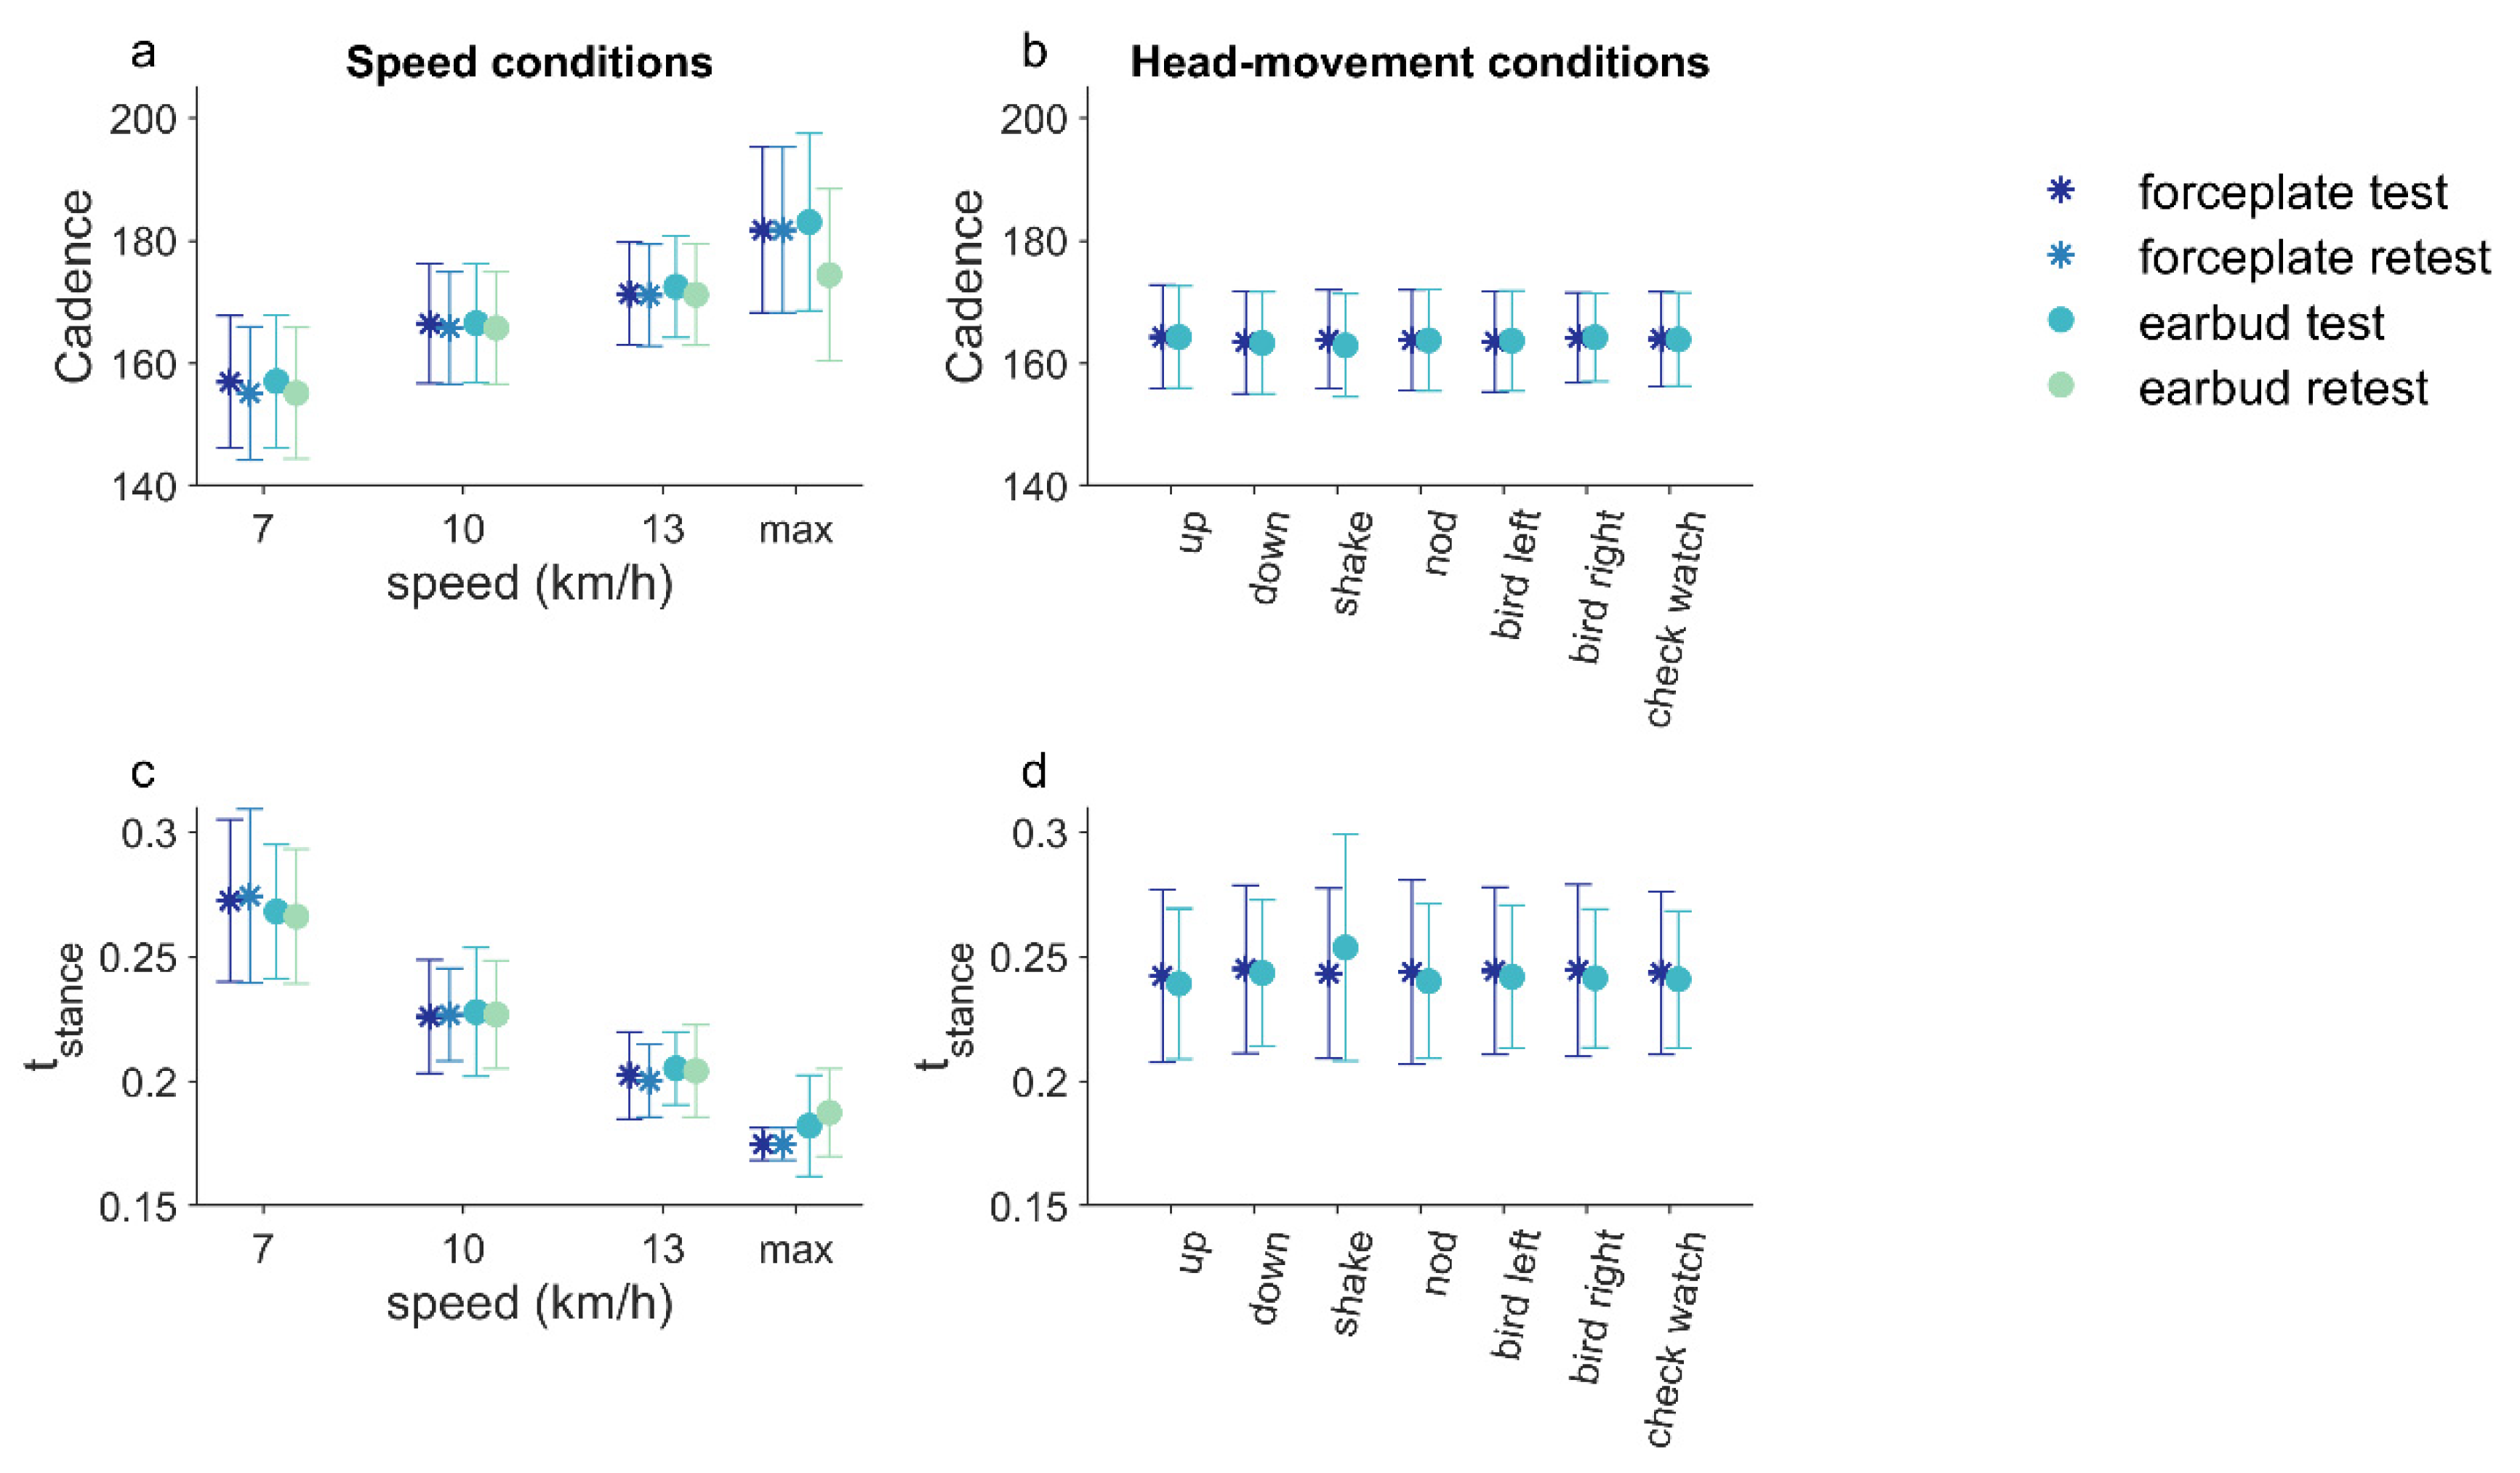
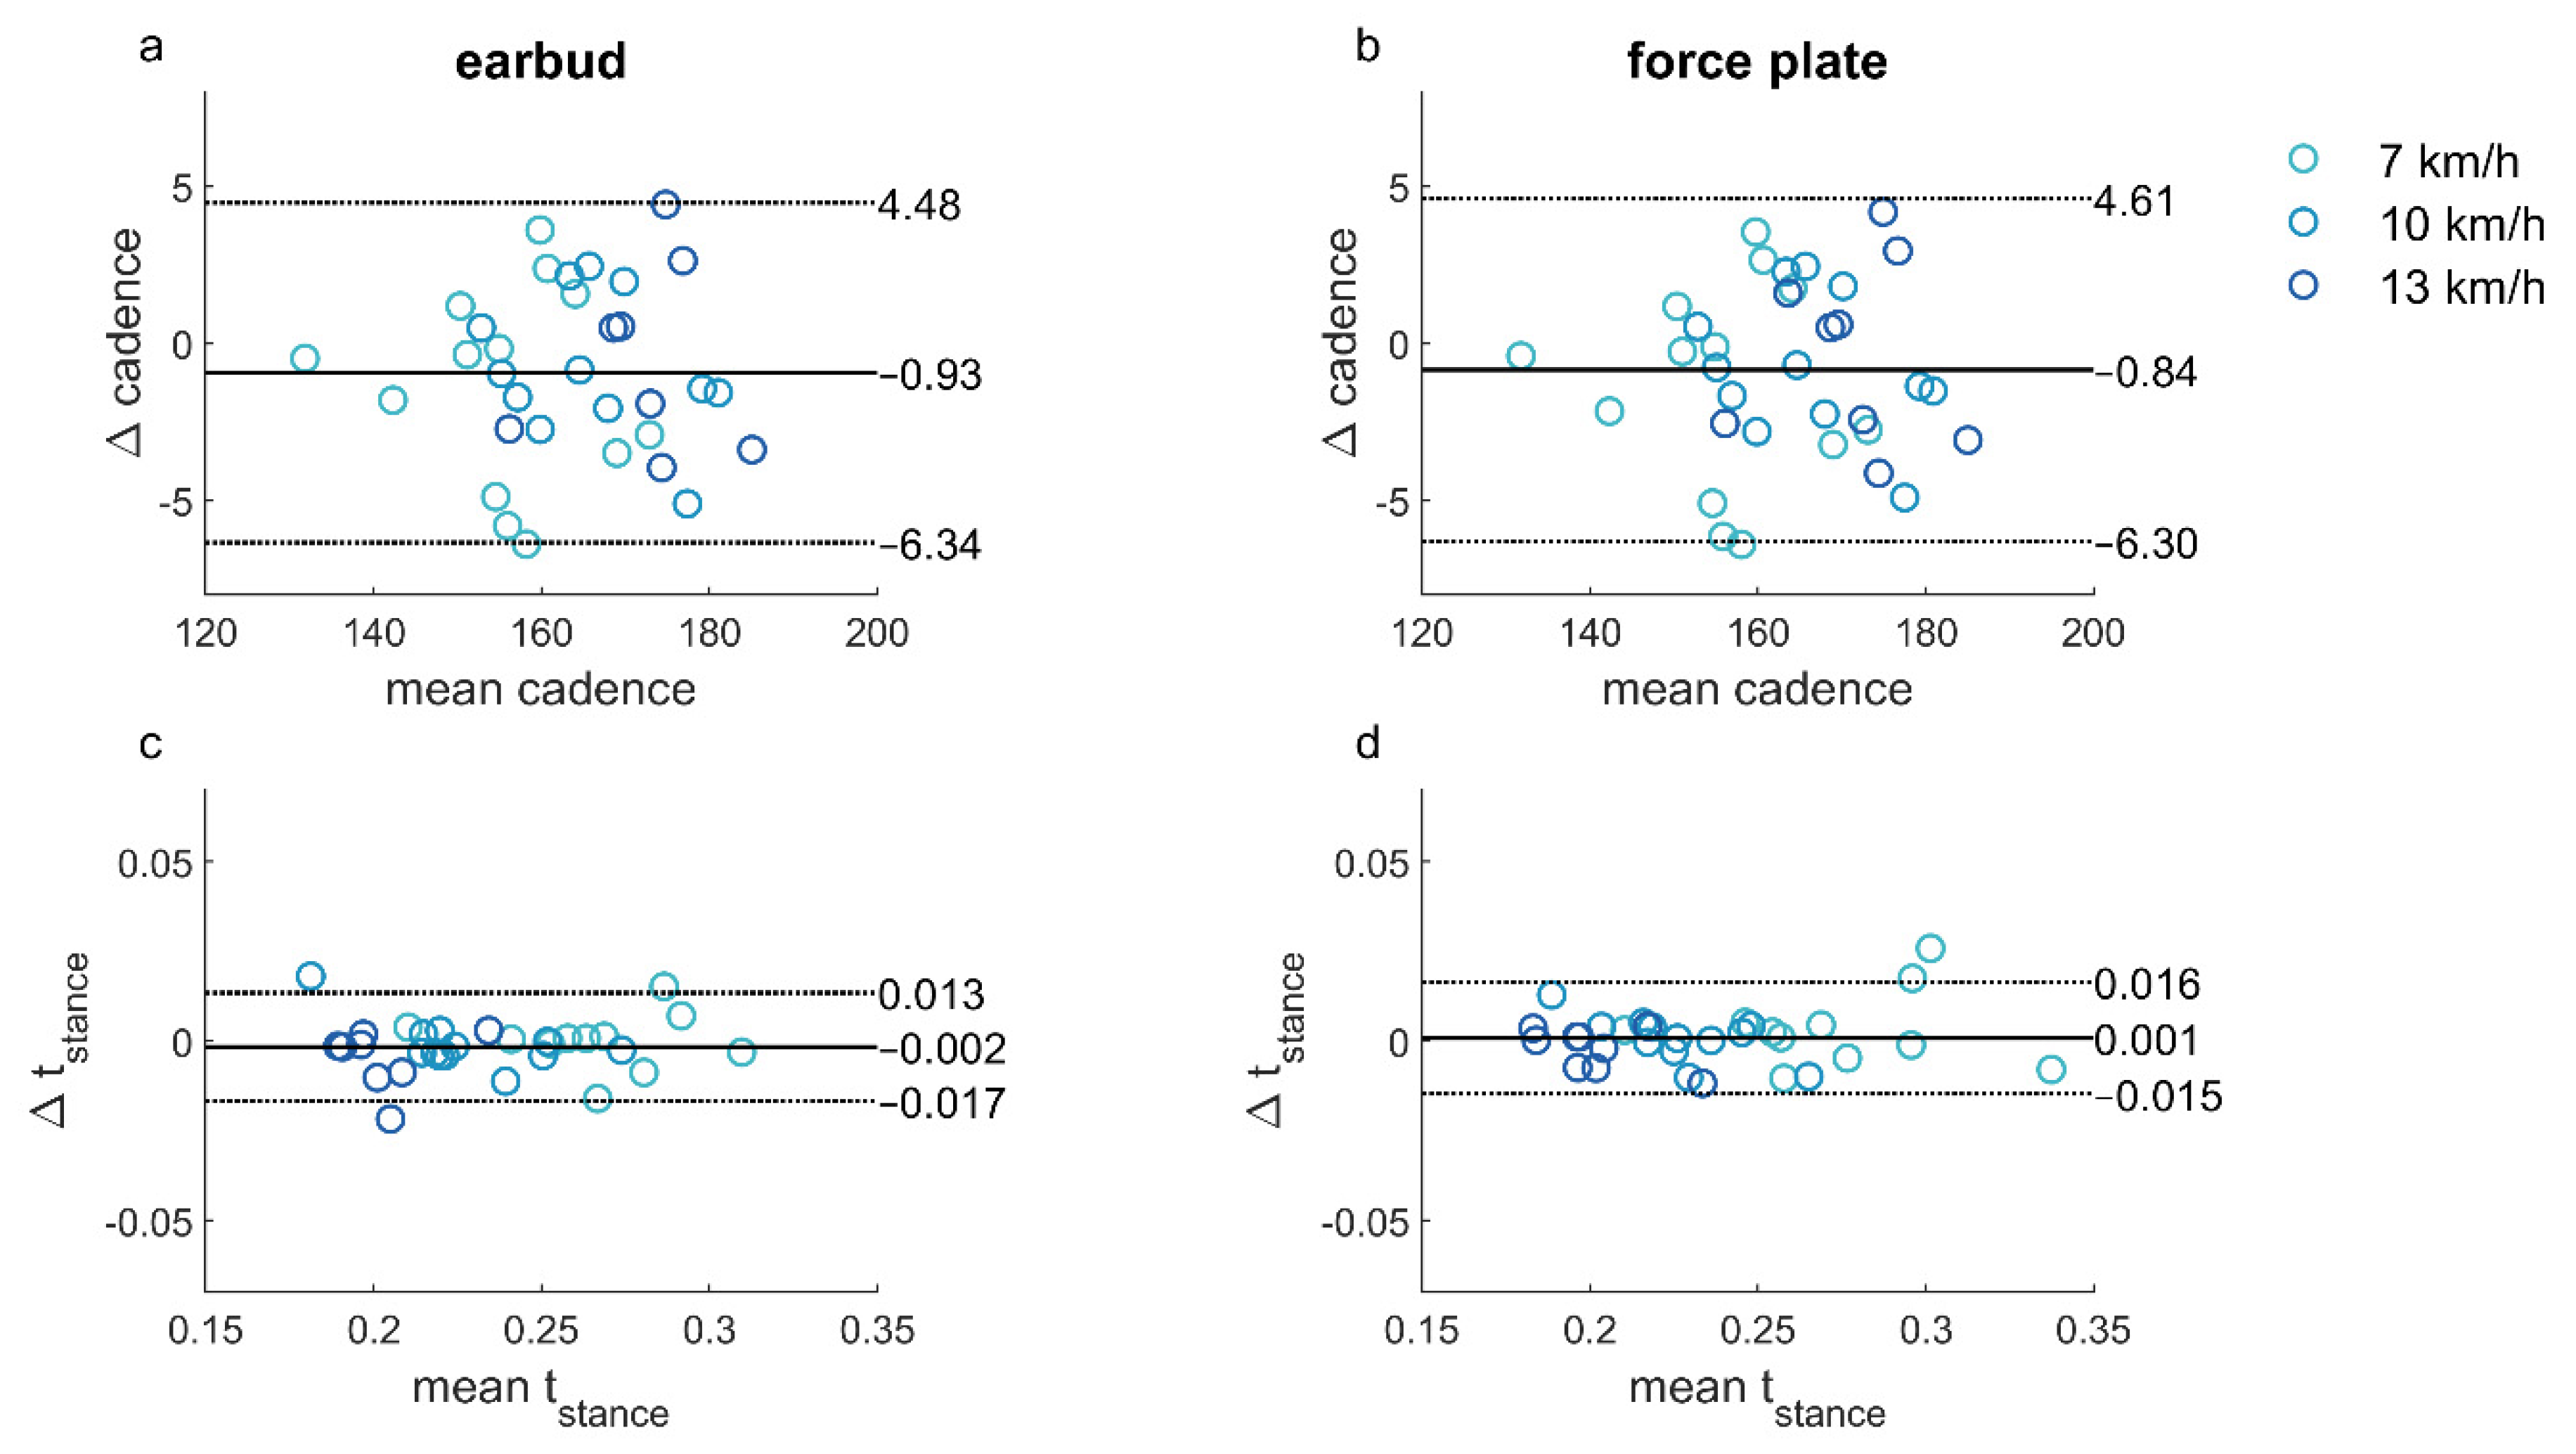
3.1. Within-Method Reliability: Speed Conditions

Test–retest biases were not significant for both methods (Figure 5; Table 2). The ICC showed good-to-excellent agreement for the earbud method (Table 2) and excellent agreement for the force-plate method (Table 2). The Bland–Altman plots showed similar limits of agreement for both methods and indicated no dependence of the difference on the mean (Figure 5).

3.2. Face Validity: Difference over Speed Conditions in Expected Direction

For both methods, cadence increased significantly with speed (Figure 4a; earbud: F(1.04, 8.35) = 11.16, p = 0.009; force plate: F(1.04, 8.34) = 10.97, p = 0.01), with significant post-hoc differences between 13 km/h and the other two speed conditions (p < 0.017), but no significant difference between 7 and 10 km/h, for both the earbud and force-plate methods (p = 0.128; p = 0.126, respectively). For both methods, stance time decreased significantly with increasing speed (Figure 4c; earbud: F(2, 12) = 110.74, p = 0.000; force plate: F(1.12, 6.72) = 116.93, p = 0.000), with significant post-hoc differences between the three speed conditions (p < 0.001).

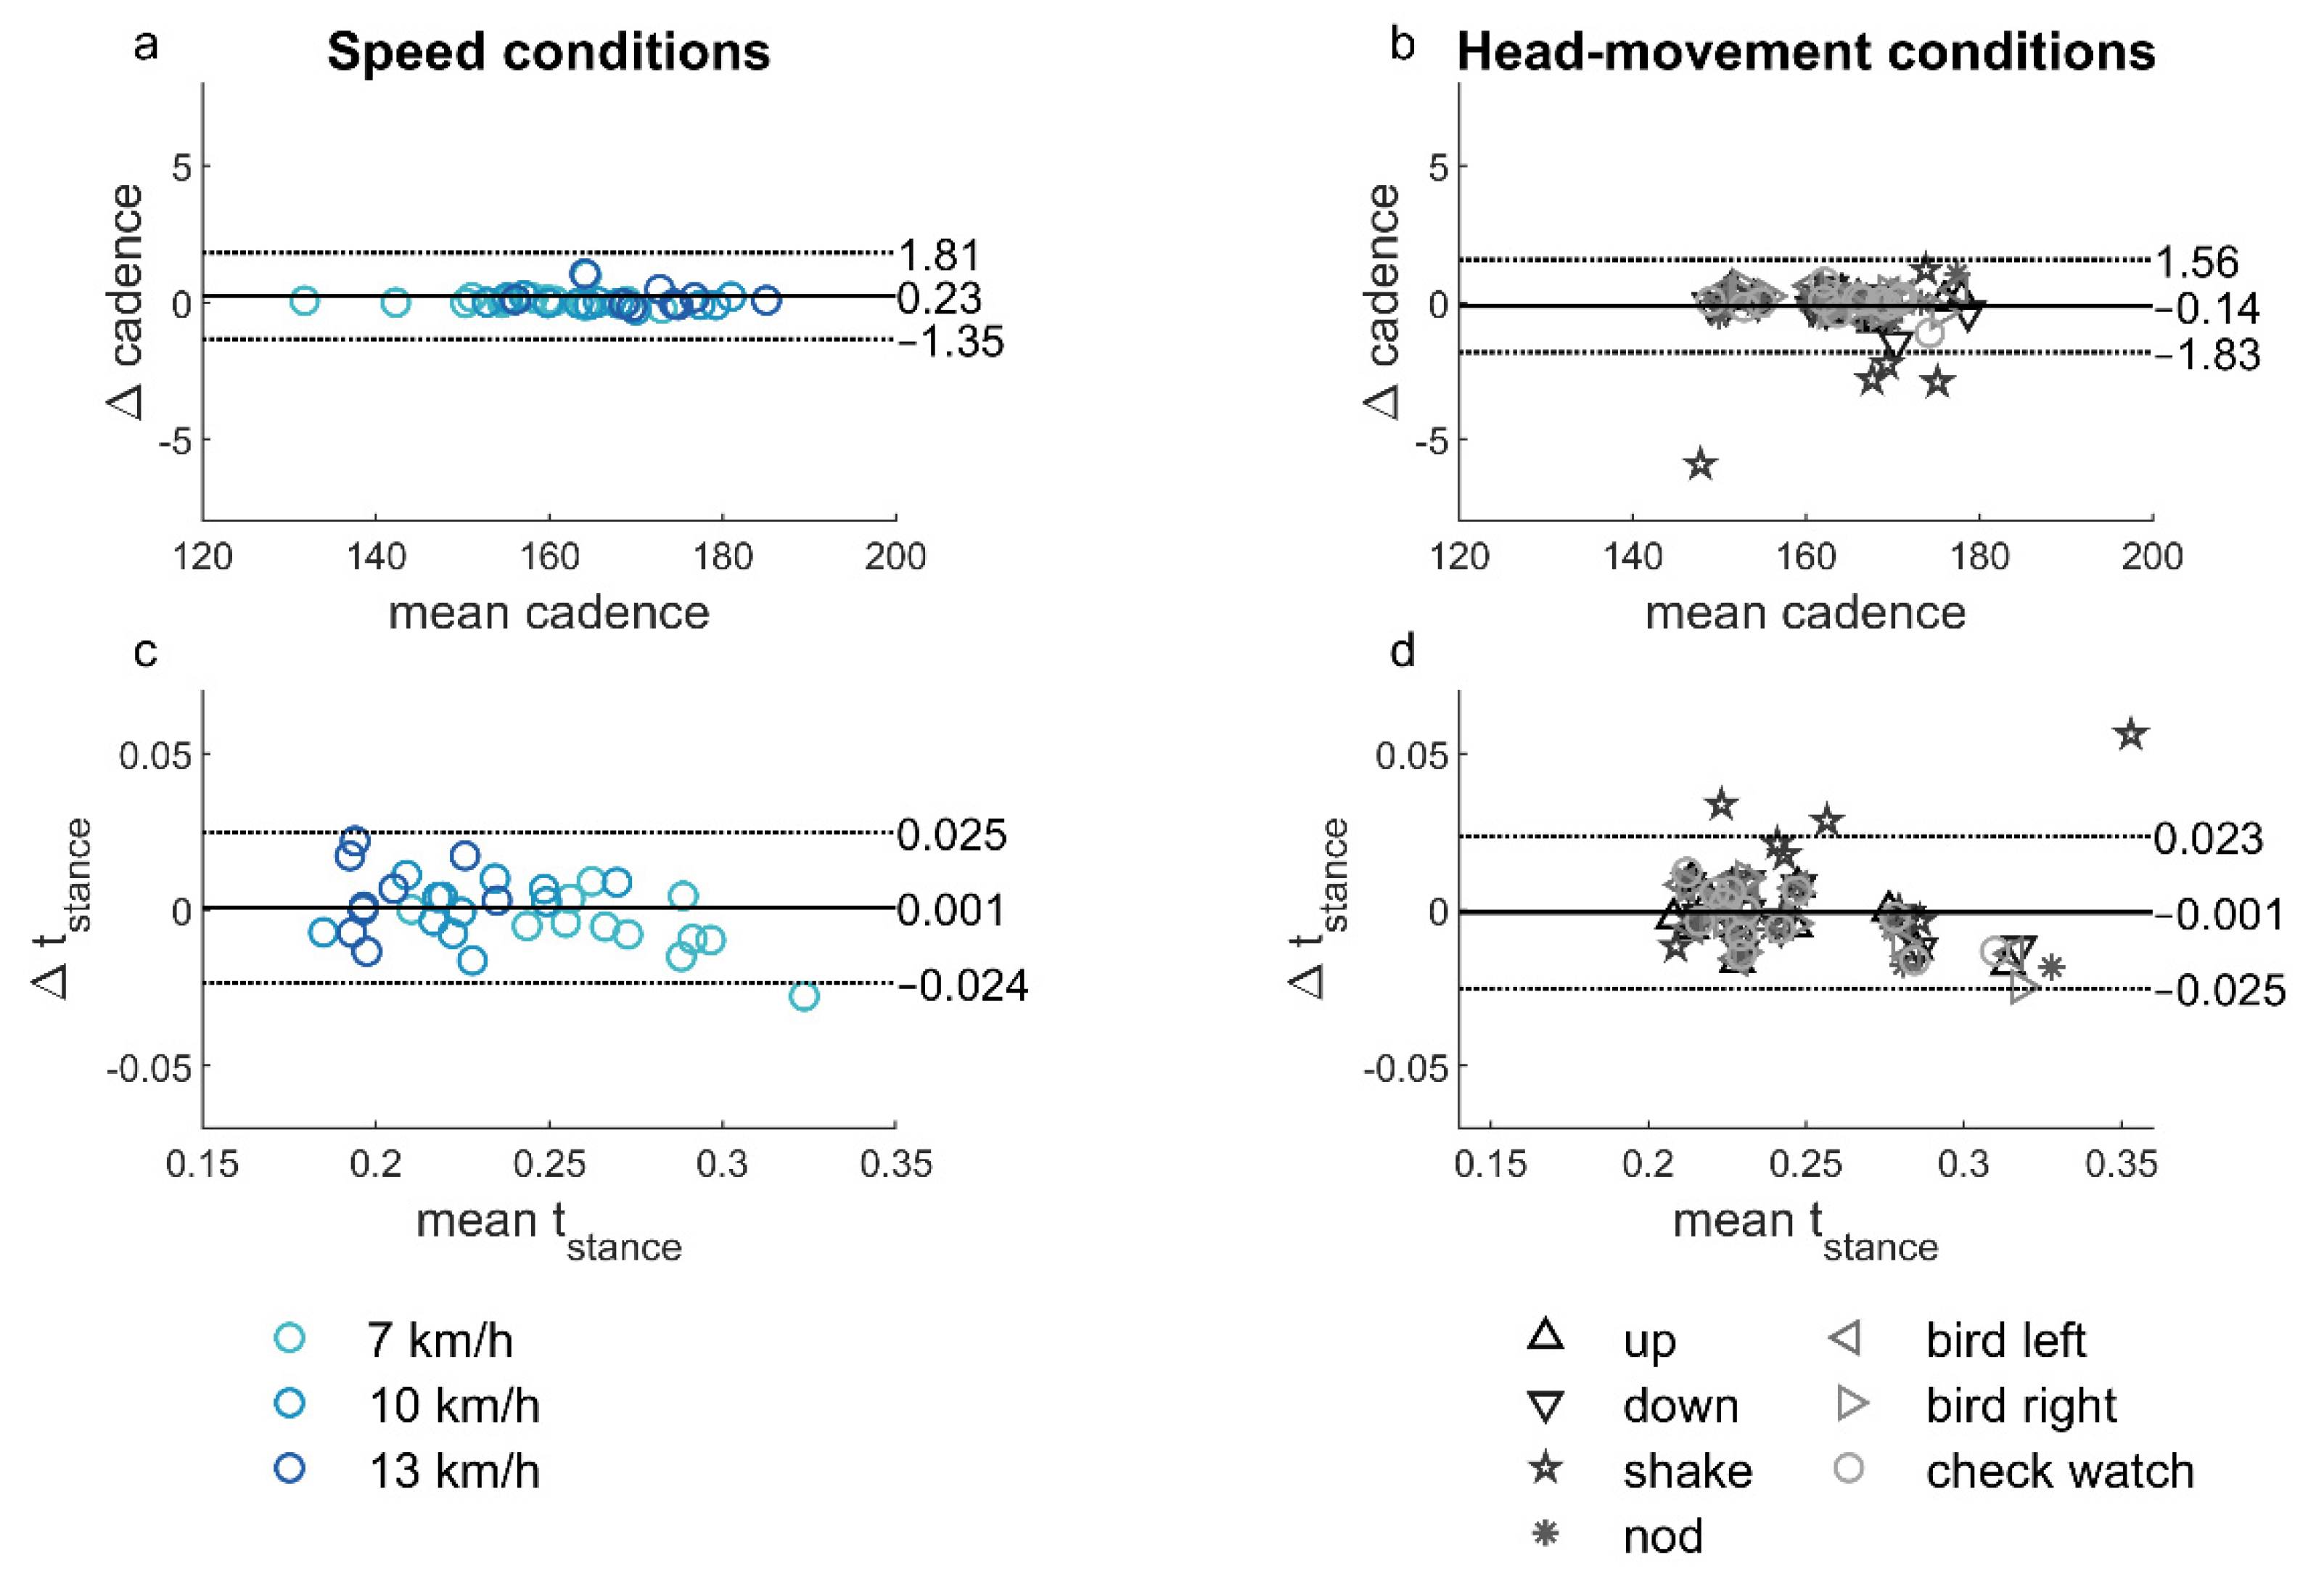
3.3. Between-Methods Agreement: Speed Conditions

For most speeds, no significant between-methods biases in cadence and stance time were found (Figure 6a,c; Table 3). Only the stance time in the retest at 7 km/h had a significant bias of −0.008 ± 0.010 s (p = 0.02; Table 3), showing that the average stance time as measured with the force plate was 0.008 s longer than the average stance time as measured with the earbud. The test, retest and combined ICC showed excellent agreement for the cadence for all speeds (Table 3) and for the stance time at 7 and 10 km/h (Table 3); the stance time at 13 km/h showed moderate agreement when test and retest were combined, with poor agreement on the test and good agreement on the retest (Table 3). Bland–Altman plots revealed no clear dependence of the difference on the mean (Figure 6a,c).

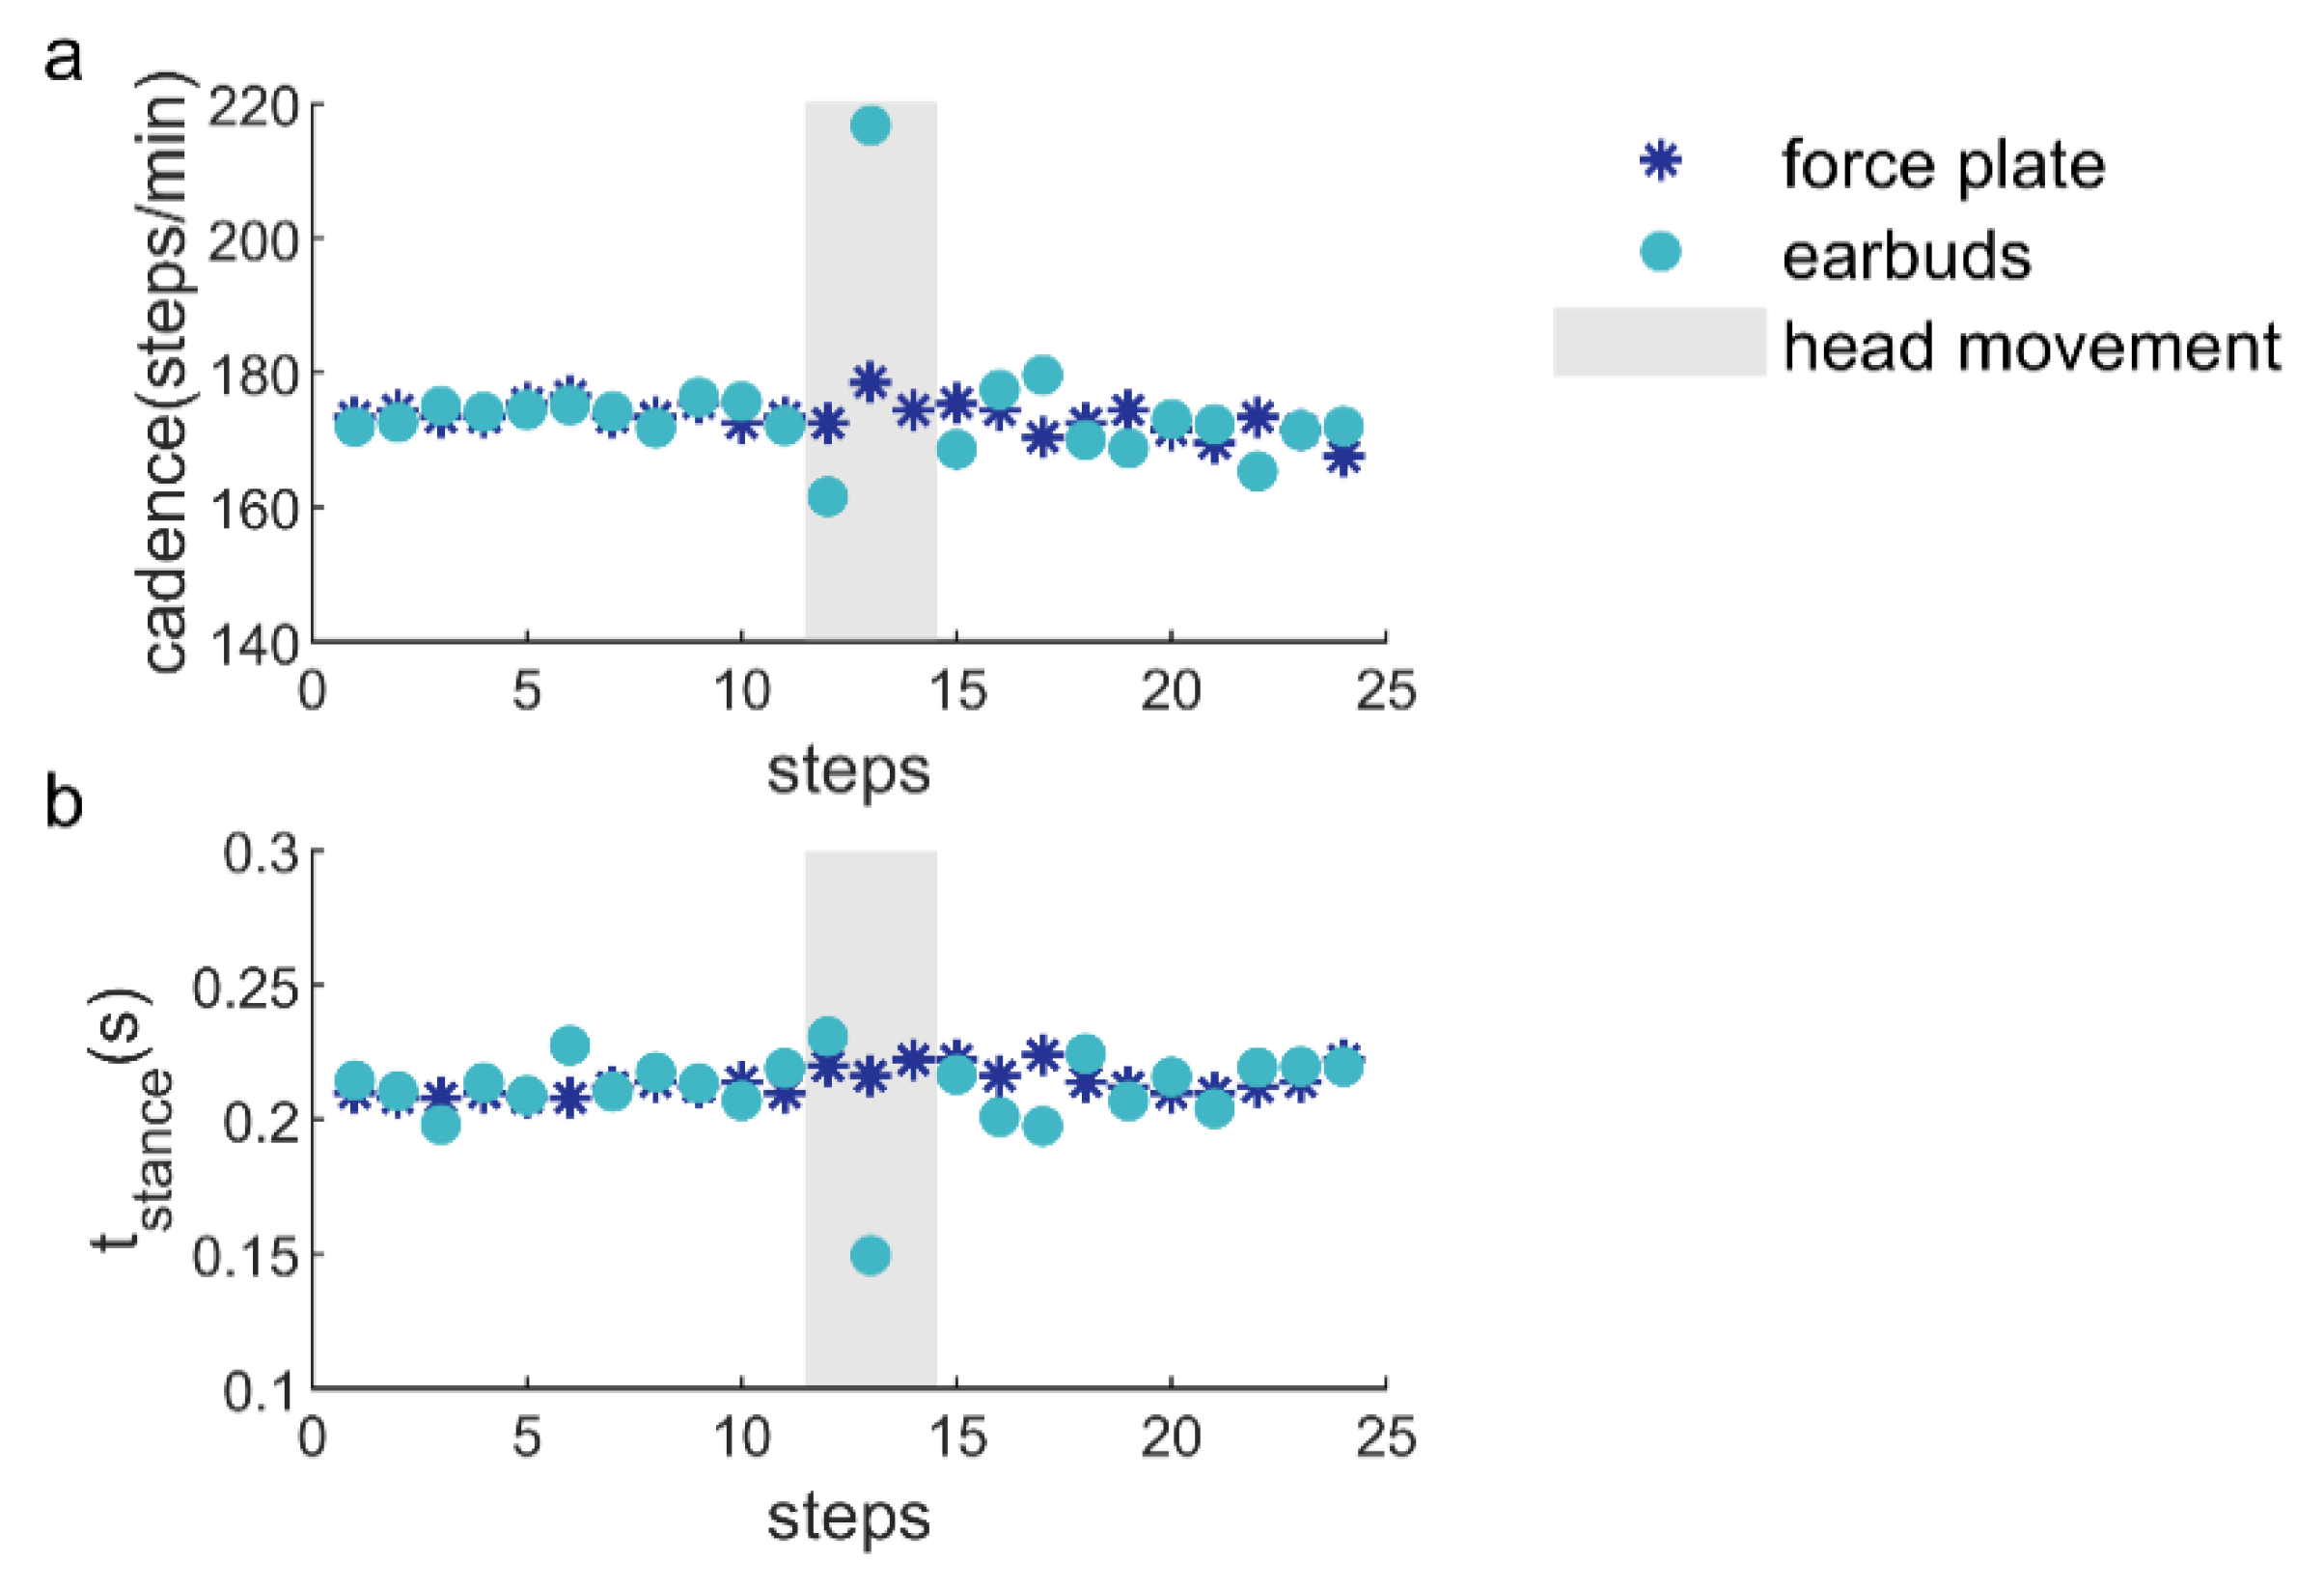
3.4. Between Methods Agreement: Instructed Head-Movement Conditions

The between-methods bias was not significant for both cadence and stance time for all head movements (Table 4; Figure 6b,d). The ICC showed excellent agreement for cadence for all head movements (Table 4), and for stance time for all head movements except shaking the head, for which the agreement was good (Table 4). The Bland–Altman plots also revealed that the difference between the methods was largest for the instruction to shake the head (Figure 6d).

4. Discussion

In this study, we determined cadence and stance time from accelerometer data collected in an earbud (new method) and force-plate data (well-established method) for a range of running speeds. For both methods, we assessed the test–retest reliability per speed condition and face validity over speed conditions (i.e., does cadence increase and stance time decrease with increasing speed?). In addition, concurrent validity was assessed by determining the between-methods agreement of cadence and stance time for the different speeds, as well as for a variety of instructed head-movements performed at a comfortable running speed. The test–retest reliability was good to excellent for both earbud and force-plate methods for both cadence and stance time, with similar limits of agreement. Face validity was also good—with significant differences in cadence and stance time with running speed in to-be-expected directions [35]—for both methods. We found excellent between-methods agreement for the cadence determined over the range of speeds and during the instructed head movements. The between-methods agreement for the stance time was good-to-excellent, with the agreement being less good for 13 km/h and while shaking the head. For the retest at 7 km/h, the between-methods bias in stance time was significant, although small (8 ms), while the corresponding agreement was excellent (Table 3).
Although both test–retest reliability and between-methods agreement were excellent, the limits of agreement for cadence for between-methods differences were considerably smaller than for test–retest differences within the methods (about three times; compare Figure 6a with Figure 5a,b, respectively). Variations found in test–retest reliability can partly be attributed to the variation in the performance of the participant [40], especially given the similarity in the limits of agreement and ICC for the test and retest assessments of the earbud and force-plate methods (Figure 5a,b). These results indicate that the two methods can be used interchangeably to measure running cadence over a range of speeds.
For the stance time, the limits of agreement were not smaller for the between-methods agreement compared to the test–retest reliability, although the limits of agreement on the test–retest comparisons were still similar for the earbud and force-plate methods (Figure 5c,d). It should be noted that the stance time, as calculated from the force-plate data, is dependent on the chosen threshold. Different thresholds are used in the literature (e.g., set thresholds [1,12,13,41], weight-dependent thresholds [39], or variability-dependent thresholds [2]). A higher force-plate threshold leads to systematically shorter stance times and vice versa, which would influence the bias between the force-plate and earbud data. In this study, we chose to use a weight-dependent threshold in view of the large weight differences between participants, which could have influenced event detection when using a set threshold. Future research should further examine the effects of threshold choice in force plate-based gait analysis and, ideally, culminate in evidence-based guidelines.
Overall, the between-methods comparisons yielded similar agreements for the different speeds and the different instructed head movements, indicating that incidental head movements did not have a substantive impact on the derived cadences and stance times. For this study, we calculated the mean cadence/stance time over a certain time window. For the instructed head movements, this meant the mean cadence/stance time for a window of 10 s around the head movement. Some of the instructed head movements, in particular the head shake, tended to cause errors in the earbud-based cadence/stance time estimates for the steps during which the particular head movement was performed, but not for the other steps (Figure 7). The size of the window over which the mean is taken will influence the impact of errors in cadence/stance time associated with incidental head movements. If this is found to be a problem, using measures that are less sensitive to outliers, such as the median, will further limit the impact of incidental head movements on calculated variables.
The relative differences found in cadence and stance time between the two methods are similar to the relative differences found in some previous studies that validated the use of ear-worn sensors in walking [31,34], and smaller than in other studies [32]. Our results extend the finding that ear-worn sensors can be used for gait analysis during walking to running, thus broadening the applicability of this type of sensors.
In conclusion, our results showed that cadence and stance time during running can be derived reliably from instrumented wireless earbuds equipped with an accelerometer, with good face validity and concurrent validity. Combined with the previously mentioned advantage of having a practical sensor location and the possibility to provide on-line auditory instructions or feedback, such as pacing to modulate cadence [23] and impact forces [42], instrumented earbuds may become a promising alternative to currently used wearable systems and the earbuds could even be developed into a promising all-in-one feedback device for both treadmill and outdoor running. A follow-up study comparing cadence and stance times derived using the earbud method to results obtained via a different validated method that is suitable for deriving cadence and stance times outdoors is recommended to substantiate this promise. Aspects of running outdoors that could be considered are speed variability and higher inter-step variability due to turns, uneven terrain and obstacles, and impact differences due to surface characteristics [43].

Supplementary Materials

The data are available online at https://www.mdpi.com/article/10.3390/s21237995/s1.

Author Contributions

Conceptualization, A.N., P.J.B. and M.R.; Data curation, A.N.; Formal analysis, A.N.; Funding acquisition, P.J.B.; Investigation, A.N.; Methodology, A.N., P.J.B. and M.R.; Project administration, A.N. and P.J.B.; Resources, P.J.B.; Software, A.N.; Supervision, P.J.B. and M.R.; Validation, A.N. and M.R.; Visualization, A.N. and M.R.; Writing—original draft, A.N.; Writing—review and editing, A.N., P.J.B. and M.R. All authors have read and agreed to the published version of the manuscript.

Funding

Research was funded by the Dutch Research Council (NWO), Domain Applied and Engineering Sciences, grant number P16–28 Project 3.

Institutional Review Board Statement

The study was conducted according to the guidelines of the Declaration of Helsinki and approved by the Scientific and Ethical Review Board of the Faculty of Behavioural and Movement Sciences of the Vrije Universiteit Amsterdam (VCWE-2019-006R1).

Informed Consent Statement

Informed consent was obtained from all participants involved in the study.

Data Availability Statement

The data presented in this study are available in the Supplementary Materials: Datafiles.

Acknowledgments

The authors would like to thank Bert Clairbois and Bert Stek for technical support, and Ben van Oeveren for his suggestions on the study design.

Conflicts of Interest

The authors declare no conflict of interest. The funders had no role in the design of the study; in the collection, analyses, or interpretation of data; in the writing of the manuscript, or in the decision to publish the results.

References

  1. Kluitenberg, B.; Bredeweg, S.W.; Zijlstra, S.; Zijlstra, W.; Buist, I. Comparison of vertical ground reaction forces during overground and treadmill running. A validation study. BMC Musculoskelet. Disord. 2012, 13, 235. [Google Scholar] [CrossRef] [Green Version]
  2. Tesio, L.; Rota, V. Gait analysis on split-belt force treadmills: Validation of an instrument. Am. J. Phys. Med. Rehabil. 2008, 87, 515–526. [Google Scholar] [CrossRef] [PubMed]
  3. van Ingen Schenau, G.J. Some fundamental aspects of the biomechanics of overground versus treadmill locomotion. Med. Sci. Sports Exerc. 1980, 12, 257–261. [Google Scholar] [CrossRef] [PubMed]
  4. Bailey, J.; Mata, T.; Mercer, J.A. Is the relationship between stride length, frequency, and velocity influenced by running on a treadmill or overground? Int. J. Exerc. Sci. 2017, 10, 1067–1075. [Google Scholar] [PubMed]
  5. Roerdink, M.; de Jonge, C.P.; Smid, L.M.; Daffertshofer, A. Tightening up the control of treadmill walking: Effects of maneuverability range and acoustic pacing on stride-to-stride fluctuations. Front. Physiol. 2019, 10, 257. [Google Scholar] [CrossRef] [PubMed]
  6. Benson, L.C.; Clermont, C.A.; Ferber, R. New considerations for collecting biomechanical data using wearable sensors: The effect of different running environments. Front. Bioeng. Biotechnol. 2020, 8, 86. [Google Scholar] [CrossRef] [PubMed] [Green Version]
  7. Alahakone, A.U.; Senanayake, S.M.N.A.; Senanayake, C.M. Smart wearable device for real time gait event detection during running. In Proceedings of the IEEE Asia-Pacific Conference on Circuits Systems, Kuala Lumpur, Malaysia, 6–9 December 2010; pp. 612–615. [Google Scholar]
  8. Lee, J.A.; Cho, S.H.; Lee, Y.J.; Yang, H.K.; Lee, J.W. Portable activity monitoring system for temporal parameters of gait cycles. J. Med. Syst. 2010, 34, 959–966. [Google Scholar] [CrossRef] [PubMed]
  9. Lee, J.B.; Mellifont, R.B.; Burkett, B.J. The use of a single inertial sensor to identify stride, step, and stance durations of running gait. J. Sci. Med. Sport 2010, 13, 270–273. [Google Scholar] [CrossRef]
  10. O’Donovan, K.J.; Greene, B.R.; McGrath, D.; O’Neill, R.; Burns, A.; Caulfield, B. SHIMMER: A new tool for temporal gait analysis. In Proceedings of the 31st Annual International Conference of the IEEE Engineering in Medicine and Biology Society, Minneapolis, MN, USA, 3–6 September 2009; pp. 3826–3829. [Google Scholar]
  11. Willy, R.W. Innovations and pitfalls in the use of wearable devices in the prevention and rehabilitation of running related injuries. Phys. Ther. Sport 2018, 29, 26–33. [Google Scholar] [CrossRef]
  12. Mo, S.; Chow, D.H.K. Accuracy of three methods in gait event detection during overground running. Gait Posture 2018, 59, 93–98. [Google Scholar] [CrossRef]
  13. Benson, L.C.; Clermont, C.A.; Watari, R.; Exley, T.; Ferber, R. Automated accelerometer-based gait event detection during multiple running conditions. Sensors 2019, 19, 1483. [Google Scholar] [CrossRef] [Green Version]
  14. van den Berghe, P.; Six, J.; Gerlo, J.; Leman, M.; De Clercq, D. Validity and reliability of peak tibial accelerations as real-time measure of impact loading during over-ground rearfoot running at different speeds. J. Biomech. 2019, 86, 238–242. [Google Scholar] [CrossRef] [PubMed]
  15. Jensen, M.M.; Mueller, F.F. Running with technology: Where are we heading? In Proceedings of the 26th Australian Computer-Human Interaction Conference on Designing Futures: The Future of Design, Sydney, Australia, 2–5 December 2014; pp. 527–530. [Google Scholar]
  16. Kuru, A. Exploring experience of runners with sports tracking technology. Int. J. Hum. Comput. Interact. 2016, 32, 847–860. [Google Scholar] [CrossRef]
  17. Clermont, C.A.; Duffett-Leger, L.; Hettinga, B.A.; Ferber, R. Runners’ perspectives on ‘smart’ wearable technology and its use for preventing injury. Int. J. Hum. Comput. Interact. 2020, 36, 31–40. [Google Scholar] [CrossRef]
  18. Lucas-Cuevas, A.G.; Encarnación-Martínez, A.; Camacho-García, A.; Llana-Belloch, S.; Pérez-Soriano, P. The location of the tibial accelerometer does influence impact acceleration parameters during running. J. Sports Sci. 2017, 35, 1734–1738. [Google Scholar] [CrossRef] [PubMed]
  19. Eitzen, I.; Renberg, J.; Faerevik, H. The use of wearable sensor technology to detect shock impacts in sports and occupational settings: A scoping review. Sensors 2021, 21, 4962. [Google Scholar] [CrossRef] [PubMed]
  20. Atallah, L.; Lo, B.; King, R.; Yang, G.Z. Sensor positioning for activity recognition using wearable accelerometers. IEEE Trans. Biomed. Circuits Syst. 2011, 5, 320–329. [Google Scholar] [CrossRef] [PubMed]
  21. van Oeveren, B.T.; de Ruiter, C.J.; Beek, P.J.; Rispens, S.M.; van Dieën, J.H. An adaptive, real-time cadence algorithm for unconstrained sensor placement. Med. Eng. Phys. 2018, 52, 49–58. [Google Scholar] [CrossRef] [Green Version]
  22. Seuter, M.; Pfeiffer, M.; Bauer, G.; Zentgraf, K.; Kray, C. Running with technology: Evaluating the impact of interacting with wearable devices on running movement. Proc. ACM Interact. Mob. Wearable Ubiquitous Technol. 2017, 1, 1–17. [Google Scholar] [CrossRef]
  23. Nijs, A.; Roerdink, M.; Beek, P.J. Cadence modulation in walking and running: Pacing steps or strides? Brain Sci. 2020, 10, 273. [Google Scholar] [CrossRef]
  24. Lorenzoni, V.; van den Berghe, P.; Maes, P.J.; de Bie, T.; de Clercq, D.; Leman, M. Design and validation of an auditory biofeedback system for modification of running parameters. J. Multimodal User Interfaces 2019, 13, 167–180. [Google Scholar] [CrossRef]
  25. van den Berghe, P.; Lorenzoni, V.; Derie, R.; Six, J.; Gerlo, J.; Leman, M.; De Clercq, D. Music-based biofeedback to reduce tibial shock in over-ground running: A proof-of-concept study. Sci. Rep. 2021, 11, 4091. [Google Scholar] [CrossRef]
  26. van Hooren, B.; Goudsmit, J.; Restrepo, J.; Vos, S. Real-time feedback by wearables in running: Current approaches, challenges and suggestions for improvements. J. Sport. Sci. 2019, 38, 214–230. [Google Scholar] [CrossRef] [PubMed]
  27. Forner-Cordero, A.; Mateu-Arce, M.; Forner-Cordero, I.; Alcántara, E.; Moreno, J.C.; Pons, J.L. Study of the motion artefacts of skin-mounted inertial sensors under different attachment conditions. Physiol. Meas. 2008, 29, N21. [Google Scholar] [CrossRef]
  28. Menz, H.B.; Lord, S.R.; Fitzpatrick, R.C. Acceleration patterns of the head and pelvis when walking on level and irregular surfaces. Gait Posture 2003, 18, 35–46. [Google Scholar] [CrossRef]
  29. Atallah, L.; Lo, B.; Yang, G.; Aziz, O. Detecting walking gait impairment with an ear-worn sensor. In Proceedings of the 6th International Workshop on Wearable and Implantable Body Sensor Networks, Berkeley, CA, USA, 3–5 June 2009. [Google Scholar]
  30. Burgos, C.P.; Gartner, L.; Ballester, M.A.G.; Noailly, J.; Stocker, F.; Schonfelder, M.; Adams, T.; Tassani, S. In-ear accelerometer-based sensor for gait classification. IEEE Sens. J. 2020, 20, 12895–12902. [Google Scholar] [CrossRef]
  31. Atallah, L.; Wiik, A.; Lo, B.; Cobb, J.P.; Amis, A.; Yang, G.Z. Gait asymmetry detection in older adults using a light ear-worn sensor. Physiol. Meas. 2014, 35, N29–N40. [Google Scholar] [CrossRef] [PubMed]
  32. Atallah, L.; Wiik, A.; Jones, G.G.; Lo, B.; Cobb, J.P.; Amis, A.; Yang, G.Z. Validation of an ear-worn sensor for gait monitoring using a force-plate instrumented treadmill. Gait Posture 2012, 35, 674–676. [Google Scholar] [CrossRef] [Green Version]
  33. Hwang, T.; Reh, J.; Effenberg, A.O.; Blume, H. Real-time gait analysis using a single head-worn inertial measurement unit. IEEE Trans. Consum. Electron. 2018, 64, 240–248. [Google Scholar] [CrossRef]
  34. Jarchi, D.; Wong, C.; Kwasnicki, R.M.; Heller, B.; Tew, G.A.; Yang, G.Z. Gait parameter estimation from a miniaturized ear-worn sensor using singular spectrum analysis and longest common subsequence. IEEE Trans. Biomed. Eng. 2014, 61, 1261–1273. [Google Scholar] [CrossRef]
  35. van Oeveren, B.T.; de Ruiter, C.J.; Beek, P.J.; van Dieën, J.H. The biomechanics of running and running styles: A synthesis. Sports Biomech. 2021. [Google Scholar] [CrossRef] [PubMed]
  36. Neptune, R.R.; Sasaki, K. Ankle plantar flexor force production is an important determinant of the preferred walk-to-run transition speed. J. Exp. Biol. 2005, 208, 799–808. [Google Scholar] [CrossRef] [Green Version]
  37. Koo, T.K.; Li, M.Y. A guideline of selecting and reporting intraclass correlation coefficients for reliability research. J. Chiropr. Med. 2016, 15, 155–163. [Google Scholar] [CrossRef] [Green Version]
  38. Bland, J.M.; Altman, D.G. Measuring agreement in method comparison studies. Stat. Methods Med. Res. 1999, 8, 135–160. [Google Scholar] [CrossRef]
  39. Timmermans, C.; Cutti, A.G.; van Donkersgoed, H.; Roerdink, M. Gaitography on lower-limb amputees: Repeatability and between-methods agreement. Prosthet. Orthot. Int. 2019, 43, 71–79. [Google Scholar] [CrossRef] [Green Version]
  40. Morgan, D.W.; Martin, P.E.; Krahenbuhl, G.S.; Baldini, F.D. Variability in running economy and mechanics among trained male runners. Med. Sci. Sports Exerc. 1991, 23, 378–383. [Google Scholar] [CrossRef] [PubMed]
  41. Riley, P.O.; Paolini, G.; Della Croce, U.; Paylo, K.W.; Kerrigan, D.C. A kinematic and kinetic comparison of overground and treadmill walking in healthy subjects. Gait Posture 2007, 26, 17–24. [Google Scholar] [CrossRef]
  42. Nijs, A.; Roerdink, M.; Beek, P.J. Effects of acoustically paced cadence modulation on impact forces in running. Gait Posture 2021, 90, 234–238. [Google Scholar] [CrossRef] [PubMed]
  43. Dixon, S.J.; Collop, A.C.; Batt, M.E. Surface effects on ground reaction forces and lower extremity kinematics in running. Med. Sci. Sports Exerc. 2000, 32, 1919–1926. [Google Scholar] [CrossRef] [Green Version]
Figure 1. Instrumented treadmill. (a) The instrumented treadmill and the coordinate system of the embedded force plates. (b) The instrumented treadmill during a measurement.
Sensors 21 07995 g001
Figure 2. Instrumented wireless earbud. (a) Three earbuds with differently sized attachments. (b) The coordinate system of the accelerometer in the earbud. (c) The snugly fit earbud in the ear.
Sensors 21 07995 g002
Figure 3. Example of representative data and an overview of the event detection. (a) The vertical ground reaction force (GRFz), the threshold (horizontal dotted line) and the instants of foot off and foot strike (vertical blue lines). (b) The root sum square of the acceleration data (RSS acc, solid black line) and the velocity (dashed grey line) during one second of running. (c) The velocity and its negative zero crossings (mid-flight, grey dotted vertical lines). (d) The root sum square of the acceleration data and the width of the horizontal sections (grey horizontal lines) around each mid-flight. (e) The root sum square of the acceleration data (RSS acc, solid black line) during two seconds of running. The vertical blue lines indicate instants of foot off and foot strike.
Sensors 21 07995 g003
Figure 4. Mean and standard deviation of cadence (a,b) and stance time (c,d) for the two methods for test and retest for the different speed conditions (a,c) and for the head-movement conditions (b,d).
Sensors 21 07995 g004
Figure 5. Bland–Altman plots comparing the test and retest data for the earbud (a,c) and the force-plate (b,d). Each dot represents the test–retest combination for one participant at a particular speed.
Sensors 21 07995 g005
Figure 6. Bland–Altman plots showing the agreement of cadence (a,b) and stance time (c,d) between earbud and force-plate methods for the different speed conditions (test and retest combined; (a,c)) and the head-movement conditions (b,d).
Sensors 21 07995 g006
Figure 7. Example of a representative part of the instructed head-movement trial for a single participant for the head-movement condition ‘shake’, with step-based estimates of cadence (a) and stance time (b), over which the means were calculated. The shaded area represents steps with head shakes.
Sensors 21 07995 g007
Table 1. Head-movement conditions, performed in random order in a single trial.
Instructed Head MovementsExplanation of the Instructions
Look upRotate the head upwards to look toward the ceiling for a second
Look downRotate the head downwards to look toward the floor for a second
Shake your headRotate the head sideways to both sides quickly for a few repetitions
Nod Rotate the head vertically up and down quickly for a few repetitions
Look at a bird flying by on the leftRotate the head diagonally in a slight upward direction to the left for a second
Look at a bird flying by on the rightRotate the head diagonally in a slight upward direction to the right for a second
Look at the time/check your watch (wrist)Move your preferred arm in front of your body and look down towards your wrist, as if you were to check the time on a watch
Table 2. Means, standard deviations and test–retest reliability of the cadence and stance time as measured with the earbud and force-plate methods.
Speed (km/h)Test Retest
MSDMSDbiasSDt(df)pICC
Earbuds
Cadence7156.5011.01155.1510.74−1.353.19t(12) = −1.530.150.953
(steps/min)10166.559.72165.779.10−0.782.22t(11) = −1.220.250.971
13171.558.29171.218.31−0.493.01t(7) = −0.460.660.946
max175.8614.83174.4413.97−1.423.38N = 3
Stance time70.2660.0270.2660.0270.0000.008t(10) = 0.020.990.960
(s)100.2280.0260.2270.022−0.0010.007t(11) = −0.480.640.960
130.2050.0150.2000.015−0.0050.008t(7) = −1.730.130.817
max0.1870.0220.1880.0180.0010.006N = 3
Force plate
Cadence7156.4711.01155.1310.83−1.343.27t(12) = −1.480.170.951
(steps/min)10166.549.76165.809.14−0.742.20t(11) = −1.170.270.972
13171.398.38171.138.34−0.262.91t(8) = −0.270.790.945
max180.0814.96178.9814.62−1.102.83N = 4
Stance time70.2710.0340.2740.0350.0030.011t(10) = 1.000.340.953
(s)100.2260.0230.2270.0190.0010.006t(11) = 0.450.670.956
130.2030.0170.2000.015−0.0020.006t(8) = −1.130.290.938
max0.1750.0070.1770.0080.0020.005N = 4
Table 3. Between-methods bias and agreement of cadence and stance time between earbud and force-plate methods for the speed conditions (bias = earbud − force plate).
Speed (km/h) Force plateEarbud
MSDMSDbiasSDt(df)pICC
Cadence (steps/min)7Test156.4711.01156.5011.010.100.28t(13) = 1.320.211.000
Retest155.1310.83155.1510.740.020.17t(12) = 0.530.611.000
Combined156.3710.59156.4710.610.090.27t(13) = 1.330.211.000
10Test166.549.76166.559.720.020.18t(11) = 0.320.761.000
Retest165.809.14165.779.10−0.020.14t(11) = −0.590.571.000
Combined166.179.39166.169.35−0.000.14t(11) = −0.090.931.000
13Test171.398.38172.528.300.050.21t(7) = 0.630.551.000
Retest171.138.34172.038.480.080.27t(8) = 0.840.430.999
Combined171.268.23171.428.130.160.38t(8) = 1.270.240.999
maxTest180.0814.96175.8614.831.281.99N = 5
Retest178.9814.62174.4413.970.070.15N = 3
Combined181.3313.37182.6314.391.292.01N = 5
Stance time (s)7Test0.2730.0330.2680.027−0.0040.011t(11) = −1.400.190.933
Retest0.2740.0350.2660.027−0.0080.010t(10) = −2.770.020.924
Combined0.2740.0330.2680.027−0.0060.010t(11) = −2.020.070.933
10Test0.2260.0230.2280.0260.0020.009t(11) = 0.730.480.940
Retest0.2270.0190.2270.0220.0000.009t(11) = 0.010.990.916
Combined0.2270.0210.2270.0240.0010.008t(11) = −0.480.710.934
13Test0.1980.0110.2050.0150.0070.016t(7) = 1.290.240.212
Retest0.2000.0150.2040.0190.0040.010t(8) = 1.220.260.825
Combined0.2010.0160.2070.0170.0050.012t(8) = 1.290.230.732
maxTest0.1750.0060.1820.0200.0070.022N = 5
Retest0.1810.0020.1880.0170.0070.020N = 3
Combined0.1760.0060.1820.0190.0070.021N = 5
Table 4. Agreement of the cadence and stance time between the force-plate and earbud methods for the head-movement conditions.
Head
Movements
Force PlateEarbud
MSDMSDbiasSDt(df)pICC
CadenceUp164.328.45164.318.32−0.010.34t(12) = −0.070.940.999
Down163.438.39163.338.28−0.090.47t(12) = −0.710.490.998
Shake163.928.04162.948.43−0.981.96t(12) = −1.800.100.967
Nod163.748.19163.768.320.020.42t(12) = 0.170.870.999
Bird left163.608.19163.708.200.090.27t(12) = 1.310.220.999
Bird right164.217.35164.267.190.050.31t(12) = 0.580.580.999
Check watch163.947.70163.917.60−0.040.42t(12) = −0.310.760.999
Stance timeUp0.2420.0350.2390.030−0.0030.009t(12) = −1.310.220.962
Down0.2450.0340.2440.029−0.0020.008t(12) = −0.700.500.970
Shake0.2430.0340.2540.0450.0100.020t(12) = 1.860.090.855
Nod0.2440.0370.2400.031−0.0040.009t(12) = −1.410.180.958
Bird left0.2450.0340.2420.029−0.0020.009t(12) = −1.030.320.962
Bird right0.2450.0340.2420.028−0.0030.009t(12) = −1.160.270.954
Check watch0.2440.0330.2410.028−0.0030.009t(12) = −1.060.310.957
Publisher’s Note: MDPI stays neutral with regard to jurisdictional claims in published maps and institutional affiliations.

