Automated Sensing System for Real-Time Recognition of Trucks in River Dredging Areas Using Computer Vision and Convolutional Deep Learning


Abstract
:1. Introduction
2. Literature Review
2.1. ArtificiaI Intelligence (AI) Technologies for Smart Construction Sites
2.2. Automated Monitoring Systems to Construction Management
2.3. Deep Learning for Vehicle License Plate Recognition
3. Research Methods
3.1. Deep Learning Algorithms
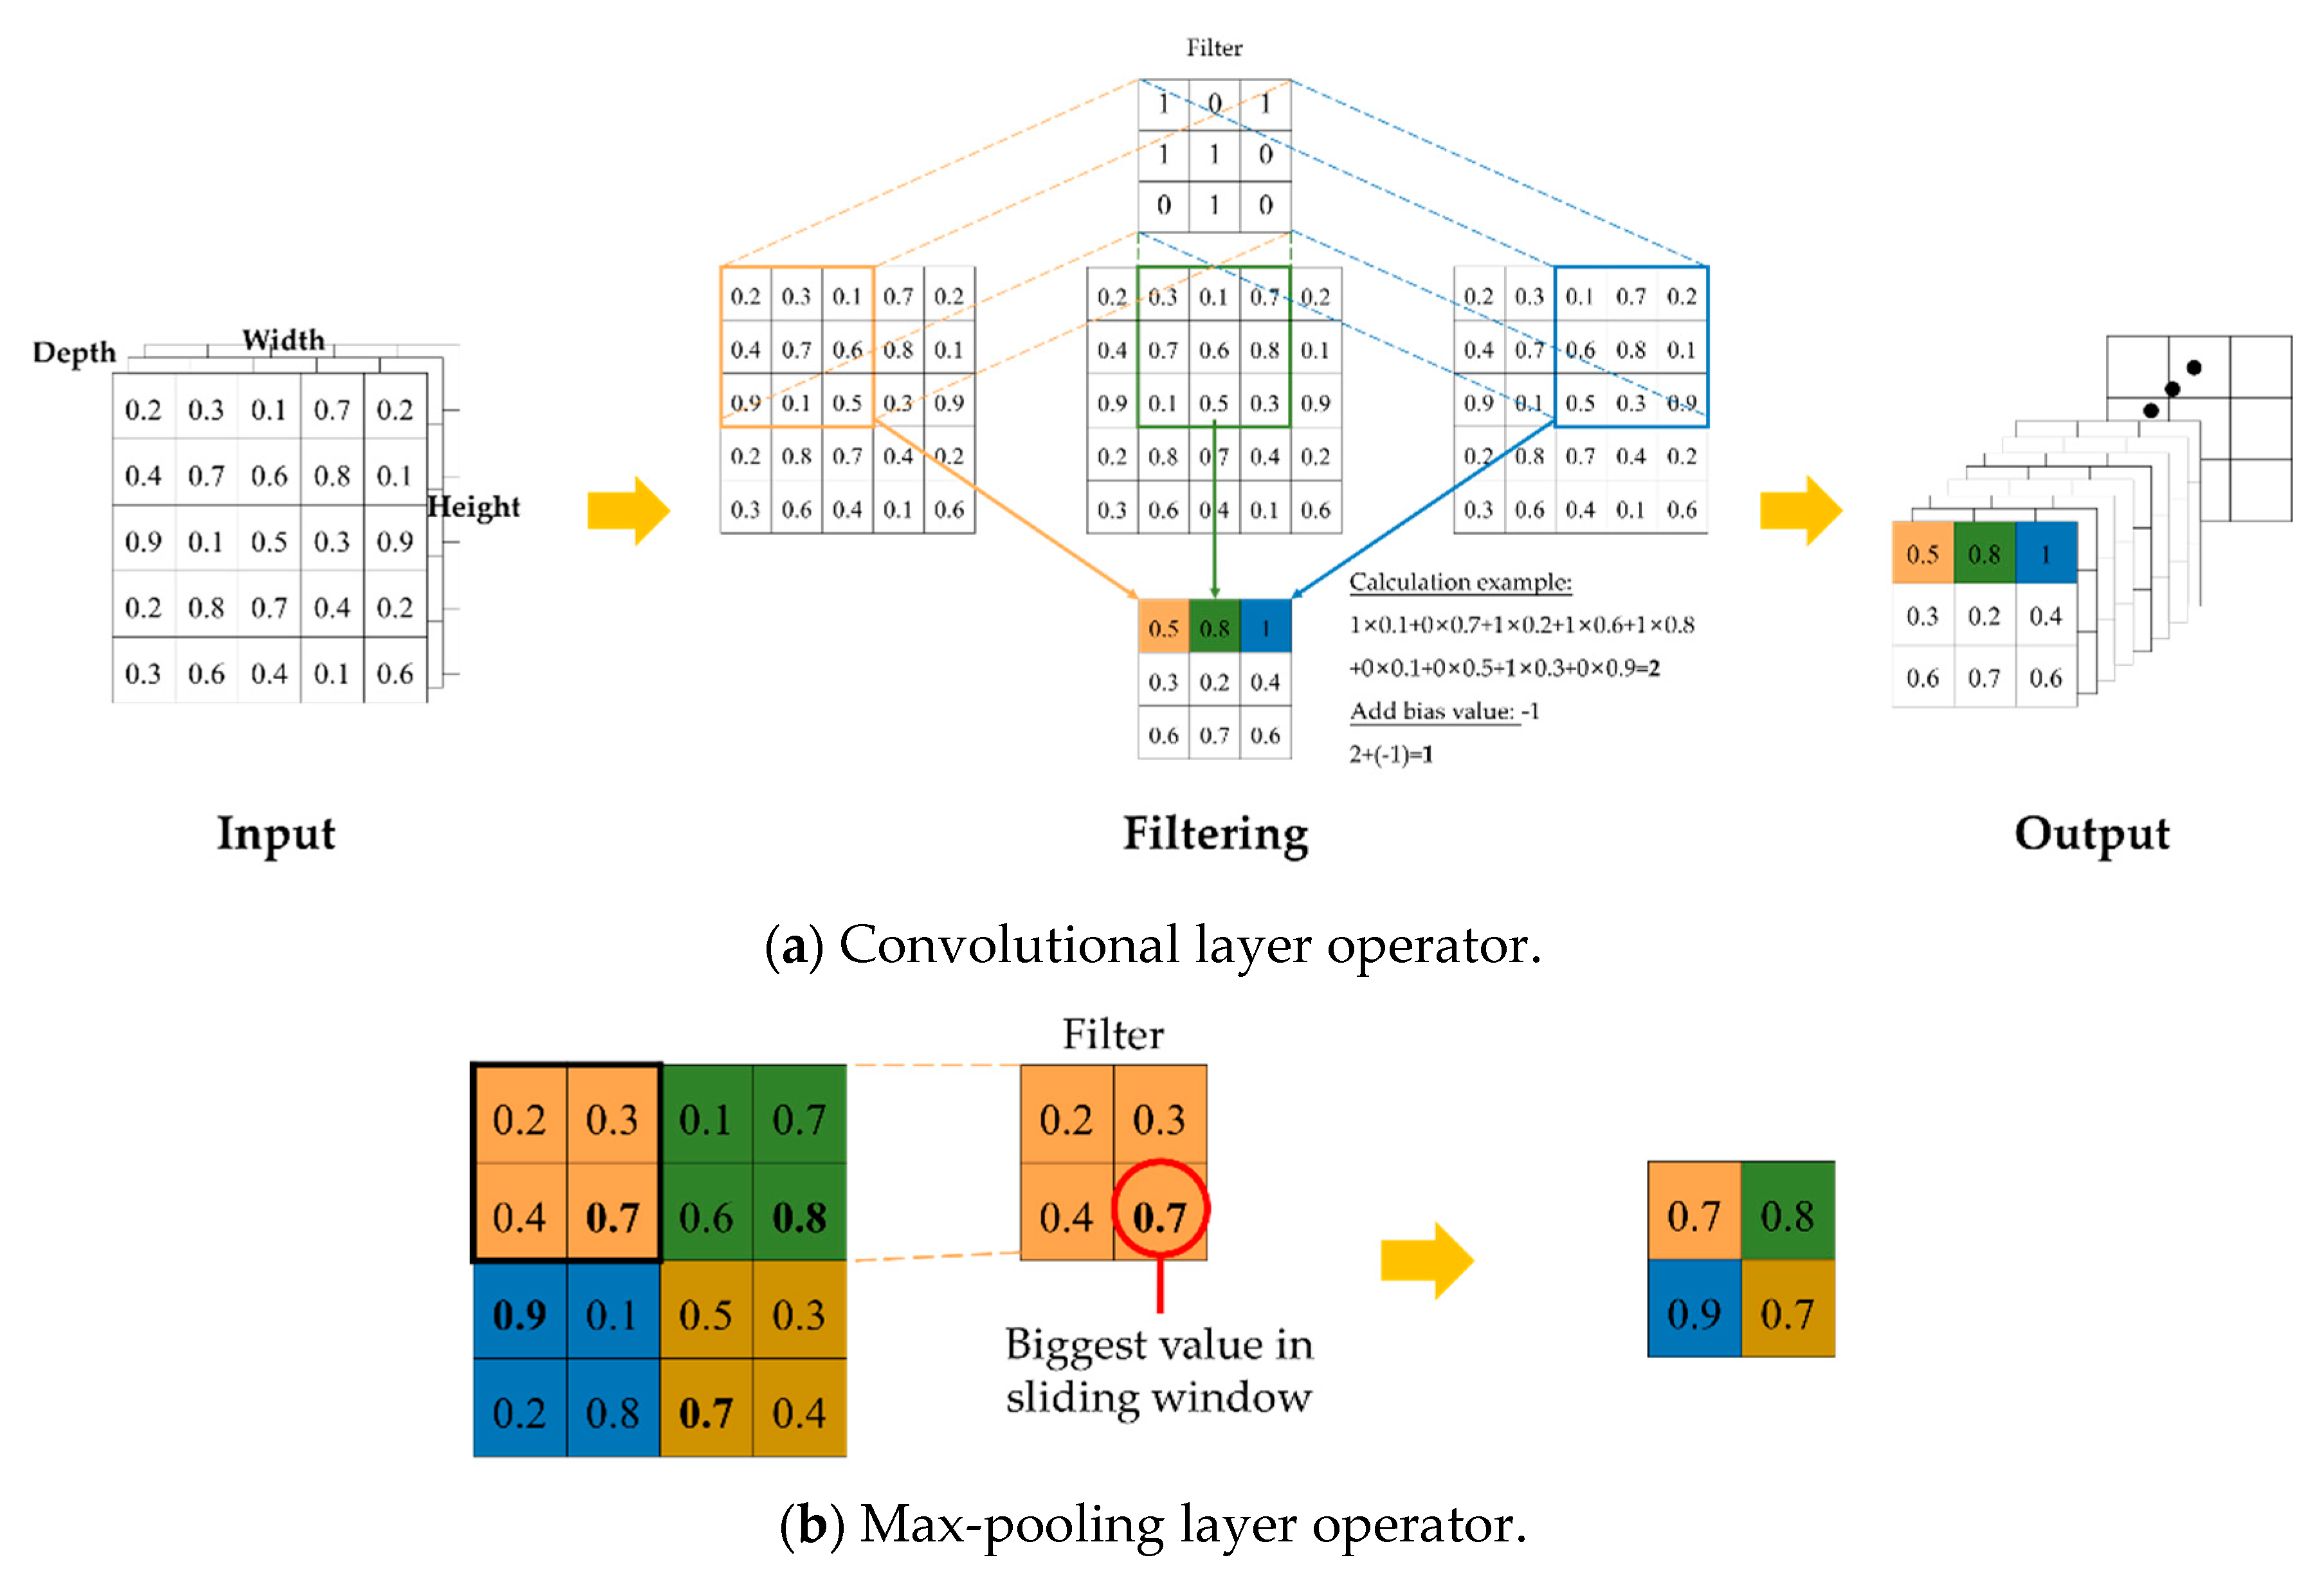
3.1.1. Convolutional Neural Network
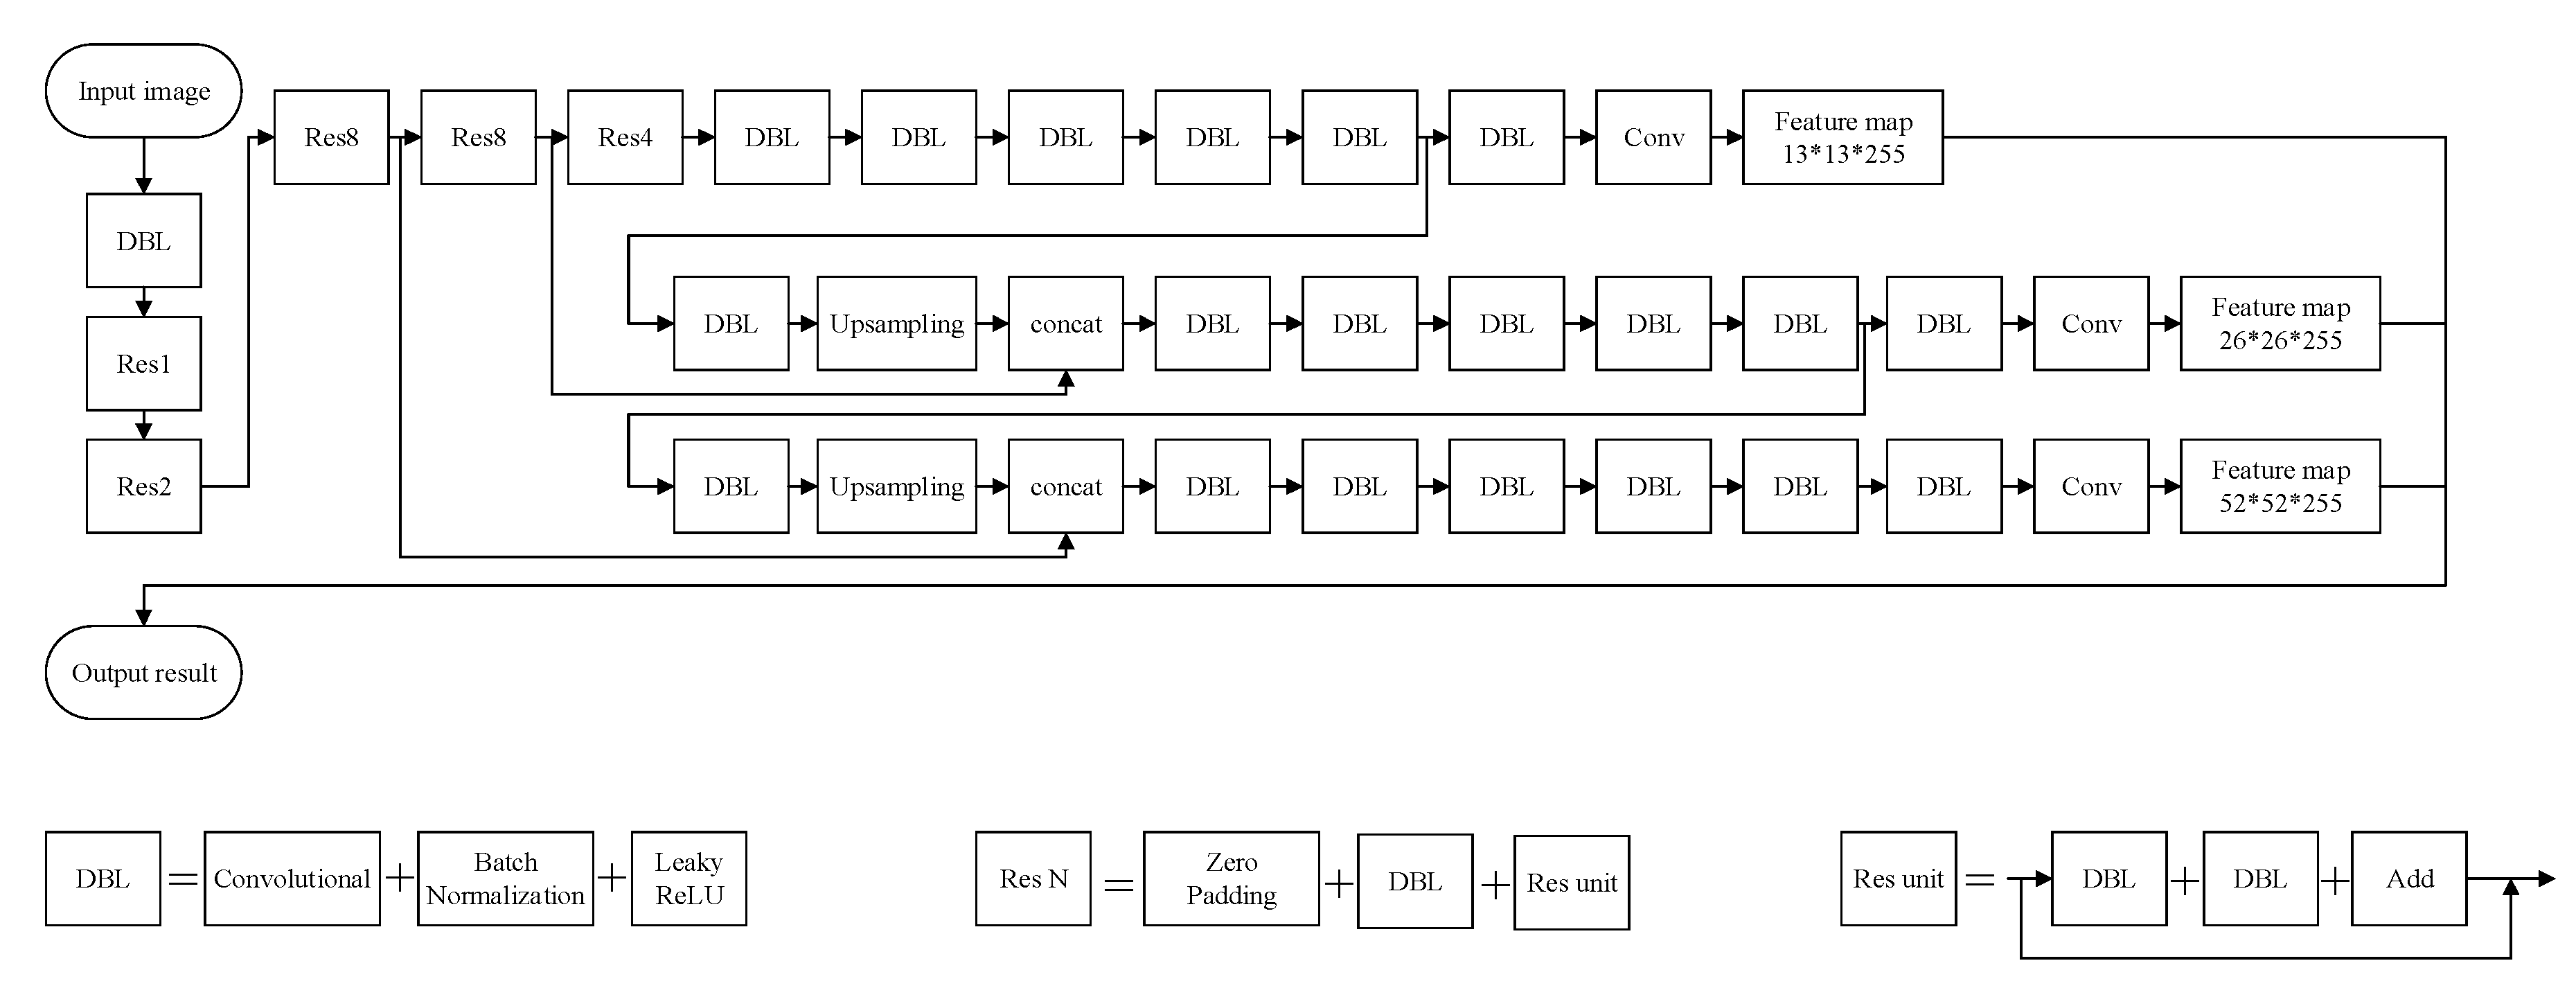
3.1.2. You Only Look Once
3.1.3. CNN-L3
3.1.4. Network Structure for Simple Solver of Railway Captcha for the Taiwan Railways Administration
3.1.5. Visual Geometry Group 16 (VGG16)
3.2. Criteria for Validating the Model and Assessing Errors
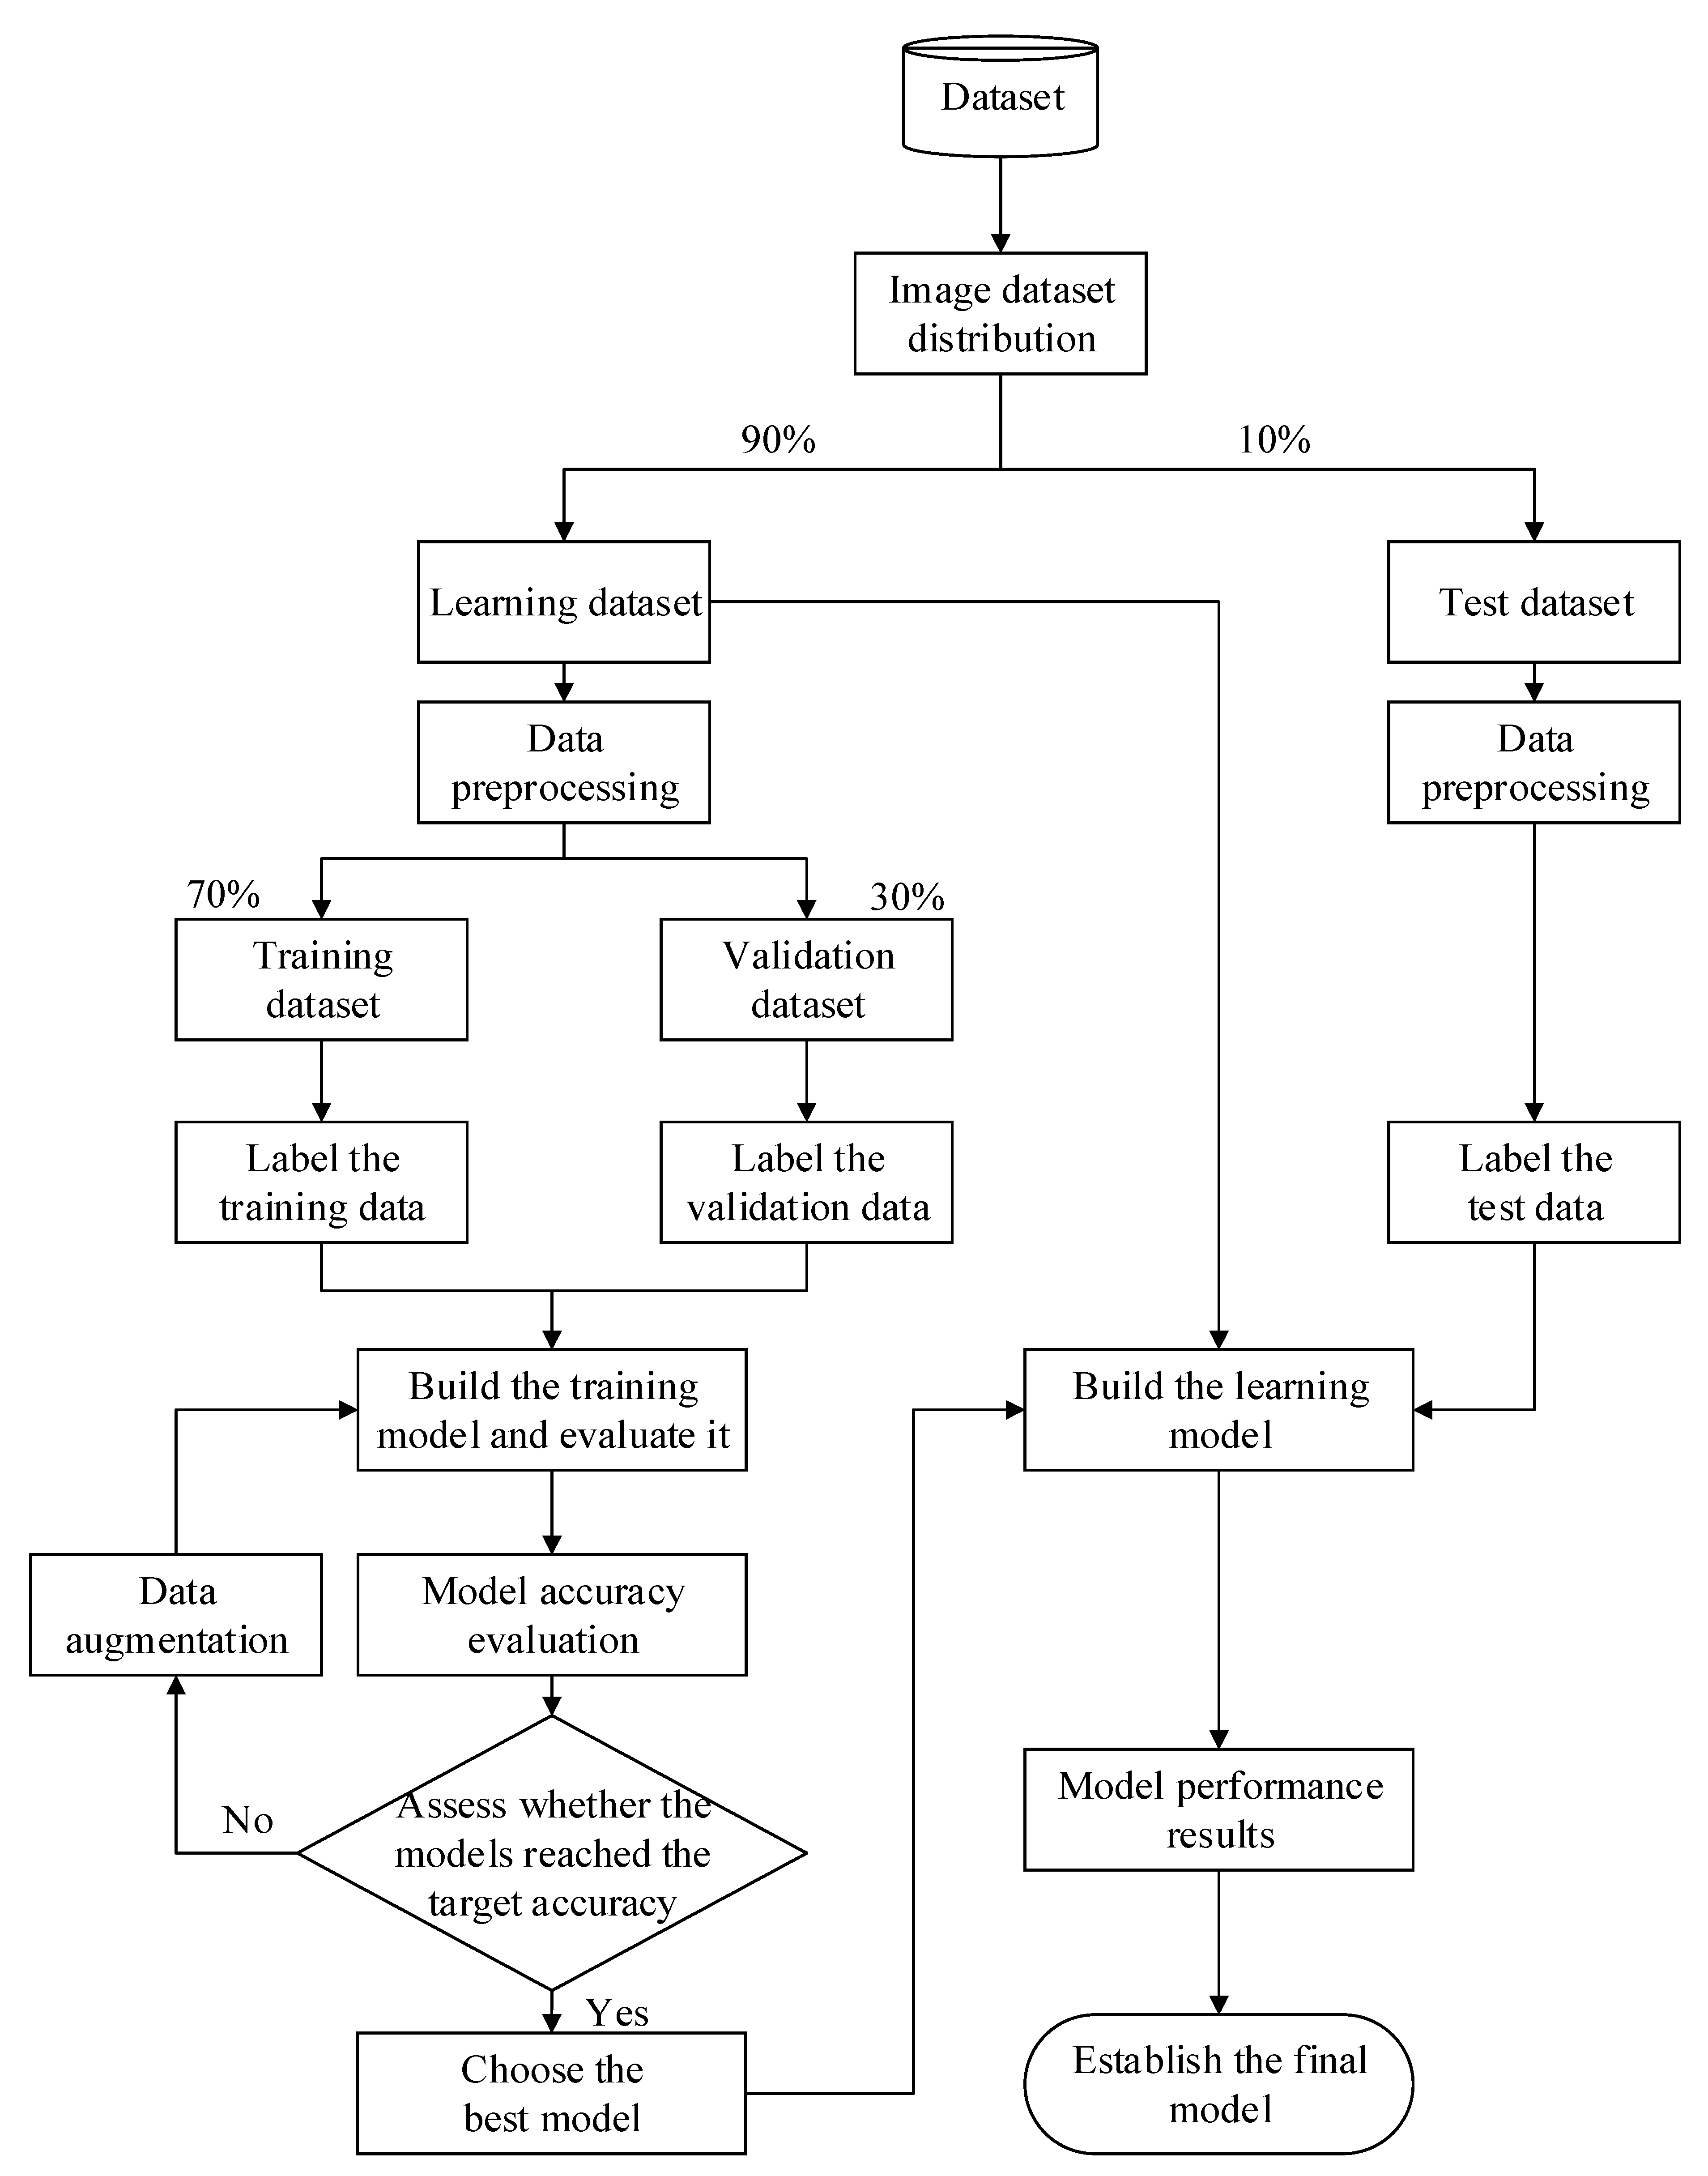
3.2.1. Model Validation
3.2.2. Criteria for Assessing Accuracy
4. Data Collection, Model Building, and System Development
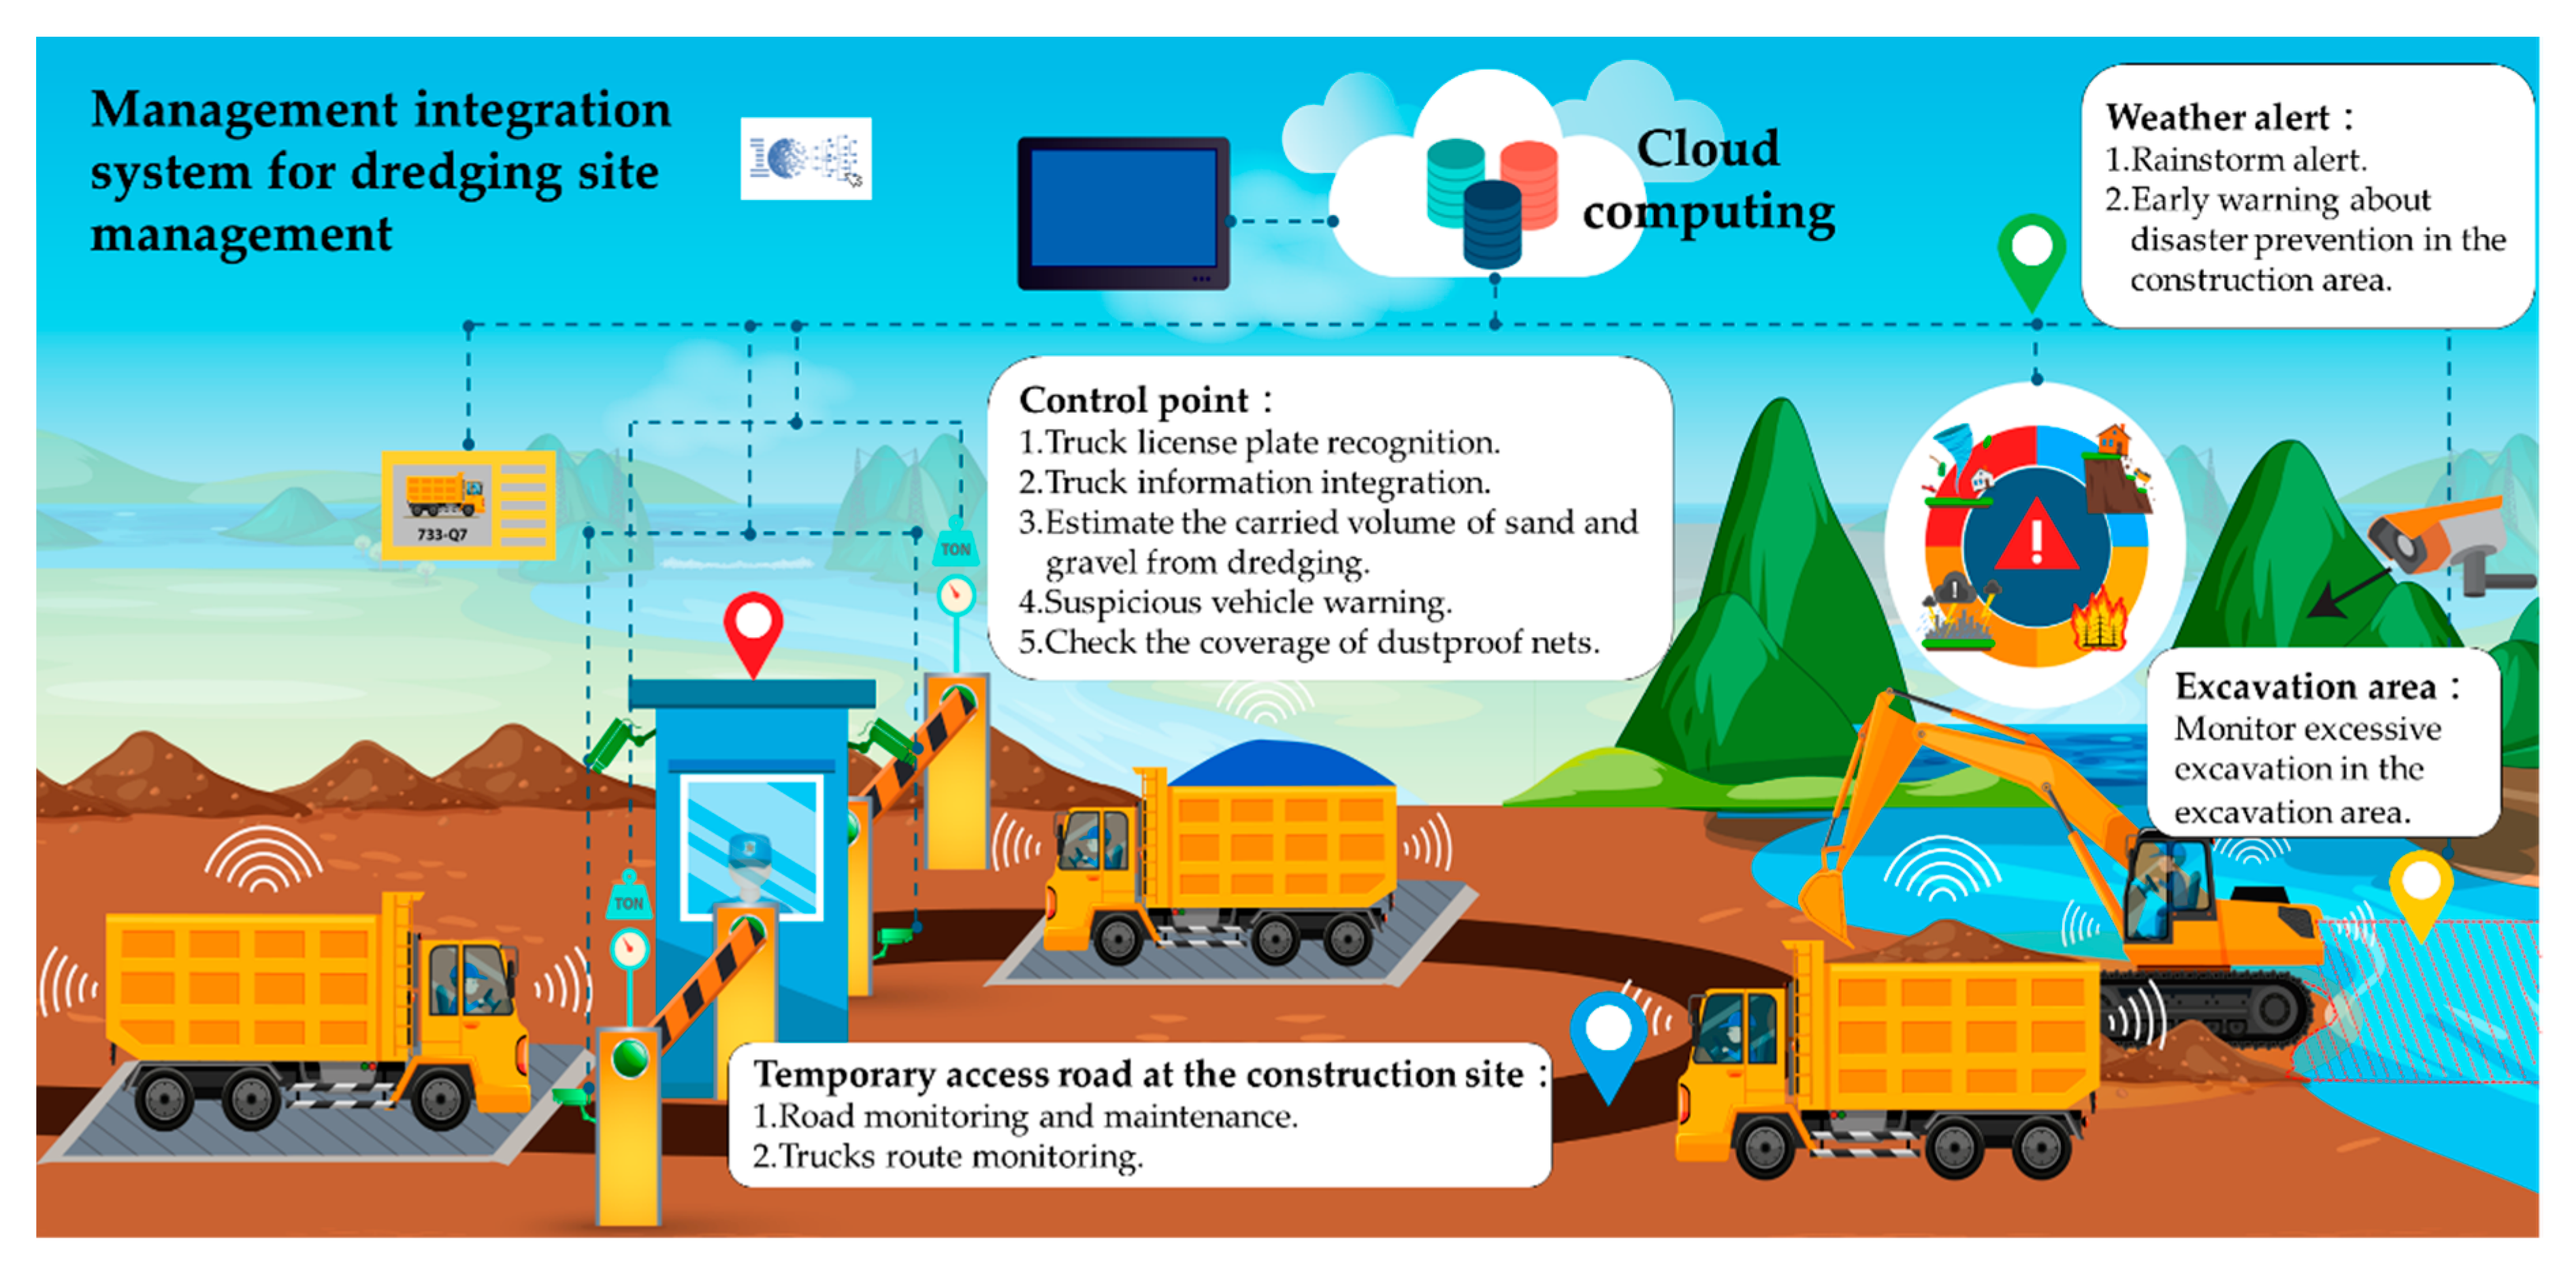
4.1. River Dredging Management System
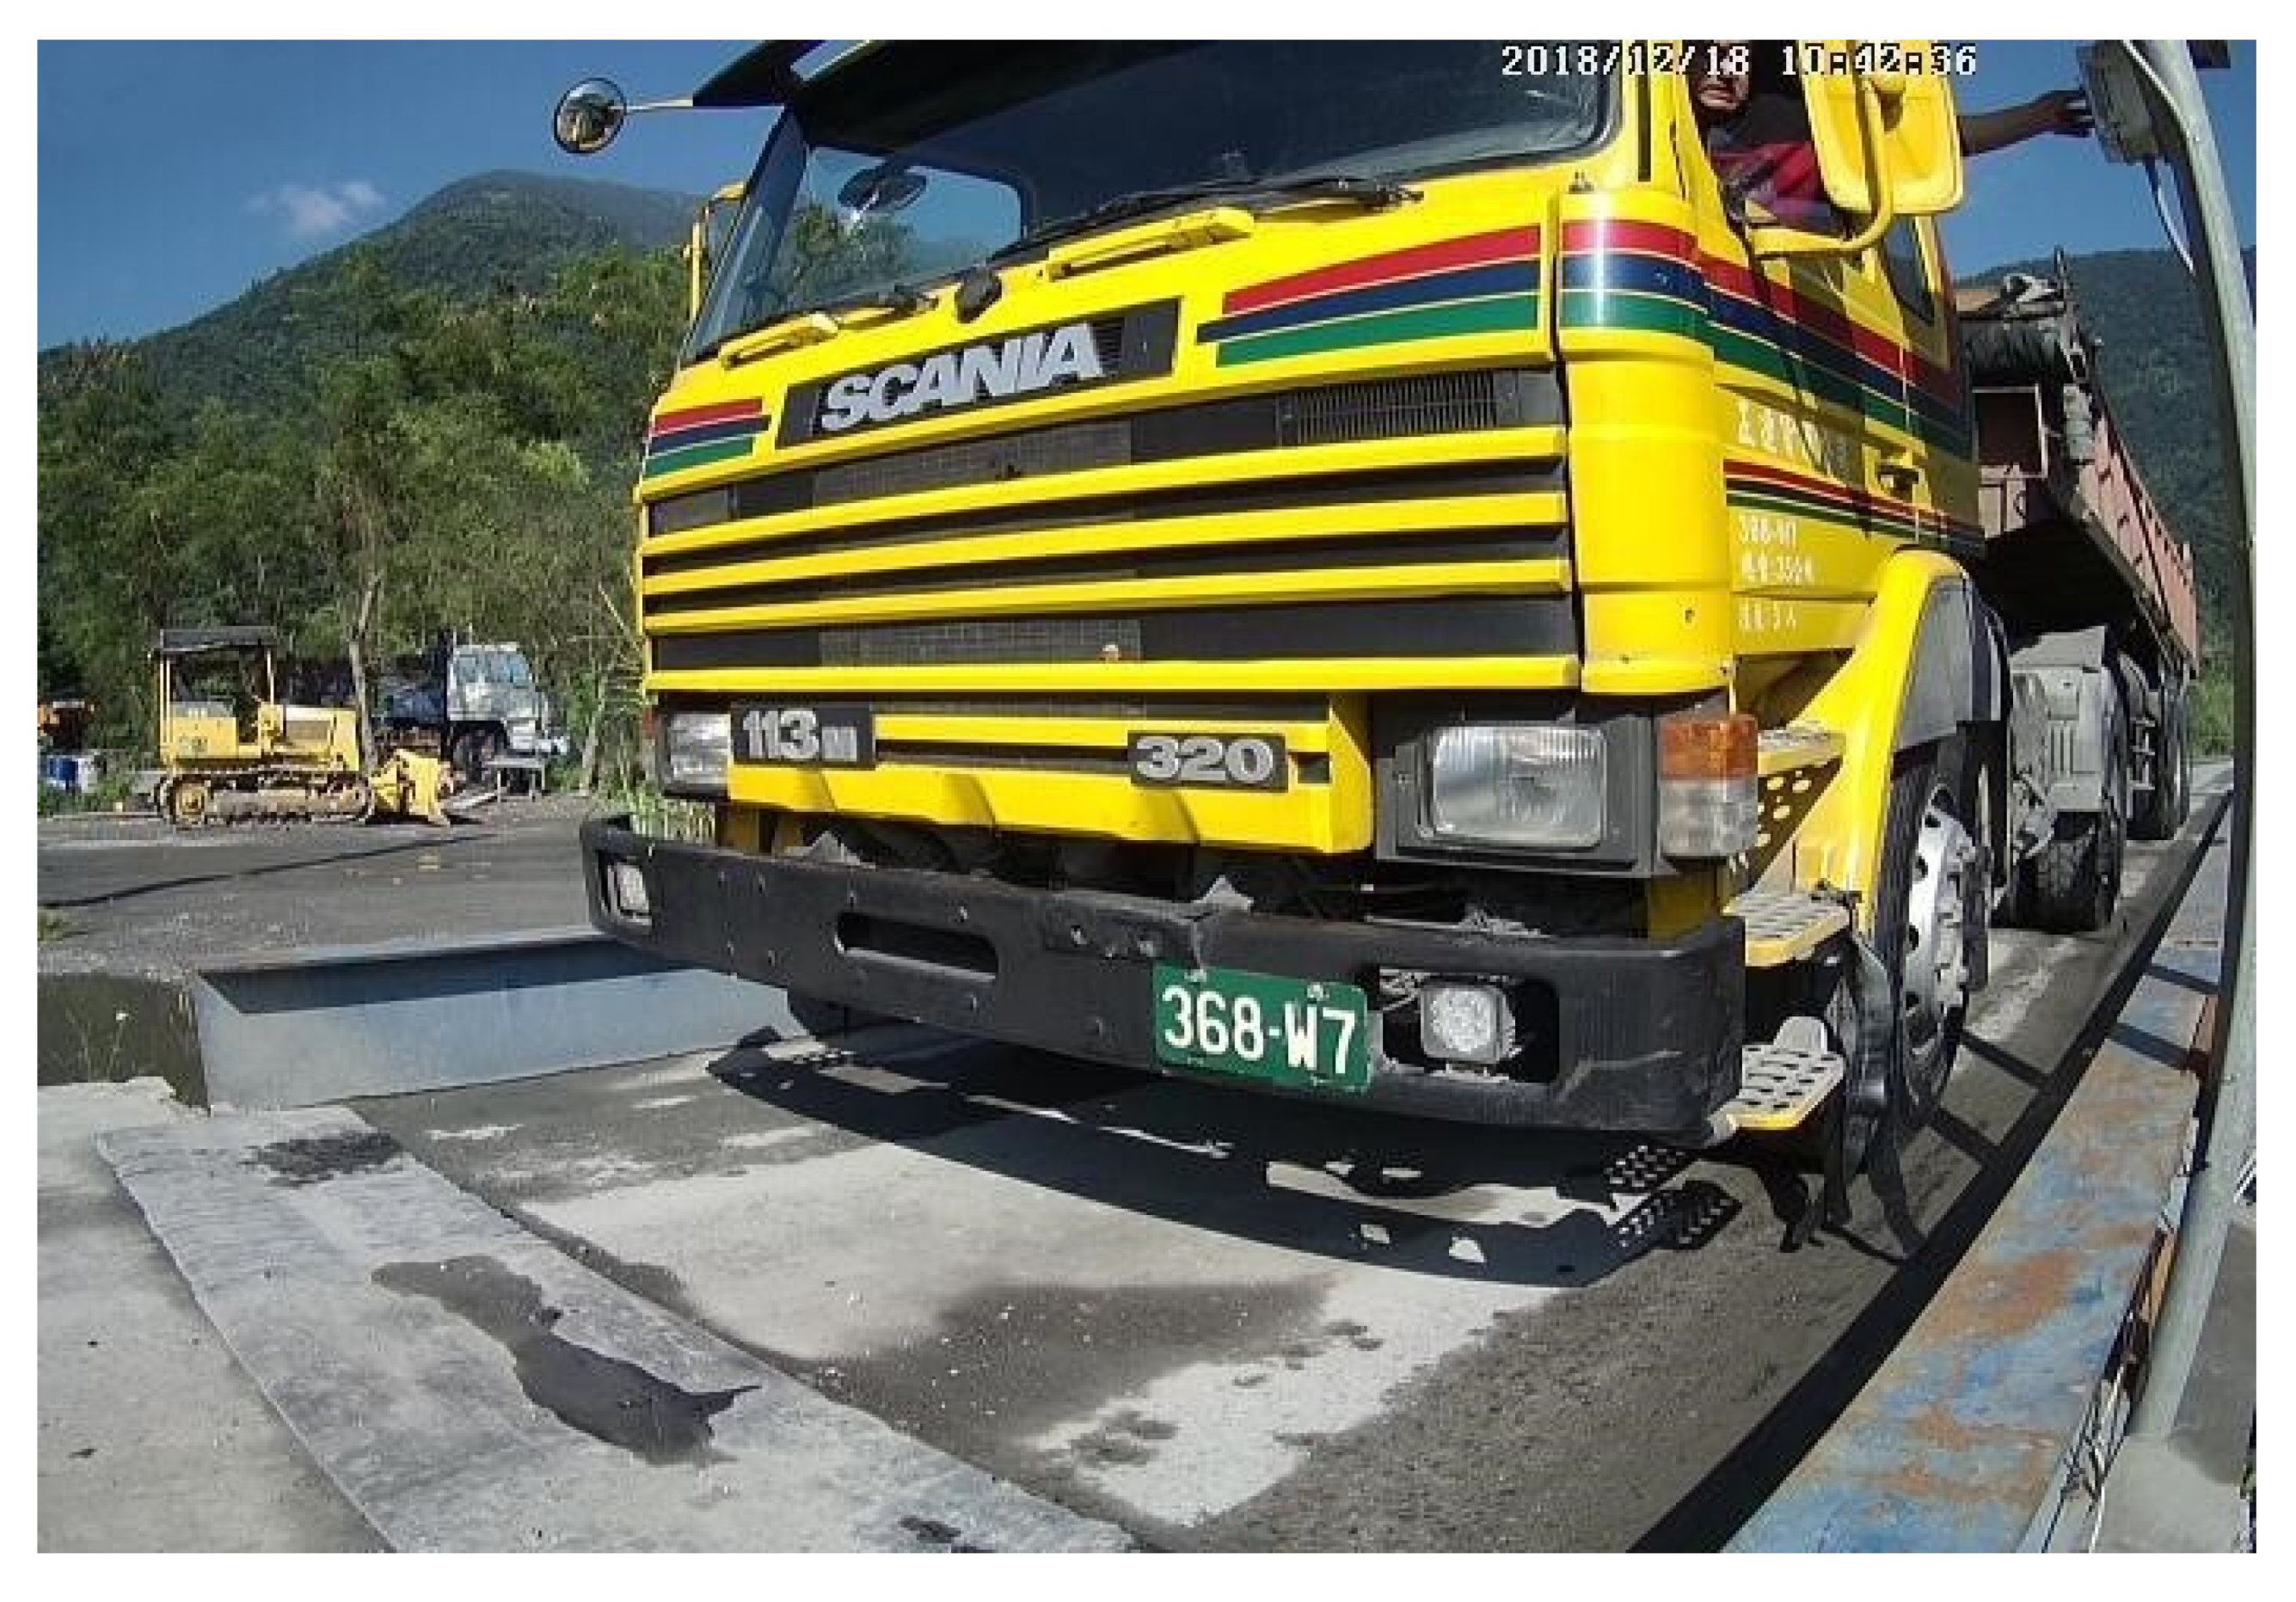
4.1.1. Imaging of the License Plates of Dump Trucks
4.1.2. Image Data Preprocessing
4.2. Individual Model Building and Validation
4.2.1. Hardware and Software Specifications
4.2.2. Data Usage and Model Construction
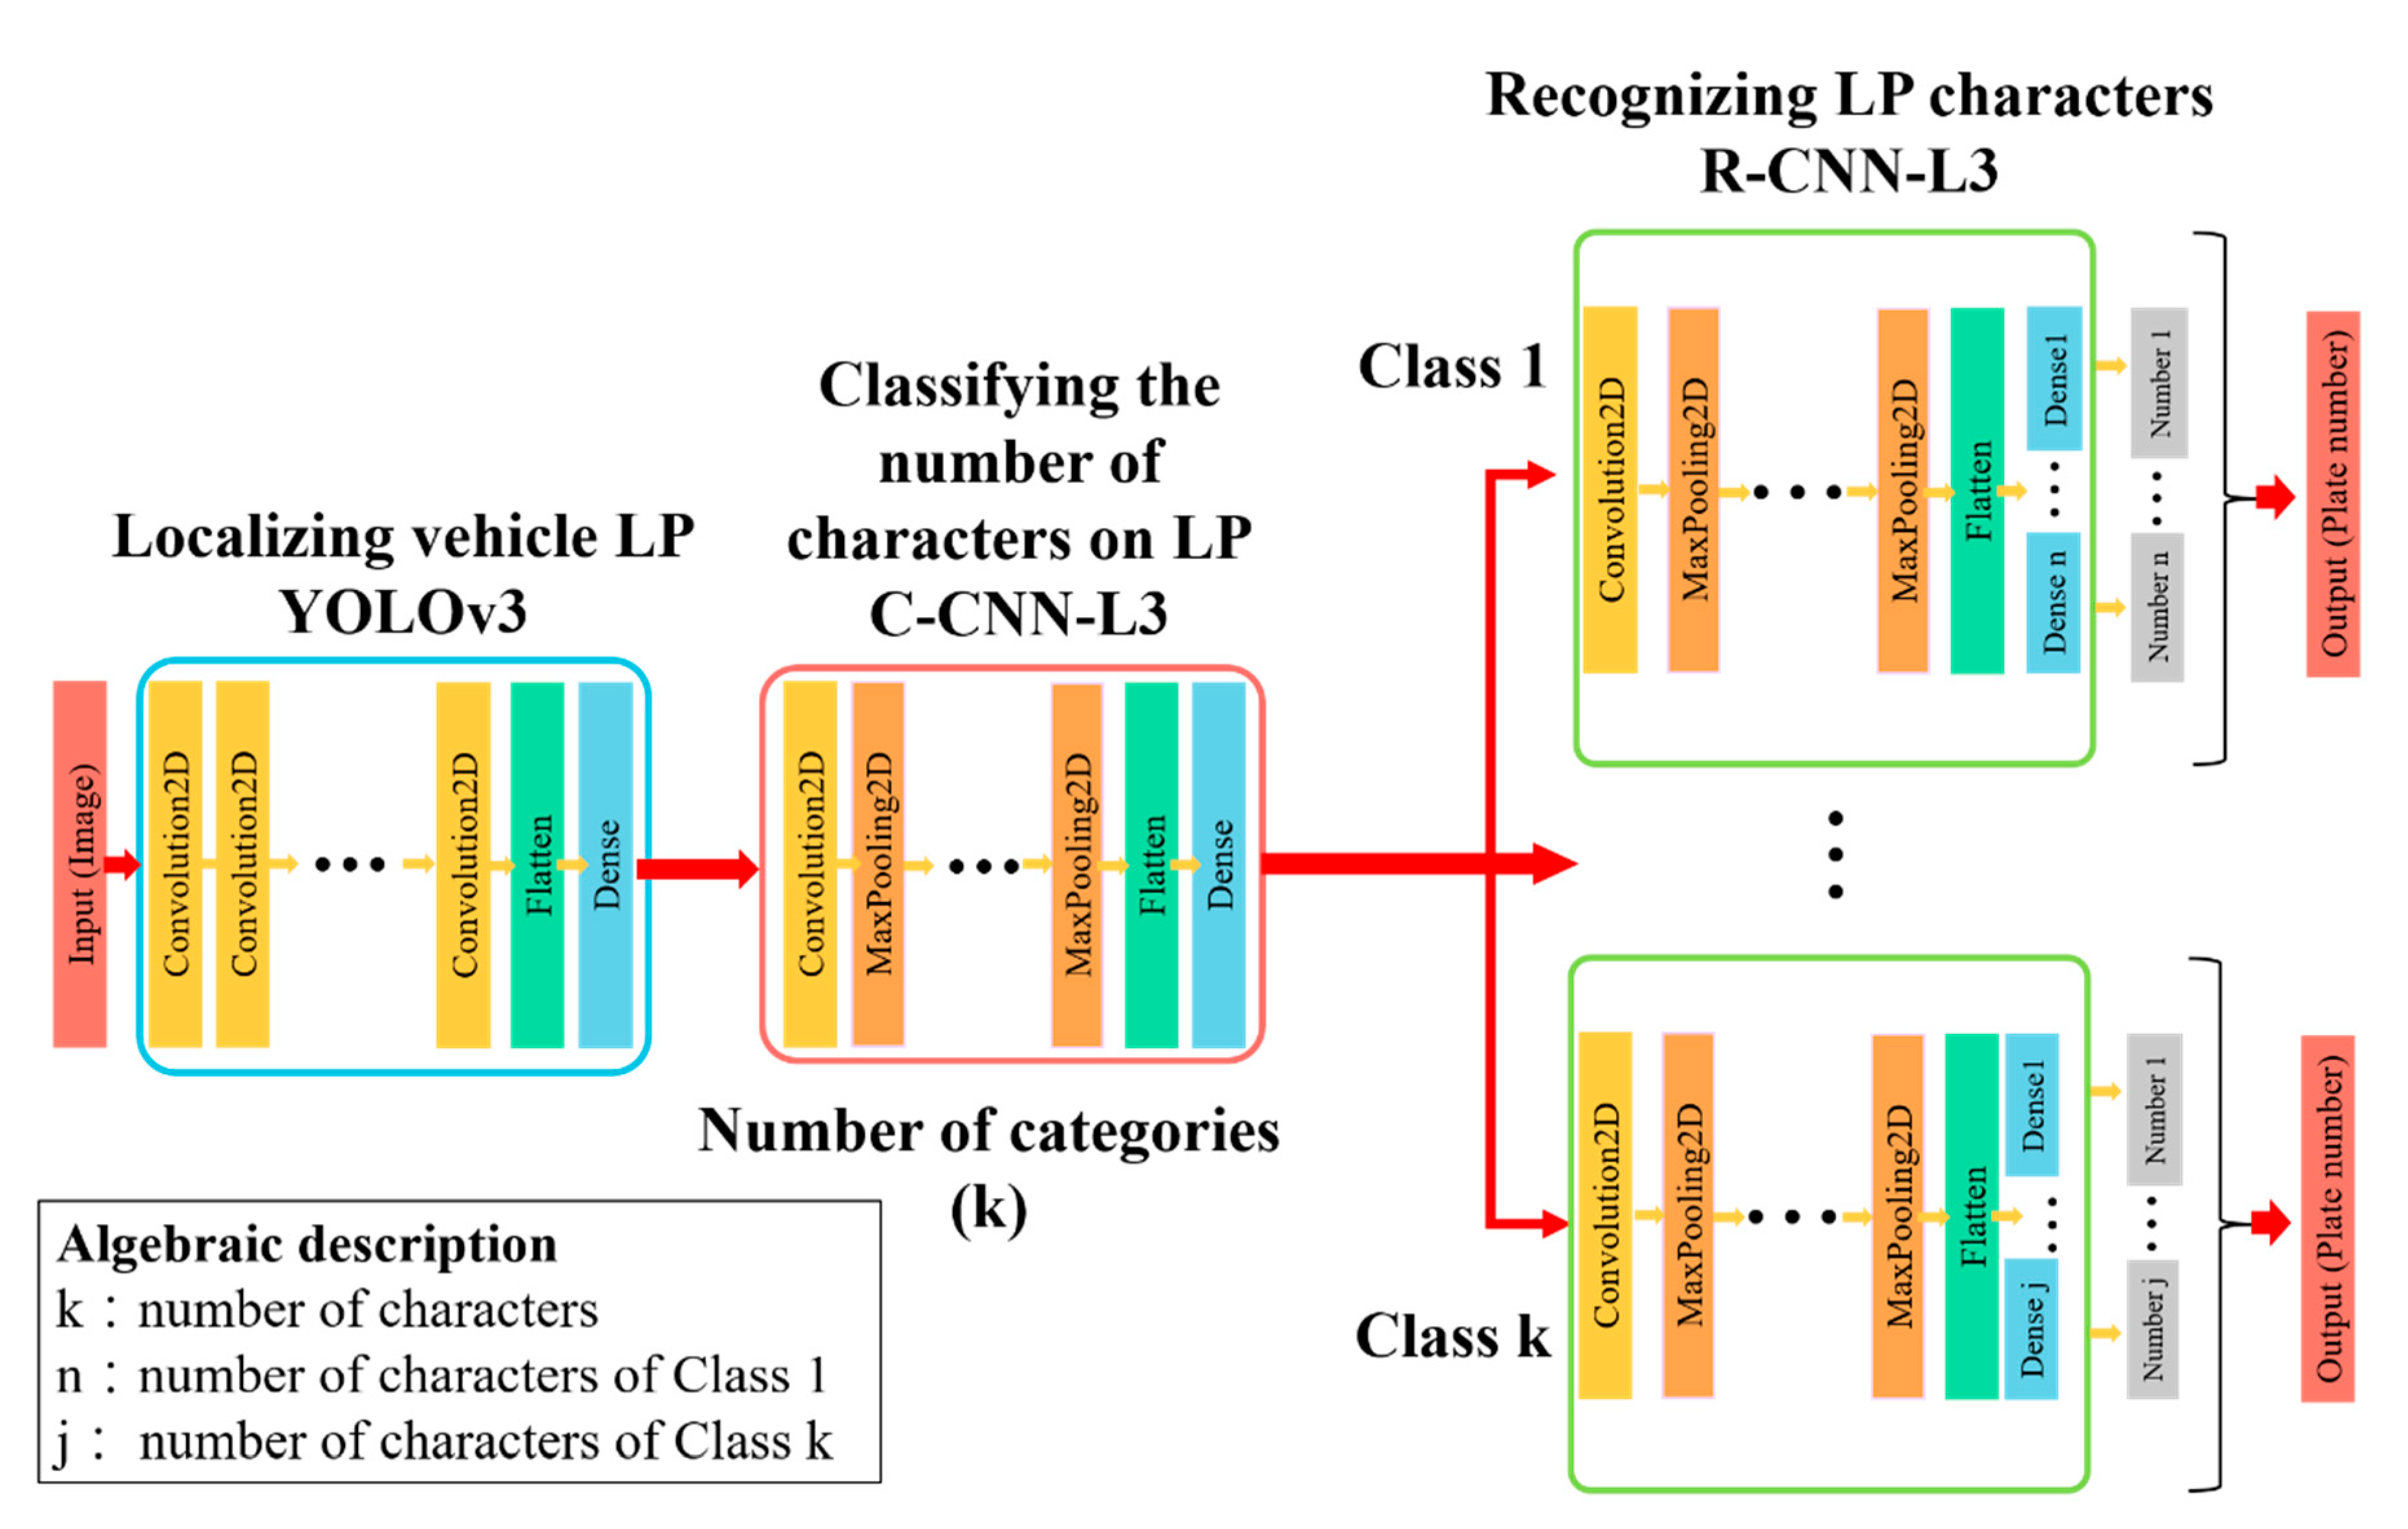
Localizing Truck License Plates
Classifying Truck License Plates by Number of Characters
Recognizing Characters on Truck License Plates
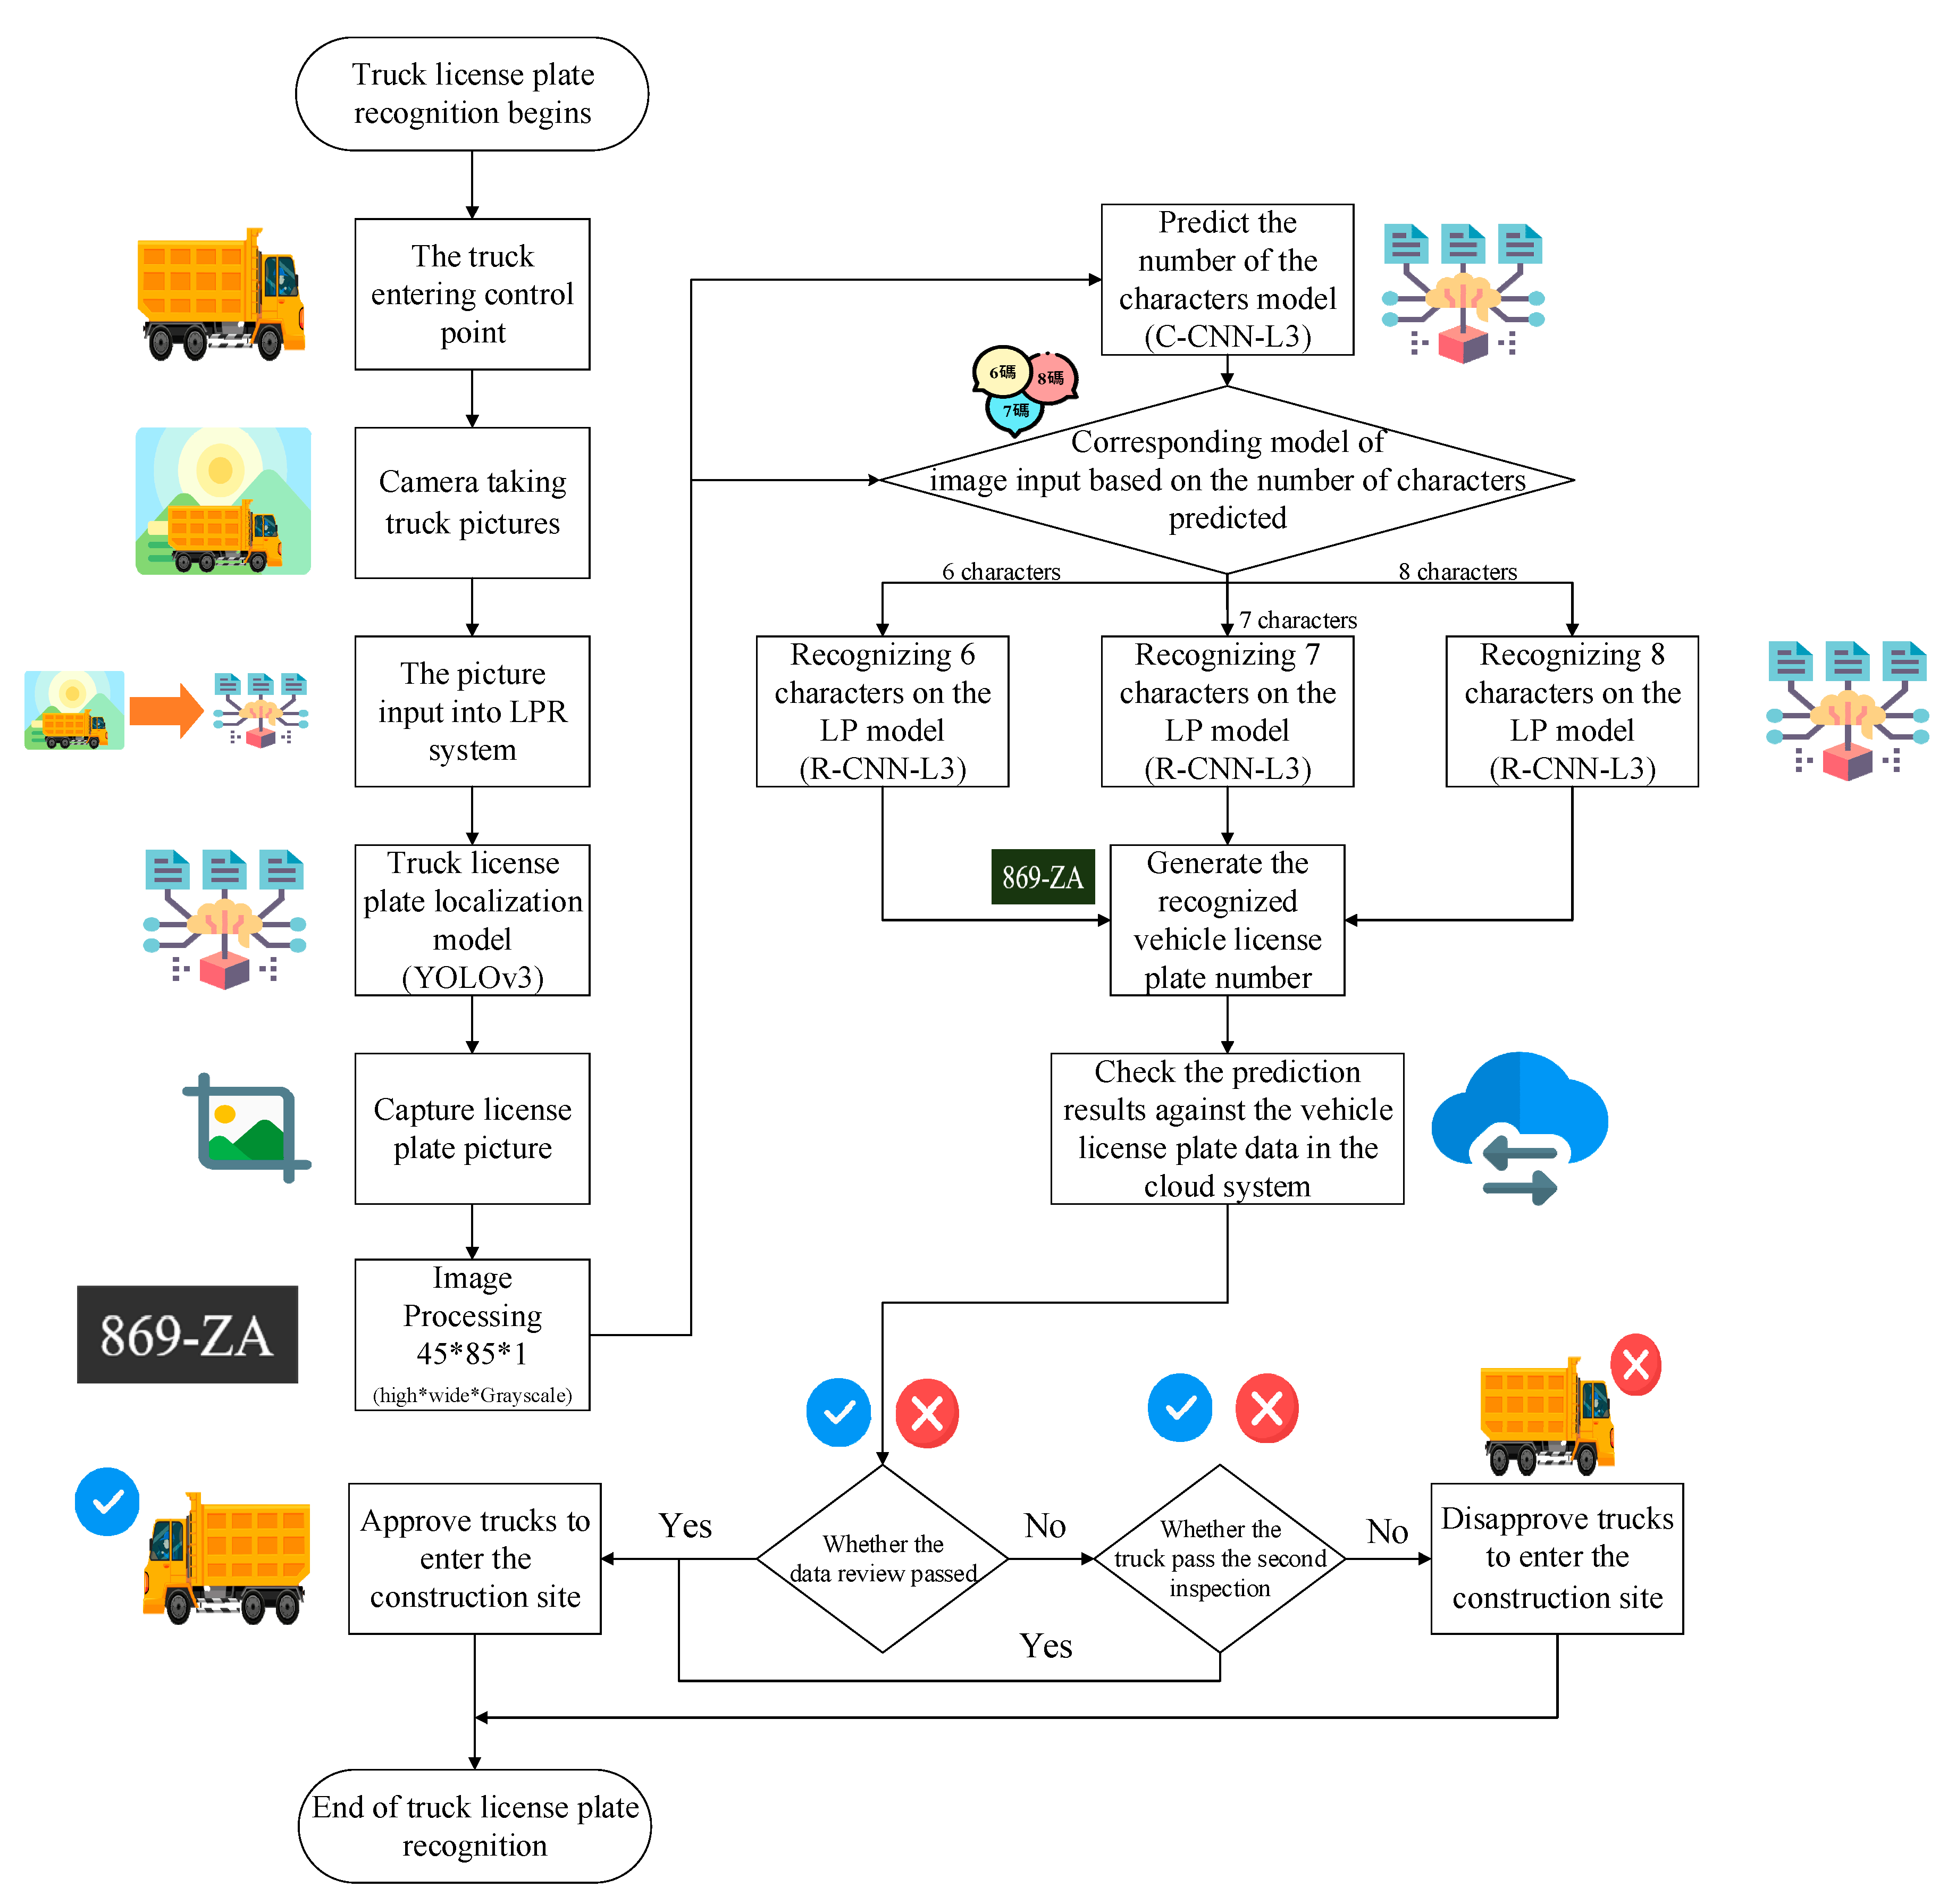
4.3. Truck License Plate Recognition System
4.3.1. System Integration
4.3.2. System Analysis and Discussion
5. Use of the Dump Truck LPR System at Smart Dredging Construction Sites
5.1. Smart Dredging Construction Site and Automation of Control Points
5.1.1. Smart Dredging Construction Site Planning
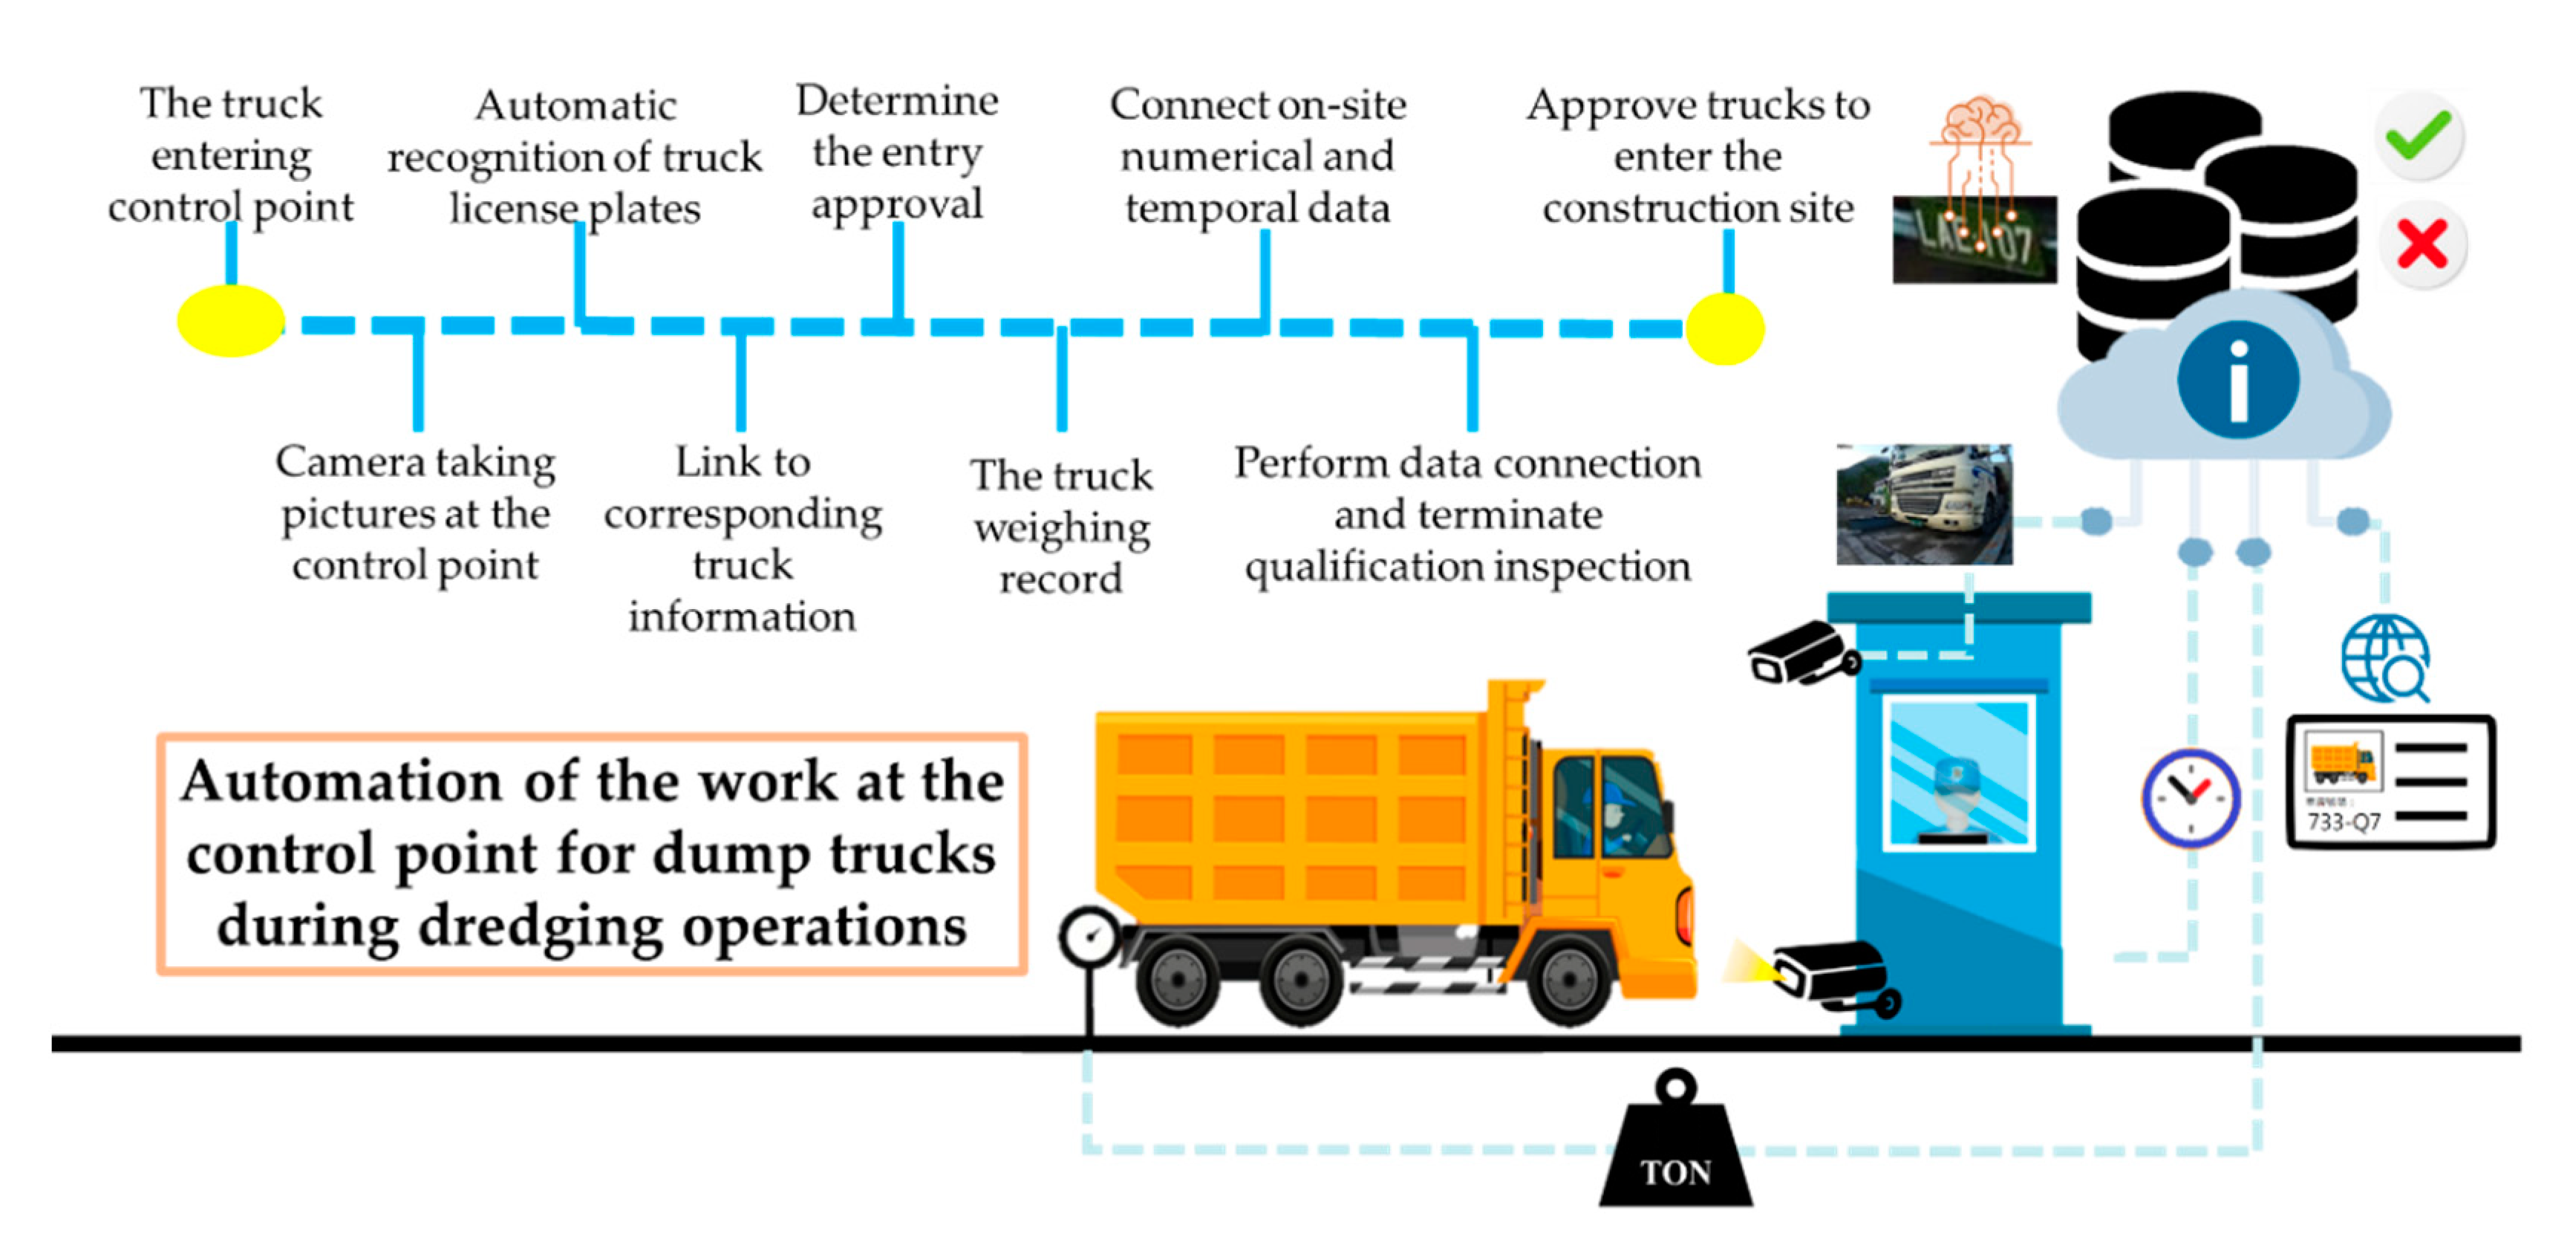
5.1.2. Automated Design of the Control Point
5.2. Recognition by the TLPR System
5.3. Case Study of Dredging Operations
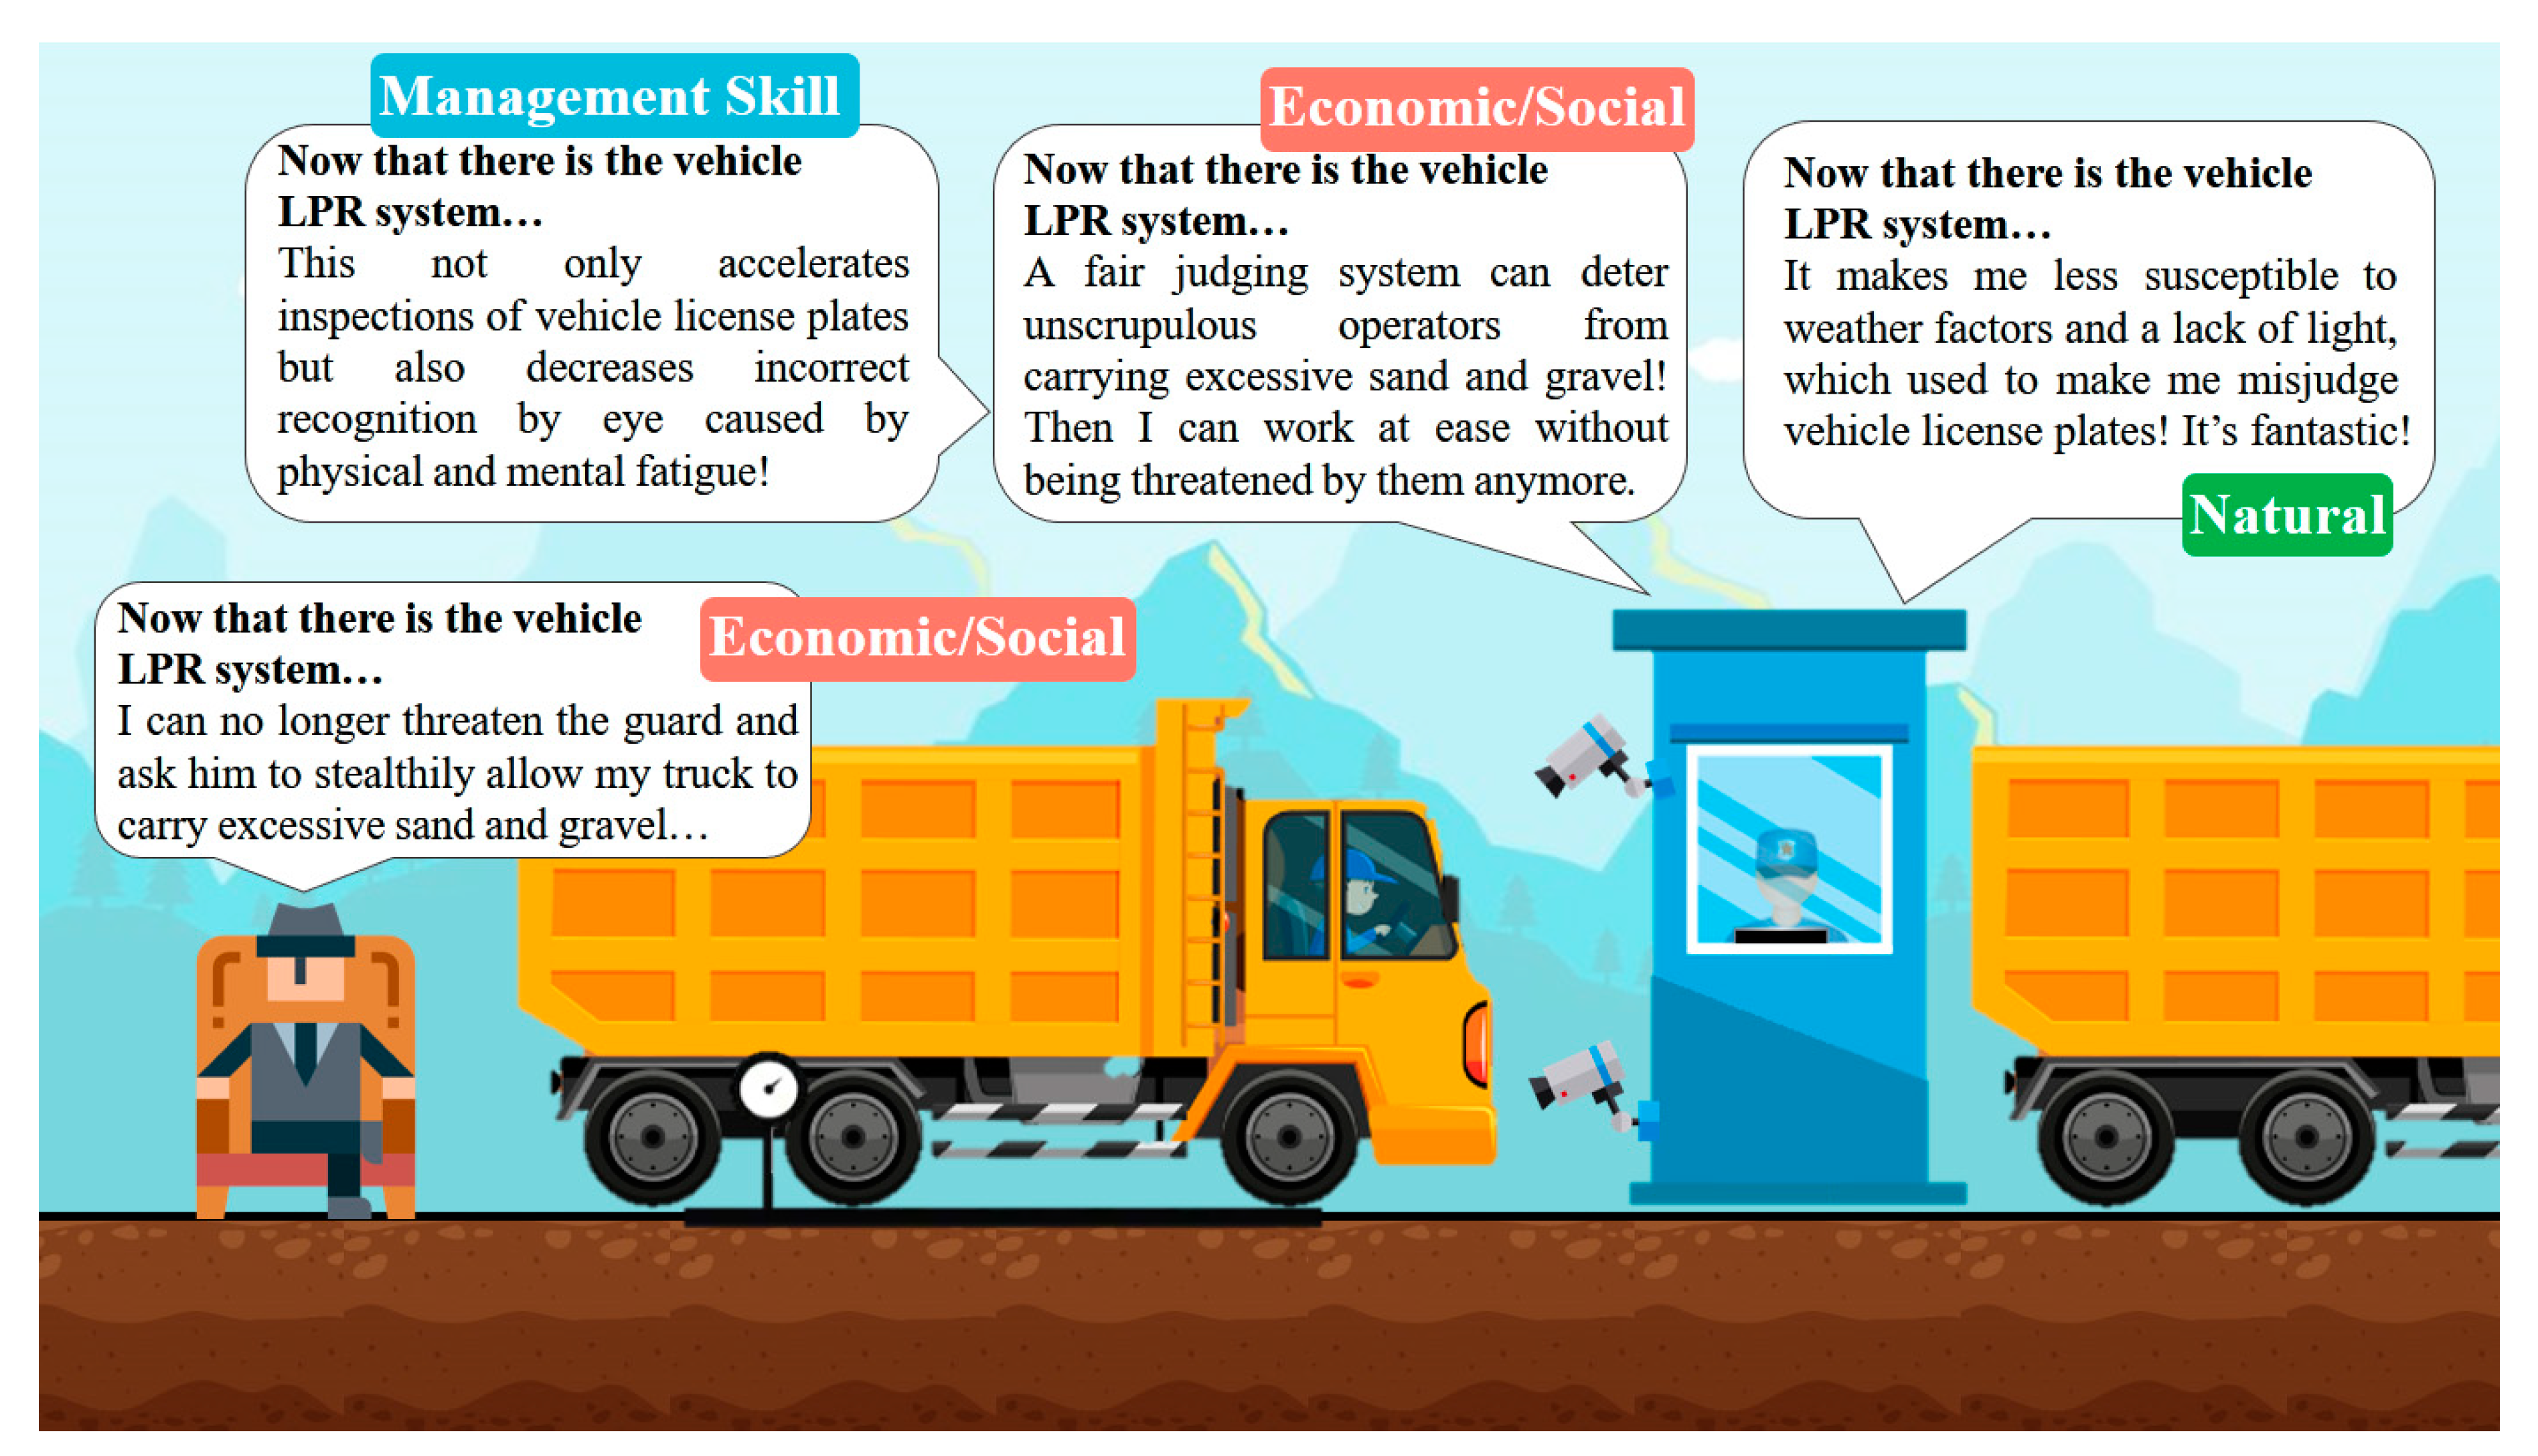
5.3.1. Effect of Weather and Lighting Factors on Recognition
5.3.2. Reducing Human Factors on Truck Entry and Exit
5.3.3. Alleviating Visual Fatigue Caused by Inspecting Numerous Vehicles
5.4. Contributions of the Proposed TLPR System to River Dredging Construction
5.4.1. Security Guards at Control Points at Construction Sites
5.4.2. Dredging Authorities
5.4.3. Departments of Police and Government Ethics
6. Summary, Conclusions, and Suggestions
Author Contributions
Funding
Institutional Review Board Statement
Informed Consent Statement
Data Availability Statement
Conflicts of Interest
Nomenclature
| AI | Artificial Intelligence |
| AP | Average Precision |
| ANN | Artificial Neural Network [1] |
| API | Application Programming Interface |
| BIM | Building Information Modeling |
| CNN | Convolutional Neural etwork [2] |
| CNN-L3 | Convolutional Neural Network with Three Feature Stages [3,4] |
| CPU | Central Processing Unit |
| C-CNN-L3 | Convolutional Neural Network for Classification of the Number of Characters with Three Feature Stages |
| C-SRCS | Simple Railway Captcha Solver for Classification of the Number of Characters |
| C-VGG16 | Visual Geometry Group 16 for Classification of the Number of Characters |
| FN | False Negative |
| FP | False Positive |
| FPN | Feature Pyramid Network [5] |
| GIS | Geographic Information System |
| GPU | Graphics Processing Unit |
| GPS | Global Positioning System |
| IoU | Intersection over Union |
| KNN-SVM | K-Nearest Neighbors and the Multi-Class Support Vector Machines [6] |
| LPR | License Plate Recognition |
| mAP | Mean Average Precision |
| PR Curve | Precision-Recall Curve |
| RAM | Random-Access Memory |
| RDNet | Combination of Dense Convolutional Network (DenseNet) and Residual Network (ResNet)’s Advantages [7] |
| R-CNN-L3 | Convolutional Neural Network for Character Recognition with Three Feature Stages |
| R-SRCS | Simple Railway Captcha Solver for Character Recognition |
| R-VGG16 | Visual Geometry Group 16 for Character Recognition |
| SRCS | Simple Railway Captcha Solver |
| TLPR | Truck License Plate Recognition |
| TN | True Negative |
| TP | True Positive |
| UAV | Unmanned Aerial Vehicle |
| VGG16 | Visual Geometry Group 16 [8] |
| YOLO | You Only Look Once [9] |
| YOLOv2 | You Only Look Once Version 2 |
| YOLOv3 | You Only Look Once Version 3 |
| YOLOv4 | You Only Look Once Version 4 |
| YOLOv5 | You Only Look Once Version 5 |
References
- Chen, C.-P. Research on the Crime of Illegal River Sand and Gravel Mining—Taking Nantou County as an Example; National Chung Cheng University: Minxiong, Taiwai, 2005. [Google Scholar]
- Lin, K.-K. Research on the Management and Prevention Strategy of Illegal River Sand and Gravel Mining; National Chung Cheng University: Minxiong, Taiwai, 2008. [Google Scholar]
- Chen, C.Y. The Study of the Possibility for the Establishment of the River and Warter Resourse Police; National Chung Cheng University: Minxiong, Taiwai, 2007. [Google Scholar]
- Chiu, P.-C. The Decision-Making, Implementation and Evaluation of Public Security Strategy: Taking the Yunlin County Police Station’s Ban on Theillegal River Sand and Gravel Mining as an Example; Central Police University: Taoyuan City, Taiwan, 2003. [Google Scholar]
- Hearn, G. Bridge Inspection Practices; Transportation Research Board: Washington, DC, USA, 2007; Volume 375. [Google Scholar]
- Agnisarman, S.; Lopes, S.; Chalil Madathil, K.; Piratla, K.; Gramopadhye, A. A survey of automation-enabled human-in-the-loop systems for infrastructure visual inspection. Autom. Constr. 2019, 97, 52–76. [Google Scholar] [CrossRef]
- Chen, Q.; García de Soto, B.; Adey, B.T. Construction automation: Research areas, industry concerns and suggestions for advancement. Autom. Constr. 2018, 94, 22–38. [Google Scholar] [CrossRef]
- Ma, Z.; Ren, Y.; Xiang, X.; Turk, Z. Data-driven decision-making for equipment maintenance. Autom. Constr. 2020, 112, 103103. [Google Scholar] [CrossRef]
- Li, D.; Deng, L.; Cai, Z. Intelligent vehicle network system and smart city management based on genetic algorithms and image perception. Mech. Syst. Signal Process. 2020, 141, 106623. [Google Scholar] [CrossRef]
- Tian, L.; Wang, H.; Zhou, Y.; Peng, C. Video big data in smart city: Background construction and optimization for surveillance video processing. Future Gener. Comput. Syst. 2018, 86, 1371–1382. [Google Scholar] [CrossRef]
- Cameron, J.A.D.; Savoie, P.; Kaye, M.E.; Scheme, E.J. Design considerations for the processing system of a CNN-based automated surveillance system. Expert Syst. Appl. 2019, 136, 105–114. [Google Scholar] [CrossRef]
- Afra, S.; Alhajj, R. Early warning system: From face recognition by surveillance cameras to social media analysis to detecting suspicious people. Phys. A Stat. Mech. Its Appl. 2020, 540, 123151. [Google Scholar] [CrossRef]
- Park, M.-W.; Brilakis, I. Construction worker detection in video frames for initializing vision trackers. Autom. Constr. 2012, 28, 15–25. [Google Scholar] [CrossRef]
- Chen, C.; Zhu, Z.; Hammad, A. Automated excavators activity recognition and productivity analysis from construction site surveillance videos. Autom. Constr. 2020, 110, 103045. [Google Scholar] [CrossRef]
- Sufri, S.; Dwirahmadi, F.; Phung, D.; Rutherford, S. A systematic review of Community Engagement (CE) in Disaster Early Warning Systems (EWSs). Prog. Disaster Sci. 2020, 5, 100058. [Google Scholar] [CrossRef]
- Xu, J.; Wang, E.; Zhou, R. Real-time measuring and warning of surrounding rock dynamic deformation and failure in deep roadway based on machine vision method. Measurement 2020, 149, 107028. [Google Scholar] [CrossRef]
- Yang, J.; Shi, Z.; Wu, Z. Vision-based action recognition of construction workers using dense trajectories. Adv. Eng. Inform. 2016, 30, 327–336. [Google Scholar] [CrossRef]
- Zhu, Z.; Ren, X.; Chen, Z. Integrated detection and tracking of workforce and equipment from construction jobsite videos. Autom. Constr. 2017, 81, 161–171. [Google Scholar] [CrossRef]
- Rezazadeh Azar, E.; McCabe, B. Part based model and spatial–temporal reasoning to recognize hydraulic excavators in construction images and videos. Autom. Constr. 2012, 24, 194–202. [Google Scholar] [CrossRef]
- Kim, J.; Chi, S. Action recognition of earthmoving excavators based on sequential pattern analysis of visual features and operation cycles. Autom. Constr. 2019, 104, 255–264. [Google Scholar] [CrossRef]
- Akhavian, R.; Behzadan, A.H. Construction equipment activity recognition for simulation input modeling using mobile sensors and machine learning classifiers. Adv. Eng. Inform. 2015, 29, 867–877. [Google Scholar] [CrossRef]
- Kim, J.; Chi, S.; Seo, J. Interaction analysis for vision-based activity identification of earthmoving excavators and dump trucks. Autom. Constr. 2018, 87, 297–308. [Google Scholar] [CrossRef]
- Gong, J.; Caldas Carlos, H. Computer Vision-Based Video Interpretation Model for Automated Productivity Analysis of Construction Operations. J. Comput. Civ. Eng. 2010, 24, 252–263. [Google Scholar] [CrossRef]
- Silva, S.M.; Jung, C.R. Real-Time License Plate Detection and Recognition Using Deep Convolutional Neural Networks. J. Vis. Commun. Image Represent. 2020, 71, 102773. [Google Scholar] [CrossRef]
- Omar, N.; Sengur, A.; Al-Ali, S.G.S. Cascaded deep learning-based efficient approach for license plate detection and recognition. Expert Syst. Appl. 2020, 149, 113280. [Google Scholar] [CrossRef]
- Wang, D.; Tian, Y.; Geng, W.; Zhao, L.; Gong, C. LPR-Net: Recognizing Chinese license plate in complex environments. Pattern Recognit. Lett. 2020, 130, 148–156. [Google Scholar] [CrossRef]
- Hsu, G.; Chen, J.; Chung, Y. Application-Oriented License Plate Recognition. IEEE Trans. Veh. Technol. 2013, 62, 552–561. [Google Scholar] [CrossRef]
- Masood, S.Z.; Shu, G.; Dehghan, A.; Ortiz, E.G. License plate detection and recognition using deeply learned convolutional neural networks. arXiv 2017, arXiv:1703.07330. [Google Scholar]
- Saraswathi, S.; Subban, R.; Shanmugasundari, T.; Manogari, S. Research on License Plate Recognition Using Digital Image Processing. In Proceedings of the 2017 IEEE International Conference on Computational Intelligence and Computing Research (ICCIC), Coimbatore, India, 14–16 December 2017; pp. 1–6. [Google Scholar]
- Khan, A.M.; Awan, S.M.; Arif, M.; Mahmood, Z.; Khan, G.Z. A Robust Segmentation Free License Plate Recognition Method. In Proceedings of the 2019 International Conference on Electrical, Communication, and Computer Engineering (ICECCE), Swat, Pakistan, 24–25 July 2019; pp. 1–6. [Google Scholar]
- Liu, L.; Ouyang, W.; Wang, X.; Fieguth, P.; Chen, J.; Liu, X.; Pietikäinen, M. Deep Learning for Generic Object Detection: A Survey. Int. J. Comput. Vis. 2020, 128, 261–318. [Google Scholar] [CrossRef] [Green Version]
- Puarungroj, W.; Boonsirisumpun, N. Thai License Plate Recognition Based on Deep Learning. Procedia Comput. Sci. 2018, 135, 214–221. [Google Scholar] [CrossRef]
- Cao, Y.; Fu, H.; Ma, H. An End-to-End Neural Network for Multi-line License Plate Recognition. In Proceedings of the 2018 24th International Conference on Pattern Recognition (ICPR), Beijing, China, 20–24 August 2018; pp. 3698–3703. [Google Scholar]
- Li, P.; Nguyen, M.; Yan, W.Q. Rotation correction for license plate recognition. In Proceedings of the 4th International Conference on Control, Automation and Robotics, ICCAR 2018, Auckland, New Zealand, 20–23 April 2018; Institute of Electrical and Electronics Engineers Inc.: Auckland, New Zealand, 2018; pp. 400–404. [Google Scholar]
- Zhao, Y.; Yu, Z.; Li, X.; Cai, M. Chinese license plate image database building methodology for license plate recognition. J. Electron. Imaging 2019, 28, 013001. [Google Scholar] [CrossRef]
- Li, H.; Wang, P.; You, M.; Shen, C. Reading car license plates using deep neural networks. Image Vis. Comput. 2018, 72, 14–23. [Google Scholar] [CrossRef]
- Xiang, H.; Zhao, Y.; Yuan, Y.; Zhang, G.; Hu, X. Lightweight fully convolutional network for license plate detection. Optik 2019, 178, 1185–1194. [Google Scholar] [CrossRef]
- Pham, V.H.; Dinh, P.Q.; Nguyen, V.H. CNN-Based Character Recognition for License Plate Recognition System. In Proceedings of the Intelligent Information and Database Systems, Dong Hoi City, Vietnam, 19–21 March 2018; Nguyen, N.T., Hoang, D.H., Hong, T.-P., Pham, H., Trawiński, B., Eds.; Springer International Publishing: Cham, Switzerland, 2018; pp. 594–603. [Google Scholar]
- Redmon, J.; Divvala, S.; Girshick, R.; Farhadi, A. You only look once: Unified, real-time object detection. In Proceedings of the IEEE Conference on Computer Vision and Pattern Recognition, Las Vegas, NV, USA, 27–30 June 2016; pp. 779–788. [Google Scholar]
- Chen, R.-C. Automatic License Plate Recognition via sliding-window darknet-YOLO deep learning. Image Vis. Comput. 2019, 87, 47–56. [Google Scholar]
- Redmon, J.; Farhadi, A. YOLO9000: Better, faster, stronger. In Proceedings of the IEEE Conference on Computer Vision and Pattern Recognition, Honolulu, HI, USA, 21–26 July 2017; pp. 7263–7271. [Google Scholar]
- Jamtsho, Y.; Riyamongkol, P.; Waranusast, R. Real-time Bhutanese license plate localization using YOLO. ICT Express 2019, 6, 121–124. [Google Scholar] [CrossRef]
- Redmon, J.; Farhadi, A.J. Yolov3: An incremental improvement. arXiv 2018, arXiv:1804.02767. [Google Scholar]
- Abdullah, S.; Hasan, M.M.; Islam, S.M.S. YOLO-Based Three-Stage Network for Bangla License Plate Recognition in Dhaka Metropolitan City. In Proceedings of the 2018 International Conference on Bangla Speech and Language Processing (ICBSLP), Sylhet, Bangladesh, 21–22 September 2018; Volume 2018, pp. 1–6. [Google Scholar]
- Liu, W.; Anguelov, D.; Erhan, D.; Szegedy, C.; Reed, S.; Fu, C.; Berg, A.C. SSD: Single shot multibox detector. In Proceedings of the European Conference on Computer Vision, Amsterdam, The Netherlands, 8–16 October 2016. [Google Scholar]
- Sun, H.; Fu, M.; Abdussalam, A.; Huang, Z.; Sun, S.; Wang, W. License Plate Detection and Recognition Based on the YOLO Detector and CRNN-12. In Proceedings of the Signal and Information Processing, Networking and Computers, Guiyang, China, 13–19 August 2019; Sun, S., Ed.; Springer: Singapore, 2019; pp. 66–74. [Google Scholar]
- Laroca, R.; Severo, E.; Zanlorensi, L.A.; Oliveira, L.S.; Gonçalves, G.R.; Schwartz, W.R.; Menotti, D. A Robust Real-Time Automatic License Plate Recognition Based on the YOLO Detector. In Proceedings of the 2018 International Joint Conference on Neural Networks (IJCNN), Rio de Janeiro, Brazil, 8–13 July 2018; pp. 1–10. [Google Scholar]
- Selmi, Z.; Halima, M.B.; Alimi, A.M. Deep Learning System for Automatic License Plate Detection and Recognition. In Proceedings of the 2017 14th IAPR International Conference on Document Analysis and Recognition (ICDAR), Kyoto, Japan, 9–15 November 2017; pp. 1132–1138. [Google Scholar]
- Astawa, I.N.G.A.; Caturbawa, I.G.N.B.; Rudiastari, E.; Radhitya, M.L.; Hariyanti, N.K.D. Convolutional Neural Network Method Implementation for License Plate Recognition in Android. In Proceedings of the 2018 2nd East Indonesia Conference on Computer and Information Technology (EIConCIT), Makassar, Indonesia, 6–7 November 2018; pp. 176–179. [Google Scholar]
- Silva, S.M.; Jung, C.R. Real-Time Brazilian License Plate Detection and Recognition Using Deep Convolutional Neural Networks. In Proceedings of the 2017 30th SIBGRAPI Conference on Graphics, Patterns and Images (SIBGRAPI), Niteroi, Brazil, 17–20 October 2017; pp. 55–62. [Google Scholar]
- Xiaoping, L.; Feng, L.; Xiaoxing, L.; Yinxiang, L.; Jianqiang, X. Research on character segmentation in license plate recognition. In Proceedings of the 4th International Conference on New Trends in Information Science and Service Science, Gyeongju, Korea, 11–13 May 2010; pp. 345–348. [Google Scholar]
- Cheng, C.; Mei, L.; Zhang, J. License Plate Recognition via Deep Convolutional Neural Network. In Proceedings of the 2018 International Conference on Civil and Hydraulic Engineering, IConCHE 2018, Qingdao, China, 23–25 November 2018; Institute of Physics Publishing: Qingdao, China, 2018. [Google Scholar]
- Gao, P.; Zeng, Z.; Sun, S. Segmentation-Free Vehicle License Plate Recognition Using CNN. In Proceedings of the Signal and Information Processing, Networking and Computers, Guiyang, China, 13–16 August 2019; Sun, S., Ed.; Springer: Singapore, 2019; pp. 50–57. [Google Scholar]
- Goodfellow, I.J.; Bulatov, Y.; Ibarz, J.; Arnoud, S.; Shet, V. Multi-digit number recognition from street view imagery using deep convolutional neural networks. arXiv 2013, arXiv:1312.6082. [Google Scholar]
- Lins, R.G.; Givigi, S.N.; Freitas, A.D.M.; Beaulieu, A. Autonomous Robot System for Inspection of Defects in Civil Infrastructures. IEEE Syst. J. 2018, 12, 1414–1422. [Google Scholar] [CrossRef]
- Nguyen, T.; Nguyen, D. A New Convolutional Architecture for Vietnamese Car Plate Recognition. In Proceedings of the 2018 10th International Conference on Knowledge and Systems Engineering (KSE), Ho Chi Minh City, Vietnam, 1–3 November 2018; pp. 7–12. [Google Scholar]
- JasonLiTW Simple Captcha Solver Based on CNN and a Training Set Generator by Imitating the Style of Captcha and Data Augmentation. Available online: https://github.com/JasonLiTW/simple-railway-captcha-solver (accessed on 13 November 2020).
- Song, Z.; Fu, L.; Wu, J.; Liu, Z.; Li, R.; Cui, Y. Kiwifruit detection in field images using Faster R-CNN with VGG16. IFAC-Pap. 2019, 52, 76–81. [Google Scholar] [CrossRef]
- Riordon, J.; McCallum, C.; Sinton, D. Deep learning for the classification of human sperm. Comput. Biol. Med. 2019, 111, 103342. [Google Scholar] [CrossRef] [PubMed]
- Banan, A.; Nasiri, A.; Taheri-Garavand, A. Deep learning-based appearance features extraction for automated carp species identification. Aquac. Eng. 2020, 89, 102053. [Google Scholar] [CrossRef]
- Lin, T.-Y.; Dollár, P.; Girshick, R.; He, K.; Hariharan, B.; Belongie, S. Feature pyramid networks for object detection. In Proceedings of the IEEE Conference on Computer Vision and Pattern Recognition, Honolulu, HI, USA, 21–26 July 2017; pp. 2117–2125. [Google Scholar]
- Simonyan, K.; Zisserman, A. Very deep convolutional networks for large-scale image recognition. arXiv 2014, arXiv:1409.1556. [Google Scholar]
- Tabrizi, S.S.; Cavus, N. A Hybrid KNN-SVM Model for Iranian License Plate Recognition. Procedia Comput. Sci. 2016, 102, 588–594. [Google Scholar] [CrossRef] [Green Version]
- Erdinc Kocer, H.; Kursat Cevik, K. Artificial neural networks based vehicle license plate recognition. Procedia Comput. Sci. 2011, 3, 1033–1037. [Google Scholar] [CrossRef] [Green Version]


| Problem Type | Activation Function | Loss Function |
|---|---|---|
| Binary classification | Sigmoid | Binary_crossentropy |
| Multiclass, single-label classification | Softmax | Categorical_crossentropy |
| Multiclass, multilabel classification | Sigmoid | Binary_crossentropy |
| Regression to arbitrary values | Linear | Meansquared error |
| Regression to values between 0 and 1 | Sigmoid | Meansquared error or binary_crossentropy |
| Type | Filters | Size | Output |
|---|---|---|---|
| Convolutional | 32 | 3 × 3 | 256 × 256 |
| Convolutional | 64 | 3 × 3/2 | 128 × 128 |
| Convolutional | 32 | 1 × 1 | |
| Convolutional | 64 | 3 × 3 | |
| Residual | 128 × 128 | ||
| Convolutional | 128 | 3 × 3/2 | 64 × 64 |
| Convolutional | 64 | 1 × 1 | |
| Convolutional | 128 | 3 × 3 | |
| Residual | 64 × 64 | ||
| Convolutional | 256 | 3 × 3/2 | 32 × 32 |
| Convolutional | 128 | 1 × 1 | |
| Convolutional | 256 | 3 × 3 | |
| Residual | 32 × 32 | ||
| Convolutional | 512 | 3 × 3/2 | 16 × 16 |
| Convolutional | 256 | 1 × 1 | |
| Convolutional | 512 | 3 × 3 | |
| Residual | 16 × 16 | ||
| Convolutional | 1024 | 3 × 3/2 | 8 × 8 |
| Convolutional | 512 | 1 × 1 | |
| Convolutional | 1024 | 3 × 3 | |
| Residual | 8 × 8 | ||
| Avg Pool | Global | ||
| Connected | 1000 | ||
| Softmax |
| Layer | Type | Network |
|---|---|---|
| 1 | Input | 128 × 64 |
| 2 | Convolutional | 48@5 × 5 |
| 3 | Max-pooling | 2 × 2 |
| 4 | Convolutional | 64@5 × 5 |
| 5 | Max-pooling | 1 × 2 |
| 6 | Convolutional | 128@5 × 5 |
| 7 | Max-pooling | 2 × 2 |
| 8 | Fully Connected | 2048 |
| 9 | Fully Connected | 36 × 7 |
| Layer | Type | Network |
|---|---|---|
| 1 | Input | 200 × 60 |
| 2 | Convolutional | 32@3 × 3 |
| 3 | Convolutional | 32@3 × 3 |
| 4 | Batch Normalization | – |
| 5 | Max-pooling | 2 × 2 |
| 6 | Dropout | 0.5 |
| 7 | Convolutional | 64@3 × 3 |
| 8 | Convolutional | 64@3 × 3 |
| 9 | Batch Normalization | – |
| 10 | Max-pooling | 2 × 2 |
| 11 | Dropout | 0.5 |
| 12 | Convolutional | 128@3 × 3 |
| 13 | Convolutional | 128@3 × 3 |
| 14 | Batch Normalization | – |
| 15 | Max-pooling | 2 × 2 |
| 16 | Dropout | 0.5 |
| 17 | Convolutional | 256@3 × 3 |
| 18 | Batch Normalization | – |
| 19 | Max-pooling | 2 × 2 |
| 20 | Flatten | – |
| 21 | Dropout | 0.5 |
| 22 | Fully Connected | 34 × 5 |
| Layer | Type | Network |
|---|---|---|
| 1 | Input | 200 × 60 |
| 2 | Convolutional | 64@3 × 3 |
| 3 | Convolutional | 64@3 × 3 |
| 4 | Max-pooling | 2 × 2 |
| 5 | Convolutional | 128@3 × 3 |
| 6 | Convolutional | 128@3 × 3 |
| 7 | Max-pooling | 2 × 2 |
| 8 | Convolutional | 256@3 × 3 |
| 9 | Convolutional | 256@3 × 3 |
| 10 | Convolutional | 256@3 × 3 |
| 11 | Max-pooling | 2 × 2 |
| 12 | Convolutional | 512@3 × 3 |
| 13 | Convolutional | 512@3 × 3 |
| 14 | Convolutional | 512@3 × 3 |
| 15 | Max-pooling | 2 × 2 |
| 16 | Convolutional | 512@3 × 3 |
| 17 | Convolutional | 512@3 × 3 |
| 18 | Convolutional | 512@3 × 3 |
| 19 | Max-pooling | 2 × 2 |
| 20 | Flatten | – |
| 21 | Fully Connected | 4096 |
| 22 | Fully Connected | 4096 |
| 23 | Fully Connected | 1000 |
| Confusion Matrix | Actual | ||
|---|---|---|---|
| True | False | ||
| Predicted | Positive | True Positive (TP) | False Positive (FP) |
| Negative | False Negative (FN) | True Negative (TN) | |
| Items | Actual LP Photo | Actual LP No. | Predicted LP Image | Predicted LP No. | |
|---|---|---|---|---|---|
| Prediction No. | |||||
| Prediction 1 |  | 947-Q7 |  | 941-07 | |
| Prediction 2 |  | LAE-107 |  | LAE-107 | |
| Prediction 3 |  | KLA-6703 |  | KLA-6703 | |
| Stage | Stage Code | Image Data Pre-Processing | Number of Preprocessed Images |
|---|---|---|---|
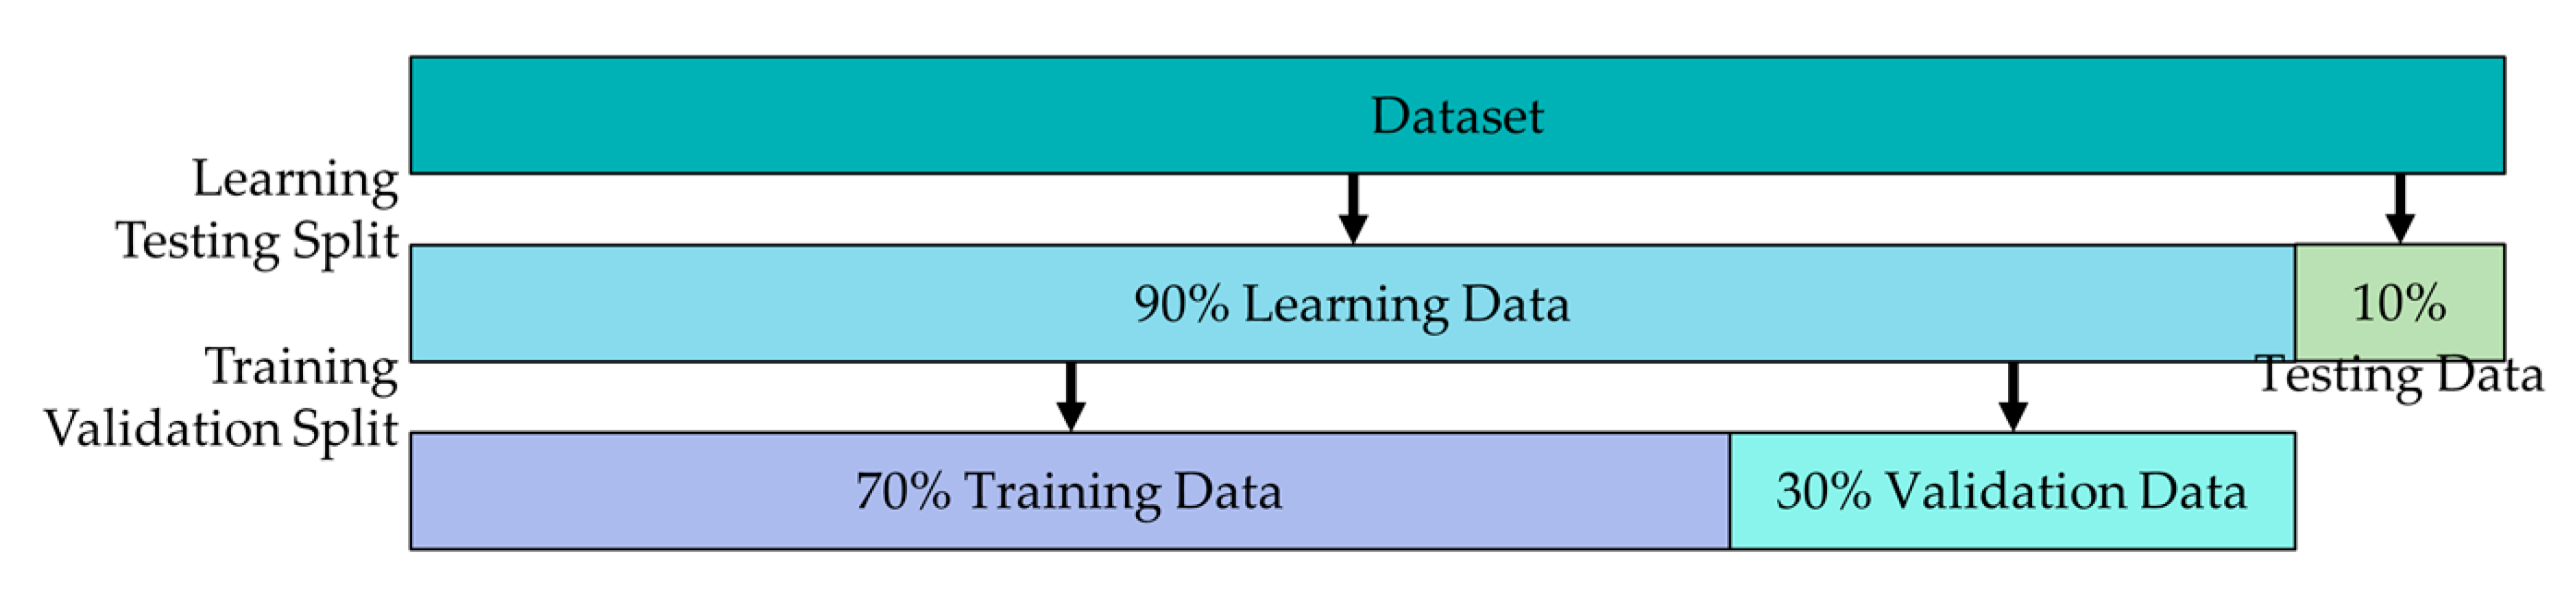
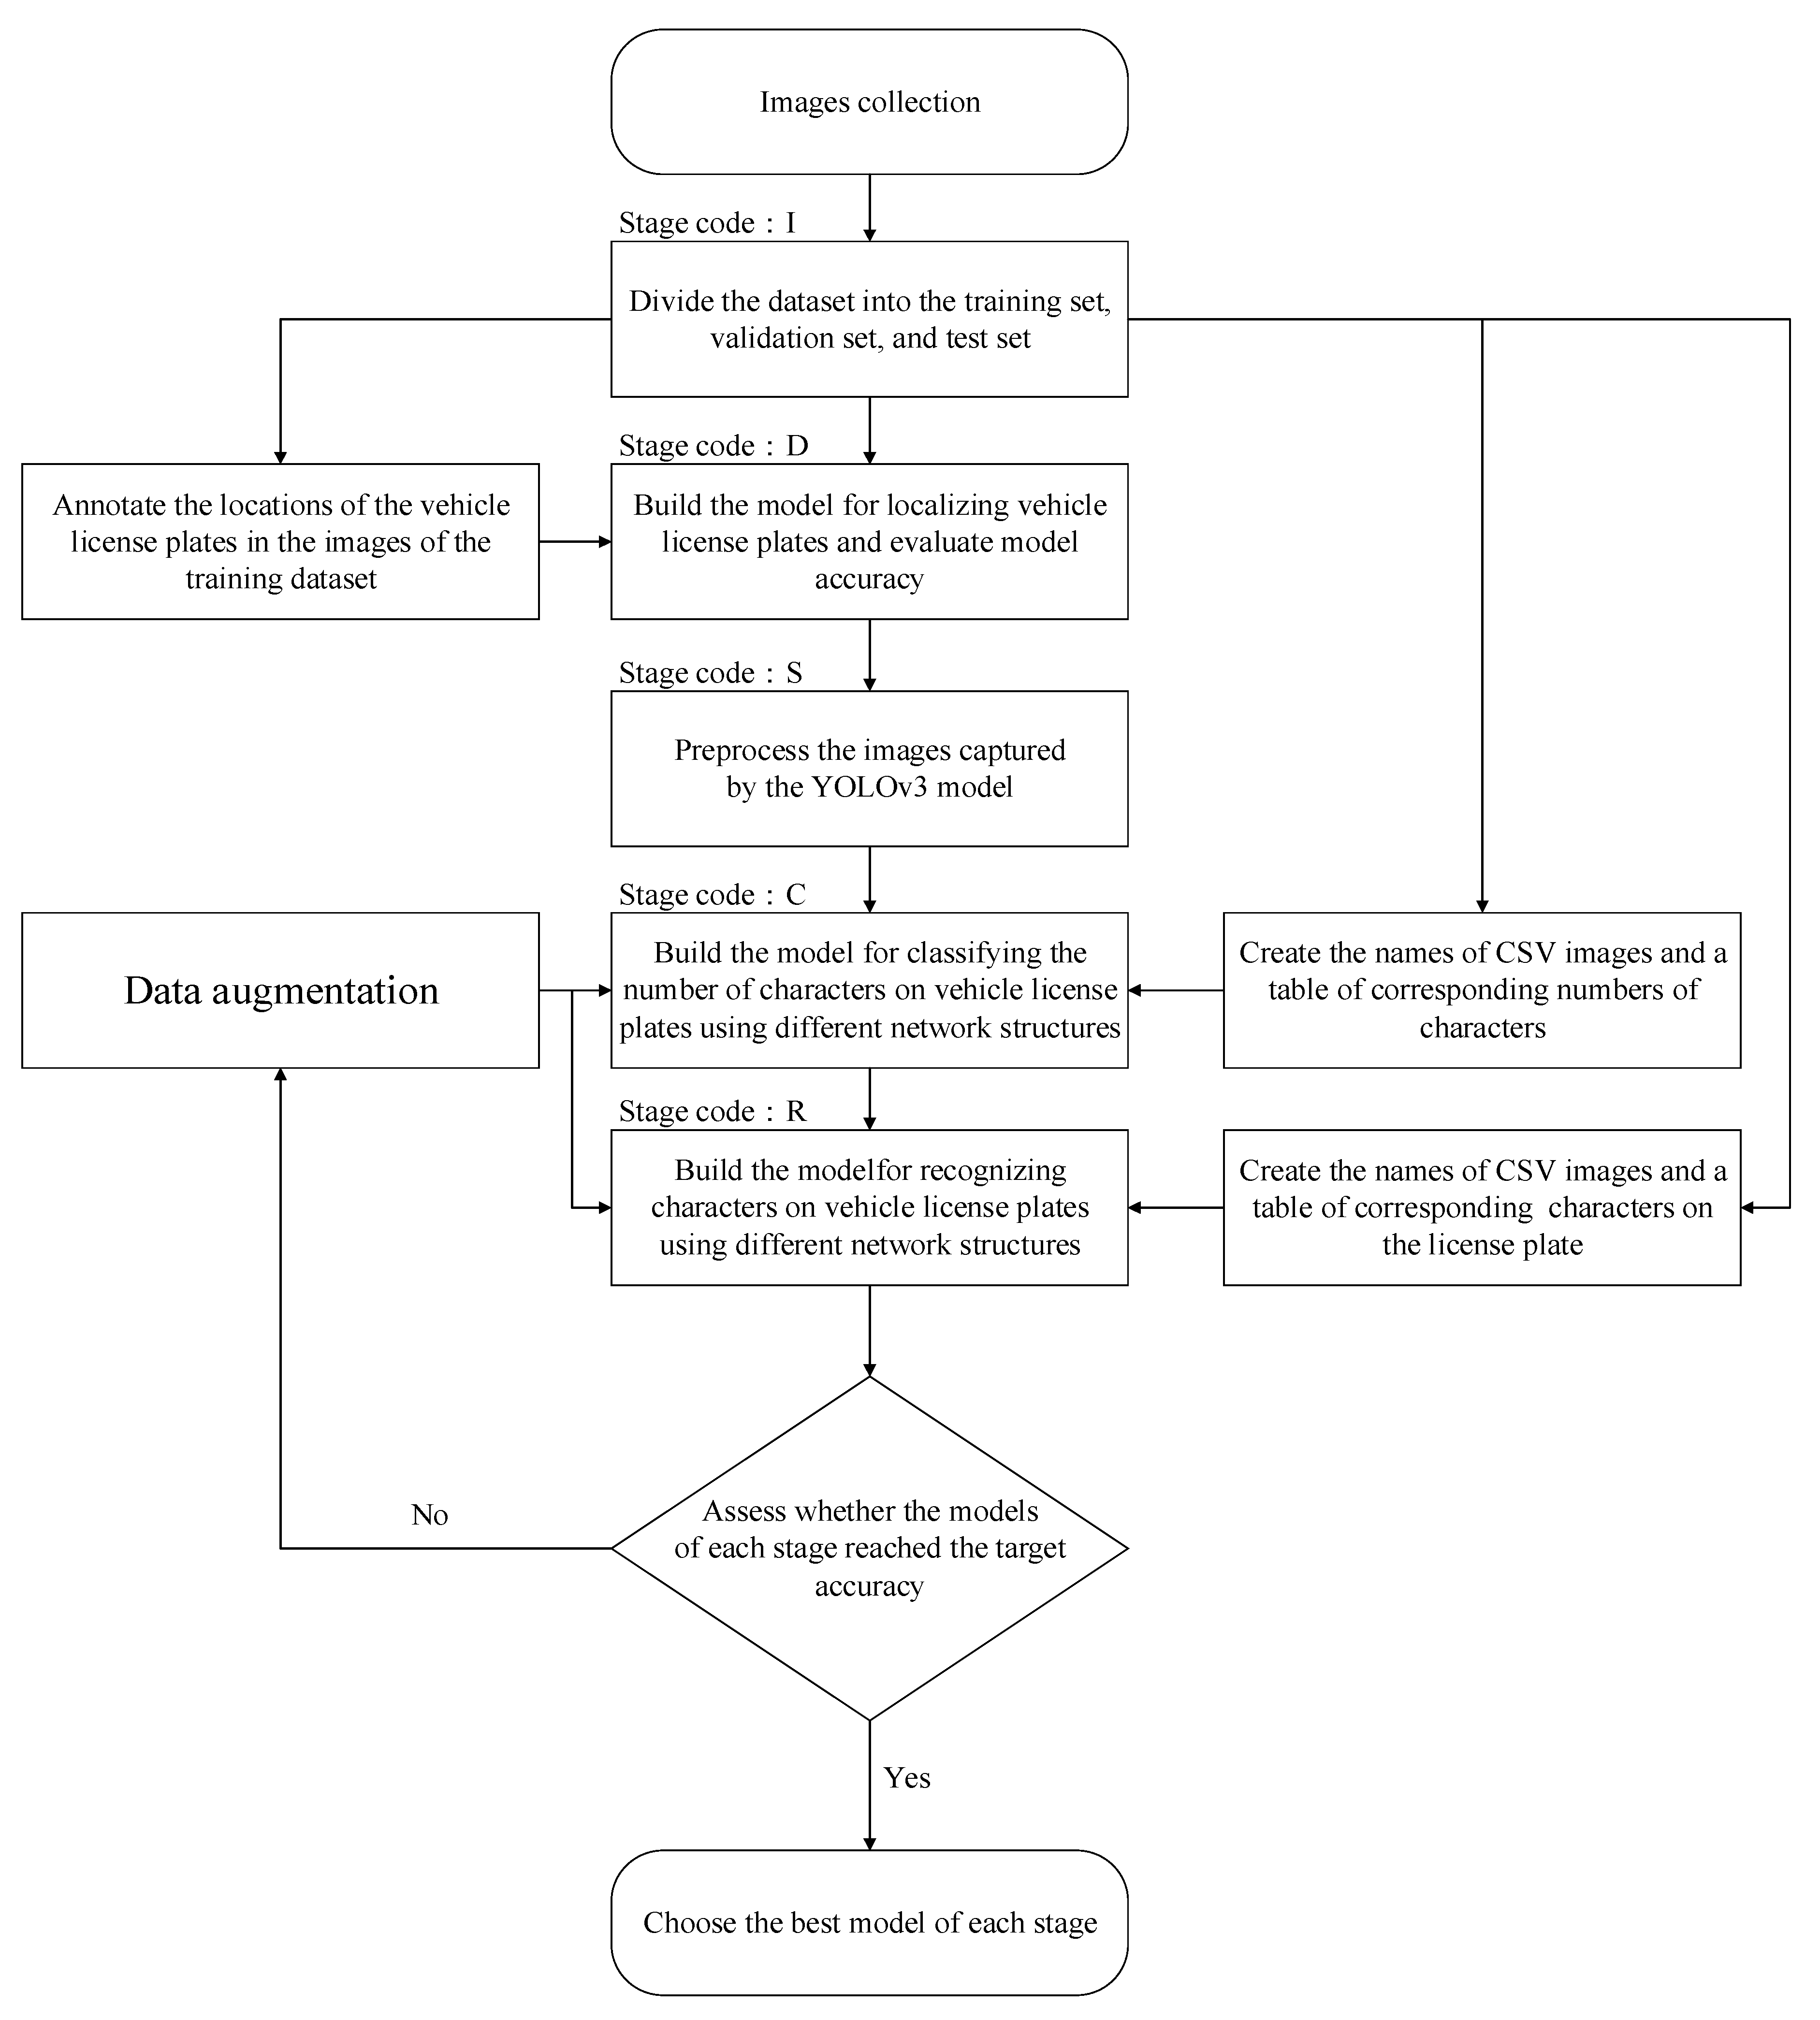
| Image dataset distribution | I | The 5419 images are divided into 90% learning data sets and 10% test data sets, and all image names are encoded. | Learning data: 4877 images Test data: 542 images |
| The stage of vehicle license plate localization | D | The 4877 images are divided into training and validation data according to the 70/30 rule. Use the LabelImg software to mark the plate location in every image. | Train data: 3414 images Validation data: 1463 images |
| Capture images and standardize their formats | S | Standardize the dimensions of the images of vehicle license plates captured from the YOLOv3 model to 45 × 85 pixels, and change their color into greyscale. | Learning data: 4877 images |
| The stage of classification of the number of characters | C | The 4877 images are divided into training and validation data according to the 70/30 rule. | Train data: 3414 images Validation data: 1463 images |
| The stage of character recognition | R | The data set is the same as the classification of the number of characters stage, without additional image data preprocessing. | Train data: 3414 images Validation data: 1463 images |
| Software and Hardware Equipment | Specification |
|---|---|
| CPU | INTEL Core i7-8700 3.2 GHz CPU |
| Motherboard | ASUS |
| GPU | NVIDIA GeForce RTX2080Ti-11G GDDR6 |
| RAM | 32 GB DDR4-2666 RAM |
| Application | CUDA version 10.1.120 |
| Platform | Windows 10 |
| Programming | Python |
| No. of Characters | 6 Characters | 7 Characters | 8 Characters | Total Images | |
|---|---|---|---|---|---|
| Dataset | |||||
| Learning Data | 3389 images | 240 images | 1248 images | 4877 images | |
| Training Data | 2372 images | 168 images | 874 images | 3414 images | |
| Validation Data | 1017 images | 72 images | 374 images | 1463 images | |
| Test Data | 387 images | 38 images | 117 images | 542 images | |
| Stage | The Stage of Vehicle License Plate Localization (D) | The Stage of Classification of the Number of Characters (C) | The Stage of Character Recognition (R) | |
|---|---|---|---|---|
| Model | ||||
| YOLOv3 | ✓ | - | - | |
| C-CNN-L3 | - | ✓ | - | |
| C-SRCS | - | ✓ | - | |
| C-VGG16 | - | ✓ | - | |
| R-CNN-L3 | - | - | ✓ | |
| R-SRCS | - | - | ✓ | |
| R-VGG16 | - | - | ✓ | |
| Parameter | Command | Range |
|---|---|---|
| Brightness | brightness_range | 0.3–1.3 |
| Rotation | rotation_range | 0–10 |
| Shift | width_shift_range | 0–0.1 |
| height_shift_range | 0–0.1 | |
| Zoom | zoom_range | 0–0.1 |
| Shear | shear_range | 0–0.1 |
| Rescale | rescale | 1/255 |
| Training Phase | ||||
| Model | Category | mAP | Loss Value | Speed (s/image) |
| YOLOv3 | 1 | 96.76 | 2.87 | 0.025 |
| Test Phase | ||||
| Model | Category | mAP | Loss Value | Speed (s/image) |
| YOLOv3 | 1 | 97.14 | 2.58 | 0.03 |
| Network Architecture | C-CNN-L3 | C-SRCS | C-VGG16 | |
|---|---|---|---|---|
| No. of Layers | ||||
| Input layer | Input (45 × 85 × 1) | Input (45 × 85 × 1) | Input (45 × 85 × 1) | |
| 1 | Convolutional (48@5 × 5) | Convolutional (32@3 × 3) | Convolutional (32@3 × 3) | |
| 2 | Max-pooling (2 × 2) | Convolutional (32@3 × 3) | Convolutional (32@3 × 3) | |
| 3 | Convolutional (64@5 × 5) | Batch Normalization | Max-pooling (2 × 2) | |
| 4 | Max-pooling (2 × 2) | Max-pooling (2 × 2) | Convolutional (64@3 × 3) | |
| 5 | Convolutional (128@5 × 5) | Dropout (0.5) | Convolutional (64@3 × 3) | |
| 6 | Max-pooling (2 × 2) | Convolutional (64@3 × 3) | Max-pooling (2 × 2) | |
| 7 | Dropout (0.5) | Convolutional (64@3 × 3) | Convolutional (128@3 × 3) | |
| 8 | Flatten | Batch Normalization | Convolutional (128@3 × 3) | |
| 9 | 2500 | Max-pooling (2 × 2) | Convolutional (128@3 × 3) | |
| 10 | – | Dropout (0.5) | Max-pooling (2 × 2) | |
| 11 | – | Convolutional (128@3 × 3) | Dropout (0.5) | |
| 12 | – | Convolutional (128@3 × 3) | Convolutional (512@3 × 3) | |
| 13 | – | Batch Normalization | Convolutional (512@3 × 3) | |
| 14 | – | Max-pooling (2 × 2) | Convolutional (512@3 × 3) | |
| 15 | – | Dropout (0.5) | Max-pooling (2 × 2) | |
| 16 | – | Convolutional (128@3 × 3) | Convolutional (512@3 × 3) | |
| 17 | – | Batch Normalization | Convolutional (512@3 × 3) | |
| 18 | – | Max-pooling (2 × 2) | Convolutional (512@3 × 3) | |
| 19 | – | Flatten | Max-pooling (2 × 2) | |
| 20 | – | Dropout (0.5) | Dropout (0.5) | |
| 21 | – | – | Flatten | |
| Output layer | Fully connected layer (3, Softmax) | |||
| Training Phase | |||
| Networks | Accuracy | ||
| Not using data augmentation (%) | Using data augmentation (%) | ||
| C-CNN-L3 | 79.56 | 99.70 | |
| C-SRCS | 79.63 | 98.68 | |
| C-VGG16 | 79.56 | 81.08 | |
| Test Phase | |||
| Performance | Accuracy (%) | Speed (s/image) | |
| Model | |||
| C-CNN-L3 | 99.90 | 0.0315 | |
| Parameter | Brightness | Zoom | Shear | Height Shift | Width Shift | Rescale | Rotation | Accuracy (%) | |
|---|---|---|---|---|---|---|---|---|---|
| No | |||||||||
| 1 | ✓ | ✓ | ✓ | ✓ | ✓ | ✓ | ✓ | 99.80 | |
| 2 | ✓ | ✓ | ✓ | ✓ | ✓ | ✓ | 99.80 | ||
| 3 | ✓ | ✓ | ✓ | ✓ | ✓ | ✓ | 99.90 | ||
| 4 | ✓ | ✓ | ✓ | ✓ | ✓ | ✓ | 99.80 | ||
| 5 | ✓ | ✓ | ✓ | ✓ | ✓ | ✓ | 99.80 | ||
| 6 | ✓ | ✓ | ✓ | ✓ | ✓ | ✓ | 99.70 | ||
| 7 | ✓ | ✓ | ✓ | ✓ | ✓ | ✓ | 81.28 | ||
| 8 | ✓ | ✓ | ✓ | ✓ | ✓ | ✓ | 99.79 | ||
| Networks | R-CNN-L3 | R-SRCS | R-VGG16 | |
|---|---|---|---|---|
| Number of Layers | ||||
| Input layer | Input (45 × 85 × 1) | Input (45 × 85 × 1) | Input (45 × 85 × 1) | |
| 1 | Convolutional (48@5 × 5) | Convolutional (32@3 × 3) | Convolutional (32@3 × 3) | |
| 2 | Max-pooling (2 × 2) | Convolutional (32@3 × 3) | Convolutional (32@3 × 3) | |
| 3 | Convolutional (64@5 × 5) | Batch Normalization | Max-pooling (2 × 2) | |
| 4 | Max-pooling (2 × 2) | Max-pooling (2 × 2) | Convolutional (64@3 × 3) | |
| 5 | Convolutional (128@5 × 5) | Dropout (0.5) | Convolutional (64@3 × 3) | |
| 6 | Max-pooling (2 × 2) | Convolutional (64@3 × 3) | Max-pooling (2 × 2) | |
| 7 | Dropout (0.5) | Convolutional (64@3 × 3) | Convolutional (128@3 × 3) | |
| 8 | Flatten | Batch Normalization | Convolutional (128@3 × 3) | |
| 9 | – | Max-pooling (2 × 2) | Convolutional (128@3 × 3) | |
| 10 | – | Dropout (0.5) | Max-pooling (2 × 2) | |
| 11 | – | Convolutional (128@3 × 3) | Dropout (0.5) | |
| 12 | – | Convolutional (128@3 × 3) | Convolutional (512@3 × 3) | |
| 13 | – | Batch Normalization | Convolutional (512@3 × 3) | |
| 14 | – | Max-pooling (2 × 2) | Convolutional (512@3 × 3) | |
| 15 | – | Dropout (0.5) | Max-pooling (2 × 2) | |
| 16 | – | Convolutional (128@3 × 3) | Convolutional (512@3 × 3) | |
| 17 | – | Batch Normalization | Convolutional (512@3 × 3) | |
| 18 | – | Max-pooling (2 × 2) | Convolutional (512@3 × 3) | |
| 19 | – | Flatten | Max-pooling (2 × 2) | |
| 20 | – | Dropout (0.5) | Dropout (0.5) | |
| 21 | – | – | Flatten | |
| Output layer | Fully connected layer (35, Softmax) | |||
| Fully connected layer (35, Softmax) | ||||
| Character No. | Single Character Recognition Rate | |||
|---|---|---|---|---|
| Networks | 6 Characters | 7 Characters | 8 Characters | |
| R-CNN-L3 | 96.34% | 98.23% | 96.97% | |
| R-SRCS | 77.80% | 82.78% | 79.65% | |
| R-VGG16 | 35.37% | 72.61% | 89.74% | |
| Character No. | 6 Characters | 7 Characters | 8 Characters | ||||
|---|---|---|---|---|---|---|---|
| No. of test image | 387 images | 38 images | 117 images | ||||
| Accuracy | Overall successful recognition rate | Single character recognition rate | Overall successful recognition rate | Single character recognition rate | Overall successful recognition rate | Single character recognition rate | |
| Model | |||||||
| CNN-L3 | 94.06% | 97.80% | 94.74% | 99.25% | 93.16% | 98.83% | |
| Speed | 0.0624 s | 0.0673 s | 0.0781 s | ||||
| Items | No. of Test Image | Overall Successful Recognition Rate (%) | Single Character Recognition Rate (%) | Speed (s/image) | |
|---|---|---|---|---|---|
| System | |||||
| TLPR system | 542 images | 93.73 | 97.59 | 0.3271 | |
| Article | Countries | Technique | Overall Successful Recognition Rate | Number of Characters |
|---|---|---|---|---|
| Segmentation-Free Vehicle License Plate Recognition Using CNN [53] | China | YOLOv2; RDNet | 99.34% | 7 characters (30-class characters) |
| A New Convolutional Architecture for Vietnamese Car Plate Recognition [56] | Vietnam | CNN-L3 | 97.84% | 7 characters (30-class characters) |
| A Hybrid KNN-SVM Model for Iranian License Plate Recognition [63] | Iran | KNN-SVM | 97.03% | 8 characters (22-class characters) |
| Artificial neural networks based vehicle license plate recognition [64] | Turkey | Canny edge; ROI; ANN | 95.36% | – |
| Deep Learning System for Automatic License Plate Detection and Recognition [48] | USA Taiwan | Canny edge; CNN | Caltech 94.8% AOLP 95.1% | – (37-class characters) |
| Automatic license plate recognition via sliding-window darknet-YOLO deep learning [40] | Taiwan | YOLO | 78% | 6 characters (36-class characters) |
| This study | Taiwan | YOLOv3; CNN-L3 | 93.79% | 6–8 characters (35-class characters) |
Publisher’s Note: MDPI stays neutral with regard to jurisdictional claims in published maps and institutional affiliations. |
© 2021 by the authors. Licensee MDPI, Basel, Switzerland. This article is an open access article distributed under the terms and conditions of the Creative Commons Attribution (CC BY) license (http://creativecommons.org/licenses/by/4.0/).
Share and Cite
Chou, J.-S.; Liu, C.-H. Automated Sensing System for Real-Time Recognition of Trucks in River Dredging Areas Using Computer Vision and Convolutional Deep Learning. Sensors 2021, 21, 555. https://doi.org/10.3390/s21020555
Chou J-S, Liu C-H. Automated Sensing System for Real-Time Recognition of Trucks in River Dredging Areas Using Computer Vision and Convolutional Deep Learning. Sensors. 2021; 21(2):555. https://doi.org/10.3390/s21020555
Chicago/Turabian StyleChou, Jui-Sheng, and Chia-Hsuan Liu. 2021. "Automated Sensing System for Real-Time Recognition of Trucks in River Dredging Areas Using Computer Vision and Convolutional Deep Learning" Sensors 21, no. 2: 555. https://doi.org/10.3390/s21020555